Redshifts in the Hubble Deep Field South 11affiliation: Based on observations made with the NASA/ESA Hubble Space Telescope, obtained at the Space Telescope Science Institute, which is operated by the Association of Universities for Research in Astronomy, Inc., under NASA contract NAS 5-26555. 22affiliation: Based on observations collected with the Very Large Telescope at the European Southern Observatory, Chile, as part of ESO programs 65.O-0674 and 69.A-0416
Abstract
We present a catalog of 97 spectroscopic redshifts of galaxies in the Hubble Deep Field South (HDFS) and its Flanking Fields (FFs). In the HDFS proper, we observed approximately half the galaxies brighter than (AB)=24 and obtained redshifts for 76% of them. Targets in our HDFS sample were pre-selected to be at based on photometric redshifts, while in the FFs a simple magnitude cut was used. The photometric redshift pre-selection in the HDFS resulted in a spectroscopic success rate that is significantly higher than in the FFs, where no pre-selection was applied. The RMS precision of our redshift measurements, determined from repeat observations, is =0.0003. We present the photometry and redshifts for the 97 objects for which we secured spectroscopic redshifts and describe the basic properties of this sample.
1 INTRODUCTION
Redshifts of distant galaxies are a fundamental tool in observational cosmology. Via Hubble’s law, redshifts tell us distances, and thereby let us calculate physical properties of distant objects, such as their sizes and luminosities. Moreover, redshifts allow us to compute lookback times, thus letting us use the telescope as a time machine by telling us the cosmic epoch at which we are observing the objects of interest.
The Hubble Deep Field South (HDFS; Williams et al. 2000) contains some of deepest and most extensive multi-wavelength imaging ever carried out in the southern hemisphere (Casertano et al. 2000, Labbé et al. 2003). However, while over 150 spectroscopic redshifts have been measured in the area of the northern Hubble Deep Field (Cohen et al. 1996; Steidel et al. 1996; Lowenthal et al. 1997), to date only a relatively small number of HDFS spectroscopic redshifts has been secured (46 redshifts, including work in preparation, of which 29 are at ; see Vanzella et al. 2002). In the present paper, we present a catalog of spectroscopic redshifts in the HDFS and its Flanking Fields which we obtained as part of our study of faint galaxies at moderate redshift, 0.5. To permit a study of the internal kinematics of these galaxies (G. Mallén-Ornelas & M. Sawicki, in preparation), we obtained moderately high dispersion spectrosopy, while to maximize our yield, we pre-selected HDFS spectroscopic targets (though not those in the FFs) by using photometric redshifts to exclude from the spectroscopic sample galaxies likely to be at . Because of this pre-selection procedure, our spectroscopic sample should not be regarded as unbiased and we encourage the reader to consider the possible implications of this pre-selection bias should they use our catalog in their work; with this caveat, we believe that the redshift catalog we present will prove useful in studies of galaxy formation and evolution, as well as other follow-up work on the HDFS.
Our photometry, photometric redshifts, and target selection procedures are described in §§ 2.1 and 2.2. The spectroscopic observations and reductions are described in §§ 2.3 and 2.4, respectively. A basic characterization of the resulting spectroscopic redshift sample is given in § 3. The relevant photometric and spectroscopic data are compiled in Table 1.
2 THE DATA
2.1 Photometry
Our photometric catalog was generated in a manner nearly identical to that produced for the northern Hubble Deep Field by Sawicki, Lin, & Yee (1997); the only significant difference was that while the earlier HDF-North work used the -band image for object detection, here we used the -band image. All object detection and photometry was carried out using the PPP image analysis software (Yee 1991) on the HDFS images which we obtained from the STScI website. Table 1 gives positions and photometry of all those objects for which we subsequently secured spectroscopic redshifts. Column 1 gives the object ID, while columns 2–6 give the celestial coordinates (derived from the world coordinate system embedded in the Version 1 images) as well as the pixel positions within the image (HDFS or FF) in which the object is located.
“optimal aperture magnitudes” were computed within “optimal apertures” whose sizes were optimized to give the highest S/N for each object based on its photometric curve of growth (see Yee 1991). These optimal aperture -band magnitudes were then corrected to account for the small amount of light outside of the optimal apertures by extrapolating the growth curves using aperture corrections based on the growth curves of bright reference stars. The resulting aperture corrected magnitudes are the -band “total” magnitudes of the objects. The -band total magnitudes were placed on the AB scale (Oke 1974) using the zero-points provided on the STScI HDFS website, and are listed in column 7 of Table 1. For HDFS objects, colors were computed with reference to the -band via “color aperture magnitudes”: For each object and bandpass, the “color aperture” used for computing colors was the smallest of (1) the object’s optimal aperture in that bandpass, (2) its optimal aperture in the -band, and (3) an aperture of 1.55 (39 pixels) diameter. Total magnitudes in , , and bands were then computed by scaling the -band total magnitudes using the colors computed within the color apertures; the , , and total magnitudes are listed in columns 8–10 of Table 1. No , , or magnitudes are given for objects in the FFs since these were only observed in the -band.
2.2 Target selection
In the HDFS proper, where multicolor data were available, we used photometric redshifts to help us efficiently select targets for spectroscopy. We derived photometric redshifts using the same technique as that used by Sawicki et al. (1997) in their study of the evolution of the galaxy luminosity function and history of cosmic star formation in the northern Hubble Deep Field. This photometric redshift technique identifies the most likely redshift of an object by comparing its observed , , , fluxes with model fluxes generated from a combination of empirical and model galaxy spectra (for a detailed description of this procedure see Sawicki et al. 1997). The resultant photometric redshifts of HDFS galaxies are listed in column 11 of Table 1.
Target selection was done so as to maximize the yield of objects with bright emission lines for our internal kinematics study of faint galaxies. Specifically, we required an emission line to be visible in our spectroscopic wavelength window, which usually meant that . In the HDFS proper, we gave highest priority in slit assignment to blue galaxies with 0.5 and (AB)24; we also gave preference to galaxies whose major axes were roughly perpendicular to the dispersion direction, such that slits could placed at or near the major axis of the galaxy. Once all possible targets meeting these criteria in a given mask were assigned slitlets, the remaining slitlets were allocated to objects that were redder, or fainter, but always with since for higher there would be no detectable emission lines in our wavelength range. In many cases, additional, serendipitous objects fell onto slitlets and were identified a posteriori during data reduction; if these objects yielded robust redshifts, they, too, were included in our catalog. Overall, however, our goal was to obtain moderate S/N emission-line spectra for our galaxy internal kinematics survey rather than to measure a large number of redshifts of faint objects. We observed 89 objects in the HDFS proper, and 104 objects in the Flanking Fields, including both targetted and serendipitous objects.
2.3 Spectroscopic observations
Spectroscopy was obtained at the VLT using the FORS2 spectrograph on the Kueyen (UT2) and Yepun (UT4) 8.2m telescopes. Observations were carried out in visitor mode over two observing runs — in 2000 July 27–30 (hereafter Run 1) and 2002 July 14–17 (hereafter Run 2). Each run was four half-nights long, although during Run 1 we lost one half-night to telescope fault. Atmospheric transparency was very good during both runs, with seeing ranging over 0.4–1.4 during Run 1 and 0.7–1.7 during Run 2.
The field of view of the FORS2 instrument in its standard resolution configuration is 6.86.8 in the MOS mode (Run 1) and 6.85.7 in the MXU mode (Run 2), and so is significantly larger than the 2.62.7 L-shaped footprint of the HDFS. Aligning FORS2 along the diagonal of the HDFS — with the dispersion direction approximately NE–SW — ensured that approximately half of the slitlets in each mask were available for HDFS targets with the remaining half going to objects in the Flanking Fields. We adopted this mask orientation whenever possible (9 out of 13 masks in Run 1, and all 4 masks in Run 2).
During Run 1 the MXU custom slit-mask mode was not yet available. We therefore had to use FORS2 in MOS mode, which consists of nineteen 22.5-long mechanically movable slitlets which can be reconfigured quickly during the night. Consequently, our observing strategy during Run 1 was to reconfigure the MOS slit masks throughout the night, excluding from new masks any objects which we deemed to have already accumulated sufficiently high S/N for our kinematics program, or which had no trace of emission lines detected in 1–2 hours of exposure time. Most masks had 9 slits on HDFS objects and 5–9 FF objects, plus 3 additional objects outside the HDFS or its Flanking Fields. Many objects were observed on more than one mask. Typical exposure times were 3600s or 4500s per mask and we observed a total of 13 masks. Total integration time was 14 hours.
During Run 2 we used the MXU custom slit-mask mode of FORS2, which resulted in a substantial multiplex gain, as we were able to observe 43–50 slitlets per mask, with 22–30 of those slits allocated to HDFS objects. For the purpose of our internal kinematics program, we aligned the MXU slits with the major axis of each galaxy whenever the galaxy shape could be discerned in the HST image. Because in the MXU mode slit masks had to be designed and manufactured more than a day ahead of the observations, our observing strategy was simply to include the fainter targets in multiple slit masks, while placing the brightest objects in only one mask each. We observed a total of four MXU slit masks; integration times were 1800–4200s per exposure, with 3600s being very much the norm. We made 20 exposures with a total integration time of 18.7 hours.
During Run 1 we used the GRIS_600R+24 grism and order separation filter GG435+81, with the standard resolution collimator. With 0.5-wide slits the resolution was R2460, or 120 km/s — sufficient to resolve the [O II]3727 doublet, which has a separation of 224 km/s between components. This allowed us to unambiguously secure spectroscopic redshifts even in those cases where only the [O II]3727 feature was present in our spectral range. During Run 2, we used grism GRIS_1400V+18 for two masks, and GRIS_1200R+93 with order separation filter GG435+81 on another two masks. We used custom-milled slit masks with 0.6 slitlets, which gave us spectral resolution R3500, or 85 km/s, which clearly resolved the [O II]3727 doublet.
2.4 Data reduction and determination of redshifts
Data reduction was done using IRAF111IRAF is distributed by the National Optical Astronomy Observatory, which is operated by the Association of Universities for Research in Astronomy, Inc., under cooperative agreement with the National Science Foundation.. In both Runs and 1 and 2, spectral frames were bias-subtracted, and were then excised into individual 2-D spectra for each slitlet. Wavelength solutions were derived using arc lamp lines for all objects and the spectra were re-sampled into wavelength-calibrated 2-D spectra using IRAF tasks IDENTIFY, FITCOORDS and TRANSFORM. The angled-slit spectra of Run 2 were rectified column-by-column using spectral arc lamp lines as part of this wavelength calibration and resampling procedure. Sky lines were subtracted from the wavelength-calibrated 2-D spectra using IRAF task BACKGROUND. Cosmic rays were removed following the procedure described in Ellison, Mallén-Ornelas, & Sawicki (2003). Finally, one-dimensional spectra were extracted for all objects. Redshifts were determined by simultaneously identifying spectral features in the one- and two-dimensional spectra.
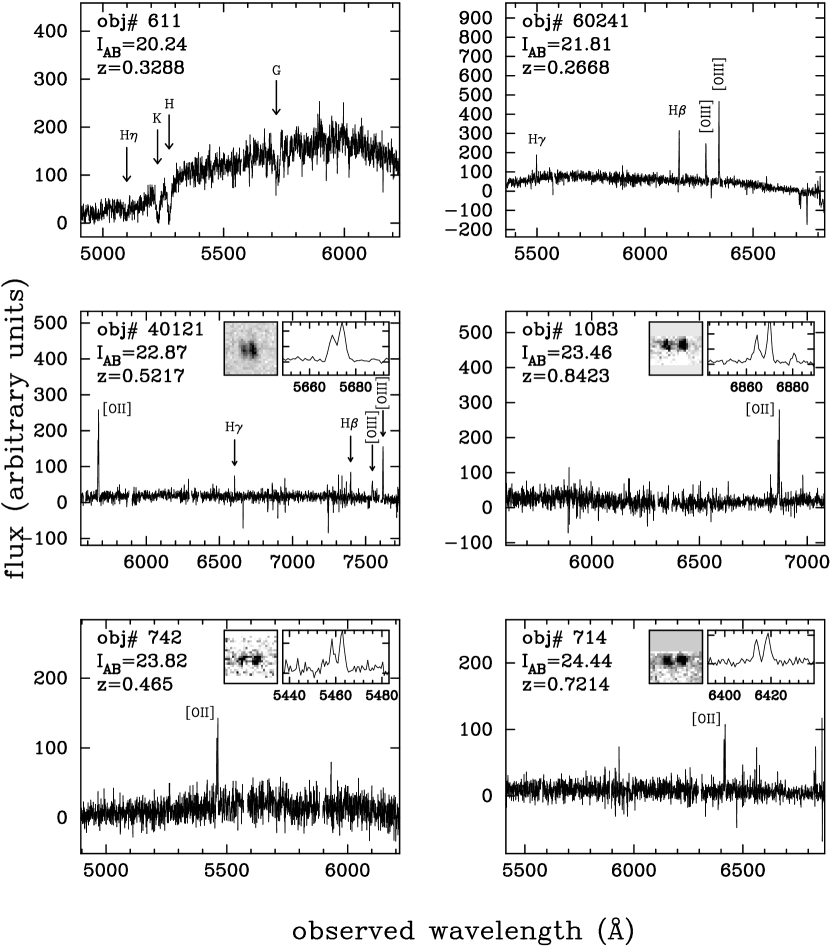
The primary redshift indicators were hydrogen, oxygen, and neon emission lines (see Table 1). In most cases where we were able to determine redshifts, it was either by identifying multiple emission lines, or by unambiguously resolving the [O II]3727 doublet. In a small number of objects only one emission line was clearly detected but we were able to ascertain its identity, and hence the object’s redshifts, through confirmation with absorption lines such as Ca II H and K, G-band, H, or H. Finally, in about half a dozen cases, no emission lines were detected, but we identified the objects’ redshifts from absorption lines alone. Columns 10 and 11 of Table 1 list the spectroscopic redshifts of our objects and the spectral features with which we identified their redshifts. Note that the list of spectral features is not meant to be an exhaustive list of the features that may be present in each spectrum, but rather an indication of the clear features used for each redshift identification.
For all the objects listed in Table 1, redshift identifications are robust in the sense that the spectral features used to identify redshifts are strong and unambiguous; we feel that there is little chance of catastrophic errors in the redshifts presented in Table 1. Typical uncertainty in redshift measurement, as determined by comparing the redshifts derived from different lines in the same spectra, is 0.0001 in redshift. A more robust estimate of the redshift uncertainty can be gained by comparing redshifts derived from repeated observations of the same objects; we observed 23 objects with at least two instrumental set-ups each and found the RMS scatter in redshift determination to be 0.0003. We adopt this latter figure as the representative uncertainty in the redshifts we present. Overall, we observed 193 objects in the HDFS and the Flanking Fields, including both targetted and serendipitous ones, and secured 97 redshifts (listed in Table 1) which we consider to be robust in the sense that they are unambiguously identified by either multiple spectral features or the resolved [O II]3727 doublet.
Finally, we note that a small number of objects that the PPP photometry package identified as separate galaxies in the HST images were blended in the images and spectroscopy we obtained from the ground. Since it is impossible to reliably assign the spectroscopic redshift to one or the other of the blended objects, we list the blended objects at a common redshift and identify them with asterisks in column 12 of Table 1.
3 Discussion and Summary
Our spectroscopic sample of galaxies is the largest such sample in the HDFS and its Flanking Fields. In the HDFS proper, we observed approximately half of all galaxies brighter than (AB)=24 (including both targetted and serendipitous objects) and were successful in obtaining redshifts for 76% of them; our spectroscopic redshift catalog accounts for about a third of all galaxies in the HDFS that are brighter than (AB)=24 (see left-hand panel of Fig. 1).
Figure 2 shows the color-magnitude diagram of all galaxies in the HDFS proper (small points) and illustrates the relationship of our spectroscopic sample to the underlying color-magnitude distribution. Large open circles identify objects which we observed spectroscopically, including both targetted and serendipitous ones. Large filled circles represent galaxies for which we were successful in securing redshifts. Not surprisingly, we are more successful at identifying redshifts for blue galaxies than red ones, a reflection of the fact that blue galaxies tend to be more strongly star-forming and consequently much more likely to have strong, easily identifiable emission lines.
Our overall success rate for redshift identification is substantially higher in the HDFS (52/89=58%) than in the Flanking Fields (44/105=43%). Moreover, as Figure 1 shows, the difference in success rates for faint galaxies is even larger: we secured redshifts for 21/49=43% of 23(AB)25 galaxies in the HDFS, while in the Flanking Fields the success rate for such faint galaxies was only 12/47=26% — i.e., the success rate is 1.7 times higher in the HDFS than in the Flanking Fields. The true success rate for targets pre-selected with photometric redshifts is likely to be even higher, since the HDFS target set contains a mixture of truly pre-selected galaxies and galaxies that have been observed because they were either allocated unused slits or serendipitously fell into slits already assigned to other targets. We regard the high success rate in the HDFS, as compared with the lower success rate in the FFs, as vindication of our approach of using photometric redshifts to efficiently pre-select candidates for spectroscopy. Pre-selection is particularly important for obtaining a high yield of intrinsically faint galaxies at , since many targets towards the faint end of our apparent magnitude limit will actually be luminous galaxies at with no detectable spectral features within our wavelength range.
Figure 5 shows a comparison between spectroscopic redshifts and our four-filter photometric redshifts in the HDFS; blended objects, as well as the one object with a very large photometric redshift (object # 1551) are omitted here, leaving us with a sample of 48 objects for this analysis. Panels (a) and (b) show a comparison between photometric and spectroscopic redshifts, and the redshift residuals as a function of spectroscopic redshift, respectively. Despite a few outliers, the agreement between photometric and spectroscopic redshifts is very good, as is confirmed by the histogram of the residuals, shown in panel (c). The RMS scatter in the residuals is =0.10, nearly identical to the scatter found by Sawicki et al. (1997) using the same photometric redshift technique in the northern HDF. We note, however, that the spectroscopic sample presented here does not allow for a truly blind test of photometric redshifts as it was pre-selected using photometric redshifts.
The observed redshift distribution in the HDFS and the FFs is shown in Figure 4. The large number of objects at =0.4–0.6 results from the combination of pre-selection of 0.5 galaxies in the HDFS, our tuning of the FORS2 spectral range towards detecting emission lines — especially [O II]3727 — at these redshifts, and the actual redshift distribution of galaxies with (AB)24. The observed redshift distribution shows strong clustering in redshift space. This is particularly evident in the =0.4–0.6 redshift interval, which contains enough galaxies to identify four or five distinct redshift spikes. Such clustering in redshift is common in pencil-beam surveys and has also been noted in the northern HDF (Cohen et al. 1996).
We summarize this paper as follows:
-
1.
The spectroscopic redshift catalog presented here is the largest redshift catalog available for the HDFS and its Flanking Fields; it contains 52 redshifts in the HDFS and 45 in the Flanking Fields.
-
2.
All redshifts presented here can be considered robust, since they have been identified using strong, unambiguous spectral features. The typical accuracy of these redshifts is =0.0003, as measured from repeat observations.
-
3.
We stress that the catalog is biased towards 0.5 galaxies, particularly so in the HDFS proper, where we used photometric redshifts to pre-select targets for spectroscopy.
The reader is encouraged to use this catalog for his/her purposes, but is cautioned to be mindful of the effects that the biases introduced by photometric redshift pre-selection and limited spectral range of our spectra may introduce into the analysis that is being pursued.
During part of this work, M. S. was supported by a fellowship from the Natural Sciences and Engineering Research Council (NSERC) of Canada and by NSF grant AST 96-18686. M. S. acknowledges support for visits to Chile from Proyecto Fondecyt de Incentivo a la Cooperación Internacional 2000 7000529. G. M.-O. is currently funded by a Clay Fellowship at the Smithsonian Astrophysical Observatory. G. M.-.O. acknowledges support from Fundación Andes and Proyecto Fondecyt Regular 2000 1000529 during part of this project. The authors thank the staff at Paranal Observatory for outstanding support and Bev Oke for help with some of the spectra.
References
- Casertano, S., et al. (2000) Casertano, S., et al. 2000, AJ, 120, 2747
- Cohen, J.G., et al. (1996) Cohen, J.G., Cowie, L.L., Hogg, D.W., Songaila, A., Blandford, R., Hu, E.M., Shopbell, P. ApJ, 475, L5
- Ellison, Mallén-Ornelas & Sawicki (2003) Ellison, S.L., Mallén-Ornelas, G., & Sawicki, M. 2003, ApJ, in press
- Labbé, et al. (2003) Labbé, I., et al. 2003, AJ, 125, 1107
- Lowenthal et al. (1997) Lowenthal, J.D., et al. 1997, ApJ, 481, 673
- Oke (1974) Oke, J.B. 1974, ApJS, 27, 21
- Sawicki et al. (1997) Sawicki, M.J., Lin, H., & Yee, H.K.C. 1997, AJ, 113, 1
- Steidel et al. (1996) Steidel, C.C., Giavalisco, M., Dickinson, M., & Adelberger, K.L. 1996, AJ, 112, 352
- Vanzella et al. (2002) Vanzella, E., Cristiani, S., Arnouts, S., Dennefeld, M., Fontana, A., Grazian, A., Nonino, M., Petitjean, P., Saracco, P. 2002, A&A, 396, 847
- Williams et al. (2000) Williams, R.E., et al. 2000, AJ, 120, 2735
- Yee et al. (1991) Yee, H.K.C. 1991, PASP, 103, 396


| ID | RA(2000)aaFrom the Version 1 images of the HDFS and the Flanking Fields | Dec(2000)aaFrom the Version 1 images of the HDFS and the Flanking Fields | Field | x(pix) | y(pix) | bbGroups of redshifts marked with asterisks indicated blended objects. | spectral features usedc,dc,dfootnotemark: | |||||
|---|---|---|---|---|---|---|---|---|---|---|---|---|
| 30438 | 22:33:18.698 | 60:34:37.16 | FF3 | 1415 | 1667 | 18.510.01 | … | … | … | … | 0.0990 | He5876 N6548 H N6583 |
| 1551 | 22:32:53.838 | 60:32:13.13 | HDFS | 2446 | 3592 | 23.790.01 | 23.990.01 | 24.220.01 | 25.060.03 | 1.85 | 0.1148 | O4959 O5007 H |
| 60429 | 22:32:56.822 | 60:36:47.80 | FF6 | 1537 | 1634 | 17.730.01 | … | … | … | … | 0.1182 | O4959 O5007 H H |
| 40329 | 22:33:20.584 | 60:33:39.52 | FF4 | 2637 | 1439 | 20.700.01 | … | … | … | … | 0.1186 | O4959 O5007 H |
| 30668 | 22:33:06.757 | 60:33:43.27 | FF3 | 3185 | 2751 | 20.130.01 | … | … | … | … | 0.1726 | O4959 O5007 H H |
| 583 | 22:33:05.878 | 60:33:43.33 | HDFS | 199 | 1348 | 21.730.01 | 22.100.01 | 22.670.01 | 23.560.04 | 0.20 | 0.2301 | O4959 O5007 H H |
| 60241 | 22:33:01.580 | 60:37:13.79 | FF6 | 833 | 1111 | 21.810.01 | … | … | … | … | 0.2668 | O4959 O5007 H H |
| 90549 | 22:32:54.810 | 60:37:47.75 | FF9 | 1687 | 2379 | 18.410.01 | … | … | … | … | 0.2668 | O4959 O5007 |
| 1664 | 22:32:50.802 | 60:31:59.70 | HDFS | 3011 | 3924 | 24.030.01 | 24.320.01 | 24.920.02 | 25.270.04 | 0.45 | 0.3187 | O3727 Ne3869 H |
| 611 | 22:33:05.772 | 60:33:41.45 | HDFS | 219 | 1395 | 20.240.01 | 21.080.01 | 22.600.02 | 24.310.04 | 0.40 | 0.3288 | H K G H |
| 30048 | 22:33:17.750 | 60:35:34.51 | FF3 | 1556 | 514 | 21.880.02 | … | … | … | … | 0.3442 | O4959 O5007 H |
| 1029 | 22:32:48.998 | 60:33:09.41 | HDFS | 3329 | 2172 | 24.300.01 | 24.700.01 | 25.580.03 | 26.040.08 | 0.40 | 0.3595 | O3727 |
| 80291 | 22:33:32.687 | 60:34:44.97 | FF8 | 3549 | 1229 | 20.030.01 | … | … | … | … | 0.3938 | H K G H |
| 50123 | 22:33:12.676 | 60:36:28.60 | FF5 | 748 | 732 | 22.610.03 | … | … | … | … | 0.3947 | O3727 O4959 O5007 H |
| 50649 | 22:32:59.700 | 60:34:47.08 | FF5 | 2670 | 2775 | 23.710.05 | … | … | … | … | 0.4049 | O3727 |
| 50681 | 22:32:59.625 | 60:34:36.88 | FF5 | 2681 | 2980 | 22.200.02 | … | … | … | … | 0.4052 | O3727 H H K |
| 20056 | 22:32:41.604 | 60:35:15.13 | FF2 | 2676 | 502 | 20.150.01 | … | … | … | … | 0.4055 | O3727 O5007 H H |
| 50100 | 22:33:02.409 | 60:36:32.06 | FF5 | 2269 | 664 | 23.680.04 | … | … | … | … | 0.4119 | Ne3869 H H H |
| 1381 | 22:33:00.237 | 60:32:34.03 | HDFS | 1257 | 3078 | 20.590.01 | 21.130.01 | 22.220.02 | 23.300.11 | 0.35 | 0.4147 | O3727 O5007 H H |
| 20085 | 22:32:44.006 | 60:35:10.60 | FF2 | 2320 | 593 | 21.690.02 | … | … | … | … | 0.4220 | O3727 |
| 20149 | 22:32:39.748 | 60:35:01.80 | FF2 | 2951 | 770 | 20.610.01 | … | … | … | … | 0.4222 | H K G |
| 30257 | 22:33:16.803 | 60:35:01.54 | FF3 | 1696 | 1177 | 24.590.07 | … | … | … | … | 0.4228 | O4959 O5007 H |
| 743 | 22:32:58.242 | 60:33:31.50 | HDFS | 1614 | 1633 | 22.010.01 | 22.450.01 | 23.330.03 | 24.110.04 | 0.35 | 0.4229 | O3727 |
| 20277 | 22:32:43.392 | 60:34:41.85 | FF2 | 2411 | 1171 | 21.730.01 | … | … | … | … | 0.4233* | O3727 H K G H |
| 20279 | 22:32:43.493 | 60:34:41.70 | FF2 | 2396 | 1174 | 20.090.01 | … | … | … | … | 0.4233* | O3727 H K G H |
| 20274 | 22:32:43.466 | 60:34:42.10 | FF2 | 2400 | 1166 | 21.670.01 | … | … | … | … | 0.4233* | O3727 H K G H |
| 100 | 22:32:50.955 | 60:34:15.39 | HDFS | 2952 | 520 | 23.970.01 | 24.510.01 | 25.450.03 | 26.140.08 | 0.45 | 0.4245 | O3727 |
| 501 | 22:32:57.881 | 60:33:49.13 | HDFS | 1677 | 1190 | 23.250.01 | 23.720.01 | 24.840.03 | 25.310.08 | 0.40 | 0.4280 | O3727 O5007 |
| 962 | 22:33:01.886 | 60:33:16.46 | HDFS | 943 | 2016 | 21.630.01 | 22.240.01 | 23.230.02 | 24.370.04 | 0.35 | 0.4284 | O3727 |
| 50190 | 22:33:11.325 | 60:36:17.43 | FF5 | 948 | 957 | 23.630.05 | … | … | … | … | 0.4334 | O3727 |
| 20462 | 22:32:45.678 | 60:34:18.17 | FF2 | 2072 | 1647 | 21.460.01 | … | … | … | … | 0.4608 | O3727 H |
| 20476 | 22:32:46.076 | 60:34:16.48 | FF2 | 2013 | 1681 | 21.280.01 | … | … | … | … | 0.4609 | O3727 H |
| 93 | 22:32:45.665 | 60:34:15.47 | HDFS | 3930 | 509 | 24.670.04 | 25.260.03 | 26.740.12 | 27.040.34 | 0.45 | 0.4621* | O3727 |
| 102 | 22:32:45.634 | 60:34:14.83 | HDFS | 3936 | 525 | 24.570.03 | 25.130.03 | 25.900.06 | 26.880.33 | 0.15 | 0.4621* | O3727 |
| 894 | 22:33:02.761 | 60:33:22.09 | HDFS | 780 | 1876 | 20.230.01 | 21.200.01 | 22.640.02 | 24.690.05 | 0.45 | 0.4642 | O3727 H |
| 1596 | 22:32:52.705 | 60:32:07.16 | HDFS | 2657 | 3740 | 21.640.01 | 22.090.01 | 22.840.02 | 23.300.03 | 0.45 | 0.4643 | O3727 |
| 631 | 22:32:59.416 | 60:33:39.54 | HDFS | 1395 | 1433 | 22.020.01 | 22.550.01 | 23.340.02 | 24.080.05 | 0.45 | 0.4644 | O3727 |
| 50481 | 22:32:58.080 | 60:35:24.68 | FF5 | 2910 | 2019 | 21.420.02 | … | … | … | … | 0.4645 | O3727 H |
| 50493 | 22:33:00.179 | 60:35:20.55 | FF5 | 2599 | 2102 | 24.230.08 | … | … | … | … | 0.4648 | O3727 O5007 H H |
| 50306 | 22:32:58.870 | 60:35:58.35 | FF5 | 2793 | 1342 | 23.840.05 | … | … | … | … | 0.4648 | O3727 |
| 50292 | 22:33:10.192 | 60:35:59.60 | FF5 | 1116 | 1316 | 20.980.01 | … | … | … | … | 0.4650 | O3727 |
| 742 | 22:33:04.269 | 60:33:31.87 | HDFS | 499 | 1633 | 23.820.01 | 24.410.01 | 25.410.03 | 26.370.12 | 0.45 | 0.4650 | O3727 |
| 224 | 22:32:55.247 | 60:34:07.58 | HDFS | 2160 | 723 | 22.980.01 | 23.390.01 | 24.050.01 | 24.470.05 | 0.50 | 0.4656 | O3727 Ne3869 H H |
| 10480 | 22:33:13.915 | 60:32:03.35 | FF1 | 932 | 1703 | 22.020.02 | … | … | … | … | 0.5006 | O3727 H |
| 1791 | 22:32:51.962 | 60:31:42.76 | HDFS | 2800 | 4351 | 24.040.02 | 24.610.01 | 25.450.04 | 26.160.24 | 0.50 | 0.5122 | O3727 |
| 1808 | 22:32:52.067 | 60:31:40.97 | HDFS | 2781 | 4396 | 22.750.01 | 23.320.01 | 24.230.02 | 24.490.04 | 0.50 | 0.5124 | O3727 |
| 1793 | 22:32:54.090 | 60:31:42.77 | HDFS | 2406 | 4354 | 22.710.01 | 23.500.01 | 24.470.02 | 25.360.05 | 0.55 | 0.5131 | O3727 |
| 1750 | 22:32:56.049 | 60:31:49.04 | HDFS | 2042 | 4200 | 21.440.42 | 22.130.01 | 22.980.01 | 24.040.04 | 0.25 | 0.5134 | O3727 O5007 H |
| 50055 | 22:33:09.230 | 60:36:39.95 | FF5 | 1259 | 505 | 23.930.02 | … | … | … | … | 0.5135 | O3727 |
| 1802 | 22:32:50.818 | 60:31:41.56 | HDFS | 3012 | 4379 | 23.710.01 | 24.290.01 | 25.060.03 | 25.380.07 | 0.55 | 0.5156 | O3727 |
| 1206 | 22:32:54.045 | 60:32:51.69 | HDFS | 2399 | 2625 | 22.020.02 | 22.570.01 | 23.380.02 | 23.850.03 | 0.50 | 0.5158 | O3727 H |
| 1471 | 22:32:56.156 | 60:32:21.53 | HDFS | 2015 | 3385 | 24.470.02 | 24.920.01 | 25.230.02 | 25.480.05 | 0.65 | 0.5186 | O3727 Ne3869 H |
| 1387 | 22:32:57.764 | 60:32:33.07 | HDFS | 1715 | 3098 | 21.980.01 | 22.690.01 | 23.590.01 | 24.170.04 | 0.55 | 0.5187 | O3727 H H H |
| 1511 | 22:32:55.534 | 60:32:17.51 | HDFS | 2131 | 3485 | 23.320.01 | 23.790.01 | 24.490.01 | 24.830.03 | 0.50 | 0.5190 | O3727 H |
| 1482 | 22:32:56.044 | 60:32:20.29 | HDFS | 2036 | 3416 | 22.740.01 | 23.230.01 | 23.840.01 | 24.340.03 | 0.55 | 0.5191 | O3727 |
| 30285 | 22:33:11.438 | 60:34:58.72 | FF3 | 2491 | 1234 | 22.430.02 | … | … | … | … | 0.5215 | O3727 |
| 40121 | 22:33:26.540 | 60:34:12.63 | FF4 | 1754 | 773 | 22.870.03 | … | … | … | … | 0.5217 | O3727 O4959 O5007 H H |
| 90730 | 22:32:45.782 | 60:36:55.35 | FF9 | 3023 | 3433 | 22.040.02 | … | … | … | … | 0.5271 | H K H H |
| 50221 | 22:33:07.722 | 60:36:12.10 | FF5 | 1482 | 1065 | 24.610.07 | … | … | … | … | 0.5275 | O3727 |
| 50139 | 22:33:11.765 | 60:36:26.07 | FF5 | 883 | 783 | 22.850.04 | … | … | … | … | 0.5282 | O3727 Ne3869 H |
| 111 | 22:32:56.083 | 60:34:14.21 | HDFS | 2004 | 558 | 22.030.02 | 22.610.01 | 23.250.03 | 23.760.04 | 0.55 | 0.5645 | O3727 H |
| 646 | 22:32:53.742 | 60:33:37.59 | HDFS | 2445 | 1473 | 21.470.01 | 22.040.01 | 22.770.02 | 23.360.03 | 0.50 | 0.5645 | O3727 H |
| 366 | 22:32:52.142 | 60:33:59.45 | HDFS | 2736 | 922 | 21.700.01 | 22.460.01 | 23.440.03 | 24.370.07 | 0.55 | 0.5646 | O3727 |
| 30446 | 22:33:05.886 | 60:34:35.84 | FF3 | 3314 | 1694 | 20.710.01 | … | … | … | … | 0.5647 | O3727 H K G |
| 1017 | 22:32:49.504 | 60:33:11.12 | HDFS | 3235 | 2130 | 22.980.01 | 23.560.01 | 24.350.01 | 24.880.04 | 0.55 | 0.5648 | O3727 |
| 698 | 22:32:55.736 | 60:33:33.97 | HDFS | 2077 | 1567 | 23.570.01 | 24.070.01 | 25.010.05 | 25.660.16 | 0.45 | 0.5649 | O3727 |
| 901 | 22:32:54.335 | 60:33:20.73 | HDFS | 2339 | 1897 | 23.820.01 | 24.310.01 | 24.910.02 | 25.280.06 | 0.55 | 0.5653* | O3727 |
| 909 | 22:32:54.266 | 60:33:20.04 | HDFS | 2352 | 1914 | 24.040.01 | 24.430.01 | 25.260.02 | 26.350.17 | 0.25 | 0.5653* | O3727 |
| 10345 | 22:33:06.983 | 60:32:21.34 | FF1 | 1961 | 1342 | 21.060.01 | … | … | … | … | 0.5656 | O3727 H K G H |
| 10353 | 22:33:07.313 | 60:32:20.59 | FF1 | 1912 | 1357 | 21.210.01 | … | … | … | … | 0.5656 | O3727 H K |
| 195 | 22:32:47.572 | 60:34:08.59 | HDFS | 3579 | 685 | 21.190.01 | 21.950.01 | 22.860.02 | 23.870.05 | 0.55 | 0.5790 | O3727 H K H H |
| 1283 | 22:32:50.905 | 60:32:43.03 | HDFS | 2982 | 2837 | 20.840.01 | 22.010.01 | 23.610.03 | 25.700.13 | 0.55 | 0.5797 | H K H |
| 70413 | 22:33:26.451 | 60:32:23.69 | FF7 | 3314 | 1697 | 21.680.01 | … | … | … | … | 0.5800 | H K G |
| 308 | 22:32:52.235 | 60:34:02.76 | HDFS | 2718 | 839 | 21.990.01 | 22.850.01 | 23.820.03 | 24.660.05 | 0.60 | 0.5804 | O3727 |
| 672 | 22:32:47.651 | 60:33:35.87 | HDFS | 3572 | 1506 | 19.490.01 | 20.480.01 | 21.640.01 | 23.360.03 | 0.35 | 0.5807 | O3727 |
| 1081 | 22:32:54.024 | 60:33:05.52 | HDFS | 2400 | 2278 | 22.650.01 | 23.690.01 | 25.060.02 | 26.170.08 | 0.65 | 0.5811 | O3727 H K |
| 1040 | 22:32:52.291 | 60:33:08.31 | HDFS | 2720 | 2205 | 21.080.01 | 21.760.01 | 22.580.02 | 23.480.03 | 0.50 | 0.5815 | O3727 |
| 938 | 22:32:55.863 | 60:33:17.71 | HDFS | 2057 | 1975 | 22.900.01 | 23.510.01 | 24.210.02 | 24.710.04 | 0.60 | 0.5817 | O3727 |
| 50321 | 22:33:01.314 | 60:35:56.45 | FF5 | 2431 | 1380 | 24.210.05 | … | … | … | … | 0.6131 | O3727 |
| 564 | 22:32:49.436 | 60:33:43.80 | HDFS | 3240 | 1310 | 24.210.01 | 24.970.01 | 25.970.05 | 26.350.08 | 0.60 | 0.6475* | O3727 |
| 572 | 22:32:49.318 | 60:33:43.11 | HDFS | 3262 | 1327 | 24.710.02 | 25.410.02 | 26.090.03 | 26.230.07 | 0.65 | 0.6475* | O3727 |
| 1561 | 22:32:55.714 | 60:32:11.50 | HDFS | 2099 | 3636 | 21.530.01 | 23.000.01 | 24.950.02 | 27.830.37 | 0.60 | 0.6721 | H K |
| 50492 | 22:32:59.963 | 60:35:21.54 | FF5 | 2631 | 2082 | 23.950.09 | … | … | … | … | 0.6744 | O3727 |
| 20581 | 22:32:36.221 | 60:33:59.87 | FF2 | 3474 | 2015 | 22.630.02 | … | … | … | … | 0.6898 | O3727 |
| 533 | 22:33:02.490 | 60:33:46.51 | HDFS | 825 | 1263 | 22.260.02 | 22.730.01 | 23.410.02 | 23.800.03 | 0.50 | 0.6949 | O3727 H |
| 50467 | 22:33:00.132 | 60:35:28.85 | FF5 | 2606 | 1935 | 21.400.02 | … | … | … | … | 0.6953 | O3727 |
| 50482 | 22:33:02.440 | 60:35:24.42 | FF5 | 2264 | 2024 | 21.220.01 | … | … | … | … | 0.6958 | O3727 |
| 1748 | 22:32:54.439 | 60:31:49.09 | HDFS | 2340 | 4196 | 24.980.02 | 25.660.02 | 26.120.04 | 26.850.10 | 0.70 | 0.6963 | O3727 |
| 30075 | 22:33:12.418 | 60:35:31.00 | FF3 | 2346 | 585 | 23.490.05 | … | … | … | … | 0.7207 | O3727 |
| 50506 | 22:32:59.929 | 60:35:17.66 | FF5 | 2636 | 2160 | 21.520.02 | … | … | … | … | 0.7208 | O3727 |
| 714 | 22:32:48.396 | 60:33:32.65 | HDFS | 3435 | 1588 | 24.440.01 | 24.920.01 | 25.310.02 | 25.580.04 | 0.65 | 0.7214 | O3727 |
| 412 | 22:32:48.249 | 60:33:55.04 | HDFS | 3457 | 1026 | 23.300.01 | 24.180.01 | 24.950.02 | 26.580.17 | 0.70 | 0.7218 | O3727 |
| 607 | 22:33:03.572 | 60:33:41.67 | HDFS | 626 | 1386 | 20.030.01 | 20.750.01 | 21.850.01 | 23.310.03 | 0.30 | 0.7342 | O3727 |
| 215 | 22:32:46.011 | 60:34:07.24 | HDFS | 3868 | 716 | 23.620.01 | 24.140.01 | 24.470.01 | 24.760.03 | 0.75 | 0.7533 | O3727 Ne3869 |
| 60715 | 22:32:48.393 | 60:35:31.93 | FF6 | 2785 | 3160 | 22.230.02 | … | … | … | … | 0.7542 | O3727 |
| 1550 | 22:32:55.755 | 60:32:13.54 | HDFS | 2091 | 3585 | 23.980.01 | 24.720.01 | 25.240.03 | 26.000.15 | 0.75 | 0.7594 | O3727 |
| 50032 | 22:33:09.595 | 60:36:42.78 | FF5 | 1205 | 448 | 23.350.05 | … | … | … | … | 0.7601* | O3727 |
| 50029 | 22:33:09.703 | 60:36:43.03 | FF5 | 1189 | 443 | 24.040.06 | … | … | … | … | 0.7601* | O3727 |
| 1379 | 22:32:57.989 | 60:32:34.32 | HDFS | 1673 | 3067 | 21.390.01 | 22.550.01 | 24.090.03 | 26.030.62 | 0.60 | 0.7606 | O3727 |
| 30412 | 22:33:14.333 | 60:34:41.05 | FF3 | 2062 | 1589 | 21.850.02 | … | … | … | … | 0.7643 | O3727 |
| 1083 | 22:32:57.245 | 60:33:05.61 | HDFS | 1804 | 2281 | 23.460.01 | 24.210.01 | 24.590.01 | 25.040.03 | 0.85 | 0.8423 | O3727 |
| 1218 | 22:32:45.784 | 60:32:50.50 | HDFS | 3928 | 2641 | 22.710.01 | 23.570.01 | 24.050.01 | 25.510.19 | 0.85 | 0.8525 | O3727 |
| 180 | 22:33:01.528 | 60:34:10.57 | HDFS | 997 | 657 | 23.710.01 | 24.700.01 | 25.150.02 | 25.750.06 | 1.00 | 0.8532 | O3727 |