Ground-based Observations of the Solar Sources of Space Weather (Invited Review)
Abstract
Monitoring of the Sun and its activity is a task of growing importance in the frame of space weather research and awareness. Major space weather disturbances at Earth have their origin in energetic outbursts from the Sun: solar flares, coronal mass ejections and associated solar energetic particles. In this review we discuss the importance and complementarity of ground-based and space-based observations for space weather studies. The main focus is drawn on ground-based observations in the visible range of the spectrum, in particular in the diagnostically manifold H spectral line, which enables us to detect and study solar flares, filaments (prominences), filament (prominence) eruptions, and Moreton waves. Existing H networks such as the GONG and the Global High-Resolution H Network are discussed. As an example of solar observations from space weather research to operations, we present the system of real-time detection of H flares and filaments established at Kanzelhöhe Observatory (KSO; Austria) in the frame of the space weather segment of the ESA Space Situational Awareness programme (swe.ssa.esa.int). An evaluation of the system, which is continuously running since July 2013 is provided, covering an evaluation period of almost 2.5 years. During this period, KSO provided 3020 hours of real-time H observations at the ESA SWE portal. In total, 824 H flares were detected and classified by the real-time detection system, including 174 events of H importance class 1 and larger. For the total sample of events, 95 % of the automatically determined flare peak times lie within 5 min of the values given in the official optical flares reports (by NOAA and KSO), and 76 % of the start times. The heliographic positions determined are better than 5∘. The probability of detection of flares of importance 1 or larger is 95 %, with a false alarm rate of 16 %. These numbers confirm the high potential of automatic flare detection and alerting from ground-based observatories.
1Institute of Physics/IGAM, University of Graz, Austria
2Kanzelhöhe Observatory for Solar and Environmental Research, University of Graz, Austria
1 Introduction
Space weather refers to variations in the space environment of our solar system driven by the Sun that can affect technologies in space and on Earth. The main sources of severe space weather disturbances are solar flares, coronal mass ejections (CMEs) and solar energetic particles (SEPs). CMEs are large-scale ejections of magnetized plasma from the Sun to interplanetary (IP) space with speeds of some hundred up to 3000 km s-1 (e.g. reviews by Forbes et al. 2006; Chen 2011; Webb & Howard 2012). Earth-directed CMEs with a strong negative component, i.e. oppositely directed to the Earth’s magnetic field, cause magnetic reconnection at the day-side magnetosphere. In this process, energy and particles from the solar plasma couple to the Earth magnetosphere, thus causing a geomagnetic storm and induced geo-electric fields. Flares are sudden enhancements of the solar radiation, most significantly at long (radio) and short (EUV, X-ray) wavelengths (e.g., reviews by Benz 2008; Fletcher et al. 2011). The enhanced EUV and X-ray radiation provides additional heating of the Earth’s outer atmosphere. As a result, the atmosphere expands, thus increasing the local density and the aerodynamic drag on satellites in low-Earth orbits. CMEs and flares are both capable of accelerating Solar Energetic Particles (SEPs). SEPs pose a severe hazard to astronauts in space due to their ionising radiation, and they may also disrupt technological systems and electronics on-board satellites (see, e.g., Bothmer & Daglis (2007), Schwenn (2006) and Pulkkinen (2007)).
A variety of measures and actions are currently undertaken to assess the risks and to ultimately prevent us from severe effects of strong space weather events, see e.g. ESA’s Space Situational Awareness (SSA) Programme and the U.S. National Space Weather Strategy and National Space Weather Action Plan documents released in October 2015111www.swpc.noaa.gov/news/national-space-weather-strategy-and-action-plan-released. Since the ultimate origin of space weather disturbances is our Sun, it is important to better understand the physics of these processes and to continuously monitor the Sun and its activity. In this review, we discuss the observations of the Sun relevant to space weather. The focus lies on the observations of solar flares and eruptions from ground-based observatories, with special emphasis on the diagnostics potential of the H spectral line. As an example, we present the real-time detection system of solar flares and filaments at Kanzelhöhe Observatory, which was recently established in the frame of the space weather segment of ESA’s SSA programme.
2 Solar observations for space weather: ground-based versus space-based
2.1 Solar key observations for space weather research and monitoring
Key observations of the Sun with respect to space weather include the solar magnetic field, which is the ultimate source of all space weather events, together with data capturing the dynamics of the solar corona, chromosphere and photosphere. The vast amount of energy that is impulsively released in flares and CMEs is originally stored in the kilo-gauss fields of sunspots. Turbulent plasma motions in the convection zone and photosphere shear and twist the coronal magnetic field, thus building up electric currents in the corona (e.g. reviews by Priest & Forbes 2002; Wiegelmann et al. 2014). The free energy stored in these currents may eventually be released, triggered by some instability. Whereas the energy build-up occurs gradually over days to weeks, the energy release via flares and CMEs occurs impulsively, i.e. on the order of minutes to hours. Full-disk magnetic field measurements of the Sun are performed by several ground-based observatories. However, the most regular observations are currently provided by the Helioseismic Magnetic Imager (HMI) onboard the Solar Dynamics Observatory (SDO), with a cadence of 1 min for the line-of-sight (LOS) component and 12 min for the full-vector field at a spatial resolution of about 1 arcsec.
Due to its high temperature, the solar corona emits predominantly at soft X-ray (SXR) and Extreme Ultraviolet (EUV) wavelengths. Since the emission at these wavelengths is absorbed by the Earth’s atmosphere, the coronal dynamics and evolution of solar flares can only be observed by space-based EUV or SXR telescopes. Currently, regular high-cadence observations of the full Sun in the EUV are performed by the Atmospheric Imaging Assembly (AIA) onboard SDO and the SWAP instrument onboard Proba2. Observations of the propagation of CMEs up to some ten solar radii through the corona, which are necessary in order to estimate their initial speed and direction of motion close to the Sun, is also restricted to observations from space. Coronagraphs block the direct emission from the solar photosphere in order to measure the faint emission that is Thomson-scattered at free electrons in the highly ionized corona. Currently, the Large Angle and Spectrometric Coronagraph (LASCO) on-board the Solar and Heliospheric Observatory (SOHO) provides regular observations of CMEs from the Sun-Earth line. In addition, STEREO-A (and the recently lost STEREO-B) COR1 and COR2 coronagraphs observe CMEs from varying positions away from the Sun-Earth line, providing us with an alternative vantage point to observe CMEs and to reconstruct their 3D evolution. The propagation of CMEs in IP space up to the distance of Earth and beyond is tracked by the wide-field cameras of the Heliospheric Imagers (HI) onboard the STEREO spacecraft.
In contrast to the solar corona, the solar chromosphere can be well observed by Earth-based observatories, especially in strong Fraunhofer absorption lines in the visible wavelength domain.222 The other important spectral window accessible from ground in addition to the visible part of the spectrum is the radio domain. Radio heliographs and radio spectrographs provide an important means for diagnosing, e.g., flare-accelerated high-energy electrons escaping along open field lines to IP space (type III burst) and outward moving shock waves produced by fast CMEs (type II bursts). In this review we concentrate on ground-based observations in the visible light. For reviews on solar radio physics and its relation to space weather we refer the interested reader to Gary & Keller (2004); Pick (2006); Pick & Vilmer (2008). Examples include the H line (656.28 nm) of the neutral hydrogen atom and the Ca ii H (396.85 nm) and K (393.37 nm) lines of ionised calcium. The H line has been the main spectral window for regular observations of solar flares since the 1950s, in particular during and in the follow-up of the International Geophysical Year (IGY) in 1957. The first flare classification scheme introduced and still in use in parallel to the GOES soft X-ray classification is the H importance scheme. It is based on the area and the brightness of solar flares in the H spectral line (Zirin 1988). The importance classes ranging from the smallest to the largest events are subflares, flares of importance 1, 2, 3, and 4. This importance class is complemented by a character signifying the H line center brightness enhancement of the event as f(aint), n(ormal) or b(rilliant).
In addition to the observations of the chromospheric dynamics of solar flares, H data provide also insight into the activation and eruption of solar prominences (filaments), which are often associated with coronal mass ejection (e.g., Gopalswamy et al. 2003; Bein et al. 2012). Prominences are thought to outline the inner part of a magnetic flux rope, where the cool prominence material, suspended in the corona, is balanced by the upward directed Lorentz force in the dips of the helical flux rope. During the CME lift-off, the prominence may become visible as the core of the three-part CME structure (Illing & Hundhausen 1985) in the coronagraph images. In addition, H image sequences may also reveal the motion of Moreton waves. Moreton waves are the chromospheric ground-track of fast-mode MHD shock waves that propagate through the solar corona, most likely initiated by the impulsive initial expansion of a CME. The pressure gradient at the coronal shock front compresses and pushes the chromospheric plasma downward, which becomes visible as a bright propagating arc in the center of the H line (see, e.g., reviews by Vršnak & Cliver 2008; Warmuth 2015). Due to the LOS motion of the chromospheric plasma of the order of 10 km s-1, Moreton waves are best visible in the wings of the H spectral line.
2.2 Ground-based versus space-based
Solar observations for space weather research and monitoring have to cover the full solar disk and to be performed with high cadence (say 1 min) in order to capture the dynamics of the events. The requirements on spatial resolution are moderate, in the order of 3′′. In addition, the observations have to be available in almost real-time.
The main cons of ground-based observations against space-based observations are the following:
-
•
atmospheric issues: weather and seeing negatively influence the availability of the observations as well as the quality of the images;
-
•
day-night cycle, i.e. at each individual ground-based station the observation time is limited;
-
•
few wavelength windows are accessible from ground: visible, radio, near IR.
However, there are also a number of pros for ground-based observations compared to space-based observations:
-
•
relatively “simple" and inexpensive observing systems are needed;
-
•
flexibility in changing and upgrading the system (filters, hardware, etc.);
-
•
several strong Fraunhofer lines are available in the visible range with good diagnostics potential for flares and solar eruptions;
-
•
no telemetry constraints, thus high-cadence observations and analysis can be easily performed;
-
•
no telemetry delays, thus the data are accessible in real-time;
-
•
networks of observatories can overcome the limitations in observing time of individual sites.
2.3 Networks for ground-based solar monitoring
The first network for the observation of the Sun with respect to its activity and space weather effects was actually established in the early 1940s during WW II by Karl-Otto Kiepenheuer under the authority of the “Deutsche Luftwaffe” (German Airforce). In the 1930s it was discovered that the state of the Earth’s ionosphere and thus the propagation characteristics of radio waves is affected by the activity of the Sun (Dellinger 1935). During WW II, short-wave radio transmission was an important means of communication and navigation, in particular for the airforce and the marine. Thus, the German Airforce founded a network of observatories in the Alps in order to regularly monitor the Sun and to quantify its activity. The goal was to inform the German Airforce in case of ionospheric disturbances and to provide forecasts of such disturbances. The network consisted of three stations in Germany (Zugspitze, Schauinsland and Wendelstein) and Kanzelhöhe Observatory in Austria (Seiler 2007; Jungmeier 2014).
A great leap forward for the observations and studies of solar-terrestrial relations was the International Geophysical Year (IGY) 1957–1958. In the context of the IGY, a world-wide network of ground-based observatories was established to observe solar H flares. Since the end of the year 1955, data from a variety of geophysical and solar observatories worldwide were compiled in the Solar-Geophysical Data (SGD) bulletins (until the year 2009). Current ground-based networks of observatories to monitor solar activity are the Global High-Resolution H Network led by the New Jersey Institute of Technology (formerly by Big Bear Observatory; Steinegger et al. 2000) and the H observations by the NSO Global Oscillation Network Group (GONG; Hill et al. 1994).
The GONG network was established in order to study the solar interior by the means of helioseismology. The network consists of six observing sites around the world, well distributed in longitude in order to basically cover 24 hours of observations per day (Hill et al. 1994). The sites are: High Altitude Observatory at Mauna Loa (Hawaii, USA; W156∘), Big Bear Solar Observatory (California, USA; W117∘), Cerro Tololo Interamerican Observatory (Chile; W71∘), Observatorio del Teide (Canary Islands, Spain; W17∘), Udaipur Solar Observatory (India; E74∘) and Learmonth Solar Observatory (Australia; E114∘). The GONG observations began in the year 1994 and the network is able to provide solar observations for 96 % of the time. In the year 2010, the GONG network stations were complemented by H telescopes (Harvey et al. 2011). The H system is an add-on to the normal GONG helioseismology instrument. A beamsplitter sends 656 nm light to a mica etalon filter with a full-width at half-maximum (FWHM) of 0.04 nm. The H images are recorded by a CCD with 20482048 pixels. Automatic exposure control is in place that maintains the quiet center of the solar disk at 20 % of the full dynamic range available in order to avoid saturation during flares. H images are collected once a minute, immediately corrected for flat field and dark current, and sent to a central archive where they are available in quasi real-time (halpha.nso.edu).
The Global High-Resolution H Network (GHN) utilizes already existing facilities at nine observatories around the world, that have each good seeing conditions, a high coverage of sunny days over the year and adequate observing staff. In contrast to the GONG network, the H instruments of the GHN stations are not identical. The nine stations of the GHN are: Big Bear Solar Observatory (California, USA; W117∘), Catania Astrophysical Observatory (Italy; E15∘), Kanzelhöhe Observatory (Austria; E14∘), Uccle Solar Equatorial Table (Belgium; E4∘), Observatory de Paris-Meudon (France; E2∘), Observatoire Midi-Pyrénées (France; E0∘), Yunnan Solar Observatory (China; E103∘), and Huairou Solar Observing Station (China; E117∘). The sizes of the GHN H images are between 10241024 and 20482048 pixels, and the observing cadence at each site is at least one image per minute. The goal of the GHN network is to cover the night gap in order to provide data for filament eruption detection, solar rotation measurements and flare prediction algorithms (Steinegger et al. 2000, 2001). The data of the individual stations is collected at the Space Weather Research Lab of the New Jersey Institute of Technology (swrl.njit.edu/ghn_web).
3 Real-time flare and filament detection at Kanzelhöhe Observatory
In this section we describe the automatic system of real-time detection of solar flares and filaments that was developed and implemented in 2012/2013 at Kanzelhöhe Observatory. This activity is part of the space weather segment of ESA’s SSA programme, and aims at monitoring and automatic detection of the solar sources of space weather events (flares, filament eruptions) in quasi real-time using ground-based H imagery. In addition, we provide a preliminary assessment of the results of this system since its establishment, covering a period of 29 months from 7/2013 to 11/2015. A detailed description of the overall system, its implementation and an evaluation of its first 5 months running in real-time is given in Pötzi et al. (2015).
3.1 KSO instrumentation and observations
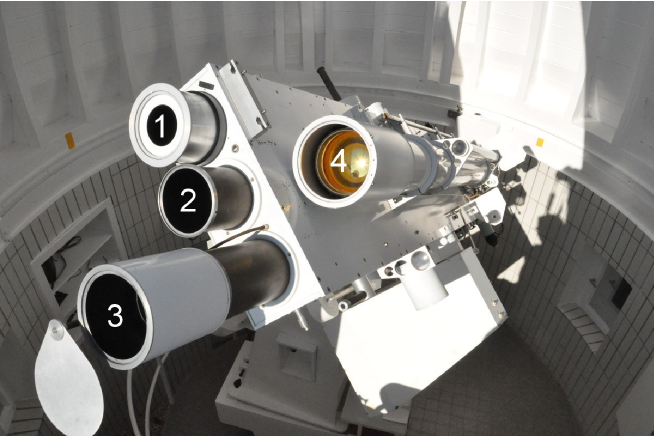
Kanzelhöhe Observatory for Solar and Environmental Research (KSO; kso.ac.at; N 46∘40.7′, 13∘54.1′, altitude 1526 m) of the University of Graz (Austria) regularly performs high-cadence full-disk observations of the Sun in the H spectral line (Otruba & Pötzi 2003), the Ca ii K spectral line (Hirtenfellner-Polanec et al. 2011), and in white-light (Otruba et al. 2008) with a coverage of about 300 observing days a year. All telescopes are mounted onto the KSO surveillance telescope (Figure 1), and the data are publicly available via the online KSO data archive at cesar.kso.ac.at (Pötzi et al. 2013).
The KSO H telescope is a refractor with an aperture ratio number of and a Lyot band-pass filter centered at the H spectral line with a FWHM of 0.07 nm. The H images are recorded by a CCD of 2048 2048 pixels (12-bit dynamic range) with a spatial resolution of about 1′′ and a cadence of 6 s. A frame rate of seven images per second permits the application of frame selection in order to profit from moments of good seeing conditions. An automatic exposure control system is in use in order to avoid saturation effects in strong flares.
3.2 The KSO H real-time flare and filament detection system
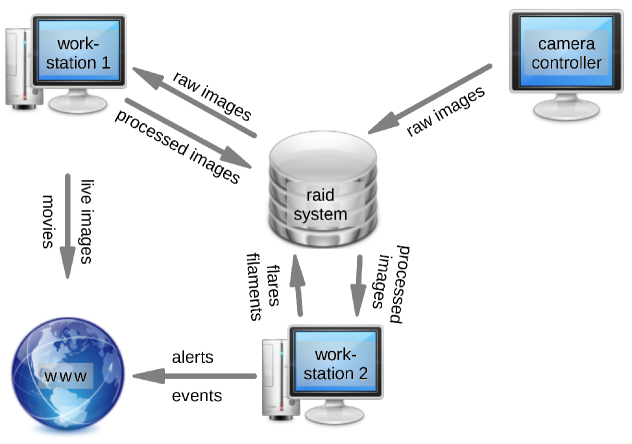
To optimize the process and speed of the real-time data provision as well as the automatic flare and filament detection, different computers are connected to the KSO H observing system that run in parallel, each one performing a specific set of tasks: i) the camera computer is responsible for image acquisition, ii) workstation 1 performs the quality check of the incoming images, the data reduction and online data provision, iii) workstation 2 performs the image recognition including the automatic flare detection, filament detection and event alerting (see Figure 2).
Each H image is grabbed by the camera computer and sent to workstation 1, where the image is checked for its quality. The quality test is based on three main parameters, the accuracy of solar radius detection, the large-scale intensity distribution and the image sharpness. If an image passes the quality criterion, it is processed and published on the web server. In parallel, the processed image is also transferred to workstation 2, on which the image recognition algorithm is performed. If an event is detected, its characteristic parameters are calculated. In case that the event exceeds a certain threshold (i.e. flare area/importance class), a flare alert is published online at ESA’s SSA SWE portal and an alert e-mail is sent out.
3.2.1 Provision of real-time images and movies on the ESA SSA SWE portal
Each minute an image is selected for the real-time H display at ESA’s SSA SWE portal (swe.ssa.esa.int/web/guest/kso-federated). The size of the image is reduced to 10241024 pixels and stored in jpeg format for fast and easy display. The image is overlaid with a solar coordinate grid and annotated with a header containing the time information. In addition, the H images recorded during the latest hour of observations are animated via an html movie at the SWE portal. For later validation, a log file that keeps track of the image acquisition time and the time when the image was provided online is updated for each image.
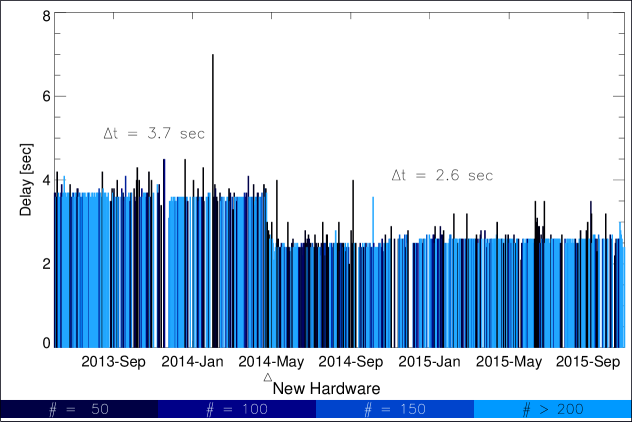
The online data provision for the ESA SSA SWE portal worked almost without any interruptions, only 55 out of a total of 181.221 images during the period July 2013 to November 2015 did not appear on the portal, corresponding to 0.03%. In Figure 3 we show for each day the mean time delay between the capture of an image and its online provision at the portal. At the beginning this delay was about 3.8 s, and then improved even further to 2.6 s thanks to a hardware upgrade.
3.2.2 Real-time flare detection and alerting
Many of the iterative algorithms of the image recognition are computationally intensive. However, they can be easily parallelized and thus one can efficiently utilize the computational power of modern graphic processing units (GPU). The image recognition algorithm has been implemented in C++ and installed on a dedicated machine with a high-performance GPU. The system benefits from the large number of processing units which are used for the highly parallelized computations. The algorithm needs less than 10 s to process the flare and filament recognition on one pixel image, which allows event detection in near real-time. The results of the image recognition algorithm are stored in log files containing tables of the flares and filaments detected. The log files are updated with each new image that enters the processing pipeline, and are then used us to derive the evolution of the detected features. Detailed descriptions of the image algorithms developed and their implementation at the KSO H observing system are given in Riegler et al. (2013); Riegler (2013); Pötzi et al. (2015).
For the detection of flares and filaments in the KSO real-time data, a segmentation of every H image into four classes is conducted, namely the classes filament, flare, sunspot and background. The main characteristics used in the image segmentation is the intensity and the shape of the objects. The image recognition algorithm developed consists of four main building blocks. (i) The preprocessing handles the different intensity distributions, large-scale inhomogeneities and noise with the two goals of image normalization and feature enhancement. (ii) The feature selection step defines the characteristic attributes of the features of interest, i.e. flares and filaments, and how to model them. The data used for feature extraction and learning of the model were derived from a set of KSO H images, where an expert labeled the different classes. (iii) In the multi-label segmentation step, the model derived is applied to the real-time images. (iv) In the postprocessing, every object that was identified gets a unique ID assigned. This allows us to track the detected features in the H image sequence, and to compute the evolution of flares, filaments and filament eruptions. The segmentation results are then used to derive characteristic properties of the objects identified, which are needed for the subsequent classification of the events.
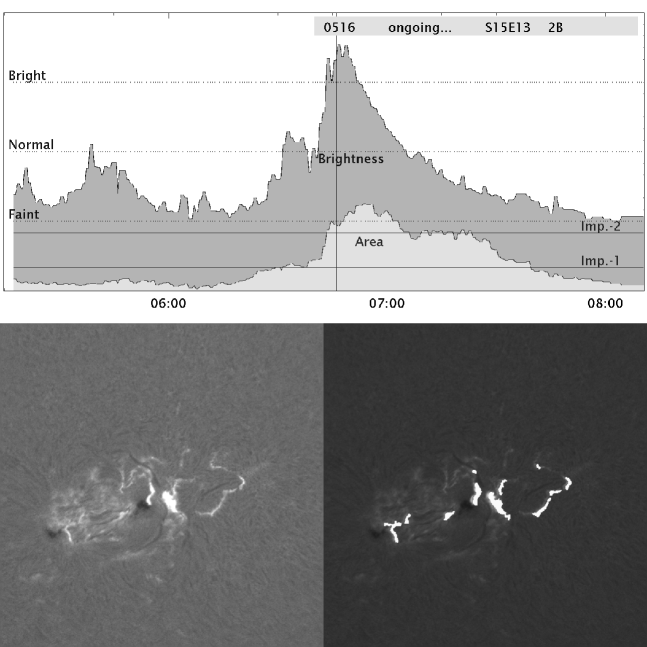
The characteristic properties for flares include the heliographic position, the flare area (which defines the importance class), the brightness class, and the flare start, peak and end times. These quantities need not only the information of a single H image but also the information stored in the log files for the previous time steps. Handling of simultaneous flares is easily possible as each flare is identified via a unique ID that is propagated from image to image. In Figure 4 we show as an example the evolution of the area and the brightness for a 2B class flare that occurred on August 22, 2015 (top panel). The bottom panels show the original H image during the peak of the event (left) and the detected flare area (right).
The flare area is calculated by the number of segmented pixels with the same ID. These are subsequently converted by the pixel-to-arcsec scale of that day to derive the area in millionths of the solar hemisphere. The conversion procedure includes the information of the heliographic flare position in order to correct for foreshortening toward the solar limb. The determined area is then directly converted to the flare importance class (subflares, 1, 2, 3, 4) according to the official flare importance definitions (Zirin 1988). For the categorization into the flare brightness classes (Brilliant-Normal-Faint: B-N-F), the intensity values relative to the background are calculated.
For the automatic flare detection and characterization, several definitions are applied: The flare start is defined as the time when the brightness enhancement was detected above the faint flare level for three consecutive images. The peak time of the flare is defined as the time where the maximum flare brightness is reached. The flare position is defined by the location of the brightest flare pixel in the normalized and filtered H images at the time of the flare peak. The importance class of the flare is defined via the maximum area of the flare, and is updated when the area exceeds the level of a higher importance class. The flare end is defined as the time when the brightness has decreased below the faint level for ten consecutive images or when there is a data gap of more than 20 minutes.
If a flare that exceeds a certain threshold is detected, i.e. a certain importance class, then a flare alert is published on the ESA SSA SWE portal and an alert email is sent out to registered users. At the same time the event list on the ESA SSA SWE portal is updated. Further updates are made when more information on a flare becomes available during its evolution (e.g., the peak time) or when a flare, that is already listed, increases in its importance class. A list of all detected events is stored in the local raid system for later evaluation and preparation of an archive.
3.2.3 Filament detection
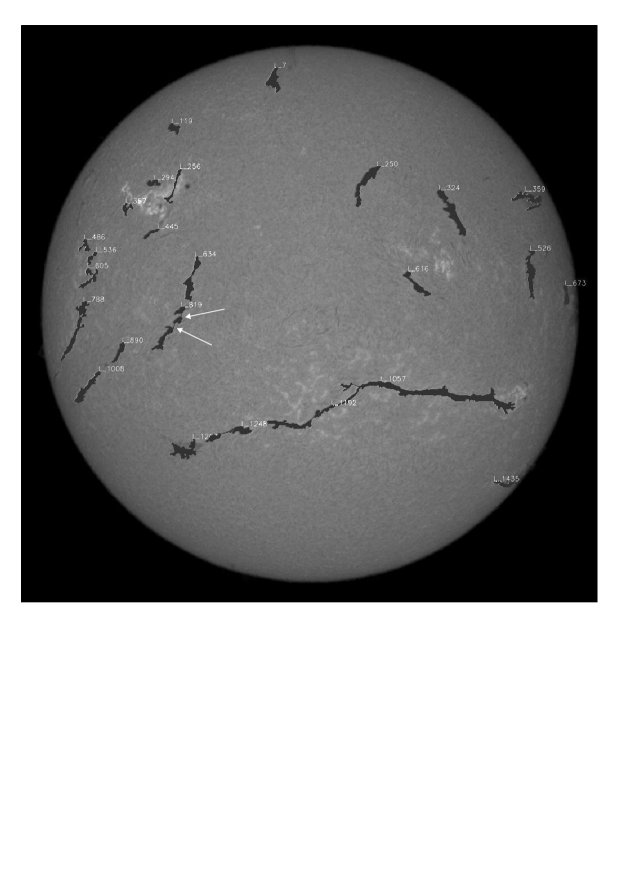
The image recognition algorithm can distinguish between flares, filaments, sunspots and background (i.e. quiet-Sun regions). Information logs about filament position, length and ID are the second output of this algorithm. The detection of filaments is more sophisticated than that of flares as the brightness of filaments is not always clearly distinguishable from the background. In addition, parts of filaments may seem to vanish for short times due to degrading seeing conditions or due to filament oscillations (e.g., Hyder 1966; Bi et al. 2014). Filaments may also consist of more than one segment. In our algorithm, segments of a filament are connected together if they are oriented in the same direction and if they are separated by no more than . Figure 5 shows a sample H image together with the filament detections. Each filament is identified by a unique ID that is tracked from each image to the next. In a future activity, the detected filaments and tracking of their ID in time will be used in order to implement an algorithm that automatically detects the eruption of filaments in the real-time data.
3.3 Evaluation of the KSO real-time flare detection
The KSO real-time flare and filament detection system went online in March 2013. After a testing and iteration period of about 4 month, it was fully established and runs continuously since about July 2013 in the same configuration. A detailed evaluation of the period between end of June 2013 and end of November 2013 can be found in Pötzi et al. (2015). In the following, we present an assessment of the real-time flare detection for an almost 2.5 year period from July 1, 2013 until November 30, 2015. In total 824 flare have been detected during this period by the KSO automatic system. The flares detected are distributed among the importance classes as follows: 650 subflares (78.89 %), 155 flares of class 1 (18.81 %), 17 flares of class 2 (2.06 %) and two flares of class 3 (0.24 %).333Note that we included only subflares with an area larger than 50 micro-hemispheres. Thus, in our distribution among the flare classes we have a larger fraction of flares of importance 1 than on average, cf. Temmer et al. (2001). In order to evaluate the performance of system, we compare the real-time results obtained by the KSO automatic image recognition system against the official optical flare reports provided by NCEI (NOAA) and by KSO. NCEI (NOAA) and KSO flare reports both are obtained after the event occurrence by visual inspection of the data by experienced observers.
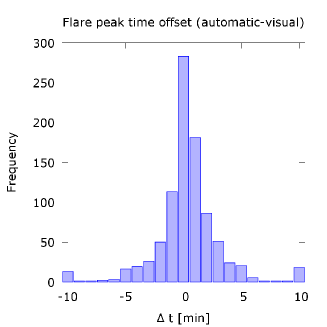
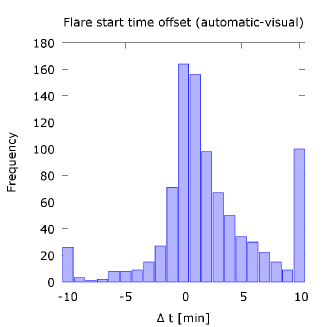
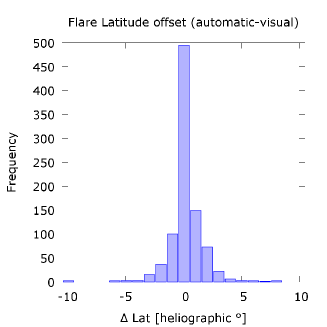
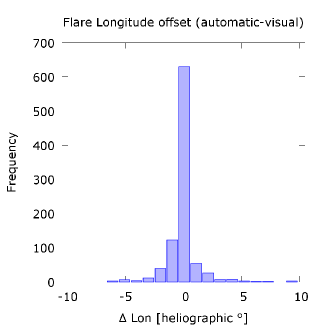
Figure 6 shows the offsets for flare peak times, flare start times and flare positions in heliographic latitude and longitude coordinates between the KSO automatic detections and the visual inspections. 89 % (95 %) of the flare peak times determined lie within 3 min (5 min) of the values given in the official flare reports. For the start times, it is 65 % (76 %). For the flare start time, the dispersion is somewhat larger and the distribution is asymmetric around zero with a tendency to positive values. This delay of the automatic detections with respect to the flare reports probably result form the requirement that in the automatic algorithm at least three consecutive detections are necessary to define a brightening as a flare, whereas for visual inspection single images may be sufficient to detect the start of a flare. Large deviations (in both directions) are mostly a result of data gaps in the real-time image sequences. The distributions of the heliographic flare positions, determined at the peak of the flare, are plotted in the bottom row of Figure 6. They reveal a strong peak at values smaller than . Basically all events detected lie within an accuracy of in heliographic latitude and longitude compared to the official flare reports based on visual inspection.
In order to quantify the detection rate, we used the concept of verification measures (e.g., Devos et al. 2014). For this purpose we need four measures, which we defined either (i) by comparing for each minute of observations the state of the automatic flare detection system with the official flare reports based on visual inspection (continuous/ time series approach) or (ii) by comparing the automatically detected flares with the flare reports (discrete/ event approach):
-
•
h number of hits: automatic = flare AND visual = flare,
-
•
f number of false detections: automatic = flare AND visual flare,
-
•
m number of missed detections: automatic flare AND visual = flare,
-
•
z number of zeros: automatic flare AND visual flare.
This verification was applied to all flares that where larger than subflares, i.e. including all events of importance class 1, 2 and 3 (no importance class 4 flare occurred in the evaluation period). For the continuous approach, the verification metrics obtained from this set are:
The hitrate HR gives a measure of the correct hits. However, we note that it is strongly influenced by the number of zeros (), which is very high compared to the hits () — this is due to the fact that flares are rare events. E.g., in the year 2014, 95% of the observation time were counted as zero (i.e. no flare of importance 1 was ongoing). Therefore, the probability of detection (POD) is a more appropriate measure, as it does not include the zeros. It is still indicative of a high value of detection. The true skill score (TSS) or also called Hanssen and Kuipers Score (Hanssen & Kuipers 1965) gives information on the overall quality of the detection, considering both the true positive rates and false positive rates. The values of the TSS lie in the range , where means a perfect detection and a perfect inverse detection. HSS values around 0 imply that the detection is no better than a random guess. The obtained HSS value of 0.82 is high, indicating a good performance of the system. However, we note that the HSS is also biased by the large number of zeros in the measurement series. Thus, evaluation quantities that are based on the events detected instead of the continuous measurement time series may provide a better quantification of the performance of the system.
If count the number of flares with an importance level of at least class 1 (i.e. ignoring subflares) that were detected by the automatic system during the evaluation period, we arrive at a total of 174 events . However, 28 out of these were false alerts. (21 of these false alerts can be attributed to data gaps, which led to a splitting-up of ongoing flares in the automatic routine.) From these numbers we obtain for the discrete detection of flare events of class 1 and larger a false alarm rate of
In addition, 8 events that were classified as importance 1 or larger by the NOAA or KSO optical flare reports, were not correctly identified by the automatic system. They were detected as flares but assigned as subflares. Thus, for the discrete verification approach, we obtain for the detection of flares of importance class 1 a probability of detection (POD) of 94.8%.
4 Conclusions and Outlook
Ground-based observations provide an important means to monitor and to study the solar sources of space weather disturbances, complementing the data obtained from space-based observatories. The main advantages of ground-based observations are the comparatively simple and non-expensive observing systems, the flexibility in upgrading the system, fast networks and data transfer, and the immediate availability of the data. These facts are highly relevant for the real-time assessment of space weather events. Difficulties that arise from ground-based observations are data gaps and image degradation due to the day/night-cycle, local weather and seeing conditions. However, these drawbacks can in principle be overcome by networks of observatories densely distributed over the world. Currently, there exist two networks that provide high-cadence full-disk H observations of the Sun for space weather monitoring and research, GONG (consisting of six sites well distributed in longitude, with same instrumentation) and GHN (nine sites, different instruments).
In this review, we also presented an assessment of the real-time detection system of solar flares and filaments in H images that was established in 2013 at Kanzelhöhe Observatory, and that is continuously running since then. For the evaluation period July 2013 to November 2015, the discrete detection probability for flares of H importance 1 was 95 %, with a false flare alarm rate of 16 %. We note that the other 5% of events were also detected but erroneously classified as subflares. The false alarms were mostly resulting from data gaps, which led to an assignment of individual flares as two or multiple events by the automatic detection system. Currently, there is an effort to utilize the automatically identified filaments in order to develop a system for the real-time detection of filament eruptions, which are often accompanied by CMEs. Further improvements could be achieved, when the real-time flare and filament detection system was extended to a network of observatories, thus filling up data gaps from one station by data from another station. Major challenges will be to test whether robust image recognition algorithms can be developed that work successfully on sequences of data that are obtained by different instruments (in terms of telescope, filter, CCD camera etc.) or whether homogeneous data sets like from the GONG network are needed.
Acknowledgments
This study was developed within the framework of ESA Space Situational Awareness (SSA) Programme (SWE SN IV-2 activity).
References
- Bein et al. (2012) Bein, B. M., Berkebile-Stoiser, S., Veronig, A. M., Temmer, M., & Vršnak, B. 2012, ApJ, 755, 44. 1206.2144
- Benz (2008) Benz, A. O. 2008, Living Reviews in Solar Physics, 5, 1
- Bi et al. (2014) Bi, Y., Jiang, Y., Yang, J., Hong, J., Li, H., Yang, D., & Yang, B. 2014, ApJ, 790, 100
- Bothmer & Daglis (2007) Bothmer, V., & Daglis, I. 2007, Space Weather: Physics and Effects, Environmental Sciences (Springer)
- Chen (2011) Chen, P. F. 2011, Living Reviews in Solar Physics, 8, 1
- Dellinger (1935) Dellinger, J. H. 1935, Science, 82, 351
- Devos et al. (2014) Devos, A., Verbeeck, C., & Robbrecht, E. 2014, Journal of Space Weather and Space Climate, 4, A29
- Fletcher et al. (2011) Fletcher, L., Dennis, B. R., Hudson, H. S., Krucker, S., Phillips, K., Veronig, A., Battaglia, M., Bone, L., Caspi, A., Chen, Q., Gallagher, P., Grigis, P. T., Ji, H., Liu, W., Milligan, R. O., & Temmer, M. 2011, Space Sci.Rev., 159, 19. 1109.5932
- Forbes et al. (2006) Forbes, T. G., Linker, J. A., Chen, J., Cid, C., Kóta, J., Lee, M. A., Mann, G., Mikić, Z., Potgieter, M. S., Schmidt, J. M., Siscoe, G. L., Vainio, R., Antiochos, S. K., & Riley, P. 2006, Space Sci.Rev., 123, 251
- Gary & Keller (2004) Gary, D. E., & Keller, C. U. (eds.) 2004, Solar and Space Weather Radiophysics - Current Status and Future Developments, vol. 314 of Astrophysics and Space Science Library
- Gopalswamy et al. (2003) Gopalswamy, N., Shimojo, M., Lu, W., Yashiro, S., Shibasaki, K., & Howard, R. A. 2003, ApJ, 586, 562
- Hanssen & Kuipers (1965) Hanssen, A., & Kuipers, W. 1965, On the Relationship Between the Frequency of Rain and Various Meteorological Parameters: (with Reference to the Problem of Objective Forecasting), Koninkl. Nederlands Meterologisch Institut. Mededelingen en Verhandelingen (Staatsdrukkerij- en Uitgeverijbedrijf)
- Harvey et al. (2011) Harvey, J. W., Bolding, J., Clark, R., Hauth, D., Hill, F., Kroll, R., Luis, G., Mills, N., Purdy, T., Henney, C., Holland, D., & Winter, J. 2011, in AAS/Solar Physics Division Abstracts #42, 1745
- Hill et al. (1994) Hill, F., Fischer, G., Grier, J., Leibacher, J. W., Jones, H. B., Jones, P. P., Kupke, R., & Stebbins, R. T. 1994, Solar Phys., 152, 321
- Hirtenfellner-Polanec et al. (2011) Hirtenfellner-Polanec, W., Temmer, M., Pötzi, W., Freislich, H., Veronig, A. M., & Hanslmeier, A. 2011, Cent. Eur. Astrophys. Bull., 35, 205
- Hyder (1966) Hyder, C. L. 1966, ZAp, 63, 78
- Illing & Hundhausen (1985) Illing, R. M. E., & Hundhausen, A. J. 1985, Journal of Geophysical Research, 90, 275
- Jungmeier (2014) Jungmeier, G. 2014, “… für eine dauernde Überwachung der Vorgänge auf der Sonne zum Zwecke der Funkberatung …", http://kso.ac.at/praesentation/fuer_eine_dauernde_ueberwachung.pdf (University of Graz, online report)
- Otruba et al. (2008) Otruba, W., Freislich, H., & Hanslmeier, A. 2008, Cent. Eur. Astrophys. Bull., 32, 1
- Otruba & Pötzi (2003) Otruba, W., & Pötzi, W. 2003, Hvar Obs. Bull., 27, 189
- Pick (2006) Pick, M. 2006, in Solar and Heliospheric Origins of Space Weather Phenomena, edited by J.-P. Rozelot, vol. 699 of Lecture Notes in Physics, Berlin Springer Verlag, 119
- Pick & Vilmer (2008) Pick, M., & Vilmer, N. 2008, A&A Rev., 16, 1
- Pötzi et al. (2013) Pötzi, W., Hirtenfellner-Polanec, W., & Temmer, M. 2013, Cent. Eur. Astrophys. Bull., 37, 655
- Pötzi et al. (2015) Pötzi, W., Veronig, A. M., Riegler, G., Amerstorfer, U., Pock, T., Temmer, M., Polanec, W., & Baumgartner, D. J. 2015, Solar Phys., 290, 951. 1411.3896
- Priest & Forbes (2002) Priest, E. R., & Forbes, T. G. 2002, A&A Rev., 10, 313
- Pulkkinen (2007) Pulkkinen, T. 2007, Living Reviews in Solar Physics, 4, 1
- Riegler (2013) Riegler, G. 2013, Master’s thesis, Graz University of Technology
- Riegler et al. (2013) Riegler, G., Pock, T., Pötzi, W., & Veronig, A. 2013, ArXiv e-prints. 1304.7132
- Schwenn (2006) Schwenn, R. 2006, Living Reviews in Solar Physics, 3, 2
- Seiler (2007) Seiler, M. P. 2007, Kommandosache “Sonnengott” - Geschichte der deutschen Sonnenforschung im Dritten Reich und unter alliierter Besatzung, vol. 31 of Acta Historica Astronomiae (Verlag Harri Deutsch)
- Steinegger et al. (2000) Steinegger, M., Denker, C., Goode, P. R., Marquette, W. H., Varsik, J., Wang, H., Otruba, W., Freislich, H., Hanslmeier, A., Luo, G., Chen, D., & Zhang, Q. 2000, in The Solar Cycle and Terrestrial Climate, Solar and Space weather, edited by A. Wilson, vol. 463 of SP-ESA, Noordwijk, 617
- Steinegger et al. (2001) — 2001, in SOHO 10/GONG 2000 Workshop: Helio- and Asteroseismology at the Dawn of the Millennium, edited by A. Wilson, & P. L. Pallé, vol. 464 of ESA Special Publication, 315
- Temmer et al. (2001) Temmer, M., Veronig, A., Hanslmeier, A., Otruba, W., & Messerotti, M. 2001, A&A, 375, 1049
- Vršnak & Cliver (2008) Vršnak, B., & Cliver, E. W. 2008, Solar Phys., 253, 215
- Warmuth (2015) Warmuth, A. 2015, Living Reviews in Solar Physics, 12, 3
- Webb & Howard (2012) Webb, D. F., & Howard, T. A. 2012, Living Reviews in Solar Physics, 9, 3
- Wiegelmann et al. (2014) Wiegelmann, T., Thalmann, J. K., & Solanki, S. K. 2014, A&A Rev., 22, 78. 1410.4214
- Zirin (1988) Zirin, H. 1988, Astrophysics of the Sun (Cambridge University Press)