CONCEPTUAL DESIGN REPORT
The NEXT-100 experiment for searches at LSC
(16 May 2011)
We propose an EASY (Electroluminescent ApparatuS of high Yield) and SOFT (Separated Optimized FuncTion) time-projection chamber for the NEXT experiment, that will search for neutrinoless double beta decay () in 136Xe. Our experiment must be competitive with the new generation of searches already in operation or in construction. This requires a detector with very good energy resolution (), very low background contamination ( ) and large target mass. In addition, it needs to be operational as soon as possible. The design described here optimizes energy resolution thanks to the use of proportional electroluminescent amplification (EL), which provides a large yield of photons as a signal; it is compact, as the Xe gas is under high pressure; and it allows the measurement of the topological signature of the event to further reduce the background contamination. The SOFT design uses different sensors for tracking and calorimetry. We propose the use of SiPMs (MPPCs) coated with a suitable wavelength shifter for the tracking, and the use of radiopure photomultipliers for the measurement of the energy and the primary scintillation needed to estimate the . This design provides the best possible energy resolution compared with other NEXT designs based on avalanche gain devices.
The baseline design is an Asymmetric Neutrino Gas EL apparatus (ANGEL), which was already outlined in the NEXT LOI. ANGEL is conceived to be easy to fabricate. It requires very little R&D and most of the proposed solutions have already been tested in the NEXT-1 prototypes. Therefore, the detector can be ready by 2013. The detector may be upgraded to a fiducial mass of 1 ton after the initial physics runs, following the successful approach of GERDA and XENON experiments.
With our design, NEXT will be competitive and possibly out-perform existing proposals for next-generation neutrinoless double-beta decay experiments. In this Conceptual Design Report (CDR) we discuss first the physics case, present a full design of the detector, describe the NEXT-1 EL prototypes and their initial results, and outline a project to build a detector with 100 kg of enriched xenon to be installed in the Canfranc Underground Laboratory in 2013.
The NEXT collaboration
E. Gómez, R.M. Gutiérrez, M. Losada, G. Navarro
Universidad Antonio Nariño, Bogotá, Colombia
A.L. Ferreira, C.A.B. Oliveira, J.F.C.A. Veloso
Universidade de Aveiro, Aveiro, Portugal
D. Chan, A. Goldschmidt, D. Hogan, T. Miller, D. Nygren,
J. Renner, D. Shuman, H. Spieler, T. Weber
Lawrence Berkeley National Laboratory, Berkeley CA, USA
F.I.G. Borges, C.A.N. Conde, T.H.V.T. Dias, L.M.P. Fernandes, E.D.C. Freitas, J.A.M. Lopes, C.M.B. Monteiro, H. Natal da Luz, F.P. Santos, J.M.F. dos Santos
Universidade de Coimbra, Coimbra, Portugal
M. Batallé, L. Ripoll
Universitat de Girona, Girona, Spain
P. Evtoukhovitch, V. Kalinnikov, A. Moiseenko, Z. Tsamalaidze, E. Velicheva
Joint Institute for Nuclear Research (JINR), Dubna, Russia
E. Ferrer-Ribas, I. Giomataris, F.J. Iguaz
IRFU, Centre d’Études Nucléaires de Saclay, Gif-sur-Yvette, France
J.A. Hernando Morata, D. Vázquez
Universidade de Santiago de Compostela, Santiago de Compostela, Spain
C. Sofka, R. C. Webb, J. White
Texas A&M University, College Station TX, USA
J.M. Catalá, R. Esteve, V. Herrero,
A. Méndez, J.M. Monzó, F.J. Mora, J.F. Toledo
I3M, Universidad Politécnica de Valencia, Valencia, Spain
R. Palma, J.L. Pérez-Aparicio
Universidad Politécnica de Valencia, Valencia, Spain
V. Álvarez, M. Ball, J. Bayarri, S. Cárcel, A. Cervera,
J. Díaz, P. Ferrario, A. Gil, J.J. Gómez-Cadenas111Spokesperson. Contact email: gomez@mail.cern.ch, K. González,
I. Liubarsky, D. Lorca, J. Martín-Albo, F. Monrabal, J. Muñoz Vidal,
M. Nebot, J. Pérez, J. Rodríguez, L. Serra, M. Sorel, N. Yahlali
Instituto de Física Corpuscular (IFIC), CSIC & Univ. de Valencia, Valencia, Spain
J.M. Carmona, J. Castel, S. Cebrián, T. Dafni, H. Gómez,
D.C. Herrera, I.G. Irastorza, G. Luzón, A. Rodríguez, L. Seguí, A. Tomás, J.A. Villar
Lab. de Física Nuclear y Astropartículas, Universidad de Zaragoza, Zaragoza, Spain
Chapter 1 The Physics
1.1 Majorana neutrinos and double beta decay
Neutrinos could be the only truly neutral particles among the elementary fermions. A truly neutral particle would be identical to its antiparticle, as proposed by Ettore Majorana more than 70 years ago [1]. The existence of such Majorana neutrinos would have profound implications in particle physics and cosmology. For instance, they provide a natural explanation for the smallness of neutrino masses, the so-called seesaw mechanism. Besides, Majorana neutrinos violate lepton-number conservation. This, together with CP-violation, is a basic ingredient to help uncover the reasons why matter dominates over antimatter in our Universe.
The only practical way to establish experimentally that neutrinos are their own antiparticles is the detection of neutrinoless double beta decay () [2, 3]. This is a hypothetical, very rare nuclear transition that occurs if neutrinos are massive Majorana particles [4, 5]. It involves the decay of a nucleus with protons into a nucleus with protons and the same mass number , accompanied by the emission of two electrons: . The sum of the kinetic energies of the two emitted electrons is always the same, and corresponds to the mass difference between mother and daughter nuclei, . The decay violates lepton number conservation and is therefore forbidden in the Standard Model.
The simplest underlying mechanism of is the virtual exchange of light Majorana neutrinos, although, in general, any source of lepton number violation (LNV) can induce and contribute to its amplitude. If we assume that the dominant LVN mechanism at low energies is the light-neutrino exchange, the half-life of can be written as:
| (1.1) |
where is an exactly-calculable phase-space factor, is a nuclear matrix element, and is the effective Majorana mass of the electron neutrino:
| (1.2) |
where are the neutrino mass eigenstates and are elements of the neutrino mixing matrix. Therefore, a measurement of the decay rate would provide direct information on neutrino masses.
Neutrino oscillation measurements constrain how the effective Majorana mass changes with the absolute neutrino mass scale, defined as the smallest neutrino mass eigenstate. Currently, only upper bounds on the absolute mass scale, of about 1 eV, exist. Also, current oscillation data does not allow to differentiate between two possible mass eigenstates orderings, usually referred to as normal and inverted hierarchies. In the normal hierarchy —where the gap between the two lightest eigenstates corresponds to the small mass difference, measured by solar experiments— the effective Majorana mass can be as low as 2 meV. If the mass ordering is the inverted —the gap between the two lightest states corresponds to the large mass difference, measured by atmospheric experiments—, can be as low as 15 meV. In the particular case in which the neutrino mass differences are very small compared to its absolute scale, we speak of the degenerate spectrum. In this case, larger values for , approximately above 50 meV, can be obtained.
Cosmological measurements provide a further constrain on the effective Majorana mass, since they measure the sum of the masses of the three neutrino flavors. The less restrictive cosmological bounds exclude values of larger than a few hundred meV, while the most restrictive cosmological bounds exclude values above some 100 meV [6].
All nuclear structure effects in are included in the nuclear matrix element (NME). Its knowledge is essential in order to relate the measured half-life to the neutrino masses, and therefore to compare the sensitivity and results of different experiments, as well as to predict which are the most favorable nuclides for searches. Unfortunately, NMEs cannot be separately measured, and must be evaluated theoretically. In the last few years the reliability of the calculations has greatly improved, with several techniques being used, namely: the Interacting Shell Model (ISM) [7, 8, 9]; the Quasiparticle Random Phase Approximation (QRPA) [10, 11, 12]; the Interacting Boson Model (IBM) [13]; and the Generating Coordinate Method (GCM) [14]. Figure 1.1 shows the most recent results of the different methods.

1.2 Double beta decay experiments
Double beta decay experiments are designed, in general, to measure the kinetic energy of the electrons emitted in the decay. The golden signature available to a experiment is the sum of such kinetic energies, which, for a perfect detector, equals . However, due to the finite energy resolution of any detector, events are reconstructed within a non-zero energy range centered around , typically following a gaussian distribution (Figure 1.2). Unfortunately, any background event falling in this energy range limits dramatically the sensitivity of the experiment. Good energy resolution is therefore essential. That’s why germanium-based experiments have dominated the field so far: in a experiment, a region able to contain most of the signal —called the region of interest (ROI), and often taken as 1 FWHM around — would be only a few keV wide.

The Heidelberg-Moscow (HM) experiment [17], using high-purity germanium diodes enriched to 86% in the isotope , set the most sensitive limit to date: years (90% CL). The experiment accumulated a total exposure of 71.7 , and achieved a background rate in the ROI of 0.18 . The energy resolution (FWHM) at was keV. A subset of the Collaboration observed evidence for a signal [18]. The claim has been severely questioned [19], but no one has been able to prove it wrong. According to it, the isotope would experiment decay with a lifetime of about years.
Unfortunately, energy resolution is not enough by itself: a continuous spectrum arising from natural decay chains can easily overwhelm the signal peak, given the enormously long decay times explored. Consequently, additional signatures to discriminate between signal and backgrounds are desirable. Also, the experiments require underground operation and a shielding to reduce external background due to cosmic rays and surrounding radioactivity, and the use of very radiopure materials. In addition, large detector masses, high isotope enrichment, and high detection efficiency are clearly desirable, given the rare nature of the process searched for.
One way to evaluate the interest of new proposals is to compare their performance with that of the HM experiment. This can be done in terms of the three basic quantities mentioned above. The total exposure, the expected background rate in the ROI and the energy resolution.
1.3 The double beta race
Clearly, when considering a new experiment such as NEXT, one must take into account the expected performance and schedule of the competition. However, this is not easy for several reasons: a) there are many proposals, at very different stages of development; b) there are significant uncertainties in the schedules of most projects; and c) there are significant uncertainties in the expected performance of the different experiments.
On the other hand, it is still important to estimate the sensitivity to a light Majorana neutrino that can be reached by the major players, in a time window that would correspond to the “next generation” of experiments. In [20], it was found that the four most promising experiments searching for processes were GERDA, CUORE, EXO and KamLAND-Zen. In this section we estimate their expected performance, extrapolated until 2020, and considering for each one two possible stages or phases as actually planned by GERDA and KamLAND-Zen.
| Experiment | Isotope | Resolution | Efficiency | Phase | Mass | Exposure | Background rate | Sensitivity |
|---|---|---|---|---|---|---|---|---|
| (keV) | (kg) | (kgyear) | () | (meV) | ||||
| CUORE | 5 | 0.8 | 2015–2017 (I) | 200 | 600 | 140 | ||
| 2018–2020 (II) | 200 | 600 | 85 | |||||
| EXO | 100 | 0.7 | 2012–2014 (I) | 160 | 480 | 185 | ||
| (II) 2016–2020 | 160 | 800 | 150 | |||||
| GERDA | 5 | 0.8 | 2012–2014 (I) | 18 | 54 | 214 | ||
| 2016–2020 (II) | 35 | 175 | 112 | |||||
| KamLAND-Zen | 250 | 0.8 | 2013–2015 (I) | 360 | 1440 | 97 | ||
| 2017–2020 (II) | 35 | 2700 | 60 |
1.3.1 CUORE
CUORE [21, 22, 23, 24, 25, 26] is an array of TeO2 bolometers. Because 130Te has a large natural abundance (34%), the need for enrichment is less important than in other isotopes. CUORE can collect a large mass of isotope ( kg for a total detector mass of 740 kg). The advantages and disadvantages of the technique are similar to those of experiments with about the same energy resolution and efficiency for the signal. However, the ratio surface to active volume is better in the experiments.
CUORICINO measured an irreducible background of (in kilograms of detector mass). The major sources of contamination are Compton events from 2615 keV peak of (from cryostat contamination) and degraded alphas on copper and crystal surfaces. The more recent Three Tower Test (TTT) measures (detector mass), or about in isotope mass. CUORE expects to be able to reduce the background to (per kg of detector), or about (per kg of isotope).
CUORE is scheduled to start data taking in 2014. We assume a commissioning run of one year (2014–2015), a physics run of 2 years (2015, 2016) at the background level of per kg of isotope. For stage II, after one year off for upgrade, we assume a run of three years (2017-2020) with a background per kg of isotope.
1.3.2 GERDA
GERDA [27, 28, 29, 30] will search for in using arrays of high-purity germanium detectors. This is a well-established technique that offers outstanding energy resolution (better than 0.2% FWHM at the -value) and high efficiency ( 0.80). Its main drawback is the scalability to large masses.
The first phase of GERDA will run with the same detectors used by HM and IGEX, for a total of 18 kg of isotope. Currently, the measured background rate is at the level of , while the goal of the collaboration is to reduce it to . The second phase will add 40 kg of thick-window p-type BEGe detectors (34 kg of isotope). Such detectors have enhanced background discrimination, due to pulse shape analysis. They are also optimized to suppress surface backgrounds. The experiment expects to reach .
GERDA is already commissioning the detector with depleted Ge crystals, and will probably start a physics run in 2011. We assume that their background target will be reached in 2012 and a full run of 3 years (2012-2014) for phase I, followed by one year offline for upgrade to phase II and commissioning and 5 years run (2016-2020) at their target background rate of .
1.3.3 EXO
The Enriched Xenon Observatory (EXO) [31] will search for decay in 136Xe using a liquid-xenon TPC (LXe) with 200 kg total mass (enriched at 80% in ). The use of liquefied xenon results in a relatively modest energy resolution ( 4% FWHM resolution at [32]). The strong point of a LXe TPC is self-self-shielding and good position resolution. It is then possible to select a fiducial volume capable to reject superficial backgrounds and multi-hit events, in such a way that only energetic gammas from and 214Bi constitute a significant source of background111The ultimate goal of the EXO Collaboration, whose benefits are not considered here, is to develop the so-called barium tagging. This technique would allow the detection of the ion product of the 136Xe decay, and thus eliminate all backgrounds but the intrinsic .
We have performed simulations of the response of a LXe TPC to the 214Bi and backgrounds. Our results, in spite of the fact that we consider a rather idealized detector are more pessimistic that those quote by the EXO collaboration. While they find a background rate of the of we obtain . We believe that this discrepancy can be explained, at least partially, by taking into account that the recently measured value of end-point [33] is considerably closer to the 214Bi peak that believed a few years ago. EXO-200 is commissioning its detector in 2011. We consider one year to bring the detector to the desired level of background (2012) and two phases, as detailed in table 1.1. In the second phase we assume that the mass is increased to 400 kg and the background reduced to , at the cost of efficiency (40% rather than 60%).
1.3.4 KamLAND-Zen
The KamLAND-Zen (Zen for Zero Neutrino double beta decay) [34, 35] experiment plans to dissolve 400 kg of xenon enriched at 90% in in the liquid scintillator of KamLAND. Xenon is relatively easy to dissolve (with a mass fraction of more than 3% being possible) and also easy to extract. The major modification to the existing KamLAND experiment is the construction of an inner, very radiopure and very transparent (to the liquid scintillator emission wavelength, 350–450 nm) balloon to hold the dissolved xenon. The balloon, 1.7 meters in radius, would be shielded from external backgrounds by a large, very pure liquid scintillator volume. While the energy resolution at is poor, of the order of 10%, the detection efficiency is much better () due to its double envelope. The estimation of the background rate is affected, among other things by the radiopurity of the balloon and the liquid scintillator, as well as the lifetime of the process. A reasonable estimation for phase I of the experiment (400 kg) is a background rate of . The detector expects to start operation in 2012. We assume one year commissioning (2012–2013), and a physics run of 3 years for phase I. For phase II the collaboration plans to purchase 1 ton of xenon and optimization of shielding could lead to an improvement in the background rate to a level of about .
1.4 The NEXT challenge
NEXT will search for neutrinoless double beta decay in using a high-pressure gaseous xenon time-projection chamber. As it will be discussed with great detail later, the experiment aims to take advantage of both good energy resolution and the presence of a topological signature for further background suppression. As a result, the background rate is expected to be one of the lowest of the new generation of experiments.
Nevertheless, one should not forget that CUORE, EXO and GERDA are commissioning already their detectors, and KamLAND-Zen may start commissioning in 2012. NEXT must, therefore, be in business as soon as possible. As it will be shown in this report, the detector can be built by 2013 and commissioned in 2014. This would allow a 5-years run until 2020. This schedule is aggressive but feasible, since it is based in a technology amply demonstrated by the NEXT-1 prototypes, and will benefit of the experience in radiopurity available in the Collaboration and elsewhere.
The construction of NEXT-10 —an intermediate, radiopure “demonstrator” of about 10 kg—, as initially foreseen in our LOI [36], would introduce, we believe, an unacceptable delay. NEXT-10 could only be built after the final technological solutions are specified. Building and commissioning the detector would take one year, and another year would be needed to analyze the data. Irrespectively of the additional costs, the construction of a fully-fledged NEXT-10 detector would push the start date of NEXT to circa 2017, leaving only a 3 years run before 2020.
We examine now the various parameters that define the detector:
-
1.
Mass: The LSC has already procured 100 kg of xenon, enriched at 90% in . We argue that, if the initial NEXT run (2015 and 2016) is successful, the mass could be increased to 1 ton. This would require a new vessel and more instrumentation, but would benefit from many of the infrastructures available for NEXT100, including the gas system and the shielding.
-
2.
Resolution: The intrinsic energy resolution (FWHM at ) that can be achieved by an EL xenon detector operating at high pressure is about 0.3% [37, 38]. Bolozdynia [39] and White [40] have demonstrated resolutions of around 0.5% in large systems equipped with 19 and 7 PMTs respectively. The resolution of the PMTs initially considered for the NEXT detector has also been measured [41] to be about 0.4%. The intrinsic resolution of micro-bulk micromegas have also been measured in the NEXT collaboration to be about 3% at 10 bar [42]. It follows that an EL TPC is the best option in terms of resolution. Our initial results from the NEXT1-LBNL prototype show a resolution of 0.8–0.9 % at .
-
3.
Background rate: The background rate depends on three factors. Good shielding from external backgrounds (this can be achieved by standard shielding techniques, such as installing the chamber inside a water tank); low activity of the construction materials (which in turn requires low activity sensors and a radiopure metal to build the vessel and field cage rings, as well as isolating any electronics near the fiducial volume and carefully measuring the radioactive budget of any component in the chamber), and detector performance (which depends on the energy resolution, as well as the topological rejection factor).
To motivate our choices, we start by defining a reference scenario (R), with a total mass of 90 kg , a fiducial efficiency of 20% (that takes into account that some is wasted since our design considers only a single gas volume) and a 6-years run (2015 to 2020). We assume an energy resolution of 0.8%, as measured by Bolozdynya [39], and consistent with our initial results described later in this document. Our detailed simulations of the detector, also described later yield a background rate of .
We also define a “slow scenario” (S), which differs from the previous one in a shorter run (3 years) and an “aggressive scenario” (A) which assumes a 2 years run with 90 kg of xenon and the ANGEL baseline and 3 years run with 1 ton and an improved detector with a somewhat lower background rate ().
| Proposal | Sensitivity |
|---|---|
| (meV) | |
| A | |
| R | |
| S |
Table 1.2 summarizes the sensitivity of NEXT under the different scenarios discussed above. We argue that the aggressive scenario is entirely possible and would result in a sensitivity capable to outperform even that of KamLAND-Zen. NEXT is still very competitive in our reference scenario, at the level of GERDA and CUORE. The slow scenarios is, obviously, less interesting.
The lessons are clear: given the current situation, the challenge that the NEXT collaboration must face is to build a state of the art detector, with the best possible resolution, and as fast as possible. There is no room in the current race for a prototype of 10 kg. Rather, we should keep in mind that the 100 kg detector can and should be upgraded to 1 ton in a not-too-distant future. In spite of the fierce competition, NEXT has the chance to be among the leaders of the next generation of experiment.
Chapter 2 EASY & SOFT
2.1 Energy resolution in xenon detectors
Excellent energy resolution is a crucial ingredient for a experiment. Indeed, physics allows such resolution to be attained in a high-pressure gaseous xenon chamber (HPGXe) (instead, those very same intrinsic physics processes appear to limit the performance in a liquid xenon chamber, LXe). This is clearly seen in Figure 2.1, reproduced from Bolotnikov and Ramsey (1997) [37]. The resolutions displayed were extracted from the photo-conversion peak of the 662 keV gamma ray from the 137Cs isotope. Only the ionization signal was detected. A striking feature in Figure 2.1 is the apparent transition at density g/cm3. Below this density, the energy resolution is approximately constant:
| (2.1) |
For densities greater than , energy resolution deteriorates rapidly, approaching a plateau at LXe density.
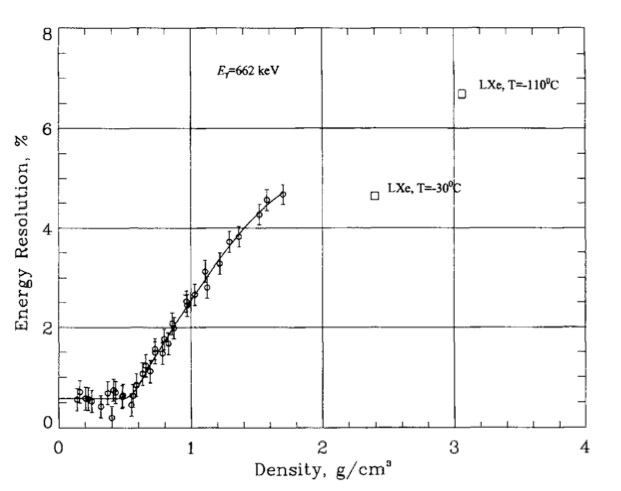
The most plausible explanation underlying this strange behavior is the appearance, as density increases, of two-phase xenon (see [43] and references therein). In contrast, given the xenon critical density, the intrinsic resolution in the gas phase is very good up to pressures in the vicinity of 50 bar, at room temperature, although practical and technical issues dictate operation at smaller pressures, in the range of 10 to 20 bar.
Extrapolating the observed resolution in Figure 2.1 as to the Q-value (2458 keV), a naive energy resolution is predicted:
| (2.2) |
Based on ionization signals only, the above energy resolution reflects an order of magnitude improvement relative to LXe. For densities less than , the measured energy resolution in Figure 2.1 matches the prediction based on Fano’s theory [44]. The Fano factor reflects a constraint, for a fixed energy deposited, on the fluctuations of energy partition between excitation and the ionization yield . For electrons depositing a fixed energy , the rms fluctuations in the total number of free electrons can be expressed as:
| (2.3) |
For pure gaseous xenon (GXe), various measurements [43] show that:
| (2.4) |
In LXe, however, the anomalously large fluctuations in the partitioning of energy to ionization produce an anomalous Fano factor:
| (2.5) |
larger than the one corresponding to GXe by about two orders of magnitude.
A second advantage of gas relative to liquid is the ability to exploit the topological signal of a event, that is the tracks left in the gas by the two electrons produced in the decay. At 10 bar the track length of the electrons is of the order of 30 cm and can be easily imaged in a TPC. Such a topological signature is not available in LXe detectors, due to the high density of the liquid phase. This two advantages (good energy resolution and topological signature) are the key reason why NEXT can be competitive with a LXe experiment such as EXO and a Xenon-liquid-scintillator experiment such as KamLAND-ZEN.
Next we examine the various signals available in an HPGXe and how they can be exploited to search for events.
2.1.1 Scintillation
Two processes are produced in xenon, as a response to the passage of charged particles. The first one is ionization of the gas (call to the average energy spent in the creation of one electron-ion pair); the second is emission of scintillation light (call to the average energy spent in the creation of one primary scintillation photon). The detection of primary scintillation allows the measurement of the start-of-the-event , needed to place an event properly in 3-D space in a TPC.
A recent measurement, within the context of the NEXT R&D [41] yields:
| (2.6) |
Since the end-point of the transition is keV, we obtain that this translates in
| (2.7) |
These photons are emitted isotropically and need to be readout with photosensors capable to count single photoelectrons, that is, photomultipliers. Furthermore, it implies the use of pure xenon, since primary scintillation signals are quenched by common molecular additives such as nitrogen, hydrogen or methane.
2.1.2 Ionization
Ionization can be used to measure both the energy of the () event and to track the two signature electrons. In order to do so, electrons must be first drifted towards the anode. This, in turn, requires a suitable electric field.
The longitudinal diffusion of electrons drifting towards the anode has a minimum in xenon given by:
| (2.8) |
or 375 V/cm at 15 bar, with a drift velocity of about .
At E/p above that given by 2.8, the drift velocity changes slowly. A low drift velocity is not necessarily a disadvantage in a low-rate experiment such as NEXT, assuming that attachment (whose effect increases with drift time) is kept under control. Indeed, too a high electric field can result in unwanted systematic effect [45]. Finding the optimum electric field, that maximizes the resolution and minimizes systematic effects is one of the goals of the NEXT-1 program. However, we expect it not to be very different from the value defined by Eq. (2.8). Indeed, the initial results from our prototypes show that resolution of the photoelectric Cs-137 peak stays constant for values of the drift field between 400 V/cm and about 2 kV/cm.
The diffusion depends on both electric field and electron temperature. For a drift of 1 m and an electric field of 375 V/cm (at 15 bar) the transverse diffusion is of the order of 1 cm. This value is large, but seems acceptable. At 15 bar the track of the two electrons produced in a is of the order of 20 cm, and thus a pitch of 1 cm allows to track the event comfortably. On the other hand, the large value of the diffusion implies that there is no obvious advantage on a too fine grain pitch, since the intrinsic resolution is dictated by the physics.
For pure gaseous xenon, various measurements [43] show that:
| (2.9) |
This results in a number of primary electrons at of:
| (2.10) |
or, roughly, primary electrons for a event.
2.1.3 Intrinsic energy resolution
For electrons depositing a fixed energy , the (rms) fluctuations in the total number of free electrons can be expressed as:
| (2.11) |
The intrinsic energy resolution (FHWM) can be obtained as:
| (2.12) |
which corresponds to the value found in [37].
Of course, there are many factors that can spoil this very good intrinsic resolution. Among these, we mention the following:
-
1.
Losses of drifting electrons due to electronegative impurities, volume recombination, grid transparency, etc., represented by a factor , where is the overall electron collection efficiency.
-
2.
Gain processes such as avalanche multiplication, which multiply the signal by and introduce fluctuations in the detected signal, represented by a variance .
-
3.
Electronic noise, in electrons RMS at signal processing input, represented by .
In addition there are other important sinks of resolution, such as fluctuations associated to Bremsstrahlung losses, channel equalization, non-linearities, etc. However, an analysis of the previous list is sufficient to understand the main issues to be addressed to approach the intrinsic resolution. Assuming that all the above-mentioned sources are gaussian and uncorrelated, we can combine them in quadrature:
| (2.13) |
where is the total number of electrons (rms), due to fluctuations in all sources. Then:
| (2.14) | |||||
| (2.15) |
The challenge in NEXT is to minimize the factor (this can be achieved with a very clean gas that minimizes attachment) and the gain fluctuation factor .
The gain factor turns is considerably larger than in gas proportional counters involving avalanche multiplication. On the other hand, can be made at least as small as using electroluminescence.

A recent measurement done in the context of the NEXT R&D ([41]), shows, indeed, that the use of EL allows to achieve resolutions close to intrinsic. Figure 2.2 shows pulse amplitude (open symbols) and energy resolution (full symbols) for 5.9 keV X-rays absorbed in a NEXT-0 prototype as a function of the reduced electric field in the scintillation region. Notice that the resolution for E/p above 3 is about the same for all pressures, near 8%. This extrapolates to about 0.4% at .

In the next section we will describe the physics of electroluminescence in more detail. Notice, on the other hand, that intrinsic resolution is not the only merit of using linear amplification rather than avalanche gain. As we have seen, the use of conventional molecular additives (quenchers) seems prohibitive in a HPGXe detector. But stable operation of avalanche-based devices requires normally the use of such quenchers to stabilize the gas and avoids sparks.
However, some of the most robust gain devices, such as the Micromegas can perform well even in pure xenon and at high pressures. Nonetheless, their resolution appear to degrade with increased pressure, as demonstrated in [42]. Figure 2.3 shows that the resolution attainable at by the last-generation micro-bulk micromegas at 10 bar would be 3%, to be compared with that of 0.4% found in ([41], Figure 2.2), using electroluminescence. Both measurements were carried out with very small setups, in close-to-ideal conditions, and therefore can be taken as reflecting the intrinsic performance of the devices under study.
Thus, the choice of an avalanche-gain device such as micromegas does not appear to be optimal in terms of energy resolution. On the other hand, the micro-bulk micromegas has been measured to be very radiopure and it could, conceivably, improve the topological signature in NEXT if a mixture capable to reduce the diffusion could be found. In this case one could take advantage of a reduced pitch, and the use of such devices as a trackers could be interesting. Thus, within the context of our R&D for a detector upgrade, we will keep exploring the possibility of using micromegas as tracking devices compatible with an EL TPC.
2.2 Electroluminescence
2.2.1 The Gas Proportional Scintillation Chamber


Figure 2.4 (top), illustrates the principle of a Gas Proportional Scintillation Chamber (GPSC) [47, 48]. An x-ray enters through the chamber window and is absorbed in a region of weak electric field () known as the drift region. The ionization electrons drift under such field to a region of moderately high electric field (around range), the so-called scintillation or EL region. In the scintillation region, each electron is accelerated so that it excites, but does not ionize, the gas atoms/molecules. The excited atoms decay, emitting UV light (the so-called secondary scintillation), which is detected by a photosensor, usually a photomultiplier tube. The intensity of the secondary scintillation light is two or three orders of magnitude stronger than that of the primary scintillation. However, since the secondary scintillation is produced while the electrons drift, its latency is much longer than that for the primary scintillation, and its rise time is much slower (a few s compared to a few ns). For properly chosen electric field strengths and EL region spatial widths, the number of secondary scintillation photons produced by a single primary electron is nearly constant and can reach values as large as a few thousand photons per electron.
The average total number, , of secondary scintillation photons produced by an X-ray photon is then , (recall that is the number of primary ionization electrons) so the photosensor signal amplitude is nearly proportional to E, hence the name of gas proportional scintillation counter (GPSC) for this device.
What made the devices extraordinarily attractive was their improved energy resolution compared with conventional Proportional Chambers (PC) — Figure 2.4 (bottom). In a PC the primary electrons are made to drift towards a strong electric field region, usually in the vicinity of a small diameter (typically 25 m) anode wire. In this region, electrons engage in ionizing collisions that lead to an avalanche with an average multiplication gain M of the order of 103 to 104. If M is not too large, space charge effects can be neglected, and the average number of electrons at the end of the avalanche, , is also proportional to the energy E of the absorbed X-ray photon (hence the name proportional (ionization) counter given to this device). However, for PC detectors, there are fluctuations not only in but also in M; for GPSCs, since the gain is achieved through a scintillation process with almost no fluctuations, only fluctuations in and in the photosensor need to be considered. Thus a better energy resolution was achieved in the latter case; typical values for 5.9 keV X-rays were 8% for GPSC and 14% for PC.
The Scintillation Drift Chamber (SDC) was invented in 1975 [48]. An SDC is a TPC with EL readout instead of charge gain by electron avalanche multiplication in gas. A large SDC with 19 PMTs [39] demonstrated excellent energy resolution at high pressure (9 bar), and for high energy X-rays. However, for mainstream particle physics, EL has had application primarily in only one technique: two–phase LXe detectors aimed at direct detection of WIMPs [49]. In that very successful application, the enabling asset of EL is not excellent energy resolution (limited, as we have seen, by the anomalous Fano factor in liquid), but the capability to detect single electrons.
2.2.2 Xenon atomic energy structure
In the EL region the drift electrons are accelerated and collide with the gas atoms. If the electric field is not too large the electrons collide elastically with the atoms and can also excite but not ionize them. In the case that an excitation collision happens, the atom can stay in one of several excited levels. Since, at high pressures (above few hundreds of torr [50]), the time intervals between collisions of an excited atom with other atoms of the gas are much smaller than the atomic radiative lifetimes [51] the main channel of de-population of these excited atoms is through the formation of excimers–electronically excited molecular states. Excimers, , are formed through three-body collisions between one excited atom, , and two atoms in the ground state, :
| (2.16) |
The excimers responsible for the VUV electroluminescence, , and , are formed from and atomic levels () [52] or by radiative transitions from higher excited molecular levels which are formed from atoms with an energy higher than and [53]. The excimers represented with “”, , are vibrationally relaxed through two-body collisions between the unrelaxed excimers, e.g. , , and ground atoms, :
| (2.17) |
Vibrational unrelaxed excimers can decay to the repulsive ground state, , emitting a VUV photon:
| (2.18) |
as well as vibrational relaxed excimers:
| (2.19) |
In the case that the radiative decay is from the energy of the VUV photon is slightly higher than if the decay is from . In this way it is, at low gas pressures, observed a continuum emission spectrum with two peaks, usually called “first continuum” - at higher frequencies - and “second continuum” - at lower frequencies. The reason why, at high pressures, one usually only observe the “second continuum” is because process (2.17) is preferable to (2.18) due to the increasing in the number of atom collisions.
2.2.3 Simulation of EL in NEXT
NEXT software includes a platform to simulate EL [51], based in Garfield [54] and Magboltz [55, 56]. We have used it to study the expected EL yield and energy resolution.
Primary drift electrons were allowed to drift a distance of mm under the influence of an uniform electric field created by two infinite parallel planes (except in the edges this arrangement simulates well the large EL grids in the NEXT detector). It was considered that the gas is at a pressure bar and at a temperature of . A set of primary electrons was used for each value of the potential applied between the parallel planes, .
2.2.4 Electroluminescence yield

In Figure 2.5 it is shown the reduced electroluminescence yield, , as a function of the reduced electric field, . The reduced electroluminescence yield is defined as being the number of photons emitted per primary electron and per unit of drift length divided by the number density of the gas, . The behavior of with is approximately linear even when the actual ionization threshold is achieved at . In Figure 2.6 it can be easily seen that this threshold is achieved since, for higher values of the electric field, the fluctuations in the secondary charge production, which are bigger than in the electroluminescence, start to dominate. The EL yield keeps its linear behavior while the probability of ionization is low.
Performing a linear fit to the obtained points we obtain the dependence:
| (2.20) |
Consider, for example, the number of photons produced in a TPC operating at 15 bar pressure, with a EL region of 5 mm and set to 3.5. One then produces 2800 EL photons per primary electron. Since there are about primary electrons in a event, we end up with EL photons.
Consider now the variance of the gain:
| (2.21) |
The contributions to the gain resolution must include fluctuations in:
-
1.
the EL gain Y;
-
2.
, the number of photo-electrons per incident electron;
-
3.
the gain process in the photo-detector per single photo-electron, whose fluctuation we express by .
The first term in (2.21) is much smaller than the second, since Y is large, while the limited photon detection efficiency results in a smaller number for . Assuming (most PMTs will do better than that) and setting G = 0.15 (so that it contributes no more than the Fano factor) one obtains:
| (2.22) |
Thus, in order to optimize the resolution is necessary a device capable to detect at least 10 photoelectrons per primary electron. We will revisit this condition when discussing the NEXT design.

Using our detailed simulation we can estimate the energy resolution attainable by NEXT for the events. Figure 2.6 shows energy resolution curves as a function of the reduced electric field for three different scenarios: a) an ideal detector that detects all EL photons; b) an detector with 50% effective PMT coverage and an effective detection efficiency per PMT of 10% (); and c) a detector with 5% PMT coverage and 10% detection efficiency (). is the parameter that describes the fluctuations relative to the electroluminescence production, defined as the relative variance in the number of emitted VUV photons per primary electron, :
| (2.23) |
To summarize, we have a detailed understanding of the EL process, which is fully simulated within the NEXT software framework. Our predictions for both the EL yield and the EL resolution are consistent with data available in the literature and with our own measurements within the NEXT R&D and confirm the possibility to reach a resolution at which can be as low as 0.4%, and in any case, at the level of our target resolution of 1%.
2.3 The SOFT concept
A HPGXe TPC design for searches must capture true events with high efficiency while rejecting backgrounds to the greatest extent possible. From this, three main challenges emerge:
-
1.
Determination of the total energy of each candidate event with near-intrinsic resolution. Our target goal is to measure the energy with a resolution better than 1% FWHM at . This energy resolution goal can be met using secondary scintillation or electroluminescence (EL).
-
2.
Determination of the complete topology of each event in 3-D, based on energy-sensitive tracking of the decay electrons and identification of “satellite” deposits of energy. The 3-D localization requires efficient detection of the primary scintillation light to accurately define the start-of-the-event time, .
-
3.
Fabrication materials of sufficient radio-purity such that the background rejection capabilities of the HPGXe TPC provide the desired sensitivity.

The concept of a Separated Function TPC was proposed by Nygren in [43] and extended by Nygren and Gómez-Cadenas in the NEXT LOI document [36], proposing that tracking and energy measurements were carried out by different sensors. Figure 2.7 illustrates an asymmetric TPC with Separated Optimized Functions. An event, shown as a wiggly track, generates primary scintillation recorded at both planes (this is called the signal, following the slang used by the experiments searching for direct detection of Dark Matter). EL light generated at the anode () is recorded in the photosensor plane right behind it and used for tracking. It is also recorded in the photosensor plane behind the transparent cathode and used for a precise energy measurement.
To understand the advantages of the SOFT approach consider first the case in which both the cathode and the anode are instrumented with PMTs. Recording S1 at any point in the TPC requires PMTs optimizes for detecting single photoelectrons (e.g, high gain). Instead, recording the light pattern that defines a track with the anode PMTs requires, in general, lower gain, to avoid saturation (since a lot of light is produced very near the PMTs). Furthermore, the energy of the event can be measure with relatively sparse coverage, while a detailed tracking may require a denser coverage. If the TPC is designed as non SOFT (e.g, a symmetric TPC with the same instrumentation in anode and cathode) it is difficult to reconcile this conflicting requirements. Instead the SOFT paradigm would prescribe to instrument the anode with a dense array of small, low-gain PMTs and the cathode with a sparse array of large, high-gain PMTs. It follows that the separation of functions allows optimizing the TPC performance. The next step may be to decide that the anode PMTs can be replaced by other sensors. In our design SiPMs are chosen on the grounds of low cost, low expected radioactivity and good sensor response.
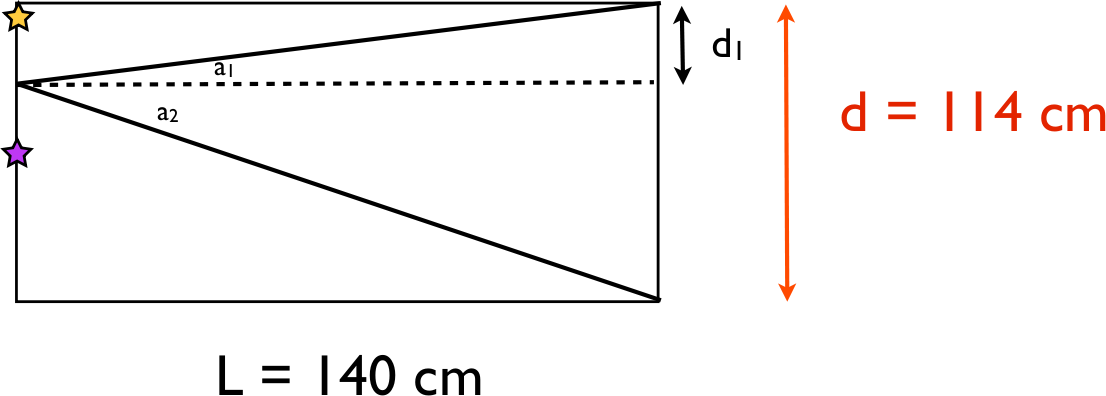
An important question is the radial dependence of the light collected in the PMT plane. The notion is illustrated in Figure 2.8. A photon impinging in the center of the chamber spans a solid angle:
As the track moves along the radius the fraction of the solid angle described by and changes according to:
Taking cm, cm, one obtains , in the center of the chamber. Taking a point near the border, cm, , . The solid angle span from the center is 3.7% of to be compared with the solid angle span from the corner, 3.0% of . The ratio between both points is 81%.


Figure 2.9 shows the light curves for tubes of reflectivity 50% and 95%. As it can be seen, the radial dependence is rather mild even for the poor reflectivity corresponding to the case of uncoated PTFE, and almost flat (except in the edge of the detector) for the target reflectivity of the ANGEL design (see chapter 3). The radial dependence can be fully corrected by mapping the ratio between light generated in the EL grids and light detected in the PMT plane. In addition to light maps generated by Monte Carlo simulation, low-energy photons of energies 100 keV can be used to obtain the correction from the data themselves. A demonstration of this technique will be exposed when we discuss the NEXT-1 prototypes.
Chapter 3 The ANGEL design
Our baseline design for the NEXT-100 detector is the Asymmetric Neutrino Gas EL Apparatus (ANGEL), an asymmetric high-pressure gas xenon TPC with separated-optimized functions (SOFT). The energy function is provided by PMTs located behind a transparent cathode and sealed inside pressure-resistant individual housings. The tracking function is provided by SiPMs (also known as MPPCs) located behind transparent EL grids and coated with TPB. The fiducial mass is chosen to be 100 kg, and the operative pressure 15 bar.
ANGEL has been chosen as our baseline following the principle of designing the simplest TPC that can result in a competitive physics program in the shortest possible time. As a consequence, we have opted for solutions that require little or no additional R&D on top of the program already under way with the NEXT-1 prototypes.
Since the number of parameters that define the detector is large, it is useful to describe the design examining the detector from different angles. This are: the choices relatives to the target; those related with the pressure vessel; those related with the field cage, high-voltage and EL grids; the energy plane; and the tracking plane.
3.1 Source mass
The source mass of the NEXT experiment is gas xenon enriched in the isotope. In the ANGEL design the xenon is also used as electric insulator. As such, an annulus of 4 cm radius around the field cage is needed to insulate the high voltage. This choice has the drawback that a significant amount of valuable enriched xenon is wasted. It could be avoided by enclosing the fiducial volume inside a xenon vessel, and using an additional, cheaper gas (such as nitrogen) as electric buffer. However, the use of such a vessel implies a considerable complication from the engineering point of view. The first problem is the choice of the construction material for the vessel, which must be non-conducting and radiopure. Kevlar or acrylic glass are among the possibilities. The latter is more radiopure, but xenon diffusion into the buffer gas may be an issue. The enriched xenon and the buffer gas must be kept at the same pressure (in fact the buffer gas must track the pressure of the xenon, to avoid a transient that could break the xenon vessel). Two gas systems are necessary. Safety systems must be duplicated. If the optical sensors (PMTs and SiPMs) are to be placed outside the xenon vessel one needs transparent interfaces (acrylic coated with TPB could be used here).
While all the above is feasible, it requires considerable R&D and increases both the cost of the detector, the time needed to build it, and the uncertainties on rapid commissioning. Consequently we have opted for the simplest system for the baseline, assuming a fiducial mass of xenon of nearly 100 kg, for a total mass of almost 120 kg (see Table 3.1). The nominal operative pressure is 15 bar and all systems will be designed accordingly. Nevertheless, if we need to operate in the initial run with a total of 100 kg (about 70 kg in the fiducial region), the operating pressure will be reduced accordingly to about 12.5 bar.
The LSC has procured already a 100 kg of xenon enriched at in the isotope from russian suppliers, taking advantage of the coordination provided by JINR (a group of this laboratory is part of NEXT). The purchase conditions are extremely favorable at present, and could be kept if a further order is placed in a short period. The NEXT collaboration will actively seek for additional funds to purchase as much enriched xenon as possible in as short term. Ultimately a large mass (of the order of 1 ton) is necessary to compete with the other xenon-based experiments, EXO and KamLAND-Zen.
| Fiducial Radius (cm) | |
| Fiducial Length (cm) | |
| Total Chamber Radius (cm) | |
| Total Chamber Length (cm) | |
| Fiducial Volume (m3) | |
| Fiducial Source Mass (kg) | |
| Total Source Mass (kg) |
3.2 The energy plane
In ANGEL the energy measurement will be provided by the detection of EL light via PMTs, which will also record the scintillation light needed for . Those PMTs will be located behind a transparent cathode.
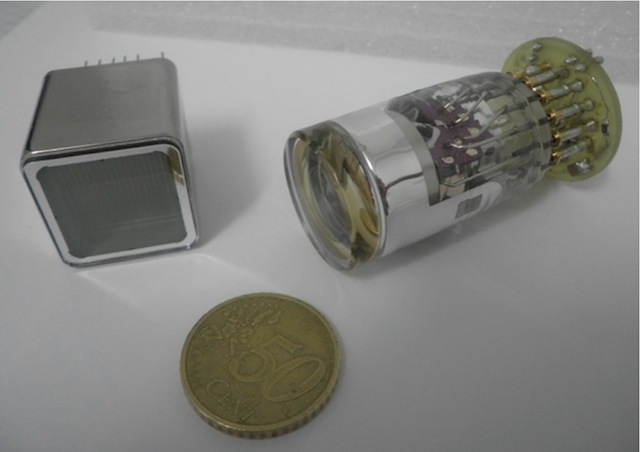
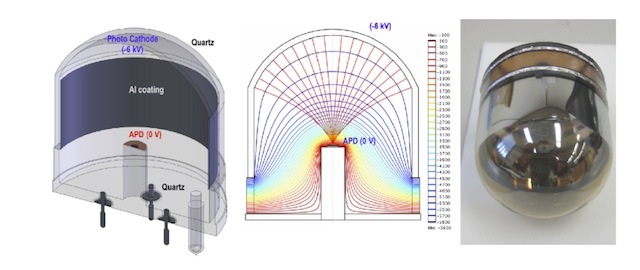
The PMTs used for the NEXT-1 prototypes are Hamamatsu R7378A. This small sensors (1 inch diameter) are sensitive to the VUV emitted by xenon and can resist pressure up to 20 bar. Unfortunately, they are quite radioactive, about 50 mBq per unit of the uranium and thorium chains. Hamamatsu has another small PMT (1”) which is both radiopure (0.5 mBq per unit) and sensitive to xenon VUV light, the R8520-406. This PMT, square in shape, can take up to 5 bar. Both PMT models can be seen in Figure 3.1. The bigger (3-inch diameter) R1141MOD from Hamamatsu (Figure 3.2) has levels of 214Bi and activity per unit of area smaller than that of the R8520. It has been developed for use in cryogenic noble liquid detectors for dark matter searches and cannot resist high pressure. A more ambitious possibility —suitable perhaps for an upgrade of NEXT— would be the QUPID (Figure 3.3), which features high QE (33%) and even smaller background, 0.5 mBq for the U chain and 0.5 mBq for the Th chain.

3.2.1 PMTs and pressure
The R8520 cannot be used at our baseline pressure of 15 bar, and is probably risky to use it at its nominal pressure of 5 bar, due to the possibility of failure after several cycles of vacuum-pressure (we have observed this phenomenon in the R7378A, in spite of the fact that the PMT has not operated at a pressure higher than 10 bar).
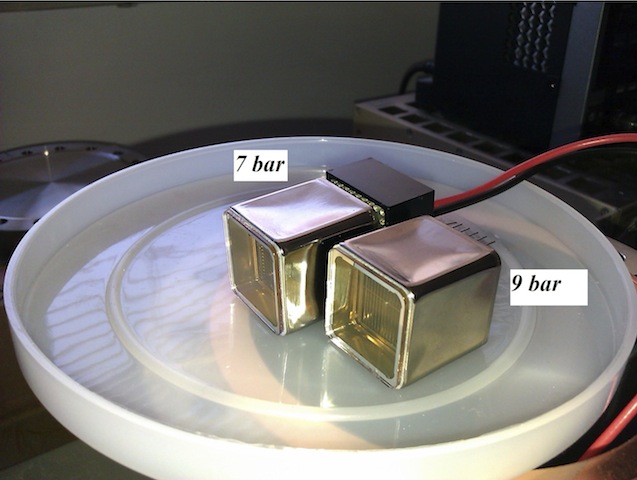
The collaboration has studied a number of PMTs reinforced by Hamamatsu. These samples were placed under high pressure in argon, and single photoelectron data was taken. The tests show that the metal body shrinks for pressures above 6 bar. At 7 bar the effect becomes visually apparent, and at 9 bar the shrinking is such that the side surface moves more than 1mm inside the PMT volume (see Figure 3.4). After being few hours at 9 bar, the PMT stops functioning. It appears as if the PMT sealing is still good, but the shrinking causes a short circuit inside the device. Further tests will be conducted during the next few months. However it appears unlikely that the R8520 can operate reliably at high pressure during long periods.
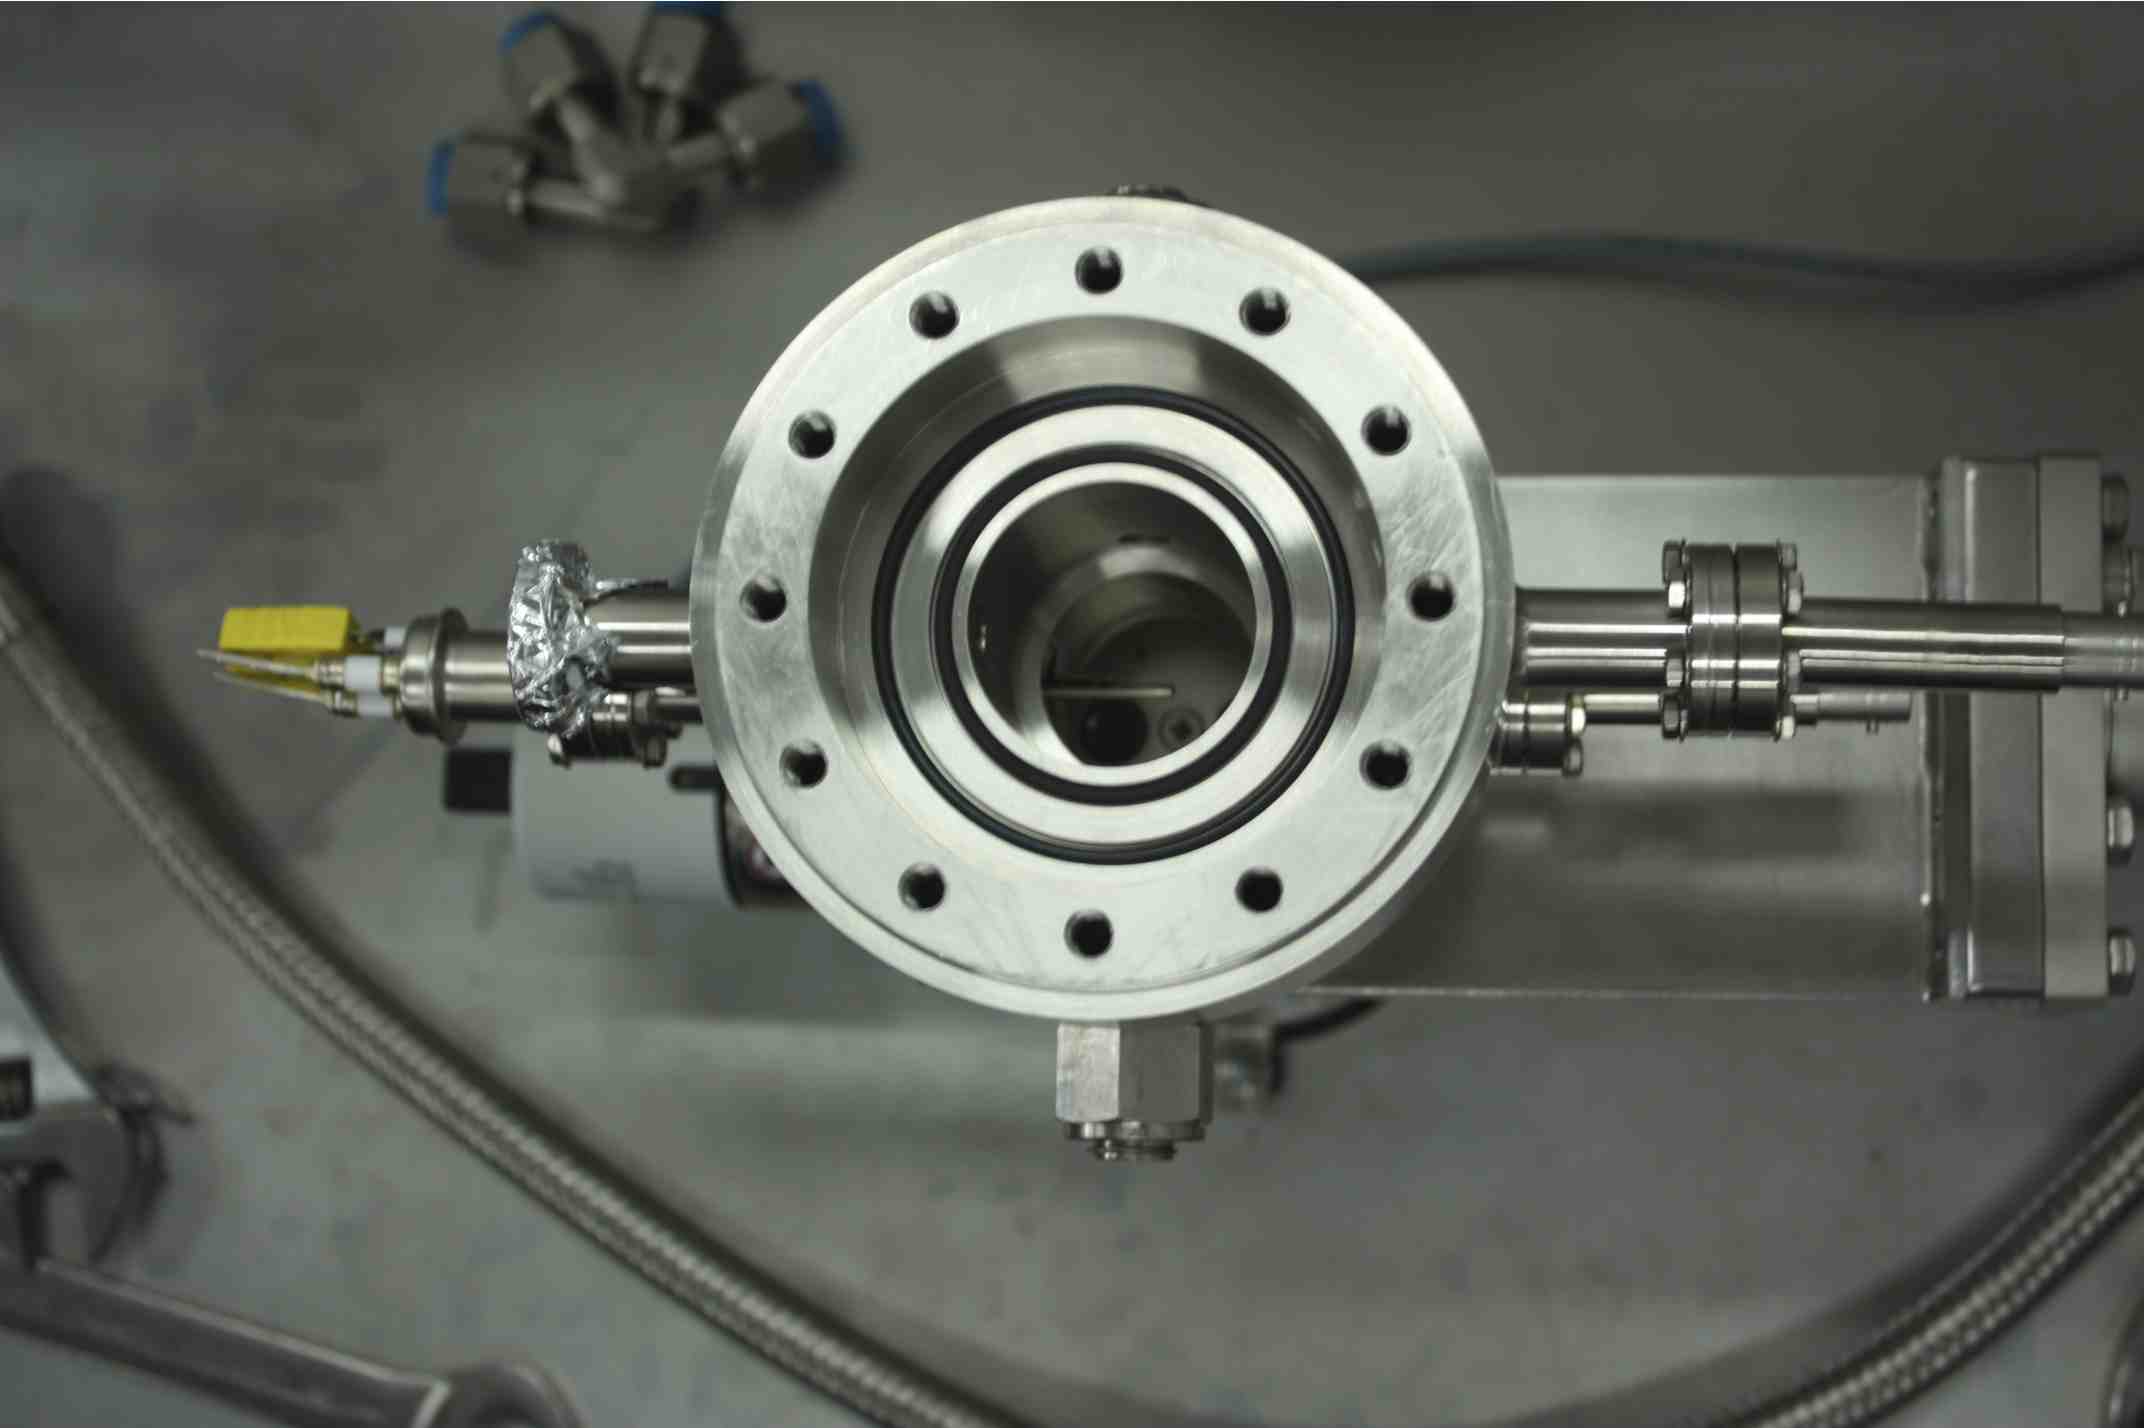
If the PMTs cannot be directly operated under pressure, the obvious solution is to leave the devices outside of the pressurized volume, viewing the chamber through a transparent, pressure-resistant window. This concept was tested in the IFIC’s NEXT-0 detector (Figure 3.5), where a quartz (fused silica) window, 15 mm thick, that can resist pressure up to 15 bar, seals the fiducial volume. Clear EL signals were observed in a R8520 PMT optically coupled to the window.
Sapphire is a better material than quartz to build large windows (it has a 10 times higher tensile strength). While UV-grade sapphire is available, it is also possible to coat the windows with TPB, that will shift the VUV light to blue.
With the PMTs protected in their houses it is possible to use either the R8520 or the R11410MOD. In the first case, one would house 4 small PMTs in each individual housing. At present we have not yet made a final decision about which type of PMT to use although it appears likely that the first run uses the R8520, which appears to be more readily available than the R11410MOD.

3.2.2 How many PMTs?
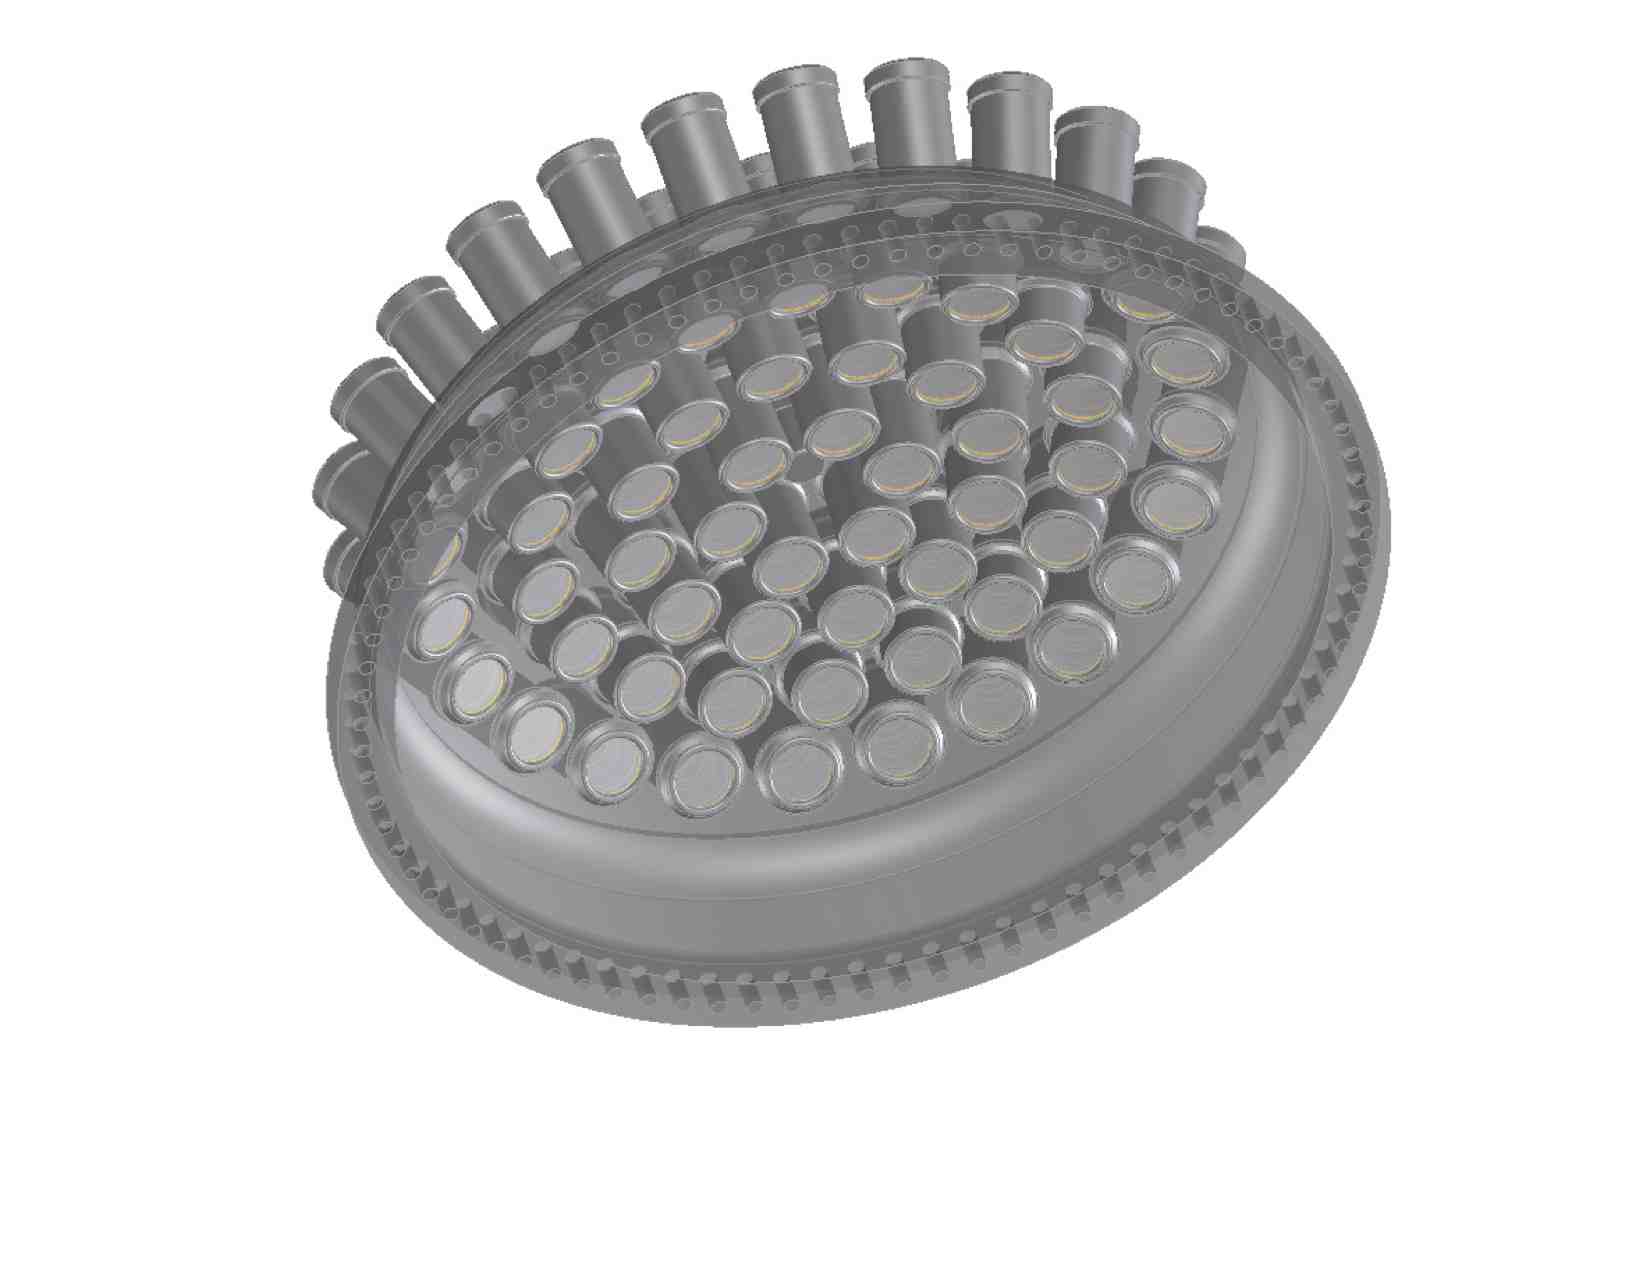
To answer this question let’s first consider the detection of scintillation light. The number of photons that arrive to the PMT housing windows depend of the properties of the reflector as well as the transparency of the EL grids. Our simulation shows that a light tube of 50% reflectivity (which could be made of uncoated PTFE) transfer 3% of the photons produced in the EL grids to the cathode. A light tube of 90% reflectivity (made of PTFE coated with TPB) will transfer 9% of the photons.
Assume now that an event is produced near the EL grids (the worst scenario for the detection of primary scintillation light with the cathode PMTs). Recall from Eq. (2.7) that 13158 scintillation photons are produced per MeV. Then the number of photoelectrons (pes) detected by the PMTs at the cathode is:
where is the cathode coverage, is the reflector transfer function, is the housing window transfer function and is the PMT quantum efficiency. Monte Carlo simulation yields for a sapphire window coated with TPB. Then, setting (R=50%) and we obtain:
While for a light tube of 90% reflectivity we have a factor 3 more, pes/MeV. Thus a reflector of allows to detect S1 in the full chamber range up to energies of about 100 keV. This is important, not only to study the lower part of the spectrum, but also to trigger in low energy gammas sources for detector calibration.
Consider now EL light. According to Eq. 2.22, we need at least 10 pes per primary electron to optimize resolution. ANGEL optical gain is near . The number of pes per electron for 15% coverage and 50% reflector is:
Here one can immediately see that, in order to fully exploit the potential of the PMTs we need a extra factor of 3 that can come either from a 90% reflector or doubling the coverage to some 30%.
3.3 The tracking plane
In ANGEL the tracking function is provided by a plane of photo-sensors operating as a light-pixels and located behind the transparent EL grids. In addition to position information tracking pixels need to provide a rough measurement of the energy (since we are interested in measuring the energy per unit length of the track), but they can have much less resolution than PMTs. In exchange, they must be smaller, since physics dictates a pitch of around 1 cm (while the PMTs have a diameter of 7.5 cm). They also must have much less radioactivity and cost per unit, since they are needed in large numbers (5,000 to 10,000 depending on the pitch).
3.3.1 MPPCs


|

The best option for light pixels at present appears to be the so-called Silicon Photomultipliers (SiPMs), also called Multi-Pixel Photon Counter (MPPCs) by Hamamatsu (Figure 3.8). MPCCs are cheap when delivered in large quantities (about 10 euro per unit), have large gain (close to ), Figure 3.9) and very low levels of radioactivity (a MPPC is a 1 mm2 piece of silicon).
3.3.2 Coating MPPCs with TPB

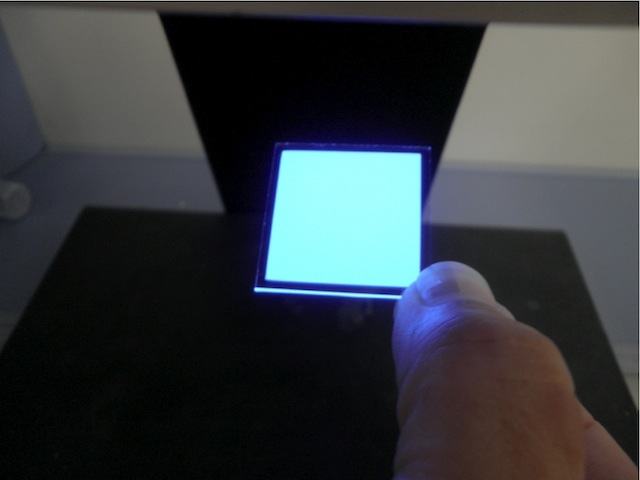
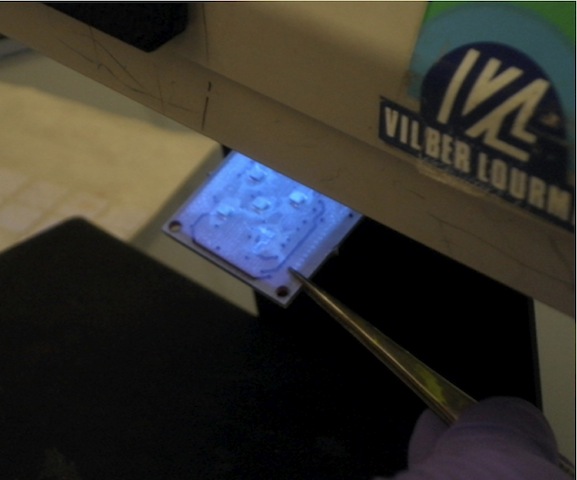

The main drawback of SiPMs is that they are not sensitive to VUV light (their particle detection efficiency, PDE, peaks near the blue, as shown in Figure 3.10) and therefore it is necessary to coat them with a WLS, such as terphenyl-butadiene (TPB) to shift the light to blue, where SiPMs are most sensitive. The procedures is illustrated in Figure 8.27, which shows how a TPB-coated glass (and a TPB coated SiPM board) glows with blue light (emitted by the TPB) when illuminated with VUV light. Figure 8.38 shows the response of TPB-coated SIPMs compared with that on non-coated devices. Notice that the response of the uncoated SiPMs at low wavelengths is about a factor 10 lower than that in the blue region. With coating, however, the response increases by a factor 3, making light detection with these detectors feasible.
3.3.3 Implementation of the tracking plane
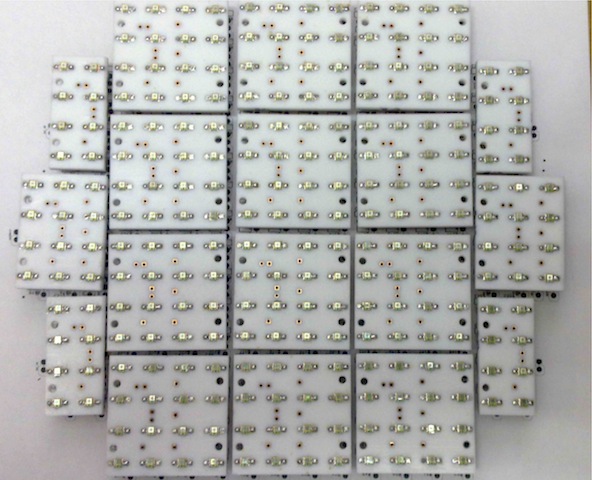
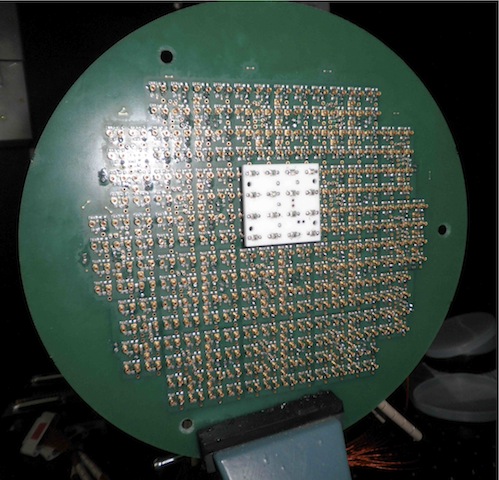
Figure 3.13 shows the implementation of the tracking plane in the NEXT-1-IFIC prototype. The SiPMs are mounted in daughter boards (DB), made of cuflon, (PTFE fixed to a copper back plane). Most DB mounts 16 SiPMs. The DB are connected to a Mother Board (MB) that distributes signals and power to the SiPMs. Each DB is coated with TPB in a facility available at ICMOL, an institute near IFIC before installation. A total of 248 SiPM are mounted in the MB, located 2 mm behind the anode grid.
The ANGEL design will be a larger version of the NEXT-1 tracking plane. We plan to build DB holding 64 SiPMs each in an array of 88. About 160 such DB (assuming a pitch of 1 cm and 10,000 SiPMs) will need to be mounted and coated with TPB. Each DB will have its own biasing and the signals from the SiPMs will be amplified and serialized inside the chamber, before being dispatched via optical link (see chapter 7).
Tracking with MPPCs
SiPMs generate nearly uniform single photoelectron (spe) pulses. However, the uniformity of the SiPMs noise pulses and the large intensities of tracking signals allows to set a digital threshold (at about 5 p.e) high enough to eliminate almost all noise, without degrading the spatial resolution.
Each primary electron entering the meshes produces EL light for a time interval given by the gap size divided by the drift velocity. For E/p 3.5 kV/cm bar, this time interval is about 3 s. Typically, 600–1200 electrons contribute to the track imaging at any moment. Tracks less parallel to the TPC axis contribute the higher number of electrons within the EL gap. With so many primary electrons per mm, the statistical contribution to spatial resolution is 1 mm rms, even for the maximum possible diffusion within the chamber.
With an EL gain of around 3000 and a track population of 1000 electrons within the EL meshes, the total EL luminosity is in the range of photons per s (counting only the forward-going photons). A detection element of 1 mm2 at a distance of 5 mm from the luminous region will subtend a solid angle fraction of 0.003. Hence, about 3,000 photons per s will impinge on such a 1 mm2 detection area. From the measured response of the coated SiPMs (Figure 8.38) we take a transmittance of 30% at 170 nm relative to the peak transmittance in the blue region. The PDE in the blue is about 50%. Therefore one expects to record about 500 p.e. per s, plenty for good tracking.

In a more quantitative way, Figure 3.14 shows the Monte Carlo simulation of the light received in an array of 4 SiPMs (labeled (0,0), (0,1), (1,0) and (1,1)) when gammas of various energies produce light in an EL region of 5 mm at of 4. In each case the signal is shown for the four SiPMs of the array as a function of time. A suitable cut to get rid of the dark current in a SiPM is 3–4 p.e., thus, with a count of 7 p.e, for the 1 keV case, the SiPMs are sensitive to small energy deposits.

Figure 3.15 shows a Monte Carlo simulation of an event tracked by SiPMs. The light background collected by cells outside the track is at most 10-4 of the total track, and 10-5–10-6 for most cells.
3.4 Pressure Vessel
The construction material chosen for the pressure vessel is pure titanium, ASTM grade 2 or grade 3 (depending on the final results of the material screening now being carried out at the LSC). The choice of titanium over pure copper (ASTM oxygen-free copper C11000), material traditionally used in low background experiments, is motivated by engineering reasons. Although finite element simulations indicate that it is possible to build a vessel made of ultra-radiopure copper, the material is not contemplated in the ASME code and standards, which will be followed through in the construction of the vessel. The use of ASME, one of the most widely accepted standards, in particular for the construction of pressurized vessels is a must, in particular to guarantee successful performance in a risk analysis, compulsory for the underground operation of the experiment.
| Titanium | Copper | ||
| Thickness (mm) | Cylindrical Shell | 5 | 30 |
| Torispherical head | 12 | 50 | |
| Flange | 90 | 140 | |
| Mass (kg) | Cylindrical Shell | 227 | 947 |
| Torispherical head | 58 | 490 | |
| Flanges () | 401 | 1241 | |
| Total | 1932 | 7412 | |
| Activity (counts/year) | |||
As an example, table 3.3 collects the dimensions and weight of a pressure vessel made of grade 2 titanium and of OHFC copper, a material accepted by the ASME norm. Notice that the level of activity that one obtains for both materials is about the same (the specific activity of titanium grade 2 is taken from recent measurements at LBNL to be 200 Bq/kg, to be compared with 50 /kg for the OHFC copper). On the other hand, the titanium vessel material thickness, in particular for the flanges and the total weight are much more comfortable.
| Dimensions (mm) | Cylindrical can, inner radius | 570 |
| Cylindrical can, length | 1350 | |
| Cylindrical can, thickness | 5 | |
| Torispherical head, thickness | 12 | |
| Flange, thickness | 90 | |
| Mass (kg) | Cylindrical can | 227 |
| Torispherical head | 58 | |
| Flanges (4) | 401 | |
| Total | 1932 | |
| Activity in fiducial (counts/year) | 2.4 | |
3.5 Field cage, high voltage and electroluminescence grids
| Parameter | Value |
|---|---|
| E/P | 3.50 |
| Drift voltage | 0.50 kV/cm |
| Pressure | 15.00 bar |
| EL grid gap | 0.50 cm |
| Drift length | 130 cm |
| Grid voltage | 26.25 kV |
| Cathode voltage | 91.25 kV |
| Optical Gain | 2800 photons/e |
Table 3.4 describes the main parameters of the EL detector. We have chosen a drift voltage of 0.5 kV/cm, near the minimum of diffusion, and of 3.5 which gives large optical gain and an EL gap of 5 mm. This results in a grid voltage of 26.25 kV and a cathode voltage of 91.25 kV.

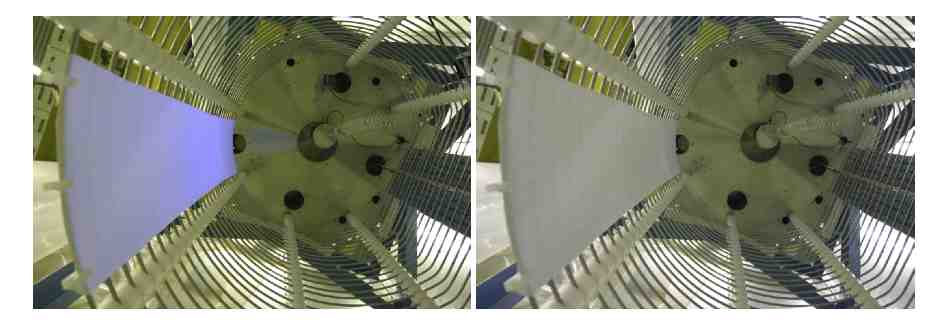
A section of the detector, showing the field cage (FC) can be seen in Figure 3.16. The FC will be made of copper rings connected by low background resistors. The light tube will consist of thin sheets of TetratexTM (TTX), fixed over a 3MTM substrate, following the approach of the ArDM experiment (see for example [59]) that will also operate at the LSC. We plan on a joint development in this and other aspects (e.g, low background PMTs) between both collaborations.
TPB can efficiently absorb the VUV radiation emitted by xenon and re-emit with an spectrum that peaks in the blue (Figure 3.17). TPB can be easily deposited in the 3M+TTX sheets by vacuum evaporation. The ArDM collaboration has measured ([59] ) a reflectance coefficient at 430 nm close to 97% for a wide range of coating thicknesses. In addition the light yields were measured at different time intervals, showing no evidence of aging in the time interval of 3 months.
High-voltage feedthroughs (HVFT) will be constructed using a compression seal approach as illustrated in Figure 3.18. A metal rod is pressed into a plastic tube (Tefzel or FEP, which have high dielectric strength) which is then clamped using plastic ferrules from both the pressure side and air side. A sniffer port is placed between the seals to assure that xenon is not leaking. This approach has been used in NEXT-1 where a cathode voltage of 40 kV has been achieved. A small prototype of the NEXT-1 feed-through was tested to 100 kV in vacuum and 70 kV in nitrogen at 3 bar. It has been demonstrated to be leak-tight at 10 bar xenon and 10-7 mbar vacuum. The design will be scaled up for NEXT-100 as needed.
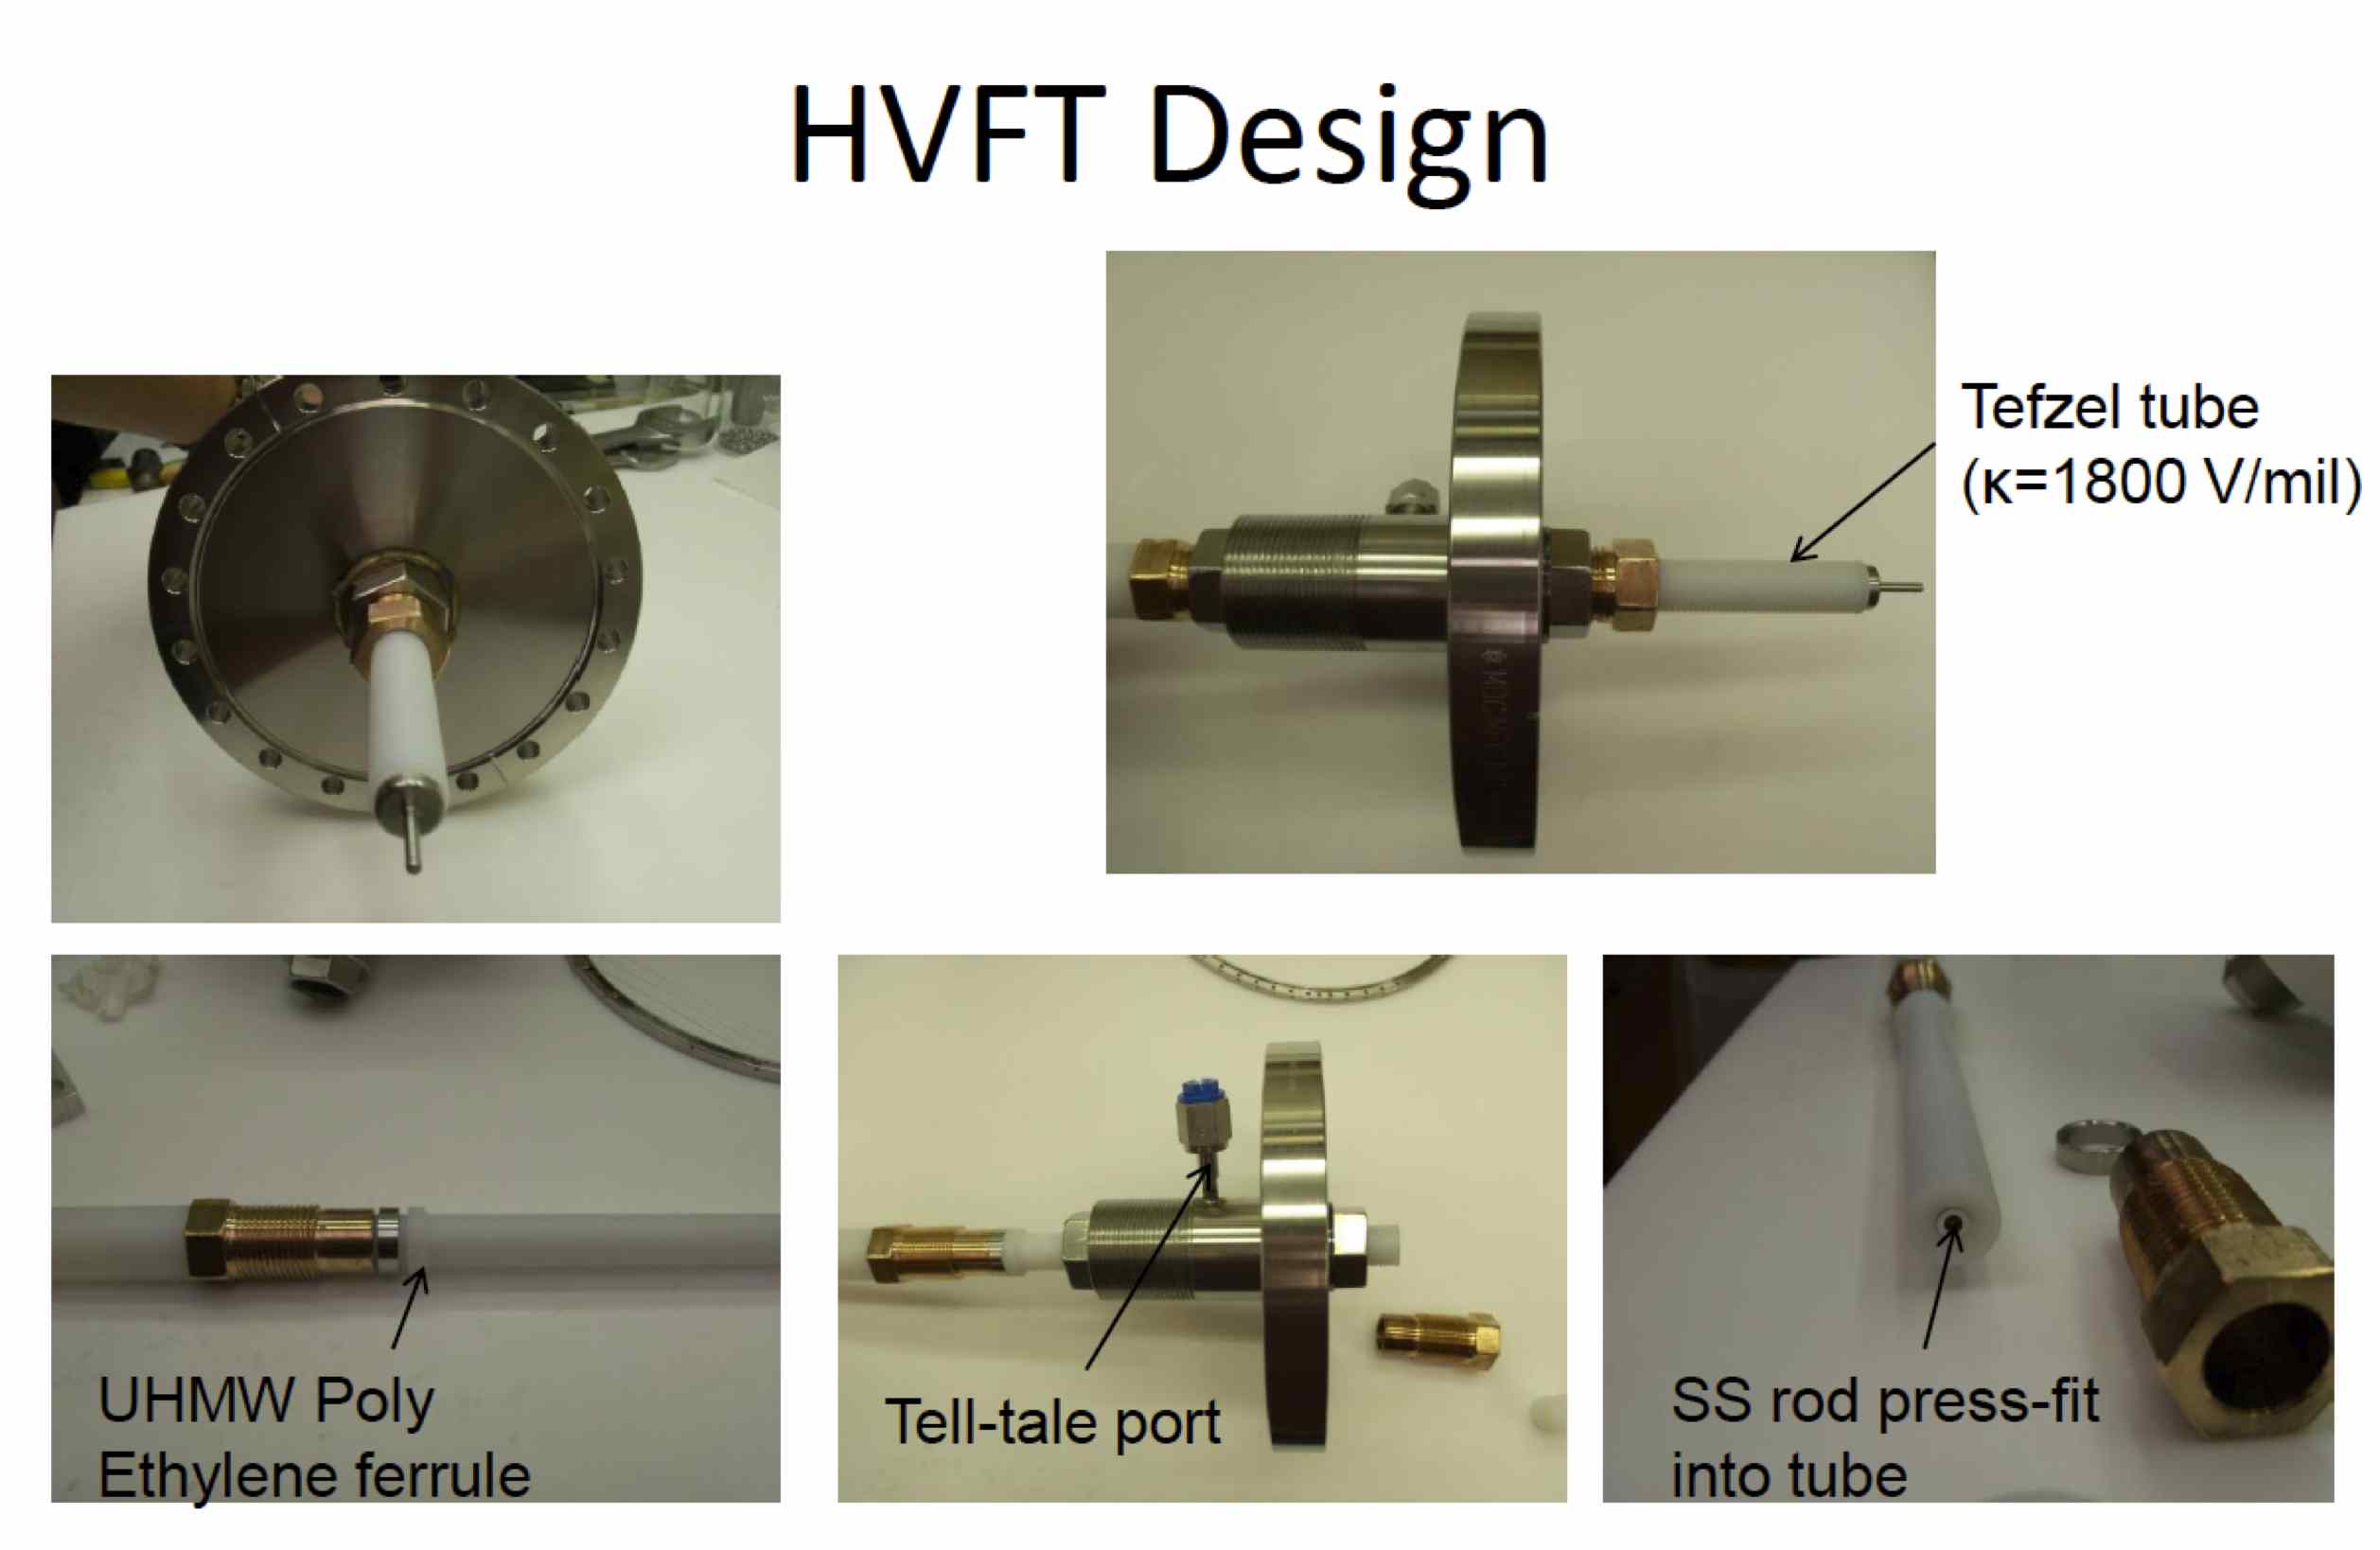
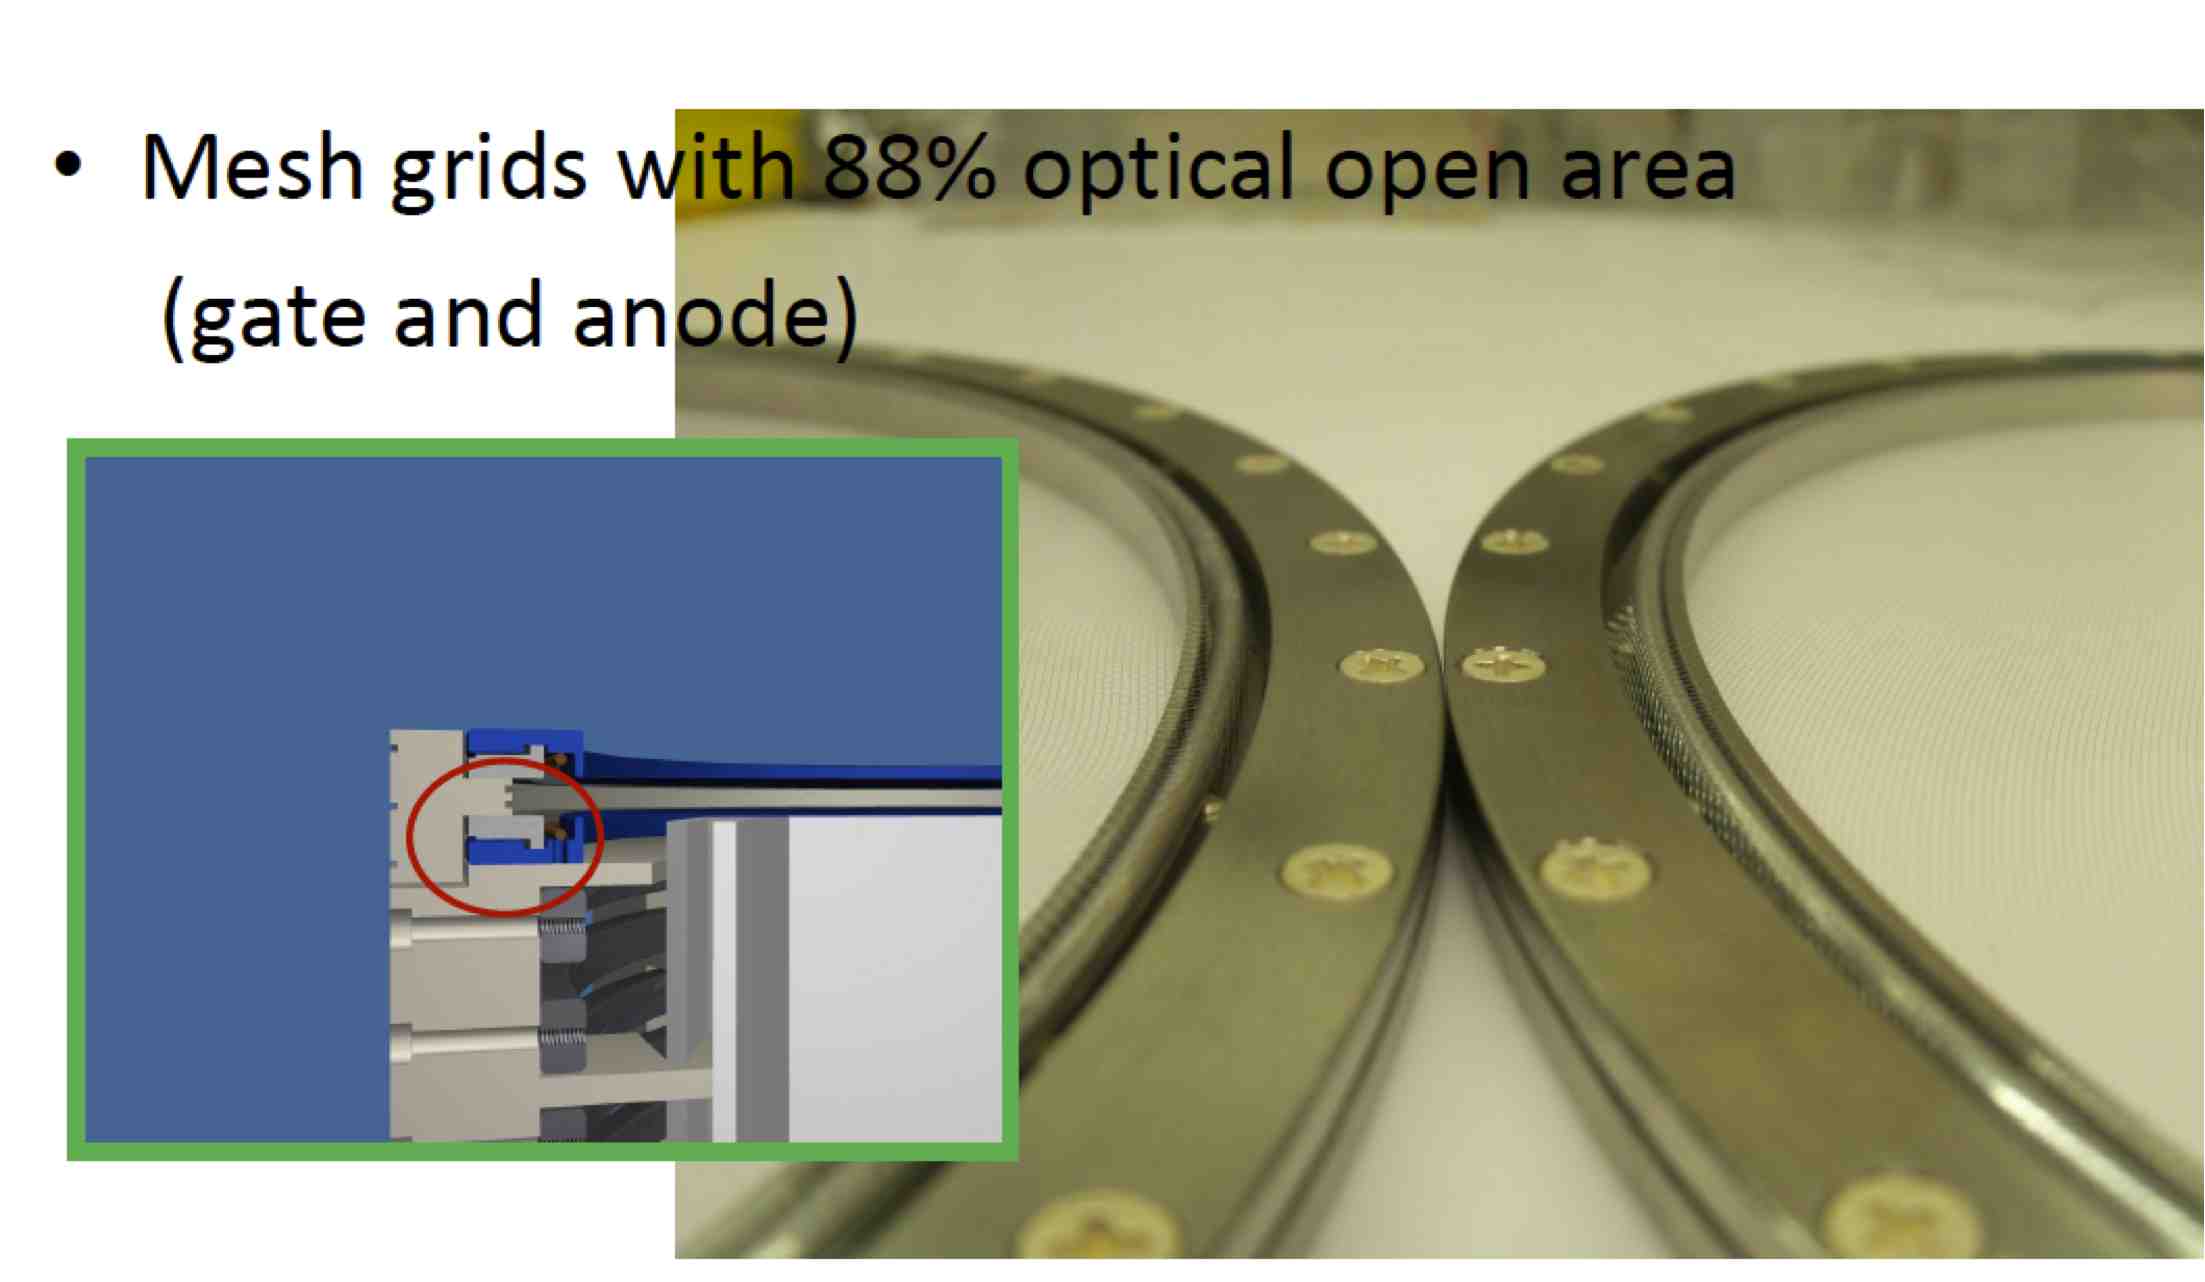
Figure 3.19 shows the EL grids built for the NEXT-1-IFIC prototype. The grids were constructed using stainless steel mesh with pitch 0.5 mm and wire diameter 30 microns, which results in an open area of 88%. The grids are formed by clamping in a ring with a tongue and a groove to hold the mesh and using a tensioning ring that is torqued with set-screws to achieve the optimum tension. There is considerable experience with this approach since the grids are similar to ones built for ZEPLIN II, LUX, and a number of other test chambers. The cathode and PMT shield will be wire grids with pitches of 0.5 to 1 cm to maximize open area. Again, the design will be based on previously constructed grids that are well understood. One important issue is that for the large diameter required in ANGEL, preliminary estimates show that the EL grids will bow as much as 1 mm given the modulus of elasticity of the mesh and required voltage. If this is verified and if the bowing introduces a systematic effect in the energy resolution that cannot be corrected (Monte Carlo studies are under way to assess this problem) several alternatives are possible. One possibility is to pre-stress the ground grid following the measured curvature of the HV grid. Another possibility is a design where the anode is composed of acrylic that is metalized with a transparent coating such as Indium-Tin-Oxide (ITO) and coated with TBP. In this case, the acrylic can be bowed to match the deflection of the gate grid to maintain a uniform gap. If this plate is coated on both sides, the anode side can be at positive HV and the back side grounded so that the SiPMs can still be close to the anode.
Chapter 4 The NEXT-1 prototypes
The main aim of the NEXT1 prototypes built at LBNL and IFIC is demonstrating NEXT energy resolution at reasonably high energies (e.g, using positron annihilation 511 keV gamma rays, 660 keV gamma rays and 1.1 MeV gamma rays). Some of the challenges in designing an electroluminescence TPC with near optimal energy resolution are:
-
1.
The total signal is distributed over many PMTs. Therefore accurate relative calibrations are needed for integration.
-
2.
Signal duration and amplitude depends on event shape.
-
(a)
Low drift velocity 1 mm/s.
-
(b)
Diffusion spreads out track signal: 0.3 mm/ longitudinal, 0.8 mm/ transverse.
-
(c)
Signals spread over time: minimum for tracks parallel to luminescence plane, maximum for tracks normal to luminescence plane (2.5 MeV electron track length 16 cm).
-
(a)
-
3.
Large electroluminescent gain and light collection/photo-efficiency is required to reduce the statistical error on photo-electron signals.
-
4.
Light collection efficiency depends somewhat on track radial position.
-
5.
Electroluminescent gain must be stable and uniform over the EL surface.
-
6.
Contaminants that quench signals must be controlled (gas purification).
-
7.
Xenon light emission is at 173 nm, in the VUV region; this requires quartz-window (VUV grade) photodetectors, or coated windows.
-
8.
Energy resolution is measured with high-energy gammas:
-
(a)
Compton events are predominant, leading to distributed energy.
-
(b)
Photoelectric events from gamma absorption are frequently (85%) accompanied by fluorescent x-rays in the 30 keV range.
-
(a)
Furthermore, the NEXT1 prototypes will study with detail the functioning of a SOFT TPC, with a PMT energy plane (both NEXT1-LBNL and NEXT1-IFIC) and a SiPM plane (NEXT1-IFIC). Last but not least, the detectors are intended as an R&D program to test the solutions proposed by the ANGEL design.
4.1 The energy function in the NEXT-1 prototypes

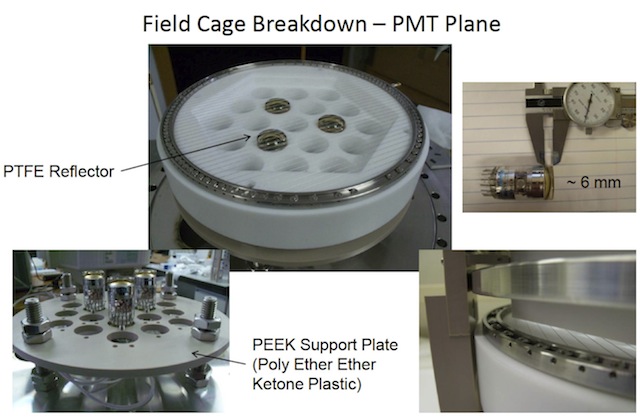
In both the LBNL and the IFIC prototypes the energy function is provided by a plane of 19 pressure resistant R7378A PMTs, capable to detect directly the 173 nm VUV light emitted by xenon. The PMTs also measure the event start time (). Figure 4.1 shows the energy plane fully assembled for the NEXT1-LBNL prototype, and Figure 4.2 shows details of the NEXT1-IFIC plane.
4.2 FE readout electronics for the PMTs

The FE electronics for the PMTs is almost identical for both systems. The first step is to shape and filter the fast signals produced by the PMTs (less than 5 ns wide) to match the digitizer and eliminate the high frequency noise which produces an unwanted ringing. The ringing, schematically shown in Figure 4.3, is shown superimposed to the fast PMT pulses.

The key concept to eliminate ringing is to realize that the phenomenon does not change the total charge, which should be measured rather than a fast voltage pulse. An integrator can be implemented by simply adding a capacitor and a resistor (50 in our case) to the PMT base (Figure 4.4). The pulse rise time is formed by the width of the PMT current pulse. The decay time is simply:
| (4.1) |

The effect of the charge integration capacitor shunting the anode can be seen in Figure 4.5. It lengthens the pulse and reduces the primary signal peak voltage to:
| (4.2) |
However the amplitude of the ringing component is not reduced since it does not affect the signal current!

Instead of feeding the ADC directly, the integrated signal is fed to an amplifier with much lower noise (Figure 4.6). Currently we are using Lecroy 660 A modules rented from the CERN pool. The signal-to-noise ratio of the single photoelectron PMT pulse sets the capacitance C and a low-pass filter is inserted at the output of the amplifier. This limits the signal bandwidth to sampling rate and reduces the total noise, since the amplifier has a greater bandwidth.

The low-pass filter is configured to provide the desired load resistance to the amplifier and attenuation to match the ADCs maximum input voltage. Furthermore, the amplifier provides additional attenuation at high frequencies. The result can be seen in Figure 4.7.
4.3 The NEXT1 prototype at LBNL
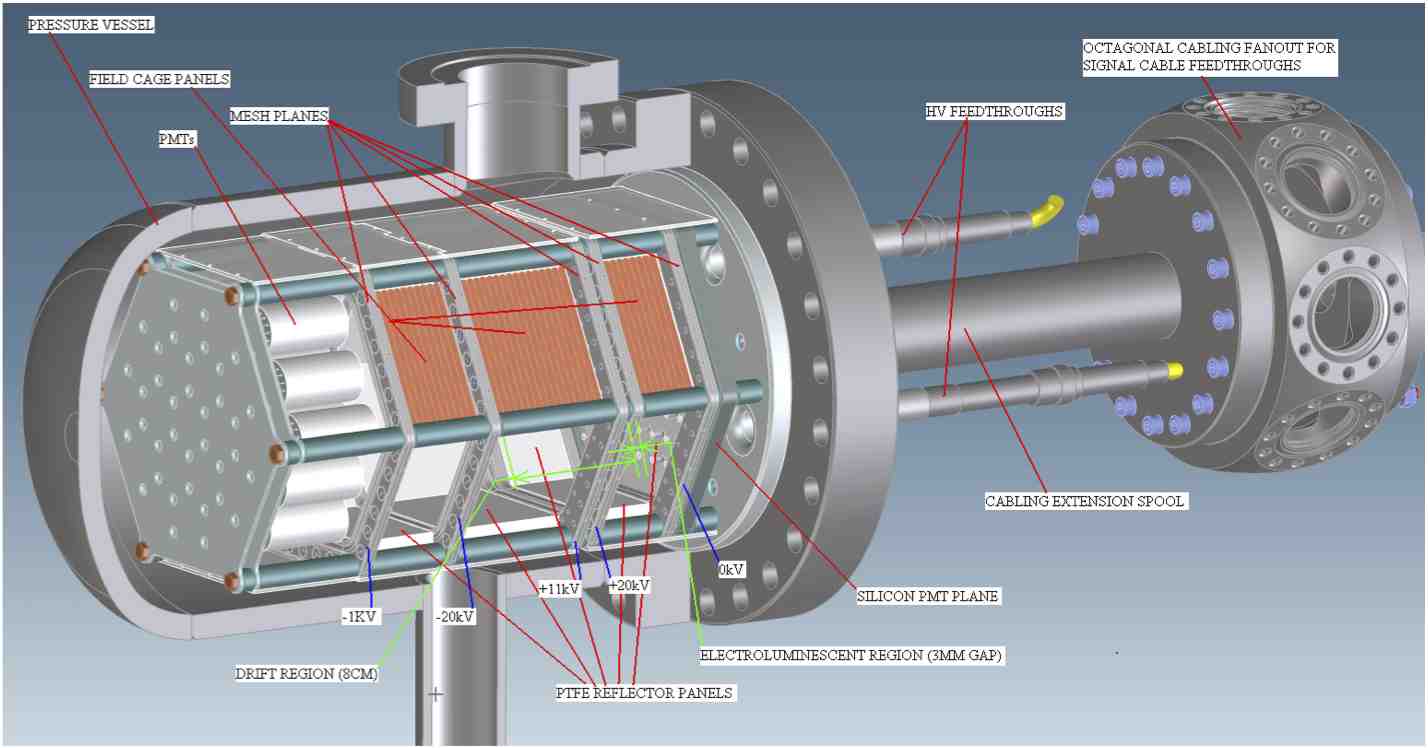
The LBNL chamber (Figure 4.8) has been optimized to operate at the largest pressures considered for NEXT (20 bar). Since our aim was to provide a quick benchmark for physics, the chamber was designed to be as simple and compact as possible. Thus, only an energy plane was constructed, using pressure-resistant PMTs but no tracking plane was built. The system is operational at LBNL since December 2010.
4.3.1 Gas system design and construction
The gas system, capable of handling up to 300 psig operating pressure, was designed with safety as a primary criterion. Engineering controls in the form of relief valves ensure that no overpressure hazard can occur in case of an operator error. Administrative controls, in the form of step-by-step detailed procedures, prevent the accidental loss/venting of the valuable xenon gas.
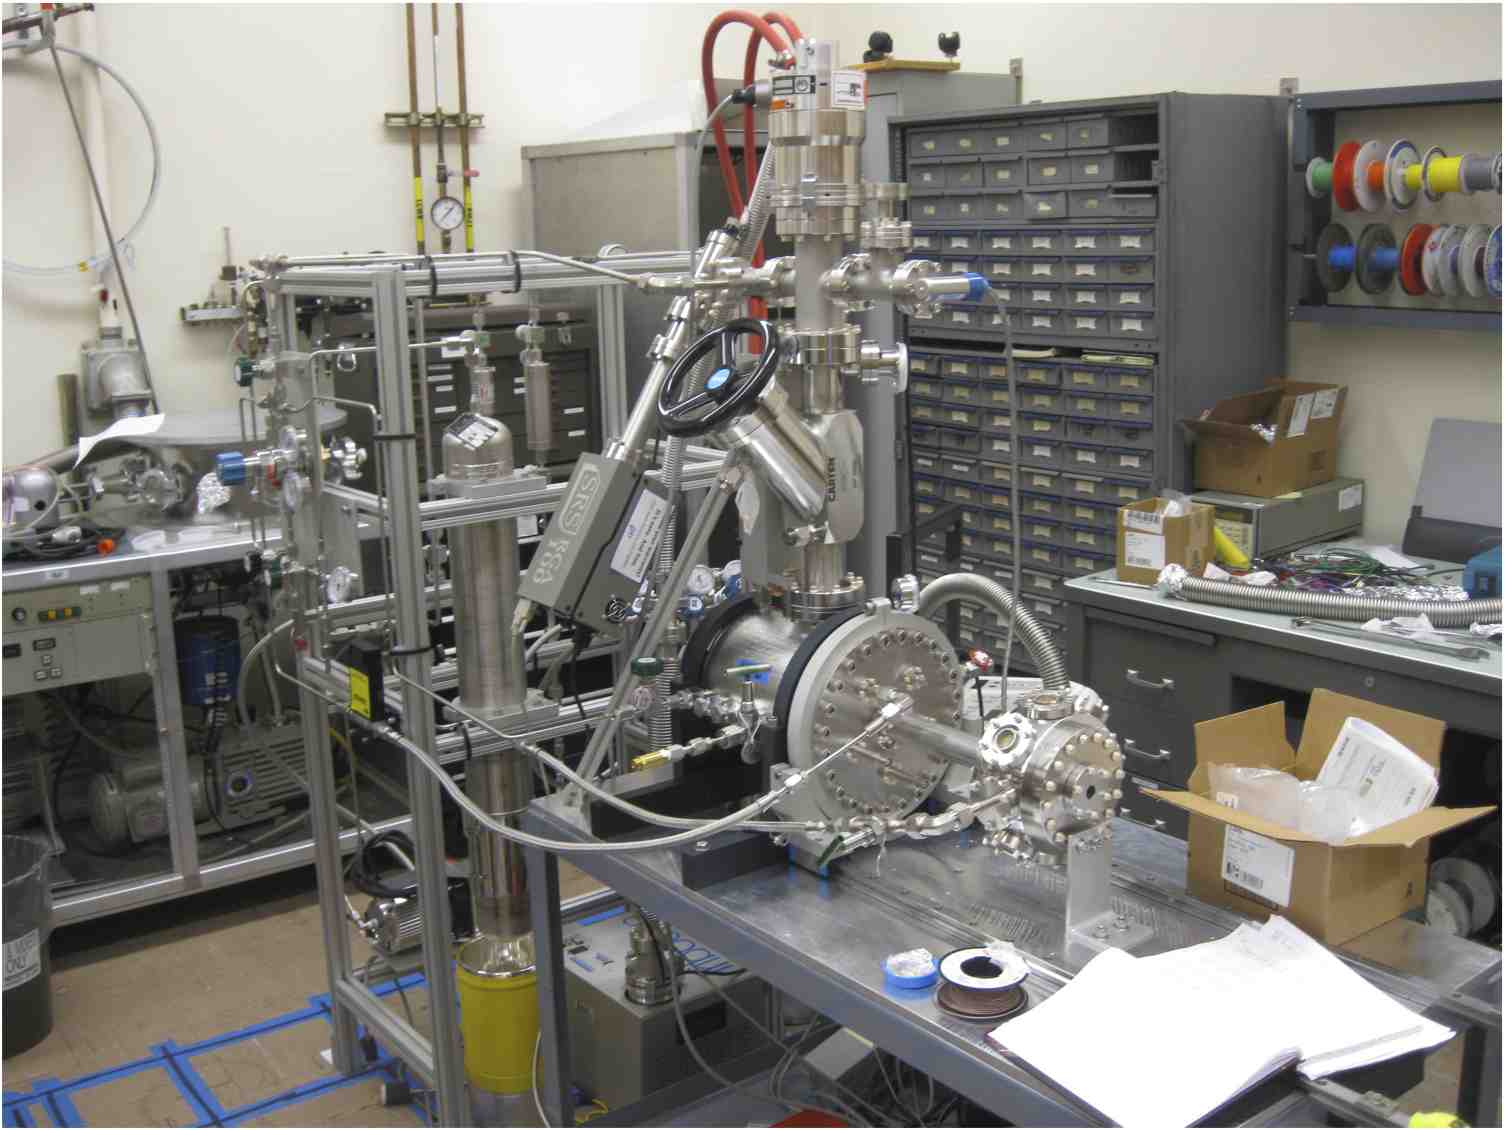
Figure 4.9 shows the full TPC. Most of the gas system is mounted on a separate structure adjacent to the TPC table. Above the TPC a large valve (rated for vacuum and high pressure) separates the TPC from the vacuum systems. The gas system is fully operational and is routinely operated near its maximum rated pressure of 17 bar.
4.3.2 Electroluminescent TPC
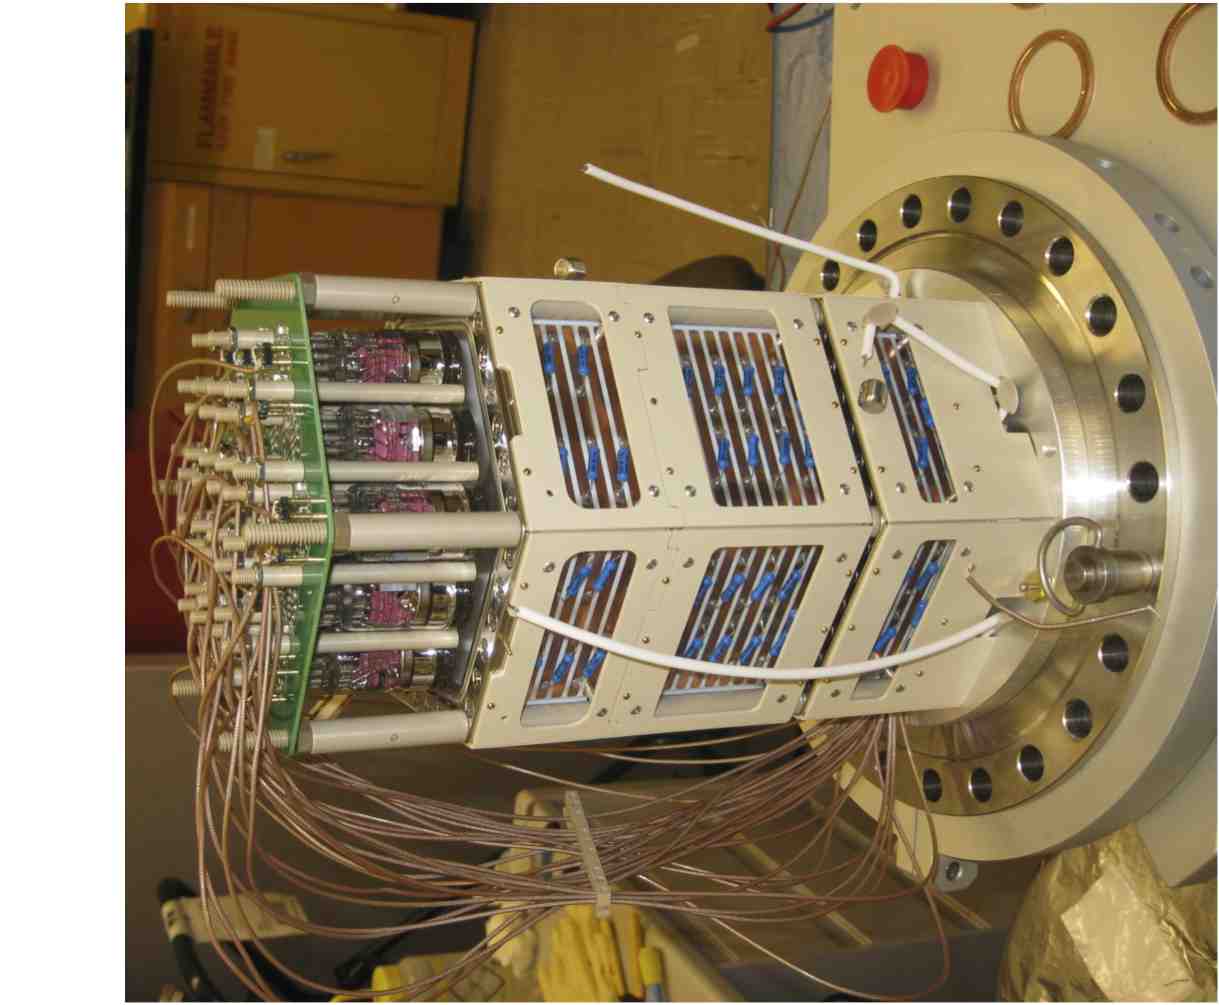
Five conductive meshes establish the electric potentials in the TPC. The walls of the TPC are made of PTFE, bare, on the internal side to reflect UV photons and with conductive stripes (at intermediate potentials) on the outside to establish uniform electric field lines along the TPC main axis (Figure 4.10).
All HV and signal cables come out through the main large flange for ease of assembly. Large HV for the drift and EL region come out through dedicated SHV feedthroughs directly on the main flange. PMT HV and signal cables come out through the central tube and through multipin feedthroughs on the sides of an 8-port vessel. The PMT array connects to a base-plane, with receptacles for the PMT pins and with electronic components for the PMTs’ voltage dividers. Capacitors on the last few PMT dynodes provide voltage stability for the long multi-photoelectron pulses expected from event size passing into a large-gain EL region. Differential signal sensing, with isolated grounds, has been implemented to avoid ground-loop noise.
Previous measurements by Bolotnikov et al. (using a small ionization chamber) showed a large dependence of the energy resolution in high pressure xenon on the drift electric field that is not fully understood, although a case can be made that the effect is an artifact of that setup. In the NEXT1-LBNL TPC the drift region is 8 cm long and the maximum HV on the dedicated feedthroughs is both 20 kV. It then allows us to measure the energy resolution for drift fields from 0 to 4 kV/cm (thus spanning the previously measured range) while maintaining a constant EL gain.
4.3.3 DAQ design, implementation and PMT measurements
The DAQ design for the 19 PMT array begins with low-noise amplifiers, close to the detector, as described above. These are connected to Struck digitizers by low-pass circuits that shape the fast PMT pulses (less than 5 ns wide) to match the digitizer sampling rate of 100 MHz. The Struck digitizer modules have genuine 13-14 bit resolution, and are read out through a VME controller card with USB output directly into a PC running Linux.
Currently we are using standard NIM modules for the amplification stage but plan to transition to a custom made solution based on commercially available preamp integrated circuits. The Struck 8-channel digitizer modules are controlled by provided firmware to provide trigger generation and determine the number of samples to capture per trigger, the amount of pre-trigger, and other functions.
In normal operation the trigger is formed by the logical-or of all the digitizer channels (one OR signal per 8-channel group). For each channel an amplitude or charge threshold can be used. A threshold at a few photo-electron level will be efficient for the EL signal and should have a very low noise-trigger rate. In calibration mode we use tagged Na-22 (two back to back 511 keV gamma rays. One of the gammas is tagged by a dedicated NaI scintillator/PMT detector) with a low threshold on the TPC signals; the other gamma is highly likely to have entered the active volume of the detector.
4.4 The NEXT1 prototype at IFIC
The NEXT1 prototype at IFIC is the second prototype of the NEXT-1 EL series. It is intended to fully test and demonstrate the baseline ANGEL design. Accordingly, NEXT1 is an asymmetric (non radiopure) SOFT TPC, with a SiPM tracking plane and a PMT energy plane. It extends both in size and in instrumentation the design of NEXT1-LBNL.
The detector has been built and commissioned, and data analysis has started. NEXT1 is conceived as an evolving prototype/demonstrator, that will allow us to fully test most of the solutions proposed for ANGEL. Specifically, we foresee the following stages (henceforth referred to as ‘Runs”).
-
•
Run I (March–September 2011): Commissioning and initial data taking with two PMT planes, one behind the cathode, the other behind the EL grids. Each PMT plane has 19 pressure resistant R7378A. The energy function is carried out by the cathode plane. The anode plane provides an additional measurement of the energy, important to study in detail the SOFT concept and coarse tracking.
-
•
Run II (October–December 2011): The SiPM plane has already been built and is being tested in an independent setup with several light sources, including a xenon lamp. In this way, the tracking plane will be fully debugged before being installed in the chamber in early July. Run II will fully demonstrate tracking with SiPMs as well as study the stability of TPB coating in the sensors. In Run II we will also take data with the final FE electronics for PMTs and the final DAQ that will be used by NEXT-100.
-
•
Run III (January-June 2012): The energy plane will be replaced, changing the R7378A inside the gas by a set of PMTs outside the chamber. The PMTs will be optically coupled to sapphire windows and will allow us to fully test the ANGEL design. In addition, the light tube will be changed from uncoated PTFE to TTX+3M foils, following the ANGEL design. Run III will show energy resolution in a system with housed PMTs will continue studying tracking with SiPMs and will study the properties and stability of a high reflectivity light tube.
-
•
Run IV (June 2012-December 2012): For Run IV the SiPM electronics will be located inside the chamber.
In our LOI we considered the possibility of a radiopure detector (NEXT-10) with a mass of about 10 kg as an intermediate detector between NEXT-1 and NEXT-100. However, such a detector appears today prohibitive in terms of costs, man power and, very importantly, time. Instead, NEXT-1 can be evolved as described above to provide not only a full bench test of the ANGEL design, but also the needed operational experience. Along this line some of the Runs of NEXT-1 (probably Run IV but perhaps also Run III) will, very likely, be taken at the LSC. In this way, we will gain experience and prepare the underground operation of NEXT-100.
4.4.1 Design and construction
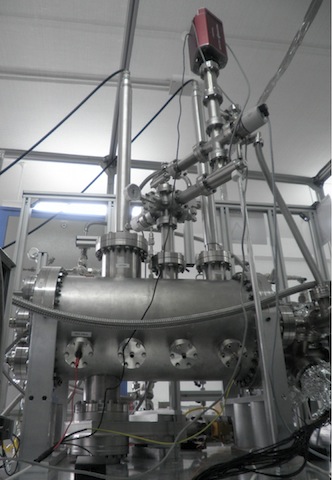
NEXT1-IFIC is presently the largest operational HPGXe TPC in the World. It can operate up to 15 bars, although the optimal operating pressure is 10 bar. The TPC fits inside a steel chamber 600 mm long and 300 mm inner diameter (Figure 4.11), fabricated by TRINOS Vacuum Systems, a company located in Valencia. The fiducial volume consists of a hexagonal cross-section, defined by PTFE reflector panels, 160 mm across the diagonal and 300 mm drift region. The electroluminescence region is made of two parallel grids separated by 5 mm. The maximum designed drift field is 1 kV/cm and the maximum electroluminescence field is 40 kV/cm. The energy plane (and the tracking plane during the commissioning phase of the detector) use Hamamatsu R7378A photomultiplier tubes (capable of resisting up to 20 bar pressure).
4.4.2 The gas system
The materials used for the vessel and the readout place outgas electro-negative impurities, which degrade the performance of the detector, into the Xe gas. The role of the gas system is to remove these. This is achieved by continuously re-circulating the Xe gas through a SAES Getters (MC500). All the gas piping, save for the inlet gas hoses and Getter fittings, are inch diameter with VCR fittings. The re-circulation loop is powered by a KNF diaphragm pump with a nominal flow of 100 standard liters per minute. At 10 bar this translates to an approximate flow of 10 liters per minute.
Considerable experience has been gained after the successful commissioning of three different large gas systems at LBNL, Zaragoza and IFIC. As a consequence, the CDR includes a full technical design of the gas system for NEXT-100 (See chapter on NEXT-100).
4.4.3 Field cage and light tube
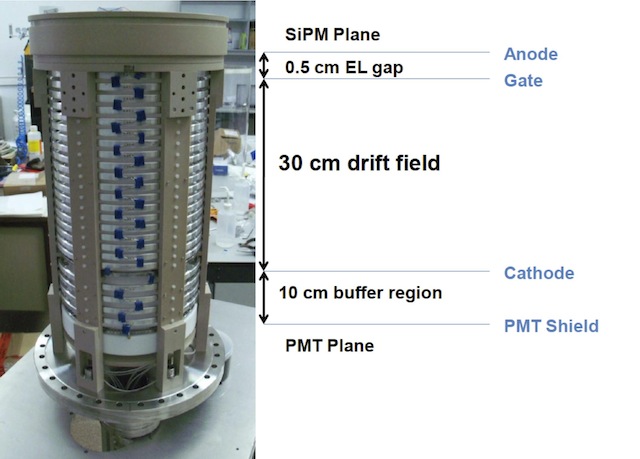
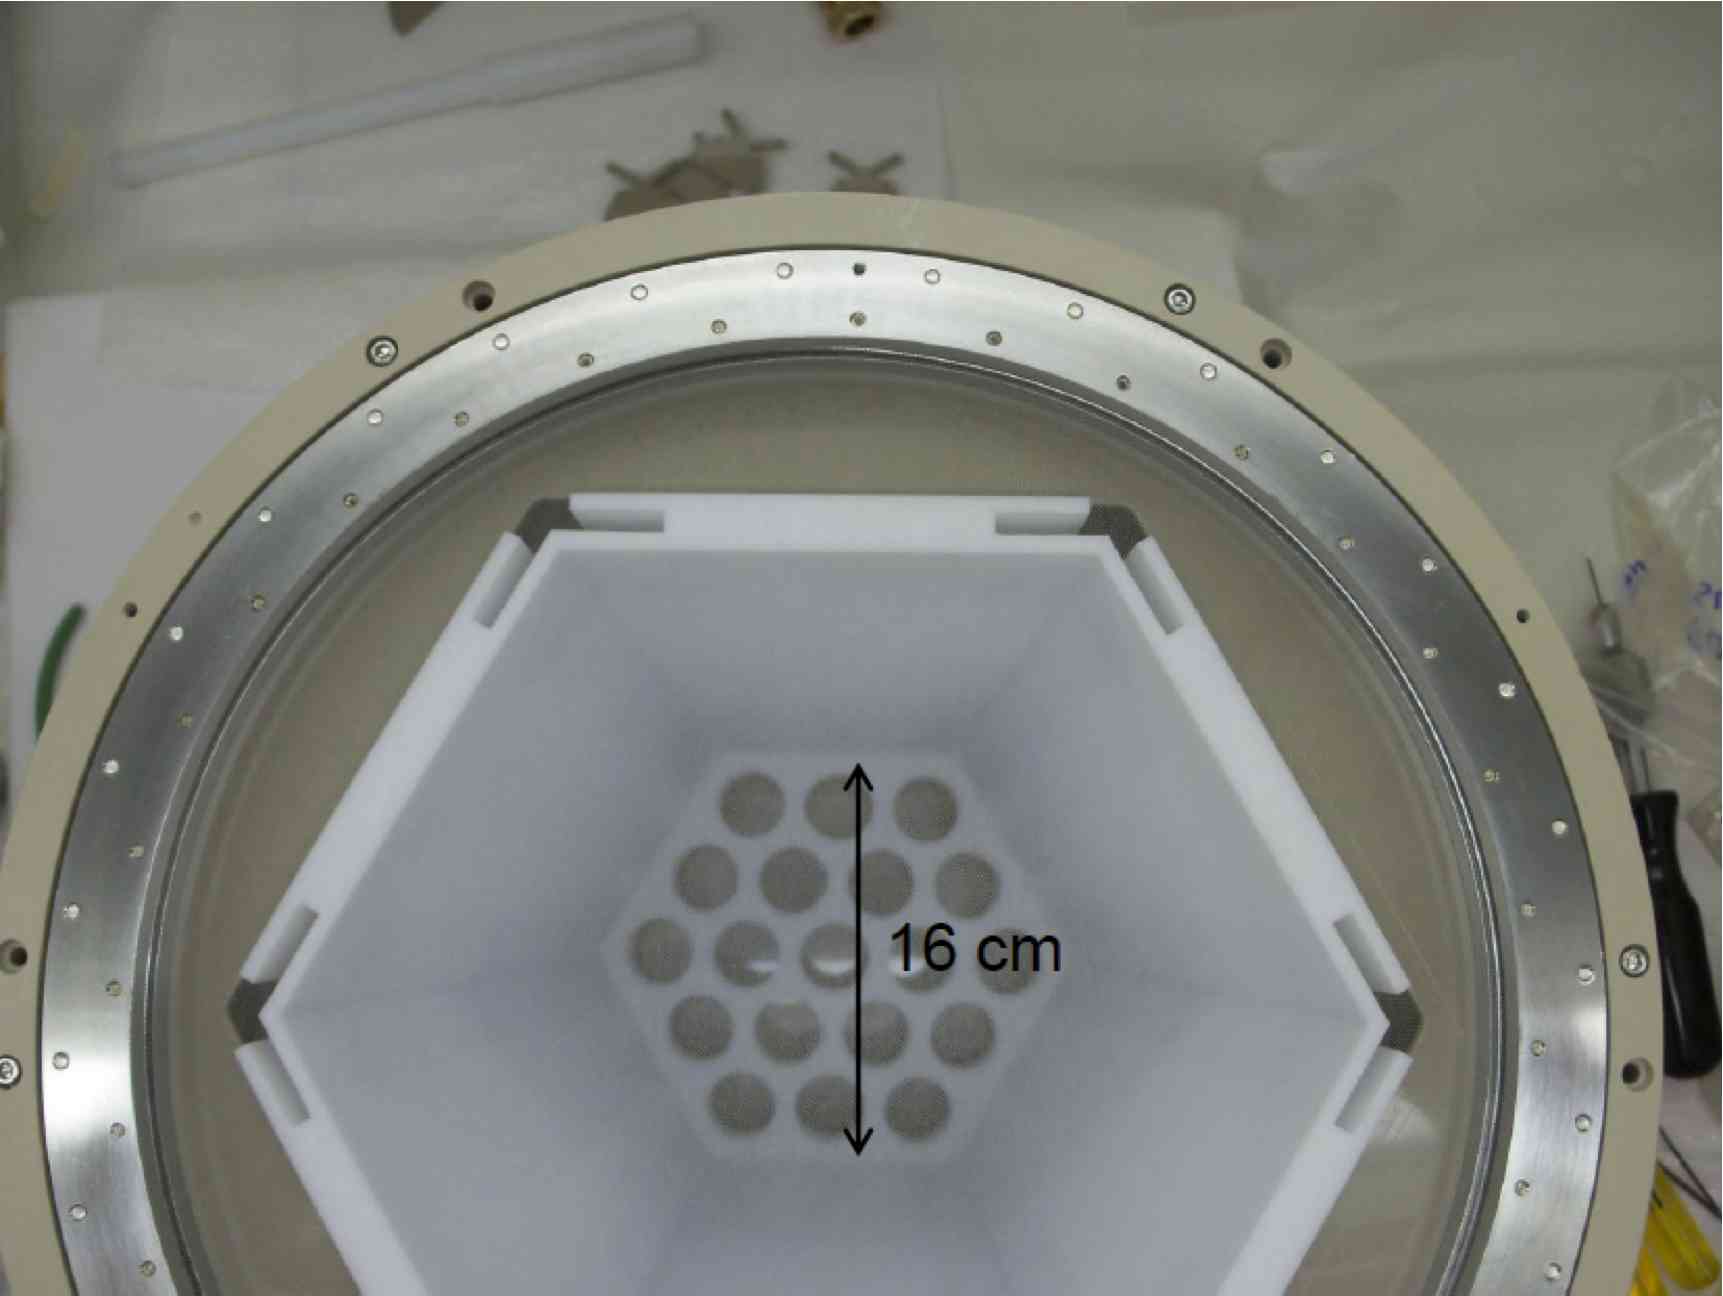
4.4.4 High voltage and feedthroughs
The High Voltage is supplied to the Cathode and the Gate, in the electroluminescence region, through custom made high-voltage feed throughs (HVFT), described in the previous chapter. These have been tested to high vacuum and 100 kV without leaking or sparking. The HVFT designed and built by Texas A&M (as the field cage), are shown in Figure 3.18.
The side of the chamber contains 8 CF40 size nipples. One set is located in the horizontal plane while the other . these contain radioactive source ports used for calibration of the TPC. The ports are made by welding a 0.5 mm blank at the end of a 12 mm liquid feedthrough. The radioactive source is then located on the outside of the detector.
4.4.5 The tracking plane
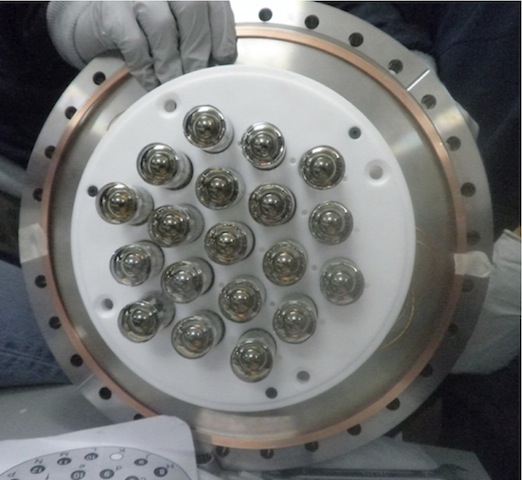
The tracking plane is responsible for the tracking and provides topological information on the events. It is located closely behind the EL mesh-grids and provides a 2-D pixelization. Figure 4.14 shows the PMT plane that gives the tracking function for Run I.
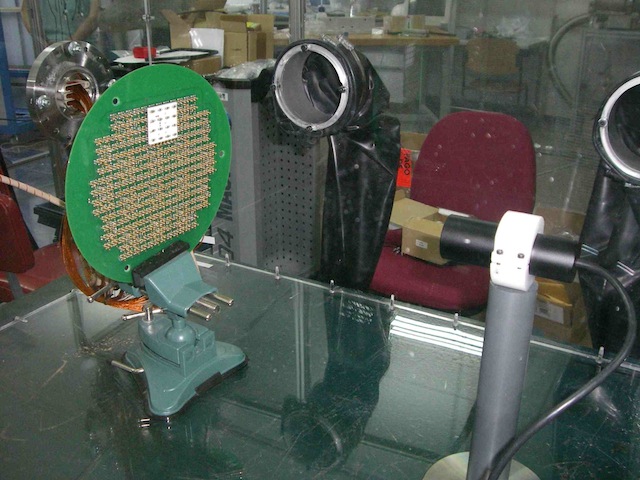

Figure 4.15 shows the SiPM plane inside a test box, made of acrylic. The box is filled with nitrogen, that does not absorb the 172 nm produced by the VUV xenon lamp. The SiPM will be fully tested before installation in the chamber.

Preliminary results are already available. Figure 4.16 shows the few-photoelectrons spectrum of one SiPM connected to the DB shown in Figure 4.17. The peaks follow a gaussian distribution. One can see clearly . Notice that calibration of SiPMs is straight forward. The difference between the centroid of two subsequent peaks is exactly the charge generated by one photon (e.g, one pe). In other words, the difference between peak centroids is a measurement of the gain.

4.4.6 FE readout electronics for SiPMs

The readout electronics of the tracking plane poses a greater challenge than that of the PMTs (identical to the PMT electronics described for the LBNL prototype) due to the much higher number of channels. Figure 4.19 shows the analog path of an ADC circuit for the SiPM front end. It includes I/V converter, gated integrator, voltage amplifier and single-channel ADC. In NEXT1, this FE electronics is implemented as a part of a special card outside the chamber, and the signals are passed through flat cables and multi-pin feedthroughs.
However, ten thousand signal wires across the TPC vessel, as needed for NEXT-100 appear as rather challenging. This leads us to the final improvement to the baseline design, which is to install the front-end electronics, digitizers and some sort of data multiplexers inside the vessel in order to reduce the number of feedthroughs.
A possible solution consists in using 64-ch ASICs that include the analog chain (amplifier + integrator in Figure 4.19), the digitizers and the data multiplexer. A commercial serializer/deserializer chip interfaces the ASIC to an optical transceiver, using a single optical fiber for a full-duplex data connection to the DAQ stage (FECs equipped with specific add-in cards). With this multiplexing factor, 10k channels require just 157 optical links across the vessel. Alternatively to the use of an ASIC it is possible to develop small scale discreet electronics that will also fit in the chamber (recall that the ANGEL design includes a thick ultra-pure copper ring to shield the electronics from the main gas volume).
4.4.7 Commissioning
The NEXT1 prototype has been designed and built in less than one year. The detector has been operating since January 2011. During the commissioning phase we have introduced a number of improvements to the original chamber, including new grids that withstand higher voltages. Drift voltages close to 50 kV and anode voltages close to 25 kV have been achieved. The detector has been operating routinely for many hours in a very stable way. A significant incident, however, has been the rupture, during the month of April, of the recirculation pump diaphragm, for causes yet unknown. The pump is being repaired and the system continues running with a spare, smaller pump. Additional safety systems will be build in the next few months to close automatically the system in the event of a similar failure, avoiding the loosing of valuable xenon. In addition, a system of slow control is being developed. This incident brings home the need of a triple diaphragm pump (as well as additional emergency devices) for the NEXT-100 gas system (see chapter 7).
The electronic system of the noise was originally quite high due to electronic pickup. Addition of RC filters, as described above has almost eliminated the problem. There remains a small pickup introduced in the power line of the PMTs that will be cured in the next few week.
Chapter 5 Initial results from the NEXT-1 prototypes
5.1 First results from the LBNL prototype
The LBNL NEXT prototype went into operation in December 2010. Since then more than 2 Terabytes of data have been taken at various pressures (10, 11 and 15 bar), drift electric fields (0.5 kV/cm through 2 kV/cm), E/P electroluminescent gains (1.0 though 2.6 kV/(cm bar)), trigger configurations, glass flow rates and with different calibration sources: 22Na, 137Cs, 241Am, and cosmic ray muons.
5.1.1 Setup and trigger


In the current implementation the TPC has 19 PMTs on the energy measurement side and no dedicated tracking sensor. The 19 PMTs are 13 cm away for the 3mm EL gap region and the active drift volume is 8 cm long in the drift direction and has a 14 cm transversal span. Typical high voltage differences across the EL gap are 8 to 15 kV depending on the pressure and typical voltage differences across the drift region are 4 to 16 kV. The PMTs are typically operated at a gain of 1.4x10⁶.
The trigger configuration has evolved over the 4 months since first operation. The most successful configurations involve a fast 3-fold coincidence with a few photoelectron threshold from groups of PMTs which initiates a 5-100 gate during which a single channel S2 energy threshold is required to fire. The S2 energy threshold is built from a 20 peaking charge amplifier.
Signals from the 19 PMTs are then digitized with the 16-bit Struck digitizers for 160 leaving typically 60 of pretrigger and 100 of signal region including the S1 and S2 signals. Figure 5.1 shows a typical waveform resulting from the sum of the 19 PMTs signals. Valid events are selected to have a narrow S1 signal followed by one or more S2 wide signals. As seen in Figure 5.2 the summed waveforms have small noise permitting single photoelectron efficient 5 analysis thresholds.
5.1.2 The Cs-137 analysis
In order to demonstrate the capabilities and performance of the LBNL NEXT prototype we will describe the analysis steps and data features for a single run taken with a 1 mCi 137Cs 662 keV gamma ray source highly collimated and on the TPC axis entering the pressure vessel through a 2 mm thick stainless steel window on a reentrance port. This run taken at 10 bar pressure had -10.6 kV applied to the mesh that defines the start of the drift region, +2.7 kV to the first EL mesh and +10.6kV to the second EL mesh.
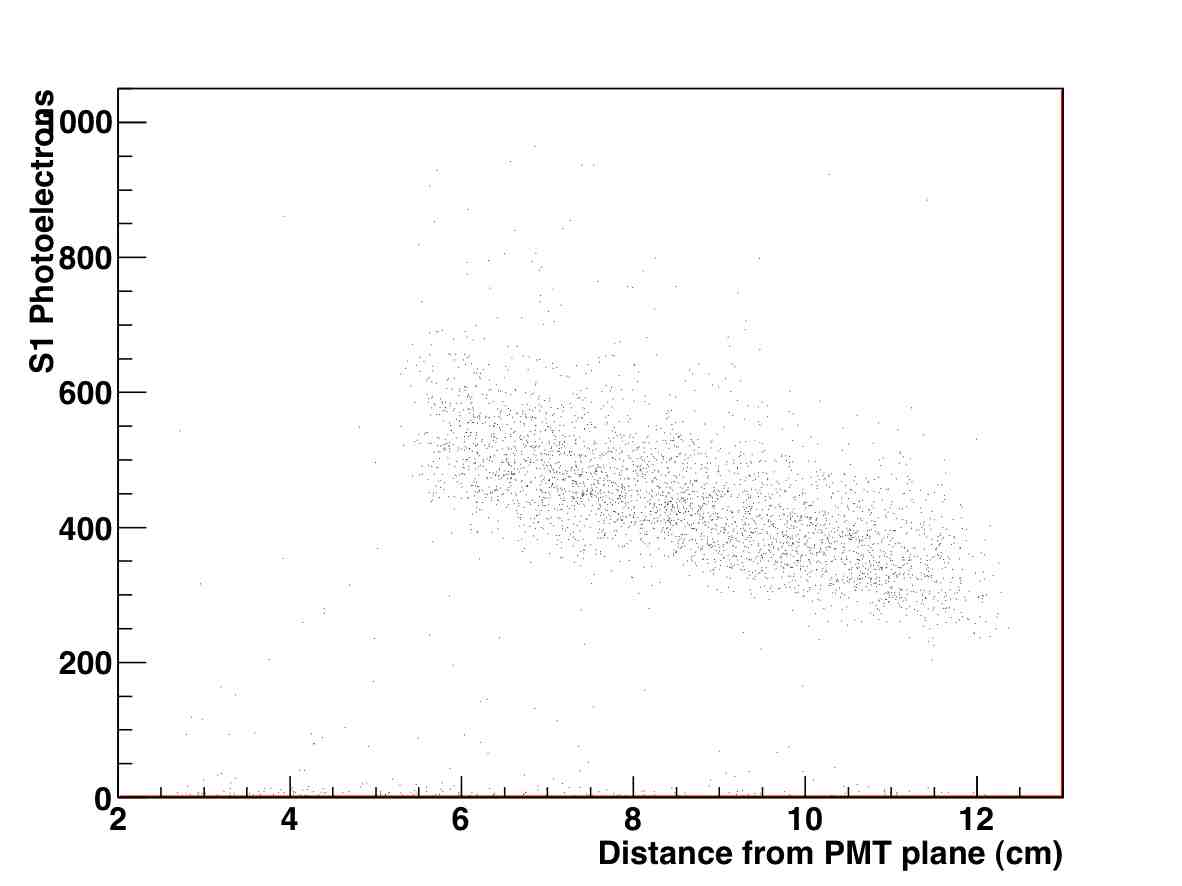
The analysis starts with the identification of S1 signal, whose primary function is to determine the for the TPC drift. In addition, the S1 signals are useful for identifying pileup events and could shed light on the amount of recombination. As seen in figure 5.3 hundreds of photoelectrons are measured in the S1 of full energy 662 keV events thus reliable S1 signals can be obtained for energy depositions as low as 10 keV. The large position dependence of the S1 signal is mainly a solid angle effect at play due to the limited reflectivity of the PTFE walls.
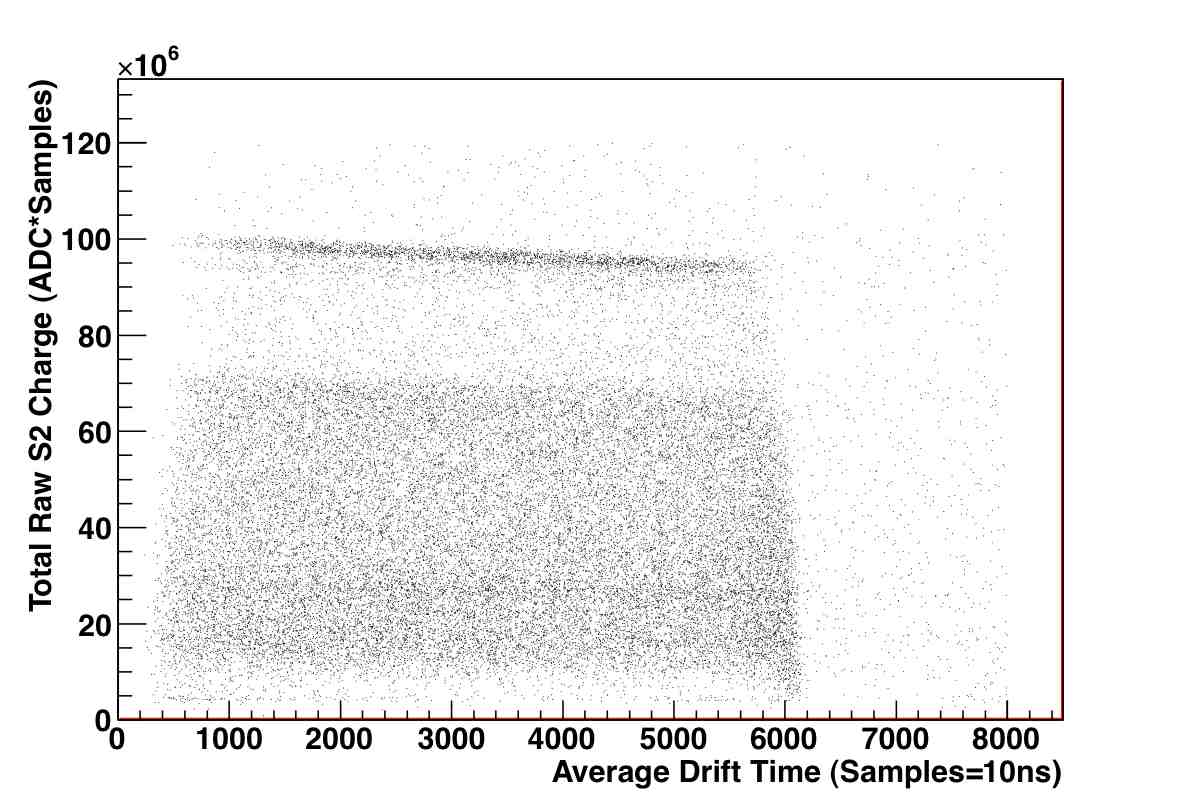
Figure 5.4 shows the integrated S2 charge versus the drift time for valid events in the run with an S1 and one or more S2 pulses. A highest narrow energy band corresponds to full energy 662 keV depositions. The drift time span of the events corresponds to the maximum drift time, given by the maximum 8 cm drift length and the drift velocity. The slope in the energy bands is due to electron attachment by O2 molecules in the drift region.

The charge spectrum for this run shown in figure 5.5 shows a clear full energy peak where the distribution is calibrated, a Compton edge at the expected 480 keV and a Compton backscatter peak at the expected 180 keV. Even in the presence of the hardware trigger threshold in the 100 keV region, a narrow 30 keV peak can be discerned caused by events in which only the xenon x-rays (29-36 keV) following photoelectric interactions entered the active region of the TPC.
The electron attachment energy correction for the exponential charge loss versus drift time is applied to the data a posteriori through the use of charge moments constructed from the taylor expansion of an weighting function. Figure 5.6 shows the attachment corrected data showing horizontal energy bands. Figure 5.7 shows a fit to the attachment corrected spectrum with a 2.5% FWHM for the 662 keV line. About 300,000 photoelectrons are measured for full energy peaks. This corresponds to about 10 photoelectrons (PE) measured per ionization electron. At this EL gain and photoelectron yield the PE statistics have a similar contribution to the resolution function as the Fano factor, about 0.6%.
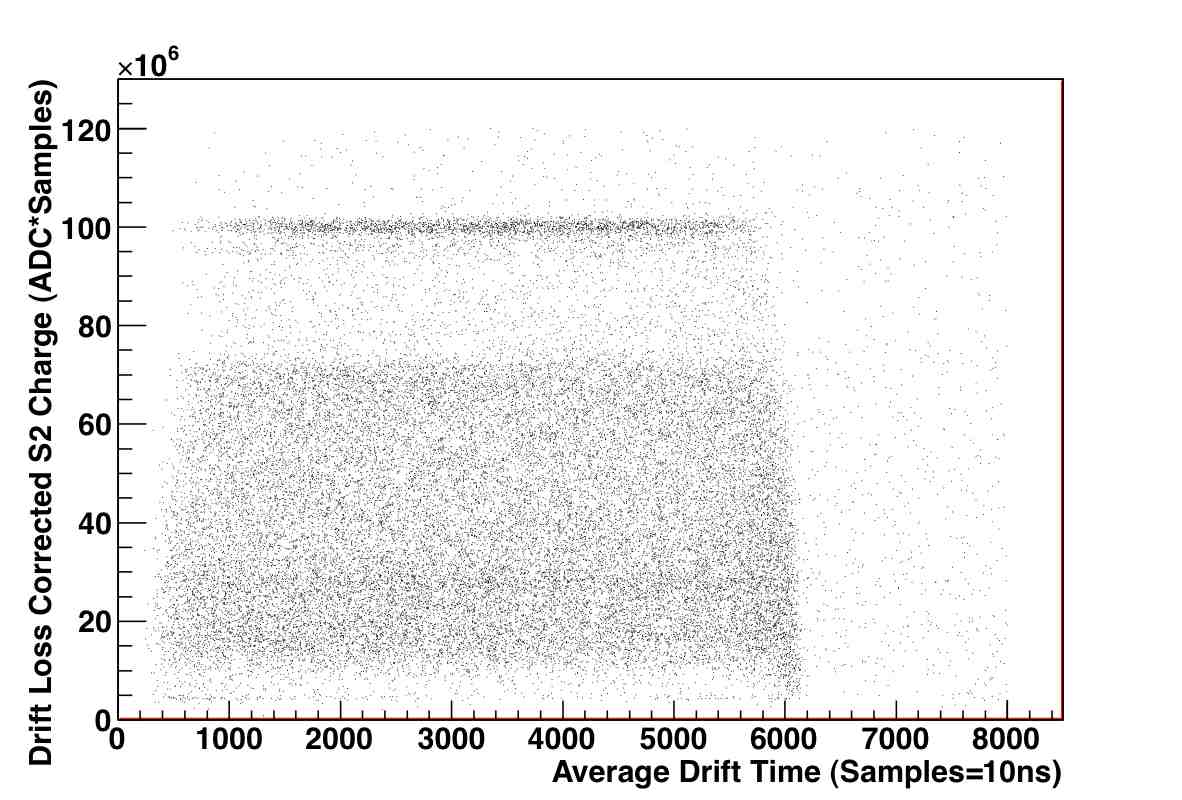

We investigated the stability of the data by looking at the peak energy as a function of time. Figure 5.8 shows a small trend of gain loss during the 3 hour duration of the run. However, the effect is small and its contribution would amount to 0.2% in quadrature to the resolution. As such, we did not include an explicit time correction to the data. Continuous monitoring of the voltages, currents, pressure, temperatures, flows are being implemented and are important to control and track this type of systematic effect. In addition, a set of LEDs will be installed inside the TPC volume to provide end-to-end electronics and PMT calibration as well as data stability information.

Even though the PMT plane is 13 cm away from the EL region, the TPC with only energy side sensors has position sensitivity and thus tracking capabilities. For each valid event an average x and y position is found by weighting the PMT positions by the charge observed in each. Because the light is relatively uniform at the PMT plane (20-30% variations) a scaling factor (of 30) is required to transform the calculated average positions to true x-y TPC coordinates. Figure 5.9 shows the position of valid events with one S2 pulse. The hexagonal boundaries of the drift region can be clearly identified. The dense region in the middle is the spot size of the source after the collimation (a 3 mm hole on a 8 cm long lead block placed about 70 cm from the TPC active region). Figure 5.10 shows the subset of events that were in the full energy peak forming a spot size of about 2 cm radius.
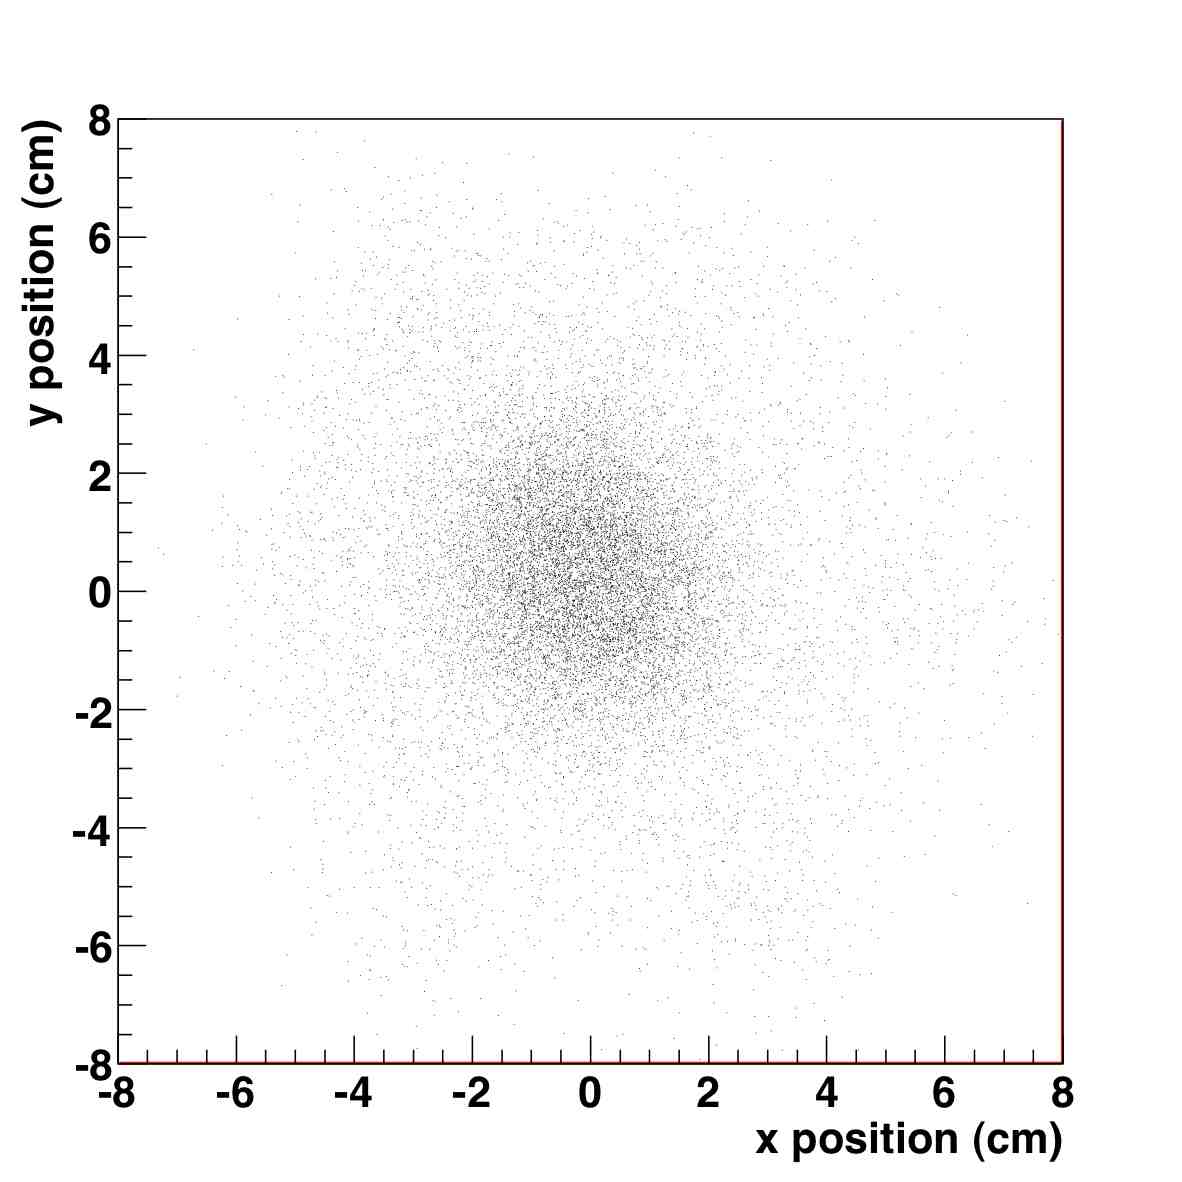

Systematic gain variations are expected as a function of the event location from forward scatters of gammas in the collimator or window, from optical response non-uniformity due to finite reflectivity of the walls and to mesh deformation due to the electrostatic force amongst others. In particular radial systematic gain effects need to be measured and understood. Figure 5.11 shows the full energy peak position as a function of the reconstructed average radius of the event. The systematic effect observed is small (or absent) in the region with radius smaller than 1.5 cm. Since most of the full energy events are the central region, a cut was applied to the data to select only central events thus avoiding the larger radius gain variations.


After selecting central events the spectrum in figure 5.12 is obtained. It shows a FWHM of 1.8% at 662 keV and a well formed gaussian response shape. A smaller peak 30 keV lower is due to xenon x-rays escaping from the active region. This results is representative of our good energy resolution configurations and runs. In the coming months we expect to explore the systematic effects that may be limiting the resolution from the 0.9% expected from the Fano factor and total PE statistics.
5.1.3 Other analysis


Besides the workhorse 137Cs calibration source, we analyzed events with 511 keV photons from positron annihilation and 59.4 keV from an 241Am source. The energy spectrum (with corrections) is shown in figure 5.13. A fit to the upper edge of the full energy peak shown in figure 5.14 yielded a 4.6% FWHM resolution at the 59.4 keV peak. More investigations are planned to understand the asymmetric nature of this peak. A naive of this resolution to 662 keV would render 1.4% (0.7% to ).
Given the proven position sensitivity of the TPC even in the absence of a tracking sensor array, a study of cosmic ray muon tracking was performed. Two small scintillators were mounted above and below the TPC pressure vessel, such that muons tagged in coincidence would traverse the TPC at about 45 degrees from the vertical in the direction of the drift. The summed waveforms for the externally triggered muon events were divided in equal energy slices of about 40 keV each. For each slice the x an y average position was calculated, yielding a set of (x,y,z) points. The right panels of figures 5.15 and 5.16 show the z-y projection of the track points (the tracks were parallel to the x axis by virtue of the positioning of the scintillators). Clearly, straight tracks can be seen. This result is particularly promising in light of the small amount of energy in each slice. In future work we will explore tracking of the gamma ray events that is further complicated by the large multiple Coulomb scattering and the possibility of mulitple x-y track points in a given time slice.


5.1.4 Drift velocity and nitrogen
As mentioned above, the drift velocity is easily measured by looking at the events with the longest drift time. In earlier data taking runs at 11 and 15 bar the drift velocities were measured consistently higher than expected for pure xenon. This was later traced (first hints came from RGA scans of working gas samples) to be due to the presence on N2 in the TPC gas. The cold getters currently in use in the LBNL prototype do not capture nitrogen (they actually clean N2), so any outgassing in the chamber will build up nitrogen in the working gas indefinitely. Newer runs, with xenon fresh from the supplier bottle and with less outgassing of the TPC parts, show drift velocities much closer to those expected from pure xenon as can be seen in figure 5.17 where the measurements of the drift velocities of the first and second batches are shown along with Magboltz calculations for pure xenon and xenon+N2 mix. The drift velocity for the fresh xenon data are consistent with a small (but non-zero) N2 content as expected from the 5-9s quality of the supplier’s research grade xenon. A hot getter capable of extracting nitrogen will soon be added to the gas system for the LBNL prototype.

5.1.5 EL Yield
Last, we show in figure 5.18 a measurement of the photoelectron yield per ionization electron as a function of E/P in the EL region. The high E/P points extrapolate to the nominal 0.83 kV/(cm*bar) threshold. The deviations from the expected behaviour are again due to the presence on N2, although this time in the EL region. This effect was further confirmed with Magboltz calculations showing how much energy was surrendered to inelastic collisions with N2 as a function of E/P. At low E/Ps the electrons in the EL region have energies near the peak of the inelastic cross section (2-3 eV) between electrons and N2 while for high E/P electrons are typically higher in energy and the loss to nitrogen molecules is small.

5.1.6 Outlook
After only a few months of operation, the NEXT1-LBNL prototype is already producing high quality data. The analysis presented here shows that reaching, and possibly improving the target resolution of the NEXT experiment with an EASY and SOFT TPC appears well within our capabilities. It also shows the stability and robustness of a HPGXe operated in EL mode.
In the next few months, the prototype will systematically explore the range of parameters (pressure, drift voltage) relevant for NEXT and will look for ways to further improve the energy resolution.
5.2 A first look at alpha events in NEXT1-IFIC
The NEXT1-IFIC prototype has been commissioned a few months after NEXT1-LBNL. The current configuration corresponds to Run-I (2PMT plane). For the runs discussed here, all of the 19 PMTs placed behind the EL grid (anode) were read out. Because of the 32 channel limitation of the temporary DAQ system employed for the commissioning (the final DAQ has been tested prior to submitting this document and is already in place), only 13 out of the 19 cathode PMTs were read out. Since the beginning of operations we have run at different pressures between 4 and 11 bar. The anode voltage was set to an E/P of near 3.5, while the cathode voltage was set at a drift voltage of about 330 V/cm.
The join LBNL-IFIC analysis group is starting to analyze the data. As a first example of the on-going effort we describe here a preliminary analysis made using alpha particles.
5.2.1 General features
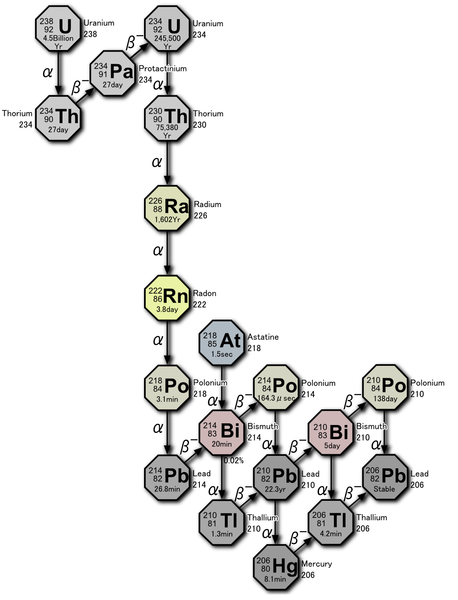
Alpha particles are present in our data, as a byproduct of the radon decay chains. For example, 222Rn appears in the uranium natural chain (Figure 5.19) and decays with a half life of 3.8 days emitting an alpha particle of 5.6 MeV. They leave a very clear signal that is useful for the initial studies of the NEXT1-IFIC chamber.


Figure 5.20 shows a typical waveform for a alpha candidate event. The waveform is obtained by summing the 13 cathode PMT, pedestal-subtracted, waveforms. The 66,000 clock ticks span a 660 s time (10 ns sampling). The trigger occurs in the middle of the DAQ time window, at 33,000 clock ticks. The S1 and S2 signals are clearly visible. For this event, the S2 signal occurs at the trigger location, and it is preceded by the S1 signal by about 140 s. The S1 peak is only a few 100 ns wide, while the S2 peak extends over a few s, as expected. The area of the S1 peak is about two orders of magnitude smaller than the S2 area.


Figure 5.21 shows the uncorrected distribution of the summed area of the cathode PMTs. A wide peak, corresponding to alpha particles appears in the right of the distribution, well separated from the low energy background on the left. Figure 5.22 shows a scatter plot of the area versus the width of the signal. As expected the total area and the signal width are correlated. Notice however, that the distribution widens in area as it moves toward higher values of the width. This shows the effect of the drift field in alpha particles moving at angles with respect to the field lines.


Figure 5.23 (upper) shows a scatter plot of the S1 area versus the drift time, obtained from the difference in position between S1 and S2. The same distribution is shown as a profile in the lower plot. The light read by the cathode PMTs int the end closer to them is about a factor 5 larger than the light in events happening near the anode. Since our current light tube is made of uncoated PTFE we expect a rather poor reflectivity, of about 50%, consistent with the observed effect.
5.2.2 Selection of alpha particles


Figure 5.24 summarizes the selection of alpha candidates in NEXT-1-EL. The following cuts are applied:
- Energy cut (Fig. 5.24, top left):
-
Given that alpha events are expected to be highly ionizing, only events with a cathode sum ADC counts are selected.
- Waveform peaks cut (Fig. 5.24, top right):
-
Alpha events are expected to yield a nearly point-like energy deposition within the chamber. For this reason, only events with a single S2 candidate peak in the cathode PMT summed waveform are selected. In order to obtain a full 3-dimensional reconstruction of the event, the S1 signal needs to be detected. For this reason, the analysis also requires a single S1 candidate peak for the event. As can be seen from the figure, once the energy cut is applied, this (1 S1 1 S2) signature is the predominant one.
- Drift time cut (Fig. 5.24, bottom left):
-
Once (1 S1 1 S2) events have been selected, the drift time can be estimated by taking the time difference between the S1 and S2 signals. As can be seen from the figure, events extend up to 170s drift time for this run. Assigning this maximum drift time to the full drift length of the chamber (30 cm) yields a drift velocity of about 1.8 mm/s. We select only events with a drift time comprised between 40 and 160 s. This cut ensures that only events that are well separated spatially from the chamber metallic grids, and with a unambiguous (1 S1 1 S2) signature, are selected.
- Radial cut: (Fig. 5.24, bottom right):
-
Information from the anode PMT plane is used for a coarse and very preliminary reconstruction of the position of the event. This is possible because the face of the anode PMTs is only 3-4 mm away from the EL region. While the reconstruction algorithm will certainly be improved in the future, its current implementation is sufficient to clearly reconstruct the hexagonal shape of the NEXT-1-EL light tube, as can be seen in the figure. To ensure that the energy deposition occurs entirely within the xenon gas, a strict requirement on the reconstructed radius of mm is used.
5.2.3 Energy Reconstruction
In the SOFT concept, the basic observable we use for energy reconstruction is the sum of all (13, in this case) cathode PMTs. While the supply voltage for each PMT has been separately adjusted to provide a uniform PMT gain of , a small (about 20% RMS spread) channel-to-channel variation is seen and corrected for offline. In the following, we discuss how the energy reconstruction changes as a function of spatial location within the chamber, and provide a first energy resolution measurement with NEXT-1-IFIC.
5.2.4 Dependence on Spatial Location


Once alpha candidate events have been selected, we can study how the amount of light detected by the sum of all cathode PMTs varies, on average, as a function of the event localization within the chamber. The profile histogram in Fig. 5.25 (left) shows how the reconstructed energy varies with drift time. As expected from electron attachment, the reconstructed energy decreases with increasing drift time. Nevertheless, for this current run the variation is mild and well understood. Performing an exponential fit to this profile histogram yields a s electron lifetime.
Once the correction for electron attachment has been applied, we can study how the reconstructed energy varies with reconstructed radial position within the chamber. Given the isotropic nature of the EL light, and the fact that the light guide panels in NEXT-1-IFIC are far from being perfect VUV light reflectors, we expect the reconstructed energy to decrease with reconstructed radius. This is what has been observed on average, as can be seen from the profile histogram in Fig. 5.25 (right). While the effect is sizable as one extends past 35 mm reconstructed radius, the variation is less than 10% up to 35 mm. A sufficiently good description of this dependence is obtained by fitting the average reconstructed energy to a functional form, with .
5.2.5 Energy Resolution

Figure 5.26 shows the energy spectrum of the alpha candidate events, having already applied the PMT relative gain, drift time and radial corrections to the energy. The identification of alpha lines is difficult because of the poor statistics and the poor energy resolution. From these data, we estimate an energy resolution of about 10% FWHM (see gaussian fit in Fig. 5.26). We are now studying why this first energy resolution measurement is poor. Recombination, in particular given the low drift field for this measurement may be among the explanations. Needless to say, the current results shown here need not be taken as a projection of the expected ultimate performance for NEXT-1-IFIC, but rather as a status report on our current understanding of the chamber after only a few weeks of commissioning.
5.3 Other Measurements
In addition to measurements related to energy reconstruction (discussed above), the alpha analysis provides a few other ancillary measurements, discussed in the following.
5.3.1 Drift Velocity
As can be seen from Fig. 5.24 (bottom left), events extend up to 170s drift time for this run. Assigning this maximum drift time to the full drift length of the chamber (30 cm) yields a drift velocity of about 1.75 mm/s.

This measured value is significantly higher than expectations for pure xenon at 6 bar and for a 0.33 kV/cm drift field. With ideal gas quality we would in fact have expected a drift velocity of about 1.0 mm/s. A possible explanation for such a large drift velocity would be the presence of N2 contamination in the gas in large (0.5%) amounts, as can be seen from the Garfield/Magboltz simulation results of Fig. 5.27. This is possible, as the current configuration for the NEXT-1-IFIC gas system is not designed to filter N2 out of the gas.
5.3.2 S2-to-S1 Ratio

Figure 5.28 shows the measured average S2-to-S1 ratio as a function of drift time. As discussed above, the strong dependence on drift time is mostly due to S1 signal variations with drift time, caused by the significant VUV light absorption of the NEXT-1-IFIC light tube.
If one extrapolates the measured S2-to-S1 ratio towards zero drift time, one is able to estimate an S2-to-S1 ratio that is free of spatial dependencies, as the S1 and S2 light are, in this case, emitted from essentially the same location. Data of Fig. 5.28 indicate that such an extrapolation would yield a corrected S2-to-S1 ratio of about . This is to be compared with an expectation of about for such a ratio. This expectation is obtained by considering an expected optical gain of at the current chamber conditions, and the fact that it takes about 3 times more energy to produce a primary scintillation photon (about 76 eV) compared to a ionization electron (about 24.8 eV). The deficit of the measured S2-to-S1 ratio compared to the expected value points towards a alpha ionization quenching factor of about 3 in the current chamber conditions.
5.3.3 Longitudinal Diffusion and Range of Alpha Particles

It is also possible to perform S2 pulse shape analysis on the selected alpha candidates, and study whether the measured S2 time spreads are consistent with expectations. As indicator of the S2 time width we use the full S2 peak width at 10% of its maximum. A scatter plot of the S2 width as a function of the drift time for all selected alpha candidates is shown in Fig. 5.29. The increase in the average S2 width with increasing drift time can be explained via longitudinal diffusion of the ionization electrons during drift. The expected longitudinal diffusion constant for xenon at 6 bar and for 0.33 kV/cm drift field is about 0.6 mm/, qualitatively in agreement with observations. The spread of about 2 s in the S2 width, approximately constant for all drift times, is instead due to the expected range of alpha paticles. As can be inferred from Fig. 5.30, we expect a 3.4 mm projected range at 6 bar for alpha particles at the typical energies of 5 MeV. Considering the measured 1.75 mm/s drift velocity, this corresponds to about a 2 s S2 width spread due to the orientation of the alpha particle direction with respect to the drift field direction, as observed.

Chapter 6 Sensitivity of NEXT-100
6.1 Sources of background in NEXT
6.1.1 214Bi and
The peak of is located in the energy region of the naturally-occurring radioactive processes. The half-life of the parents of the natural decay chains, of the order of the age of the universe, is, however, very short compared to the desired half-life sensitivity of the new experiments ( years). For that reason, even small traces of these nuclides create notable event rates.
The only significant backgrounds for NEXT are the high energy gammas produced in the -decays of the isotopes and 214Bi, found in the thorium and uranium series, respectively (Figure 6.1).

The daughter of , 208Pb, emits a de-excitation photon of 2614 keV with a 100% intensity. The Compton edge of this gamma is at 2382 keV, well below . However, the scattered gamma can interact and produce other electron tracks close enough to the initial Compton electron so they are reconstructed as a single object falling in the energy region of interest (ROI). Photoelectric electrons are produced above the ROI but can loose energy via bremsstrahlung and populate the window, in case the emitted photons escape out of the detector. Pair-creation events are not able to produce single-track events in the ROI.
After the decay of 214Bi, 214Po emits a number of de-excitation gammas with energies above 2.3 MeV. The gamma line at 2447 keV (intensity: 1.57%) is very close to . The photoelectric peak infiltrates into the ROI for resolutions worse than 0.5%. The gamma lines above have low intensity and their contribution is negligible. The contribution of pair-creation events is also insignificant.
All materials contain impurities of and 214Bi in a given amount. The dominant source of background in NEXT is the pressure vessel (PV). As discussed in chapter 3, the mass of the PV is circa 2 tons if titanium is used as construction material and more than 8 tons if copper is used. In this CDR and for the calculations that follow we will assume conservative specific activities of 200 Bq/kg and 50 Bq/kg for this two materials respectively. We believe that there is ample room to build a more radiopure PV, either by using very radiopure batches of titanium or by combining it with very resistant and light composites, such as carbon fiber.
The next source of background in NEXT are PMTs. We know of at least two radipoure PMTs suitable for our needs, the Hamamatsu models R8520 (1”) and R11410-MOD (3”). The and 214Bi activity of the R8520 has been measured to be between 0.5 and 1 mBq and that of R11410-MOD, which seems better adapted for our needs, given its larger size, between 2 and 3 mBq. As we discuss later, with a coverage of 25% the contribution of PMT to the radioactive budget is small compared with that of the vessel.
All the other components of the detector can be made of PTFE, copper, peek, etc. Careful selection and screening should guarantee that they do not contribute significantly to the radioactive budget. The electronics for the SiPMs will be shielded by a thick plate of very radiopure copper and located in the periphery of the fiducial volume. Its contribution, therefore, is also small compared with that emanating from the bulk of the vessel.
However, the Zaragoza group has performed an independent sensitivity study which includes a very detailed background model. This study has been performed using as a reference detector a TPC based in micromegas and is not further discussed in this report, although their results are fully compatible with those presented here. We plan to introduce such a detailed background model in our Monte Carlo in the near future.
6.1.2 Radon
Radon constitutes a dangerous source of background due to the radioactive isotopes 222Rn (half-life of 3.8 d) from the 238U chain and 220Rn (half-life of 55 s) from the 232Th chain. As a gas, it diffuses into the air and can enter the detector.
214Bi is a decay product of 222Rn, and a decay product of 220Rn. In both cases, the radon suffers from an alpha decay into polonium, producing a negative ion which is drifted towards the anode by the electric field of the TPC. As a consequence, 214Bi and 208Tl contaminations can be assumed to be deposited on the anode surface. Radon may be eliminated from the TPC gas mixture by recirculation through appropriate filters. There are also ways to suppress radon in the volume defined by the shielding, whether this is a water tank or a lead castle.
Radon control is a major task for a experiment, and will be of uppermost importance for NEXT.
6.1.3 Cosmic rays and laboratory rock backgrounds
Cosmic particles can also affect our experiment by producing high energy photons or activating materials. This is the reason why double beta decay experiments are conducted deep underground. At these depths, muons are the only surviving cosmic ray particles, but their interactions with the rock produce neutrons and electromagnetic showers. Furthermore, the rock of the laboratory itself is a rather intense source of and 214Bi backgrounds as well as neutrons.
The above backgrounds can be reduced below those intrinsic to the detector (PV, PMTs, etc) by shielding. A water tank providing 3 meters of ultrapure water shield will reduce the flux of gammas to negligible levels and will also suppress neutron and muon background. The same shielding capabilities can be provided by a lead-copper housing (“castle”) made of 25 cm radiopure lead and 10 cm radiopure copper.
Given the topological capabilities of NEXT the residual muon and neutron background do not appear to be significant for our experiment. However, there is the possibility of instrumenting the tank for a detector upgrade. An active veto will further suppress backgrounds other than those emanating from the detector itself.
6.2 Signal and background characterization in NEXT
6.2.1 The topological signature

| Ee (keV) | Probability (%) | Eγ (keV) | Mean path (cm) |
| 500 | 4 | 12 | 0.14 |
| 800 | 6 | 27 | 0.8 |
| 1240 | 8 | 58 | 1.8 |
| 1680 | 10 | 95 | 5.5 |
| 2000 | 11 | 133 | 11 |
| 2480 | 14 | 198 | 33 |
Double beta decay events have a distinctive topological signature in HPGXe (Figure 6.2) : a ionization track, of about 20 cm length at 15 bar, tortuous because of multiple scattering, and with larger depositions or blobs in both ends.
As the track propagates in the dense gas it emits -rays and bremsstrahlung radiation. Those are typically low-energy gammas (Table 6.1) with a mean free path below 1 cm. The convolution of emission of electromagnetic energy with the effect of diffusion (about 1 cm for a drift of 1 m) results in a track for events that looks more like a wiggly, wide ”stripe” of energy deposition, about 1-2 cm wide, than like a well defined “wire”, as usual when tracking high energy muons, for example. The implications are quite clear:
-
1.
Space resolution is not an issue in NEXT. A pitch of about 1 cm is sufficient, given the combined effect of radiation and diffusion, that blur the track into a stripe. Monte Carlo calculations indicate that even a larger pitch 1.5 to 2 cm may be acceptable.
-
2.
Instead, identification of low energy gammas nearby the track (at distances of a few cm) is important. This is due to the difference between signal (two electrons of average energy /2) and the dominant background (one electron of energy ). In the second case the probability of radiation is higher and the mean free path of the gamma is longer. Topologies with one or more isolated clusters of energy, corresponding to relatively high energy gammas flying distances of 2 or more cm are therefore more likely for the background than for the signal. Therefore, identifying low-energy satellite clusters is important in NEXT. This requires a sensor with low energy threshold, as the SiPMs.
6.2.2 Selection criteria

NEXT has three powerful handles to separate events from backgrounds. These are:
-
1.
Signal events appear with equal probability in the target, that is, the gas that fills the PV. Defining a fiducial volume, separated from the PV walls by a few cm of active target permits eliminating events in which a high energy gamma is accompanied by charged particles that exit the PV walls. In the ANGEL design, 4 cm of gas are left out between field cage and PV. These are necessary for electric insulation but with proper instrumentation can double up as active veto. In any case, the requirement that the events are strictly contained in the active fiducial volume guarantees that any event with charged activity is eliminated (see Figure 6.3). Notice that, from the point of view of rejecting backgrounds, an HPGXe behaves in a complementary way than a LXe. While liquid xenon has excellent self-shielding properties, xenon gas, even at (moderately) high pressures, is very transparent to gammas.
-
2.
Signal events have all the same energy. NEXT target resolution is 1% FWHM and better resolutions can be achieved (our measurements with small detectors point out to 0.4%, close to the intrinsic resolution in xenon). Imposing that the events are in the ROI (taken as 1% FWHM) eliminates substantially the backgrounds.
-
3.
Signal events have a distinctive topological signature that can be exploited to further suppress the background. Our calculations yield a rejection factor of 20 at moderate efficiency cost. This is one of the strongest points offered by NEXT technology.
6.3 The topological signature
6.3.1 Voxelization
The initial processing of the event allows the “voxelization” of the track, which is formed in terms of connected 3D “voxels” formed using the 2D position given by the tracking plane and the third dimension given by time information. The initial voxels are cubes of 1 cm3 in volume, corresponding to the pitch between the SiPMs and twice the EL grid distance. The size of isolated photons is typically one voxel, while a “track” will consist of about 20 voxels.
Dedicated software (e.g, the RESET algorithm, described in chapter 5) is being developed to voxelize the event. REST also obtains the energy of the event, after correcting for all relevant effects (position of the event, attachment, etc.). The list of (unconnected) voxels is then passed to the pattern recognition algorithms.
6.3.2 Rudiments of graph theory
For each event, the set of voxels with an energy deposition different from zero can be regarded as a graph: that is, a set of vertices and edges that connect pairs of vertices. Two voxels ( and ) belonging to a specific set (and regarded as cubes) are connected if they have either one side, one edge or one vertex in common. Mathematically:
Every group of voxels with energy deposition different from zero is characterized by a square matrix of dimension equal to the number of voxels belonging to that group. It is called adjacency matrix, because it describes the closeness of each pair of voxels. The voxels are ordered and numbered, 1, 2, 3, Then, the matrix element is built in the following way:
where is the coordinate of the voxel . A matrix element different from zero means that the corresponding voxels are close (and the number represents the distance in cm between the centers of the voxels), while if it is zero, the two voxels are not close. The diagonal elements are conventionally set to an arbitrary high number.
6.3.3 The Breadth First Search algorithm
With the adjacency matrix it is possible to “walk” across connected voxels, therefore to identify connected subsets (the tracks) and follow paths along tracks. In order to do this the so called BFS (Breadth First Search) algorithm is exploited. The BFS starts from a voxel and calculates the (shortest) path to any other voxel. In this way it is possible to identify the number of tracks for each event and to calculate the length of the path between any pair of voxels of each track.
Using the BFS we calculate the paths between any pair of voxels and pick up the longest of such paths. The corresponding voxels of the pair are called the extremes of the track. Afterwards, for each extreme, the voxels whose distance from it is smaller than a radius are considered and their energies summed up to give , where label 1(2) is given to the extreme with higher (lower) energy. In Fig. 6.4 the distributions of the energy contained in the sphere of radius around the extremes of the track are shown.


Fig. 6.4 shows the energy inside for signal and the 214Bi background. In the case of the signal the energy of both extremes is quite similar, as expected, while the background shows very different shapes for the track extremes. A good cut to exploit this difference is to impose that an event have both and greater than a threshold value .
According to our Monte Carlo calculations a cut MeV and cm keeps 78% of the signal while suppressing the background by more than one order of magnitude. The background suppression can be increased to a factor 20 at the expense of less efficiency (55%).
6.4 Sensitivity
6.4.1 Event selection
An event is accepted as a candidate if:
-
1.
The event is fully contained in the fiducial volume
-
2.
Only one reconstructed track: That is the BFS algorithm finds only one connected set of voxels. Events with more than one object (tracks or disconnected voxels) are rejected.
-
3.
Energy in the ROI: The event is required to be within 1 FWHM (1%) of .
-
4.
signature: the unique track ends in two blobs of high energy, as expected for a event. This is translated into a cut MeV and cm, that allows a suppression factor between 10 and 20 for the background at the expense of selection efficiency between 78% and 55%.
6.4.2 Signal efficiency and background rejection power
To estimate the performance of the NEXT ANGEL design and background data samples have been generated with the NEXUS Monte Carlo simulation. Signal events are simulated in the volume inside the vessel. Backgrounds ( and 214Bi decays) are simulated in the vessel and in the readout planes. The events thus generated are passed through the selection procedure.
| Selection criteria | Fraction of events surviving cuts |
|---|---|
| Events analyzed | |
| Fiducial, 1 track | |
| ROI | |
| Topology |
| Selection criteria | Fraction of events surviving cuts |
|---|---|
| Events analyzed | |
| Fiducial, 1 track | |
| ROI | |
| Topology |
| Selection criteria | Fraction of events surviving cuts |
|---|---|
| Events analyzed | |
| Fiducial, 1 track | 0.48 |
| ROI (1 FWHM) | 0.33 |
| Topology | 0.25 |
Tables 6.2, 6.3 and 6.4 summarize the rejection factors for 214Bi and backgrounds as well as the signal efficiency. The background rate of the experiment is obtained multiplying by the activity emanating from the pressure vessel, the PMTs and the rest of the components of NEXT.
As an example, let’s consider the background illuminating the fiducial volume from the PV. This is about events per year. Since the rejection factors for 214Bi and are about the same (), we can simply multiply one quantity by the other to obtain counts/year. Divide now by the fiducial mass (100 kg) and by the ROI width (25 keV) to obtain . Adding the contribution of the PMTs results in counts/keV/kg/year.
This background rate is one of the lowest in the field. It has improved with respect to the analysis presented in the LOI thanks to the titanium vessel, which has one order of magnitude less background than the steel vessel considered in the ROI.
6.5 Sensitivity of the NEXT experiment to a light Majorana neutrino

Chapter 7 Shielding options for the NEXT detector
7.1 Shielding requirements
As extensively discussed elsewhere in this report, an exposure of the order of the ton–year of 136Xe, and a neutrino effective mass of 50 meV, result in only a few counts per year at the energy of 2.457 MeV. To be sensitive to such low rates NEXT projects a background of the order of . This forces a very effective shielding to protect the experiments against the laboratory walls contamination, mainly the 2.615 MeV and 2.448 MeV photons coming from the 208Tl and 214Bi isotopes.
The NEXT collaboration has studied two possibilities for shielding. One of them is based on housing the detector in a lead-copper structure (henceforth called the Lead Castle), the other one in the use of a water tank.
Radon in air, water and from material emanation will affect the experiment and the shielding scheme must be designed to suppress sufficiently this contribution. Consider for example the case of a Lead Castle. The radon contamination at the LSC is of the order of 100 Bq/m3. Assume that the volume of air around the detector is 2.55 m3 (this corresponds to around 20 cm of distance between vessel and shielding). Then, more than 100 counts would be registered after cuts in the ROI. On the other hand, air-borne radon can effectively be suppressed by enclosing the detector in a “plastic bag” in which a continuous flux or nitrogen is established, or working in a radon free atmosphere (the air in the inner volume passes through radon scrubbers).
Radon in the water is also a concern in the case of a water tank (for example, GERDA measures around 7-19 mBq/m3). Radon suppression in this case is achieved by a slightly over-pressurized nitrogen blanket which will be kept between the water level and the roof of the tank. In addition the water will be bubbled through a column of nitrogen to eliminate radon degassing from the tank walls.
7.2 The Lead-Copper Castle option
A lead castle, similar to the XENON100 one, has been investigated for the shielding of NEXT100 against the external gamma radiation. The goal is to develop a simple and compact design that allows an easy access to the detector. Rectangular and a round geometries have been studied also to minimize the mass of the lead and the dimensions of the supporting structure; additionally different lead providers have been contacted for a preliminary investigation of the price.
This shielding design offers several advantages:
-
-
More compact design even replacing a few cm’s of lead by water bricks.
-
-
Once it has been mounted is easy to maintain.
-
-
This design could grow up with the experiment.
-
-
It is flexible enough to face up to any unexpected change (extra space for electronics, extra inner shielding …).
-
-
Nitrogen flux not only prevents radon from approaching the detector outer surface, but also offers a certain degree of thermic bath.
7.2.1 The XENON concept
A shield made out of lead bricks has been build by the XENON collaboration for the 10 kg detector (see figure 7.1), operated at Laboratori Nazionali del Gran Sasso (LNGS) during the period 2006-2007. Due to its good performances, the same lead castle has been re-used (after minor modifications) for the XENON100 experiment that is currently operating in the same site. The design foresees a cubic steel-framed structure consisting of 20 cm of Pb with an additional layer of high density polyethylene. The shield structure is secured by steel panels along the outer walls. The detector is attached to a movable door placed on two rails, and it can be easily put in and out by one person. Lead was supplied in standard bricks (51020) by two different companies: Plombum (Poland) for the outer 15 cm and Fondery de Gentilly (France) for more radiopure inner 5 cm layer. An additional inner 5 cm layer of high-purity copper has been added during the upgrade for XENON100. All the holes of the shield have been sealed with low–radioactivity silicon gel thus the cubic internal cavity ( 1m3) can sustain a slight over pressure. In order to reduce the Rn concentration inside the shield, N2 is continuously flushed at a rate of 1.5 l/min. Due to the need of additional shielding, water tanks have been placed around this shield.

7.2.2 Water bricks
This are just containers filled up with water to further reduce the external radiation. The final size of these containers have not yet been defined as there are many different sizes and geometries of water containers available in the market. Even costumed made containers adapted to the inner shielding could be used. In our design, we have used 240 mm 290 mm 380 mm as an arbitrary choice.
One of the advantages of including water containers in the shielding is the possibility to add PMTs to use the system as an active veto against muons and external radiation.
7.2.3 Proposed design for the NEXT100 shielding
This proposal is based on the XENON-like option. The pre-requisitess for our design are:
-
-
The vessel dimensions, adjusted to the ANGEL design plus a safety margin.
-
-
Vertical position of vessel.
-
-
Max. length of cables 5 m.
Some basic points for the shielding design are:
-
1.
A shield made up of several different layers (a sandwich or onionstyle shield), with:
-
-
inner level: 5 cm of copper, with the possibility of upgrading to 10 cm or more111The standard sheet thickness supplied by LUVATA is 2.5 cm. Two or four plates will be used,
-
-
mid level: 15 cm of lead,
-
-
outer level: 1 m of water, placed into water bricks (plastic containers filled up with water).
-
-
-
2.
The shield geometry is composed of straight horizontal and vertical walls.
-
3.
On the ground level a thicker layer of lead is foreseen (30 cm) as no water bricks can be used under such a heavy structure.
-
4.
Cabling and piping require spaces between shield and vessel: at least 100–150 mm between the side wall of the vessel and the shield and at least 300 mm between the vessel endcaps and the shield.
-
5.
The service plate of the vessel is on the upper part. A covered opening at the shield roof allows cables and pipes to get the vessel.
-
6.
Once installed, the detector should stay in place, motionless, due mostly to its weight, but also to avoid small displacements of inner part of the detector.
-
7.
After installation, the shielding needs a mechanism to allow an easy access to the immobile detector. This will be done through sliding walls at the front of the shield. Then, cables and pipes will not be affected by the opening of the shield and won’t need to be disconnected.
-
8.
To prevent radon contamination, a plastic bag will be place surrounding the structure and nitrogen flux will be flushed inside.
-
9.
Finally, standard properties or supplier specifications have been considered for material involved in the design (steel, copper and lead).
The building method we propose consists of copper panels and chevroned lead bricks. These lead bricks are commonly used for radiation isolation, have standard geometries and, as they fit one into the other, the built wall are stronger and with less spaces for the radiation to traverse them. They have been placed in an upright position for the walls and lying on their side for the floor and roof, water containers have been piled, and supported steel structures hold the whole assembly. Two different structures are needed: one for the inner copper plus lead shield and another one for water containers. Catia V5 R19 has been used for the design and Ansys 11.0 for mechanical calculations.
7.2.4 Basic copper and lead layers with supporting structure
The basic elements of the lead shield are:
-
-
an U-shaped wall (thickness: 150 mm)
-
-
the front wall (thickness: 150 mm) divided into two halves due to its more than 9.5 Tons weight.
-
-
the floor (thickness: 300 mm)
-
-
the roof (thickness: 150 mm)
The roof (6 Ton weight) has to be supported by an independent steel structure instead to lie upon the lead walls to avoid the collapse of these vertical walls. In addition, some structural elements will prevent buckling of the vertical walls. A supplementary element with a layer of copper and a layer of lead has been added over the roof to cover the hole through which cables and pipes exit the inner shield (details in figures 7.2 and 7.3)


For the design we have performed static calculations, which take into account the effect of large displacements, and buckling calculations, considering standard properties for lead and steel, and Luvata datasheet’s for copper. Each wall has been considered as a continuous whole body for the calculations, independently of the construction basic elements used for building them. These elements have been thought to fit together properly and eventually be fixed together (glued). The chosen global solution should not have horizontal solicitations or displacements too high on the vertical walls, to maintain this continuity condition.
Under these assumptions we got as results:
-
-
Front walls or U-shaped wall alone
The general load case doesn’t originate problems since deformations produce a maximum total displacement of less that 0.3 mm and a maximum stress of less than 0.57 MPa (well below 1.4 MPa, the elastic limit for lead).
Buckling (or compressive instability) is dangerous. A little pressure on the upper side of the walls would make them fall down. Without reinforcement elements, the first buckling mode appears at P=87.7 Pa in front walls and at P=755.8 Pa in U-shaped wall, well below the pressure caused by a single lead brick (1134 Pa).
-
-
Roof alone
The weight of the whole roof is near 6 Tm. Taking into account the buckling problems of the walls, the roof should not lie upon the lead walls of the castle because it would cause the collapse of these walls. Instead of this, it has to be supported by an independent outer structure. In our design, the roof has been placed on a 20 cm thick steel plate held from 4 anchor points placed at each lateral side of the plate by an outer structure from the top.
According to calculations, there are no major problems for the general load case. First, we have calculated the reaction forces by considering the anchor points as hard points (we need these forces to apply them on the outer structure that should hold the roof). Then we have considered these anchor points as cylindrical holes with one of their borders fixed (to be closer to a realistic situation). Finally, we have considered a more realistic case: the anchor points are cylindrical holes on the plate and a cylindrical crown around the border of the hole is fixed. For this last case, the maximum displacement that appears on the plate is around 0.5 mm (that we consider acceptable) and the maximum stress is around 45 MPa (well below the elastic limit of 220 MPa for steel).
-
-
Assembly with the front walls and the U-shaped wall
We have performed several calculations of the buckling behavior of this assembly and some structural elements have to be added to prevent buckling of the vertical walls.
In the assembly without any reinforcement the first buckling mode appears at a pressure level of 754 Pa (below the level of 1134 Pa that is the effect of the addition of a single layer of bricks). However, after an iterative process of reinforcement, we have arrived to a final configuration where the first buckling mode appears at a pressure level of 1457 Pa (near 30% above 1134 Pa). Further investigations can be done to improve this result.
Coming back to the independent elements (the U-shaped wall and the front walls), no problems are expected for the U-shaped wall due the reinforcement structure defined for the assembly, but we also need to define a narrow support element for the inner side not compromising radiopurity (shielded by the copper layer) in the case of the front walls.
-
-
Support structure for the lead roof
We have started the definition of the structural elements needed to support the roof. Initial studies show that the designed structure built with standard steel beams do not suffer any deformation or buckling, even if we constrain all the degrees of freedom at the joining points.
7.2.5 Water bricks and supporting structure
The water bricks will surround the rest of the shield with upper water bricks (around 2400 kg) placed on a platform above the rest thanks to an independent structure. The design presented here is preliminary and should be refined in future design stages. Here, we have divided the water bricks into different groups:
-
-
upper water bricks over the roof of the lead structure,
-
-
side water bricks, beside the arms of the U-shaped lead wall,
-
-
back water bricks, beside the back of the U-shaped wall,
-
-
front water bricks, beside the front lead wall,
-
-
diagonal water bricks at each one of the 4 corners of the shield.
Vertical panels could be included at inner sides of each group of water bricks, to prevent them from falling down. Calculations of the structure needed to hold the water tanks will be done in future stages of development of the castle. In any case, we think that this structure will be less problematic than the one needed for the lead.
A schematic representation of the final assembly can be observed in figure 7.4.


7.2.6 Opening sequence
The present onion setup foresees the option of running with the complete shield or with just some layers. An intermediate configuration, with only part of the shield in place, can be considered during the preliminary underground tests when frequent hardware operation on the detector (feedthrough, gas system, etc) will be required.
Once the complete shield is installed, the opening sequence would proceed as follows:
-
1.
Front and side water containers removed
-
2.
Front and side panels removed
-
3.
Front sliding walls opened. They slide to the sides.
-
4.
Front Cu removed: this will only be necessary as an independent operation if the Cu front panels are not attached to the sliding doors
Figure 7.5 shows the shielding after the opening has been completed. Current design can be easily improved, placing the lateral water bricks in such a way that would leave free the necessary space to allow opening the front lead walls without needing to remove these bricks or their supporting panels.


Cables and Pipes
The cables and pipes will go into the shield vertically through the hole at the roof. Then, they will turn horizontal to pass under the supplementary lid over this hole and the steel beams. Finally, a hole in the lead roof will allow cables and pipes to get the vessel. This way, no unprotected lines of pipe or cable are left for radiation to straight penetrate the shielding. Figure 7.6 illustrates this possibility.
However other possibilities enabling to locate all or part of the electronics closer to the detector can be thought off. The modular design of the Castle Lead makes easier to find a place for the electronics inside the shielding structure.
7.2.7 Lead and copper
Providers
Several companies have been contacted as lead and copper providers. An Italian company, COMETA, and a Spanish company, TECNIBUSA, are being considered for two reasons: their competitive prices and their expertise in shielding materials. Possible optimizations of the melting techniques (use of steel matrices and melting in argon atmosphere) are currently studied with both companies in order to get a lower level of radioactive contamination. In case of need of an inner layer of copper, LUVATA company could provide the copper with a high level of radiopurity. In this subsection we will describe the radiopurity screening of materials and some provider offers.
Radioactivity screening of materials.
The radioactive contamination of materials such as copper and lead has been measured by Shiva company (EAGlabs) using Glow Discharge Mass Spectrometry (GDMS). These measurements are quite promising concerning the COMETA lead sample (370 Bq/kg in 238U –or Bi – and 72 Bq in 232Th –or 26 Bq/kg in 208Tl)222Estimates done considering secular equilibrium in radioactive chain, and also to a sample from MIFER’s lead provider(0,34 mBq/kg in 238U –or Bi – and 100 Bq in 232Th –or 36 Bq/kg in 208Tl), which is also TECNIBUSA’s provider. Improvement in melting technique would decrease radioactivity levels. Concerning copper LUVATA company could offer a level of radiopurity of less than 12.4 Bq/kg from 238U and less than 4 Bq/kg from 232Th (less than 1 Bq/kg from 208Tl). In case, we do not manage to get more radiopure lead ( 10 Bq/kg) we could include 10 cm of copper inside the lead castle (this would attenuate the208Tl 2615 keV photon coming from lead in a factor 10).
| Material | U238 | Th232 | Tl208 | Exp. or Provider |
| Copper | ¡70 | ¡30 | ¡11 | XENON |
| Copper | 12.4 | 4 | 1 | LUVATA |
| Lead | ¡660 | ¡550 | ¡198 | XENON |
| Lead | 330 | 100 | 36 | MIFER |
| Lead | 370 | 72 | 26 | COMETA |
| Lead | 730 | 140 | 50.4 | TECNIBUSA |
| Poly | ¡230 | ¡94 | ¡34 | XENON |
Provider offers.
| Company | small bricks | large pieces | Transportation |
|---|---|---|---|
| TECNIBUSA | 3.78 | 3.96 | no |
| COMETA | 2.70 | 3.00 | yes |
Provider offers have been requested to TECNIBUSA and COMETA providers and a summary of these offers is presented in table 7.2 where a difference or around 1€/kg can be observed between both, being the COMETA offer more competitive.
7.2.8 Overall dimensions and final Cost
For a lead shielding width of 570 cm, a length of 641 cm and a height of 584 cm, the estimated amount of material needed for the castle is: 50800 kg of lead, 4600 kg of copper, 15300 kg of steel as support and 1085 kg as base for lead roof, and more of 6400 kg as containerfor upper water bricks.
The cost of the shield is dominated by the price of the lead necessary for a minimum wall thickness of 15 cm, though the price of the copper could be important. The impact of the transportation on the total cost is minimal, thus non-Spanish company can in principle be considered as possible lead supplier. Preliminary estimations foresee 8-10 k€for transportation from Rome to Canfranc in case of the COMETA lead (2 k€/truck - 24 ton maximum load). The external structure, necessary to secure the lead castle, and movable mechanism to move the doors can be built by a machine shop at some of the participating institutions, still to be defined.
These structures are wholly dependent both on the thicknesses of the different material layers making part of the shield and on the precise dimensions of this shield, so its definite configuration will come at the end of the design. A summary of the cost is presented in table 7.3 where around 4 k€/year have to be added for nitrogen.
| [0.2ex] Lead | 153 k€ |
| Transportation | 8 k€ |
| Copper Layer | 50 k€ |
| Water bricks | 10 k€ |
| Steel structure (Material) | 20 k€ |
| Clean room | 10 k€ |
| Total | 251 k€ |
The total price can fluctuate according to the variation of the costs of lead and copper on the market. Consistent variations have been observed during last year. Considering security margins for these basic prices we can set an upper limit of 300 k€for the overall cost of the shield.
7.3 The Water Tank option
Water is an excellent shielding system for several reasons: a) once demineralized and fully purified, water is extremely radioclean, b) water is dense; a few meters are sufficient to suppress the gamma background to negligible levels; c) a water tank can be instrumented and turned into an active veto system (against muons and neutrons), and d) water is cheap and the engineering of a water tank straight-forward. Furthermore, one can use the experience of experiments such as GERDA and the synergy with experiments such as XENON-1t that will be building their water tank at about the same time than NEXT.
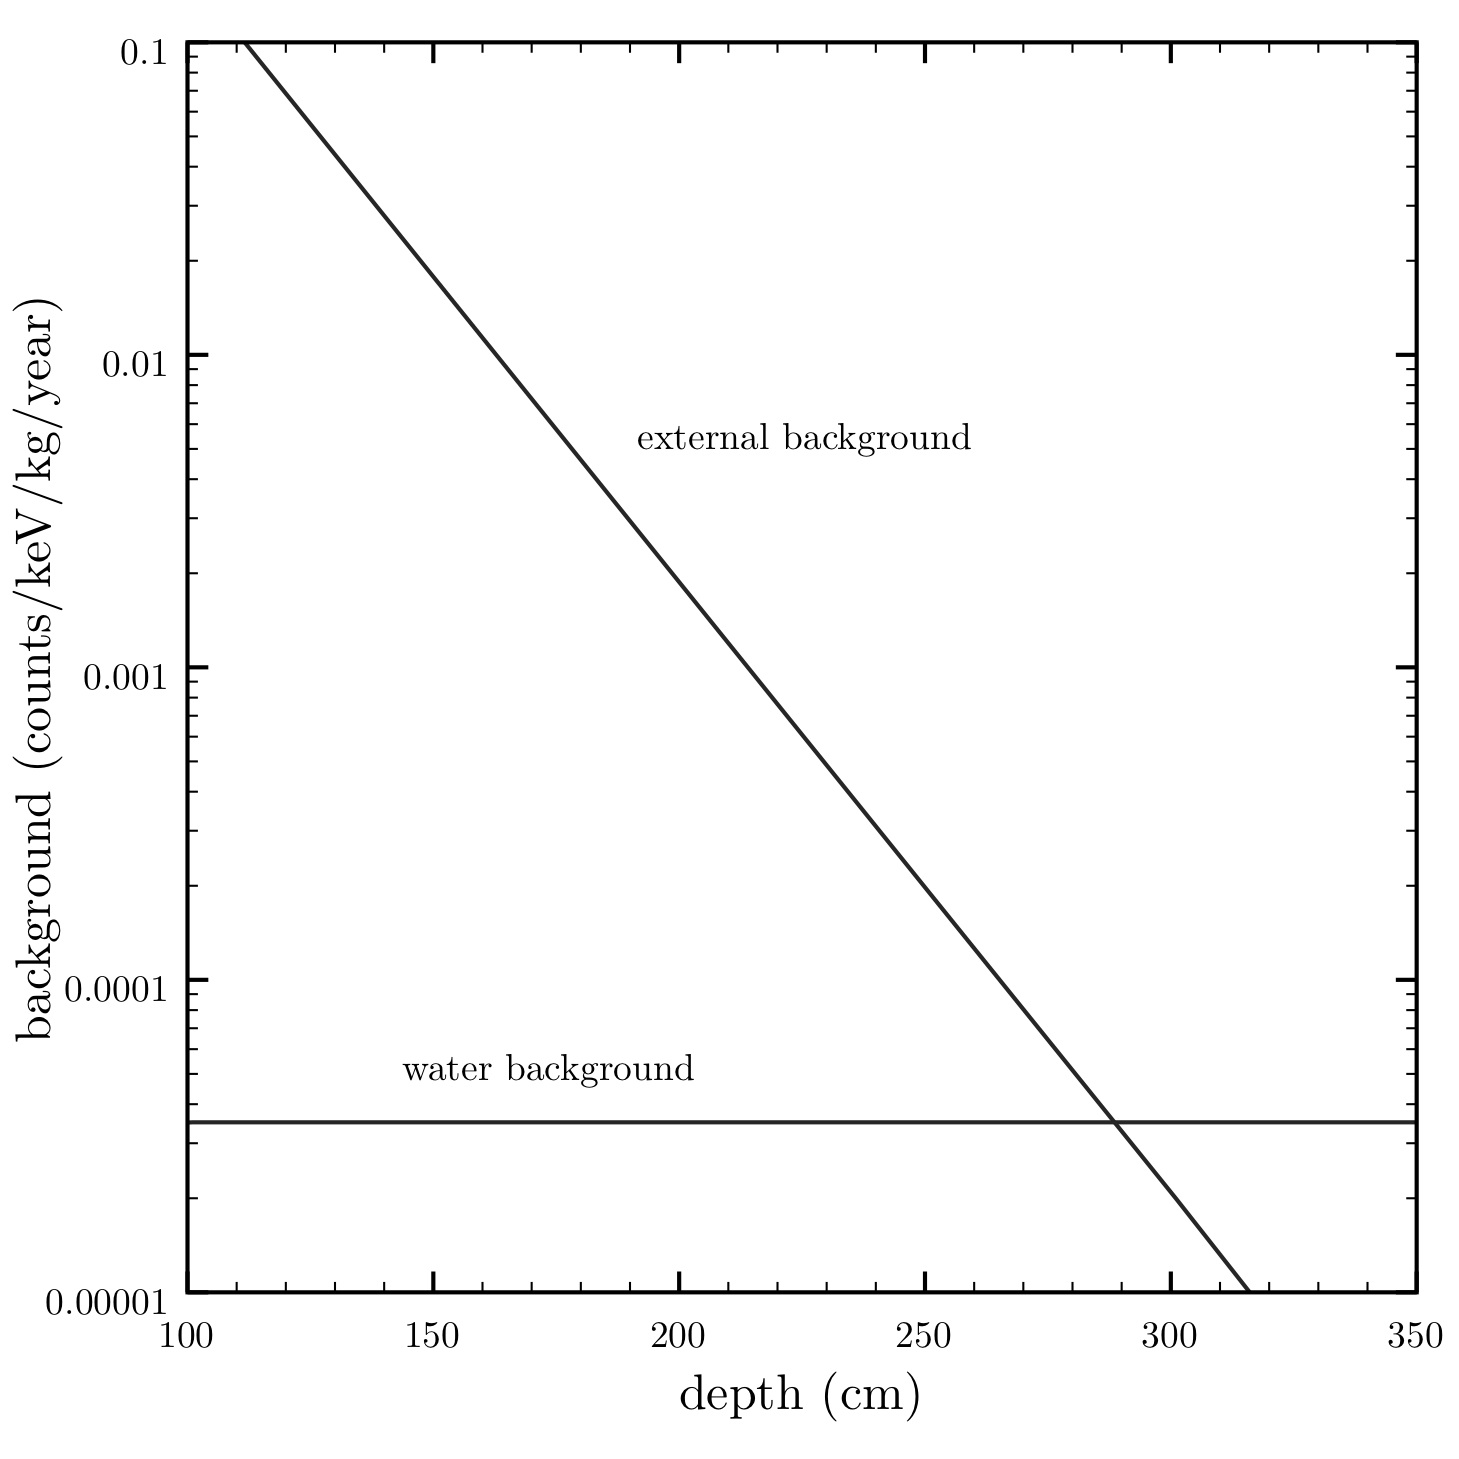
As shown in Chapter 6, the intrinsic background rate in NEXT is estimated to be of the order of . Further improvements, in particular in the radiopurity of the PV titanium could allow to reduce this background to or less. The shielding, therefore, must attenuate the background (in particular from the 214Bi and gammas emanating from the LSC rocks) below that level.
Figure 7.7 shows the background rate expected in the detector due to external backgrounds as a function of the water tank depth. At about 3 m one is reaching the background rate due to the residual contamination of the purified water, which contributes about , almost one order of magnitude less than the intrinsic background.
7.3.1 Design and construction of the water tank
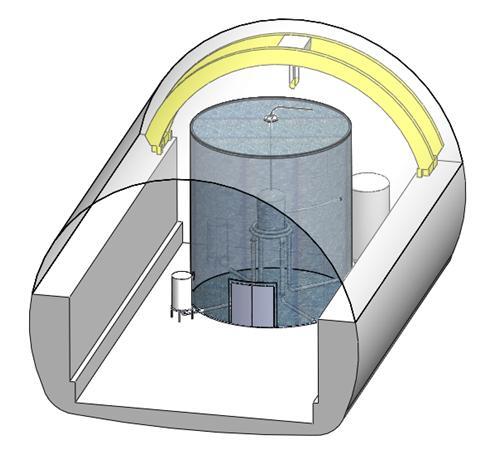
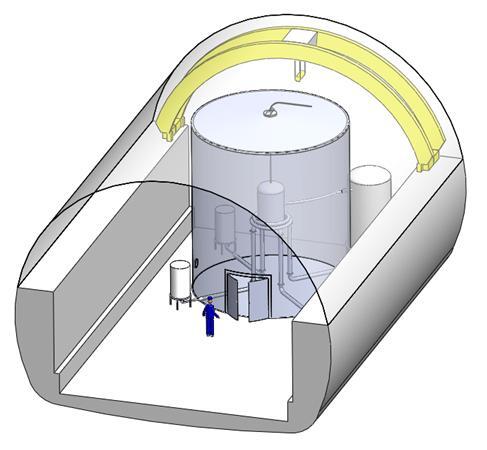
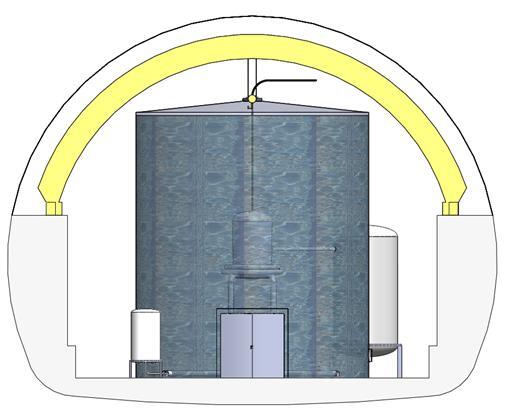
The water tank has been designed by the Mechanics group of UPV and UdG. It consists of a large cylinder, itself made of welded rings, with a diameter of 8 m and a height of 8 m. The floor is made out of 14 mm thick stainless steel plates, welded together, and placed on a leveled concrete floor. The lowest ring is made out of 7 mm stainless steel plates. The second ring is made out of 6 mm stainless steel plates while the upper rings and the roof are all made out of 5 mm plates.
Radon suppression within the tank will be achieved by a slightly over-pressurized nitrogen blanket which will be kept between the water level and the roof of the tank. In addition the water will be bubbled through a column of nitrogen to eliminate radon degassing from the tank walls.
The water tank will be built according to industrial standards. In particular, the API 650 code will be adopted together with Eurocodice 8 for seismic activities. In addition, the Spanish safety regulations will be followed. A certified commercial company will build the water tank. The construction is expected to start in fall 2011. The GERDA water tank serves as a reference concerning the safety aspects and the quality of the final product.
Due to its dimensions the tank will be built on-site. Construction materials and technical gases for welding will be procured by the contracted company. To build the tank we will make use of the 10 t crane for lifting the parts of the tank as it gets built. After construction, the welds will be tested by radiography, and the tightness of the tank will be tested with normal water.
The TPC will be built in place, inside the water tank. After testing with normal water, the tank will be emptied and dried, then transformed in a clean (dust-free). The detector will be assembled and tested inside the tent before filling with clean water.
To fill the water tank one needs extremely clean water. The simplest way to produce such water is to rent a water plant to a commercial company, unless the LSC decides to incorporate a clean water plant to its infrastructures. In order to keep the water as pure as possible, a continuous water purification will have to be done. Approximately 4 m will be pumped from the top of the water tank, filtered, and returned to the bottom of the tank. The purification loop will include:
-
1.
particulate removal
-
2.
radon stripping
-
3.
deionization
Each one of these tasks can be accomplished by commercially available off-the-shelf equipment.
7.3.2 Connecting the TPC to the water tank
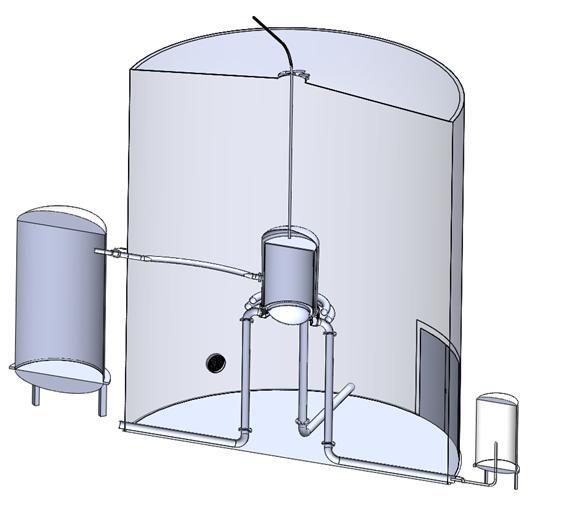
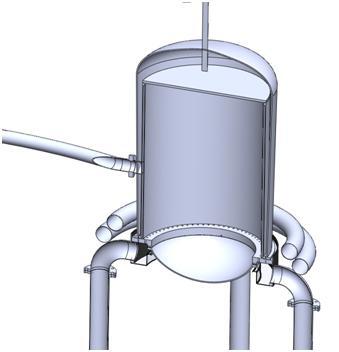
The construction of the tank itself is a relatively straight forward task. From the engineering point of view the main challenge is the pipe structure that plays a double role: a) supports the TPC, which has to be well centered in the water tank, and b) drives the signals, power and gases in/out the water tank.
The following connections are needed between tank and TPC vessel.
-
•
2 Xe circulation 1/2” flexible hoses
-
•
1 Xe chamber vacuum CF100 rigid tube
-
•
1 vacuum tubes CF100 rigid tube, including a manifold
-
•
1 HV 100 kV flexible hose
-
•
1 HV 30 kV flexible hose
-
•
1 CF100 rigid tube for emergency cryogenic deposit
-
•
1 in / out inlet for hot air with HEPA filter
-
•
4 rigid tubes for signal and power electronic PMT and Si-PM (also vessel support beams)
All service tubes entering the vessel will include special radiation shield connectors in the vessel side. Many other special requirements will have to be taken into account, such as the xenon vacuum pump being as close as possible to the vessel, mobile platforms to maintain and repair the vessel etc.
7.3.3 Water Purification System
A purification system to provide ultra–pure water is needed for the experiment. The requirements of this system depend on the desired water quality and, in general, use a combination of purification technologies, which must be used in an appropriate sequence to optimize their particular removal capabilities. In essence, it will consist of a reverse osmosis system to filter most of the impurities and of a re–gasification system with bubbling to continuously eliminate radon.
Next we describe the major components of the water purification system.
Raw water
The raw water is obtained from a spring and pumped to the laboratory. Hall A has two water taps, one inside and the other one in the entrance. In both cases, the pipe is DN20 and the flow is 0.5 l/s, approximately.
The analysis of the raw water has been performed by the Analaqua (http://www.laboratorio-medioambiental.com/index.htm) company. The results are shown in Table 7.4.
| Ions | Total concentration mg/l |
|---|---|
| Ammonium (NH4) | 0.05 |
| Potassium (K) | 0.2 |
| Sodium (Na) | 1.3 |
| Magnesium (Mg) | 4.1 |
| Calcium (Ca) | 36.1 |
| Strontium (Sr) | 2 g/l |
| Barium (Ba) | 0.2 |
| Carbonate (CO3) | 0.5 |
| Bicarbonate (HCO3) | 117 |
| Nitrate (NO3) | 1.0 |
| Chloride (Cl) | 4.6 |
| Fluoride (F) | 0.1 |
| Sulfate (SO4) | 6.8 |
| Silica (SiO2) | 4.1 |
| Boron (B) | 0.12 |
| Conductivity | 186 S/cm |
| pH | 7.6 U. |
Water requirements
Table 7.5 compares the water quality parameters to be used in NEXT to those used in GERDA and LUX. Notice that symbol ? denotes that the information has not been provided and - that the parameters are not checked.
Two particular features of GERDA are: i) the water tank temperature is in equilibrium with the laboratory temperature, about 10∘C, and ii) only the electric resistivity is monitorized.
| Parameters | Units | LUX | GERDA | NEXT |
|---|---|---|---|---|
| Elect. Resist at 25∘C | M/cm | 18 | 17.5 | 18 |
| Coliform bact. concent. | % ml | 10 | - | 10/100 |
| Total Organic Carbon | ppb | 50 | - | 50 |
| U | ppb | 0.002 | 0.00023 | 0.0001 |
| Th | ppb | 0.004 | 0.0001 | 0.0001 |
| 226Ra | mBq/m3 | ? | 2 | 2 |
| 222Rn | mBq/m3 | - | 0.1 | 0.1 |
| Dissolved O2 | ppm | 0.5 | - | 0.5 |
| Ultrafiltration | m | 0.2 | 0.1 | 0.2 |
| Temperature | ∘C | ? | 8 | 10 |
| Recirculation Rate | lit. per min. | 26.46 | ? | 26.5 |
| Fill Rate | lit. per min. | 26.46 | ? | 26.5 |
Purification system
In addition to the initial fill of ultra-clean water, the purification system has to guarantee that water quality is maintained during operations (this requires recirculation of the water) and that air quality (dust free) is maintained in operations with dry tank.

There are several procedures to obtain Ultra–Pure Water (UPW) which must be applied in an appropriate sequence (pretreatment, reverse osmosis and refining systems) to optimize performance.
Figure 7.10 shows a scheme of the various procedures:
-
•
The pretreatment equipments such as water softening and carbon filters are designed to remove contaminants that may affect purification equipment located after.
-
•
Reverse osmosis removes from 90% to 99% of all contaminants: dissolved solids, turbidity, asbestos, lead and other toxic heavy metals, radium, bacteria and many dissolved organics.
-
•
Filter system removes the impurities from water already pretreated. For example, ultraviolet radiation to reduce the TOC; ion exchanger to remove ions; vacuum de–gasser to remove about 99% of the oxygen and 96% of the radon.

Figure 7.11 shows the design of the purification system developed by the SMAC company. Notice that the water flows through all components of the system for filling, while through only a few of them for the circulation. We discuss next the most important systems.
Pretreatment equipments
Coarse Filter
50 micron filter with a pleated cartridge filter (not winding) of 20 inches, mounted on a opaque polypropylene container.
The system has pressure gauges to check the status of the filter. Filter suitable for a throughput of up to 4,000 liters / hour.
Anti–fouling dosage
Product dispensing equipment to prevent osmosis membranes of lime or other salts present in the raw water. It is composed by:
-
•
Water meter with pulse generator, maintenance–free for maximum pressure of 7 bar and temperature of 60 ∘C
-
•
Dispensing pump B–02, SEKO trade mark, series TEKNA, DPR type, model pH 602 with integrated control and proportional dosing
-
•
Injector and delivery pipe
-
•
Tank for dispensing anti–fouling, D-02
-
•
Minimum level probe that prevents the pump runs out of product
Medium filter
5 micron filter with a pleated cartridge filter (not winding) of 20 inches, mounted on a opaque polypropylene container.
Polishing filter
1 micron filter with a pleated cartridge filter (not winding) of 20 inches, mounted on a opaque polypropylene container.
*Reverse osmosis
Reverse osmosis plant
The plant consist of:
-
•
Set input instrumentation osmosis, consisting of conductivity with temperature correction, pressure switch and temperature transmitter
-
•
High pressure pump feeding a vertical multistage reverse osmosis. Parts in contact with the fluid and stainless steel rotors technopolymer. It is a type multistage pump Mercabomba mark, model V816F75T with a power of 7.5 kW and maintenance free. Pump has flanged connections and all parts in contact with water are, at least in stainless steel AISI-304
-
•
Reverse Osmosis composed of a fiber container with a capacity of two layers of 8 inch. Osmosis polyamide cartridges incorporate two 8 ”x40” Koch trade mark, model 8040-HR TFC-375 to ensure ion rejection of at least 99.5%, which will leave a water with about 7 microSiemens / cm. before entering the column deionization resins. Osmosis system has a total hydraulic performance of 65% in the configuration for a final plant flow of 48,000 liters / day.
Demineralization plant
The plant consist of:
-
•
Set input instrumentation deionization columns, conductivity transmitter consists of a valve sampler to take samples properly and gauge. Data from these sensors are sent to the PLC that determines the actions to be performed
-
•
Resin Column System de–ionizers anion/cationic regeneration system with semi-automatic. Columns with 70 liters each, and volumes up to 2,000 l/h
Filtering–polishing systems
UV lamp
To maintain water quality conditions in the microbiological aspect, an UV lamp will be installed.

Active carbon filtration
For adsorption of particles and organic nature pollutants will be installed two active carbon filters MG1050 of 486 mm in diameter and 150 l of carbon. Only one will be on duty, changing it manually when you reach the limit of service. With this system we obtain a filtration rate of 10.8 m / h, slow enough to allow adsorption of the pollutants. The bottles will be equipped with a manual valve KERAMIS K56.
Polishing mixed bed
Two bottles will be installed with 150 l of exchange resin of mixed bed refining unit to achieve and to maintain the desired conductivity.
Conductivity
To control the conductivity in the recirculation will be installed a probe CONDUMAX ENDRES + HAUSER W CLS 15D. For the transmission and control of signal will be installed a transmitter LIQUILINE CM442.
Ultrafiltration
Compact installation of a filtration plant Likuid-URA -20.
Rn elimination
Henry law determines the solubility of a gas in water is directly proportional to the partial pressure of gas to pressurize in a nitrogen atmosphere. The objective is to make the rest o the gases (oxygen, carbon dioxide, radon, …) insoluble in water. For this purpose, a pump with a pressurizing and depressurizing area with ultra–pure nitrogen atmosphere and positive pressure will be installed.
All equipment will be built in AISI 314 L, with an area of 1 m2 depressurization and recirculation flow rate of 1 m3/h.
Auxiliary components
Flowmeter
All systems work at a constant flow regulated by a PID and a flowmeter. It will be installed a flowmeter ENDRES + HAUSER PROWIRL PROLINE 72 F, which is Vortex type and it has no moving parts. In addition, it is calibrated to measure liquid volumes of very low conductivity.

Auxiliary tanks
To maintain the overall system and ensure the correct booster two auxiliary tanks will be installed PP, closed and pressurized ultrapure nitrogen atmosphere, with corresponding levels ENDRES + HAUSER trade mark PTP model 31. These deposits will be lined with an insulation of total thickness 0.6 mm.
Pumps
Installation of a pump PROLAC SWFI 20 OD KIT T100/112 CL in each pumping deposit.
Cooling system
Two refrigeration/evaporator machines with forced ventilation and a heat exchanger will be installed to keep down the temperature of the water reservoir.
Gas line
For the removal of Rn, it is needed to work on atmosphere of nitrogen and to prevent the dissolution of atmospheric gases in water, especially carbon dioxide would increase the conductivity and aggressiveness of water. For this purpose, a nitrogen generation system with a wealth of 99.999% and a capacity of 600 l/h for ”inert” all deposits will be used.
Air quality
In order to maintain the air quality during periods of maintenance (empty water tank), an air conditioning (TECNIVEL, CHF-4-AE) will be installed. This devices has two operating modes:
-
•
Mode recirculating air drying before starting maintenance work and after draining the tank
-
•
Normal mode, with complete air
This system keeps humidity and air temperature in the tank and the installed filters can match the quality of air to a cleanroom.
Chapter 8 Toward the NEXT-100 technical design
8.1 The NEXT-100 detector
The NEXT-100 detector consists of:
-
1.
The shielding system, described in the previous chapter.
-
2.
The NEXT-100 TPC, whose design is based in the ANGEL concept, described in chapter 3.
-
3.
The gas system.
-
4.
Other systems (DAQ, slow controls, monitoring).
In addition, the detector requires a data analysis system (DAS) to process the data.
In this chapter we describe some engineering aspects of the NEXT-100 TPC, as well as the gas system, DAQ and DAS. We also describe the general techniques mastered by our collaboration for TPB coating. Last but not least, we sketch an outline of the NEXT project, that will be further developed in the near future.
8.2 Engineering design of the pressure vessel
The entire detector including the pressure vessel and internals are all supported on a support flange of the pressure vessel. There is a large copper shield ring having extension ”fingers” around its periphery which rest in a groove of this support flange. This shield ring provides a base for mounting the SiPM plane, EL mesh and field cage. The SiPM front end electronics boards have some activity and are located behind this shield ring. The copper shield provides a heatsink for the F.E. electronics and will conduct heat to the support flange which is in contact with both water and the other pressure vessel parts, providing passive cooling.
8.2.1 Layout
The pressure vessel comprises four parts, all of pure titanium, ASTM grade 3 (or 2) which are bolted together:
-
1.
An upper head which contains the PMTs,
-
2.
A main cylindrical vessel, which incorporates at its base a thick section which allows penetrations for services (Xe gas flows, power and signal feedthroughs, EL HV cable, etc.),
-
3.
A support flange, upon which the detector is built, and to which floor supports connect to,
-
4.
A lower inverted elliptical head, designed to withstand pressure on its convex surface; the inverted design minimizes wasted Xe volume. This lower head is removed to access the SiPM plane and front-end electronics.
All flange pairs are bolted together with grade 3 titanium bolts and nuts, and have O-ring pairs for sealing. PCTFE is the preferred O-ring material, having the lowest leakage of any polymer. A small pumpout port samples the annulus between the O-rings to check for either Xe (out) or water (in) leakage.
8.2.2 PMT Head
The choices for this head shape (in axial cross section) are elliptical, torispheric or flat. The torispheric head has a spherical center section called a ”crown” with a toroidal edge section (”knuckle”), to transition to a short cylindrical section that is welded to the flange. It was chosen over an elliptical shape because the spherical shape of the crown allows all edges of radial openings drilled into it (normal to the surface) to be circular; this simplifies the machining of these openings and any flanges that mate to them. The torispheric (and elliptic) shape is far more mass efficient than a flat plate for holding pressure; a thickness of 15mm is required, whereas a flat plate requires close to 100 cm or more. It is only somewhat harder to machine the openings than for a flat head, CNC machining is not required.
The crown has 3 concentric rings of openings that accommodate pure titanium CF (NW100 size, 15 cm O.D.) flanges with diffusion bonded sapphire windows, for a total of 36 PMTs. A central opening having a large inside radius is used for the high voltage feedthrough, either the TAMU designed feedthrough, or a standard cable receptacle for a 100 kV medical X-ray machine (e.g. Federal Standard or Euro RXX designs) as pictured here: 8.1
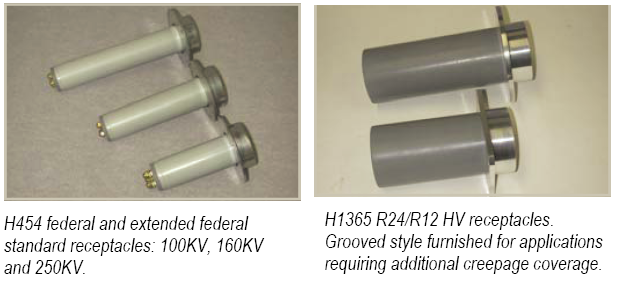
which can be made in radiopure materials, and rated for pressure. CF flanges are also used on the outer surface of the crown (with a welded-in housing) to both seal the PMT’s against water, and to provide a secondary containment for Xenon, should a sapphire window break or gasket leak. This design is chosen as the nominal design since, apart from the-beam welding of the head shell to the flange, no further welding is required and all the openings for PMTs and CF flanges can be machined into the crown.
An optional head having 60 PMT heads is also feasible, but will require the e-beam welding of custom machined PMT housings into bored holes in the torispheric head, since the close spacing disallows the use of CF flanges. Polymer gaskets , such as PCTFE or PEEK would be used to seal the sapphire windows instead of CF metal seals. Windows or gaskets are replaceable without removing the head in this design. This head has a further advantage in that the PMT faces need not be flush with the crown, and can be inserted down into the cathode buffer space, up to where the faces are roughly in a plane, thus reducing wasted Xenon volume. This head will be significantly more expensive to fabricate and require significant prototyping.
8.2.3 Design Requirements
The pressure vessel is designed to safely maintain a maximum operating internal pressure of 15 bar (absolute), with atmospheric pressure on the outside, and also to withstand an external pressure of 1.5 bar (5 m H2O hydrostatic pressure on outside, with full vacuum on inside). It also serves as ground potential, on its inside surface for the field cage, and must be compatible with the insulation gas, here Xenon, and withstand any breakdown. There is over 2 MJ of stored energy, which would be catastrophic if suddenly released by vessel rupture. It is designed in full accordance with American Society of Mechanical Engineering (ASME) Pressure Vessel (PV) Code, section VIII- Division 2 (or equivalent European Standard), and will be pressure tested to a minimum of 1.25x the maximum allowable pressure.
The Pressure Vessel will necessarily be a welded construction due to the size. Shells will be roll formed and seam welded, machined, then welded to machined flanges. There may be a final machining of each flange face after welding. Welds will be exclusively electron beam, made in high vacuum, and all welds will be fully radiograph inspected afterwards; this allows the welds to have full strength, reducing the wall thickness needed. Titanium is very easily e-beam welded, even in thick sections, with excellent resulting properties. Laser or diffusion bonding (welding) methods are also possible, however laser welding typically does not have the penetrating power of e-beam, and diffusion bonding is not mentioned as an allowable process in the ASME PV code.
The pressure vessel must also be corrosion resistant in ultrapure water. Titanium has excellent corrosion resistance in pure water; copper corrodes in ultrapure water, and would need some sort of radiopure barrier coating.
The pressure vessel interior surface also serves as a ground boundary for the field cage and must withstand potential sparkovers. It is not known whether titanium has better spark damage resistance than copper, it has a higher melting point, but lower thermal conductivity; testing is warranted.
8.2.4 Pressure Vessel Construction Issues
The final design of the Pressure Vessel will only be released after close consultation with the fabricator, to assure that no unexpected difficulties arise. A detailed specification will be drafted and potential manufacturers will be required to submit a full fabrication plan. Crucial details must be worked out with fabricators, material suppliers etc. to not only assure that the vessel is constructed in full accordance withe the PV code but remains radiopure when finished. Many important details must be worked out based on practical realities of supplier and manufacturer capability, such as where to place flange welds, what prototyping and testing must be done to assure the vessel is made correctly, what material samples are to be taken, what are permissible cleaning and preparation processes, etc. Below are some initial concerns with fabrication and assembly of the various sections:
CF Flange 36 PMT Torispheric Head
This head requires no welding of PMT housings into the crown, but is limited to 36 PMTs due to the large CF flange OD. The shell is formed by metal spinning, the crown is thicker than the knuckle and cylindrical section, so these sections my be formed separately and e-beam welded together. Due to the flange stud holes, which limit the reinforcing area around the PMT opening, a thicker shell is required, 20mm instead of 13mm for the welded 60 PMT head. It still requires welding the formed shell to the flange; this will be e-beam welded. However flange welds should not require a CNC controlled e-gun (as in the 60 PMT head), a fixed gun will work, with a rotary table holding and spinning the head. If the knuckle cannot be formed integral to the crown, it can be e-beam welded to it in the same manner. Machining of the CF flange ports should be straightforward, and could be done with a mill having a tilting head, with the PV head. The ports can be machined using milling cutters, for less chatter, but the final surface of the knife-edge will need be machined, ground, or burnished using a single axis (spindle) rotating tool such as a boring/facing head, to avoid scratches across the knife edge. Gaskets for the outer CF flanges should be chosen to be as soft as possible, as the knife edges may be more delicate in titanium than in stainless steel. Silver may be a good choice, especially for the outer CF flange gasket which must not create galvanic corrosion in either the Ti or gasket. Copper will corrode in ultrapure water. Tin may be an option as well, as it can be made radiopure. An option is to use O-ring seals; these may even be used in CF flanges. The inside surface of the head may need machining after welding to assure that a smooth ground surface results.
Welded-in 60 PMT Torispheric Head (option)
This head will likely require a CNC controlled e-gun to make the PMT housing to crown welds. The crown will be bored for the PMT holes; and then accurately measured in a coordinate measuring machine (CMM) afterwards as most of the crown metal is being removed, and nominal dimensions will change once all the holes are bored (Swiss cheese effect). The PMT housings will be machined to fit snugly in the bores, and they will need to be held in place with individual fixtures. Some provision for the e-beam to be absorbed without damaging these holding fixtures may need to be incorporated. There will be some degree of shrinkage around the welds, as the metal cools; this will require several intermediate CMM measurements of the remaining bores to assure that the welds are being made in the right place (unless welder can otherwise assure precise positioning). Thus the fixturing of PMT housings in bores will need to be staged, and the sequence of welding will need to be carefully thought through to assure accurate welding. It is likely that each ring of PMT’s will need to be fixtured and welded separately, and welds should be done around each ring in a staggered fashion, as is typically done in tightening bolted flanges uniformly. The PMT housings themselves will need to be machined from thick pipe or perhaps even solid bar, since the reinforcement section (large fillets on weld flange) must have a substantial radial dimension and cannot be formed as part of the crown.
Main cylindrical Vessel
There will be a longitudinal seam weld made after roll forming the cylinder which may need to be ground smooth. Edges will need machining to allow precise welding to flanges and to the lower thick section, which will likely be made separately.
Support Flange
This is a relatively straightforward machined plate, though required thickness may be high as this plate supports the entire detector, including the large internal copper shield, transferring weight to the outside legs. There will be a significant edge moment in the plate, and we desire to maximize the internal radius so as to provide clear access to the feedthroughs.
Lower Flat/Elliptical Head
This is also a relatively straightforward to fabricate. Shell thickness is nominally 6mm so this should be easy to spin. Carrying an external pressure requires tight tolerances on out of roundness or ellipticity, so CMM measurements should be made before welding. A method for safely lowering this head and moving it out of the way for SiPM service access is needed, as crane access is difficult.
8.2.5 Assembly of Pressure Vessel
There are currently 84 M20 bolts on each set of flanges which must be tightened uniformly around each flange. All bolts and nuts are also titanium which has a very high propensity for galling, which must be avoided. Silver plating should be considered on all nuts, and testing should be performed to see how many repeated bolt torqueings are allowable. Polymer coatings may be possible, but can have a friction coefficient that is too low to prevent nuts from backing off. No coating prove acceptable however, and it may be necessary to avoid all wrench torquing of large bolts by using a hydraulic tensioning/nut runner system as shown in fig. 8.2. Such systems work by screwing small hollow hydraulic cylinders (load cells) onto each bolt, above the nut (which is surrounded by the bridge), then pressurizing them all simultaneously through a common manifold, thus tensioning the bolts, then running the nuts down to the flange to maintain the bolt tension when the hydraulic pressure is released and the hydraulic cylinders are removed. This will also have the advantage of being much faster, far less strenuous, and give better results for bolt tension. It is envisioned that groups of these hydraulic cylinders will be loosely mounted to sections of a ring, so as to be easy to handle and install.

8.3 The NEXT-100 gas system
The gas system performs one of the pivotal roles in NEXT. It is responsible for removing electronegative impurities that would degrade the performance of the detector by reducing the drift length of charged tracks as well as causing opacity to UV light. The expected level of outgassing from the materials that make up the field cage and the reflector demand a constant purification of the gas in a re-circulation loop to a level of a few parts per billion (ppb) of unwanted contaminants. Additionally removal of the radon from the gas is highly important as the decay daughters would add an unacceptable level of background inside the active volume of the detector. The nominal re-circulation flow rate of 100 slpm has been identified as the required goal. NEXT-100 will operate at 15 bar, thus leading to the appropriate volumetric reduction from the standard temperature and pressure flow rate stated previously. During the physics exploitation runs the detector will operate with gas enriched to 90% level of isotope. The enriched gas has already been acquired by the LSC and delivered to the site. The high cost of the enriched gas places additional demands on the gas system to minimize accidental leakages and achieve full gas recovery in case of accidents.
The design of the system responsible for the filtration of the xenon follows closely the experienced gained at University of Coimbra, LBNL, UNIZAR and IFIC from constructing and operating smaller Xe purification systems. A CDR for the NEXT-100 gas system [60] intended for installation at the LSC has been approved by the Collaboration and is presently being constructed. System schematic and engineering drawing are shown in Figure 8.3 and Figure 8.4, respectively.
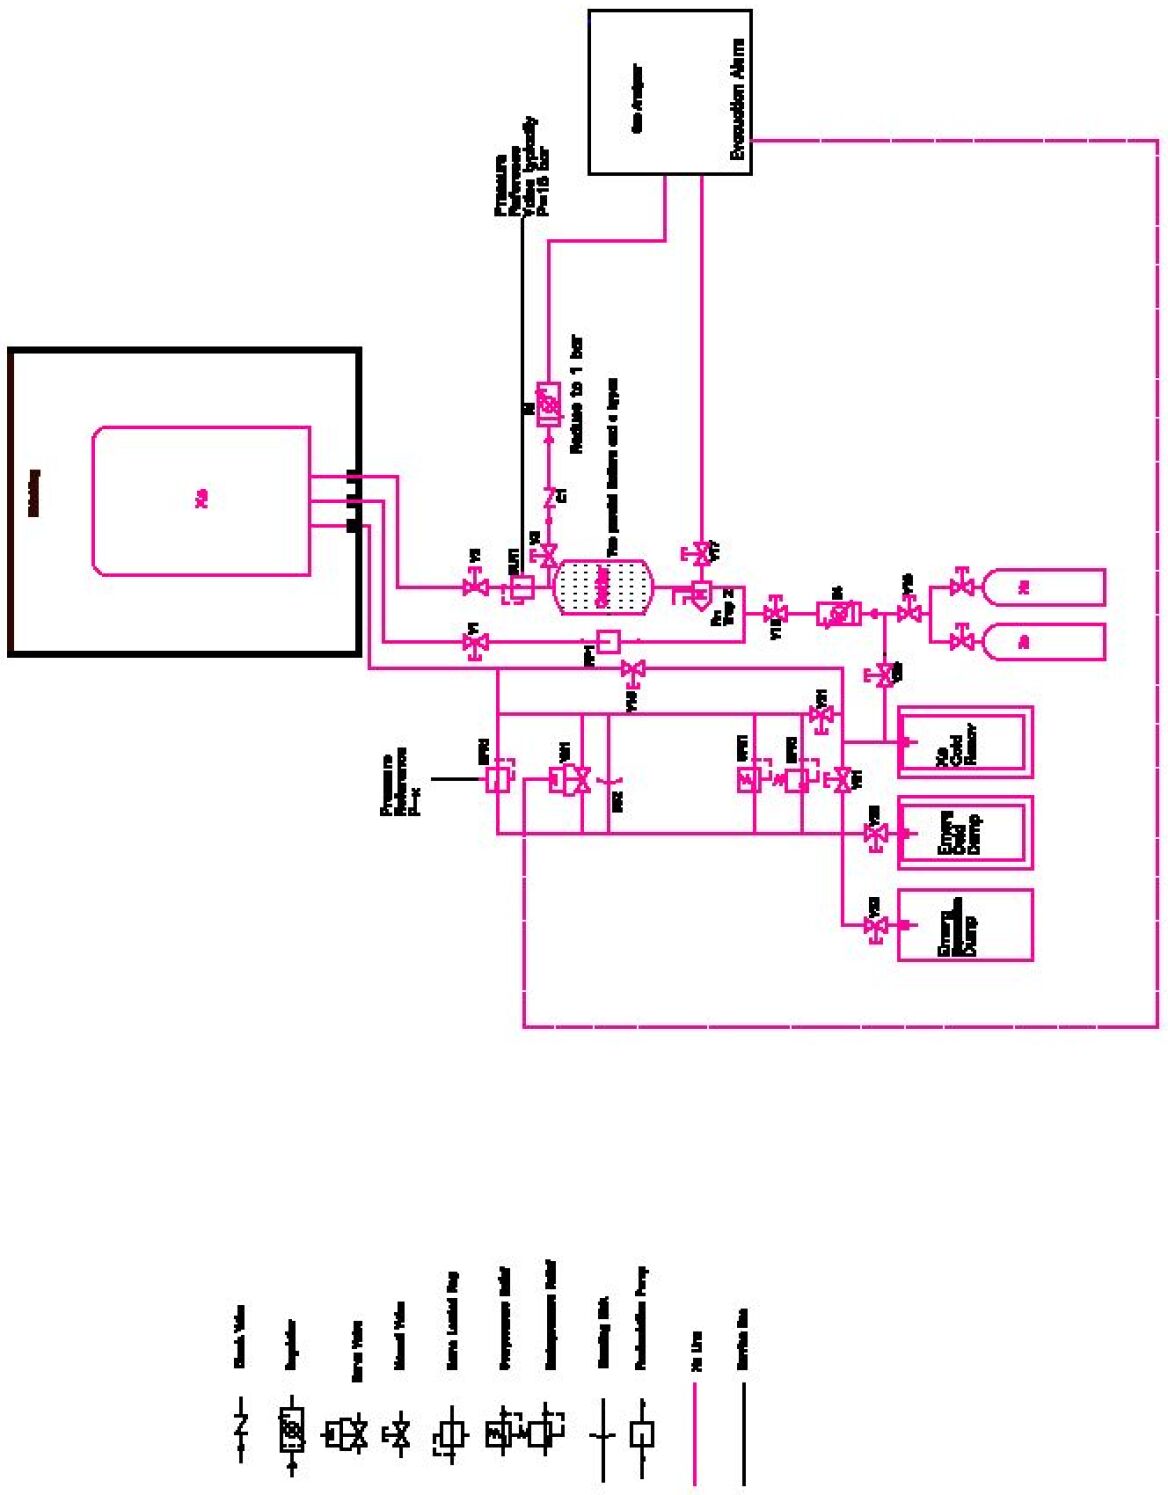
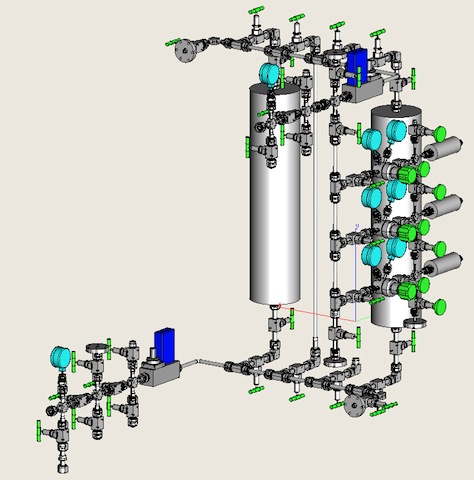
To insure the gas tightness and purity of the system, all piping and all the fittings have been chosen as 1/2” VCR stainless steel. All the gas valves are metal-to-metal seals with all the wetted surfaces also manufactured from stainless steel. An example of such valve is shown in Figure 8.5. These components were chosen to insure the cleanliness of the gas system as well as to allow the plumbing to be baked at high temperature (C) to remove water contamination prior to use.
8.3.1 Xenon purification
MicroTorr cold getter model number MC4500-902FV has been chosen as the purification filter for the Xe gas. Capable of removing electron negative impurities to less than 1 ppb, the model chosen has a nominal flow rate of 200 slpm, well in excess of the required flow rates for NEXT 100, offering sufficient spare capacity. The gas system will contain two such getters in parallel with a bypass. This configuration has been developed and used by the smaller gas systems operating at UNIZAR and IFIC. The second spare getter is placed in parallel in the event of accidental contamination of one of the getters, allowing uninterrupted running. The ability to bypass the getters will allow the testing of the purification of the gas and aid in diagnostic and monitoring of the gas system. A drawing of the MC4500-902FV getter is shown in Figure 8.6 (left).
While cold getter technology is capable of reaching the required purity levels in water and oxygen, a hot getter, like the one shown in Figure 8.6 (right), can also remove nitrogen and methane. Furthermore, 362 g of cold getter material has been measured to emit 1.64 atoms of Rn [61]. In that regard a future upgrade to a hot getter technology has been considered. Alternatively (or in addition to the use of hot getters) an effective means of removing Rn can be used. We discuss Rn trapping below.

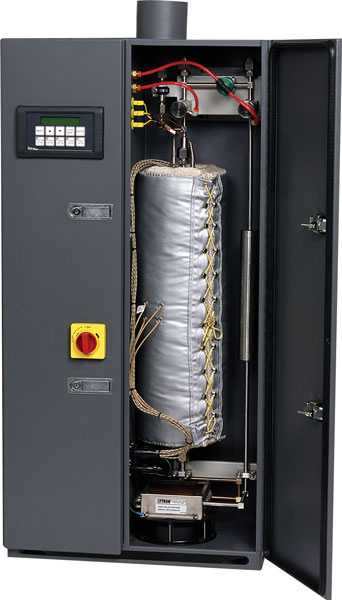
8.3.2 Rn Trapping
Radon is a natural by product in the decay chain of Uranium. Therefore, most materials will emanate Rn adding to the radioactive background. Several research groups in the world have been interested in developing methods of trapping Rn and preventing its entry into ultra low background detectors. A group at Queens University, Kingston Ontario, Canada has recently produced such a device [62]. Figure 8.7 shows such a trap. The trapping mechanism operates by passing the gas being filtered through a cooled column of activated carbon spheres. The carbon slows the diffusion of Rn and the low temperature retains the atoms in the trap.

The trap was tested with Ar gas containing 1 mBq/m3 activity due to 222Rn gas. Figure 8.8 illustrates the efficiency of this setup for 222Rn trapping.
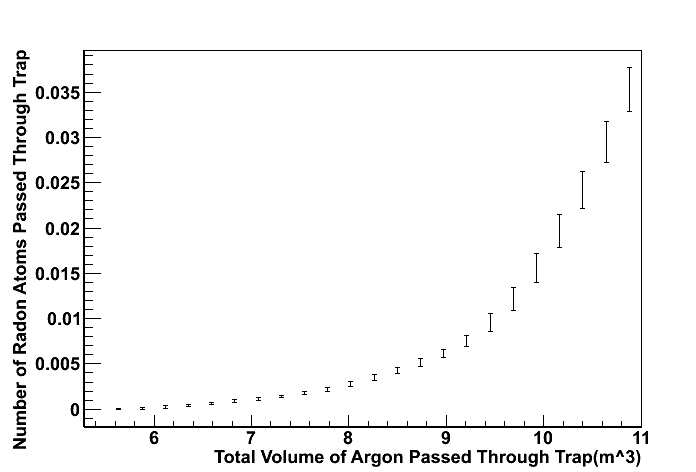
In the case of NEXT 100 the collaboration aims to develop and test a 222Rn trap similar to one describe above for use with Xe. The operating temperature of this trap needs to be higher than the one developed by the Queens University as Xe will also freeze at C. This can prove a very cost effective way of reducing radioactive background due to 222Rn in the NEXT 100 detector.
8.3.3 The Re-Circulation pump
The enriched 136Xe used in NEXT 100 project is very expensive and therefore the pump to move the gas through the re-circulation loop must have sufficient redundancy to minimize the probability of failure and leakage. Furthermore, to preserve the purity of the gas all metal to metal seals must be used. We have chosen a pump manufactured by Pressure Products Industries 111http://www.pressureproductsindustries.com/compressors/diaphragm_compressors.html. This pump is made with metal-to-metal seals on all the wetted surfaces. The gas is moved through the system by a triple stainless steel diaphragm. Between each of the diaphragms there is a sniffer port to monitor for gas leakages. In the event of a leakage automatic emergency shutdown can be initiated Figure 8.9.
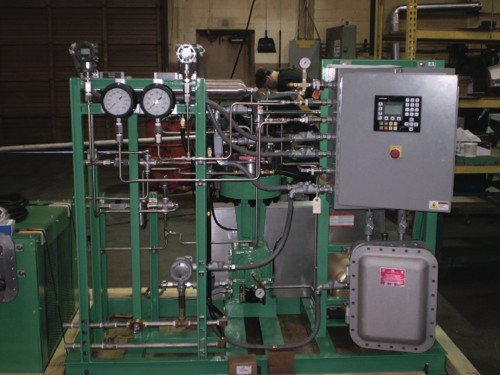
In terms of redundancy and reliability Figure 8.10 is showing failure curve for a single diaphragm. Under normal condition the time between failures during continuos operation per diaphragm is in excess of 40 years. Therefore this is a very safe, clean and reliable pump with a nominal flow rate of 100 slpm as is the goal of the xenon gas system.
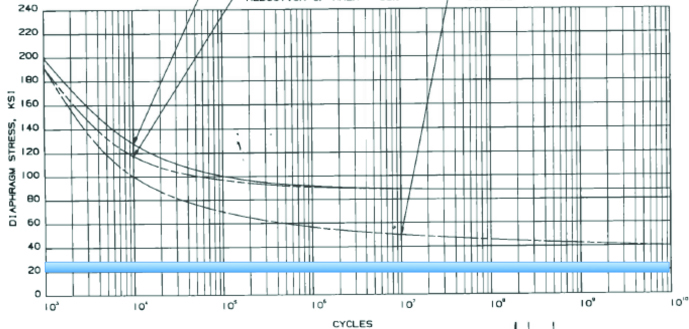
8.3.4 Xenon recovery system
In an unlikely event of an emergency condition the valuable Xe must be automatically evacuated into a safe container. This is best achieved with an emergency, stainless steel reservoir, permanently kept cold with liquid nitrogen. In an emergency condition an isolating valve connecting the detector chamber and the emergency reservoir will open and the enriched Xe will be cryo-pumped into a safe container.
Two primary conditions emergency conditions have been identified to trigger automatic evacuation. The first is an overpressure that could potentially cause an explosion. Because the gas system for NEXT-100 will be operated in a closed mode the overpressure condition could occur only under two possible conditions. The first is during the filling stage of the operation, when the system is being filled with gas and the second in the case of thermal expansion of the gas due to laboratory fire. In the case of overpressure we will have an electromechanical valve, activated by a pressure switch, that will open a pipe from the NEXT 100 chamber to a permanently cold recovery vessel. This will then cryo-pump xenon into the recovery vessel, causing the gas to freeze in the recovery tank. In the event of the electromechanical valve failing, a mechanical spring-loaded relief valve, mounted in parallel to the electromechanical valve, would open and allow the xenon to be collected in the recovery vessel. As a final safety feature, in case both the electromechanical and spring-loaded valves fail, a bursting disk, also mounted in parallel to the electromechanical and spring-loaded valves, will burst connecting the NEXT 100 chamber with the recovery vessel causing the Xe to be thus evacuated.
The second emergency condition would be detected as under-pressure indicating a leak in the system which would require evacuation of the NEXT 100 chamber to prevent Xe loss. If this is detected, an electromechanical valve sensing under-pressure will open and evacuate the Xe into the recovery vessel. As the recovery vessel is to be used for safety, there cannot be a valve to close once the emergency recovery has been completed. Therefore, in the event an automatic system is triggered, a signal will be sent to an operator to arrive at the laboratory to supervise post recovery procedures. The aim of post recovery is to move the collected Xe from the recovery vessel to a closable gas bottle for future purification and use once the problems that caused the emergency conditions have been rectified. This operation must be conducted by the responsible person and would involve cryo-pumping the gas collected in the recovery vessel into a stainless steel bottle which will be valved off post transfer. The same system can be used for controlled recovery of Xe if work needs to be done on the NEXT-100 chamber.
A conceptual drawing of the cold reservoir is shown in Figure 8.12. This sort of system has been already developed and built for the LUX collaboration by our TAMU collaborators. As a final line of defense in the extremely unlikely event that cryo-evacuation has failed the xenon will be evacuated into a flexible fuel bladder like one shown in Figure 8.12. In that way loss of Xe to the atmosphere will be held at an absolute minimal risk level.
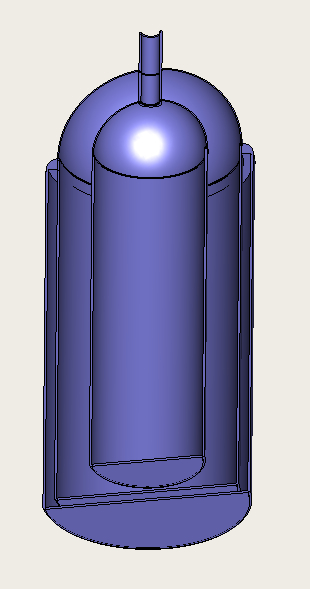
8.3.5 Monitoring and Control
The Monitoring and Control can be divided into passive and active roles. On the passive side the logging of temperature and pressure of the gas at different point in the re-circulation circuit will provide information about the health of the system. On the active side the monitoring of parameters that require automatic action from the system will be implemented. These would involve the control of pressure and and flow through the use of flow controllers of the type shown in Figures 8.14 and 8.14. The monitoring for Xe leaks and automatic decision to evacuate the Xe also forms part of this system. All this monitors and controllers will be integrated into the slow control of the experiment.

8.3.6 Electron Lifetime Monitor
The drift length of the NEXT 100 detector is envisioned to be over 1 m. This places a very high requirement on the absence of electro-negative imputes in the gas that would recombine with the charged tracks or absorb UV light. A lifetime monitor would able to determine the level of electro-negative impurities in the gas by measuring the mean drift length of changes. Such a device would be a very useful addition to the diagnostic arsenal of the Xe purification system. The development of such a device is a separate project and a number of the NEXT collaborators are interested in this.
Figure 8.16 shows principle of operation of a liquid Xe electron lifetime monitor developed my the ZEPLIN III collaboration and Figure 8.16 shows this devise prepared for operation [63]. This is a very simple piece of kit. However, because NEXT 100 will be operating using gaseous Xe liquifying the gas to measure the purity may not give accurate information if the impurities present in gas had been frozen by liquefaction. Thus a gaseous lifetime monitor will be developed by the NEXT collaboration in the future.
8.3.7 Vacuum Evacuation
To insure the cleanliness of the chamber and the Xe gas system prior to the introduction of Xe both the chamber and the Xe gas system need to be vacuum evacuated to as low pressure as possible. A reasonably good vacuum is in the range of to mbar. To achieve this the turbo-molecular pump needs to be positioned as close as possible to the vessel being evacuated. For that reason the turbo-molecular pump station will be directly connected to the NEXT 100 vessel through a large conductance valve rated for vacuum and pressure as close as possible to the vessel inside the shielding. The valve satisfying this requirement is shown in Figure 8.17, it is rated down to high vacuum and up to 25 bar pressure. It has a 100 mm orifice and thus well suited to the vacuum needs of the NEXT 100. A smaller valve of the same type has been extensively used by out Laurence Berkeley Laboratory collaborators. After reaching desired vacuum the valve will be closed, the pumping station removed and the valve enclosed in a radio pure cap to shield the detector from the radioactive impurities in the materials that make up the valve but also to protect the valve from the corrosive action of the purified water. The details of the water shielding is discussed elsewhere.
However, many internal structures of the NEXT 100 detector, such as the light pipe surrounding the active volume will now allow good conductance for vacuum evacuation. Therefore, the chamber will be flushed with Ar and again evacuated a number of times. Furthermore, continuos re-circulation of the Xe gas will further aid it cleaning the system of impurities.
The Xe gas system constructed from 1/2” pipe will have low conductance for vacuum evacuation and therefore instead of evacuating the system from a single pint the vacuum manifold will be connected to several points simultaneously and the system heated to C to remove water. Also flushing with Ar several times with air in the cleaning process. Finally, as in the case of the main detector, continuous gas re-circulation will clean the Xe gas system.
8.4 Data Acquisition
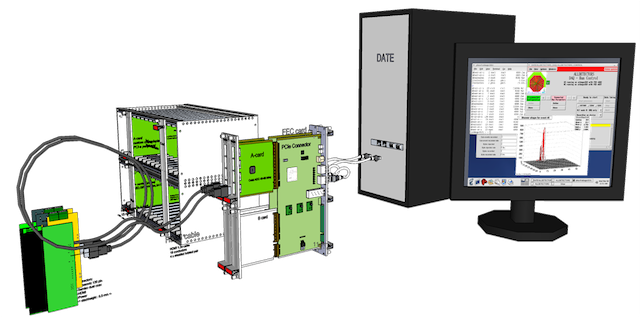
The DAQ has been developed in close collaboration with the CERN RD-51 collaboration [64]. RD-51 defines a scalable (target applications ranging from small setups to large scale experiments) and configurable (based on programmable logic, allowing different trigger and DAQ schemes) DAQ architecture that has been developed by CERN-PH-AID and UPV-ELEC under the name SRS (Scalable Readout System) [65]. Figure 8.18 shows the main SRS components that are the base for NEXT-100 electronics.
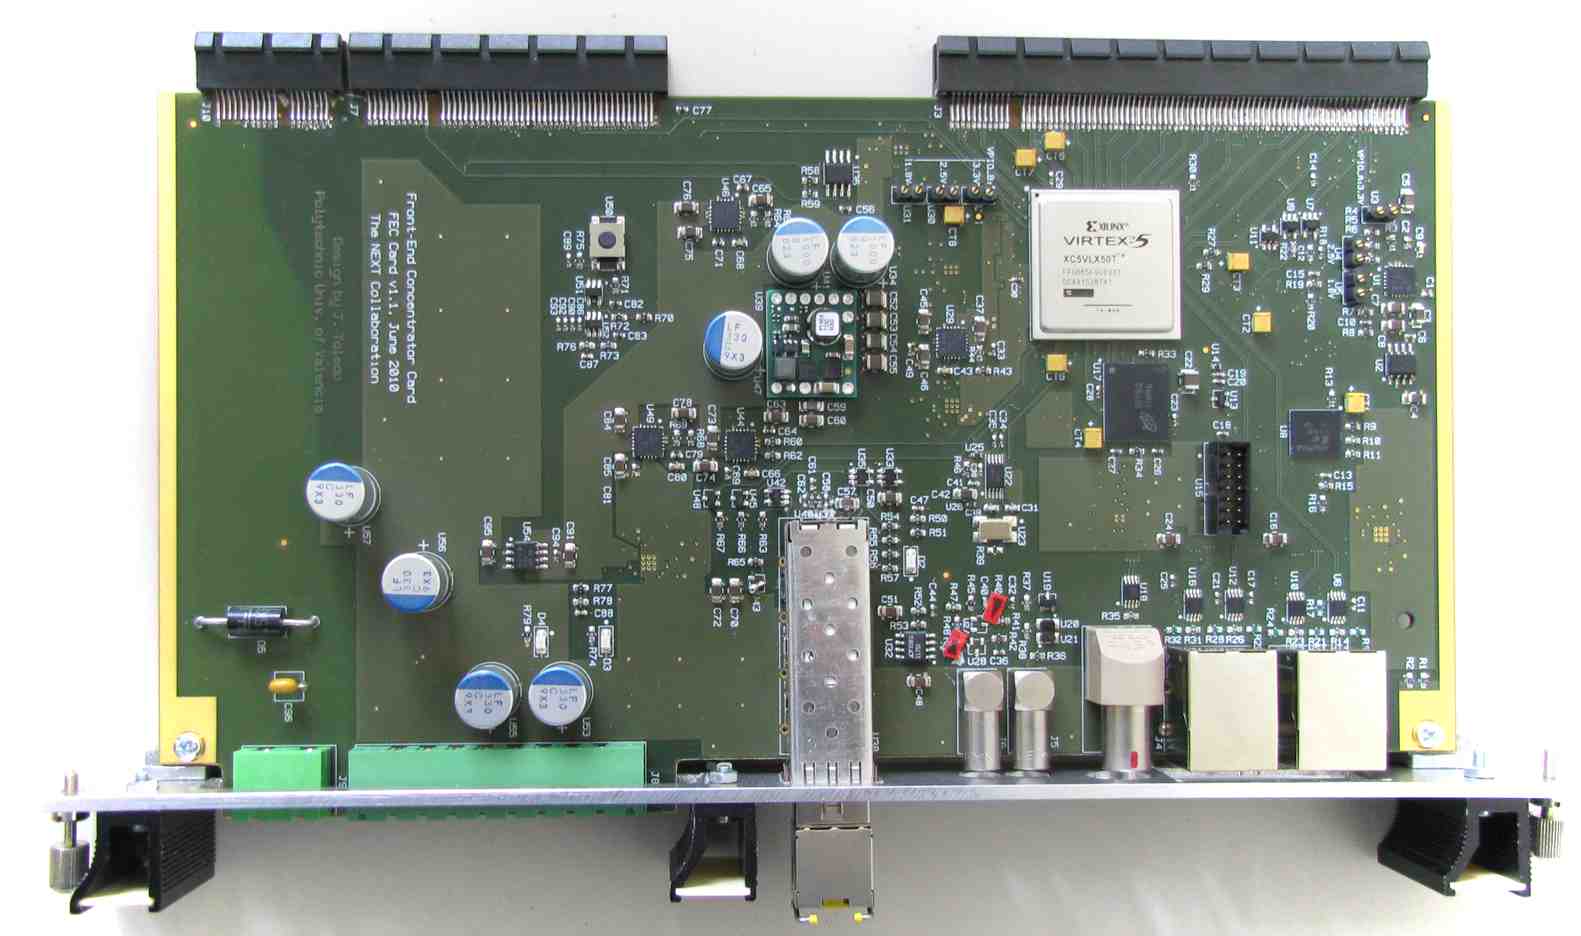
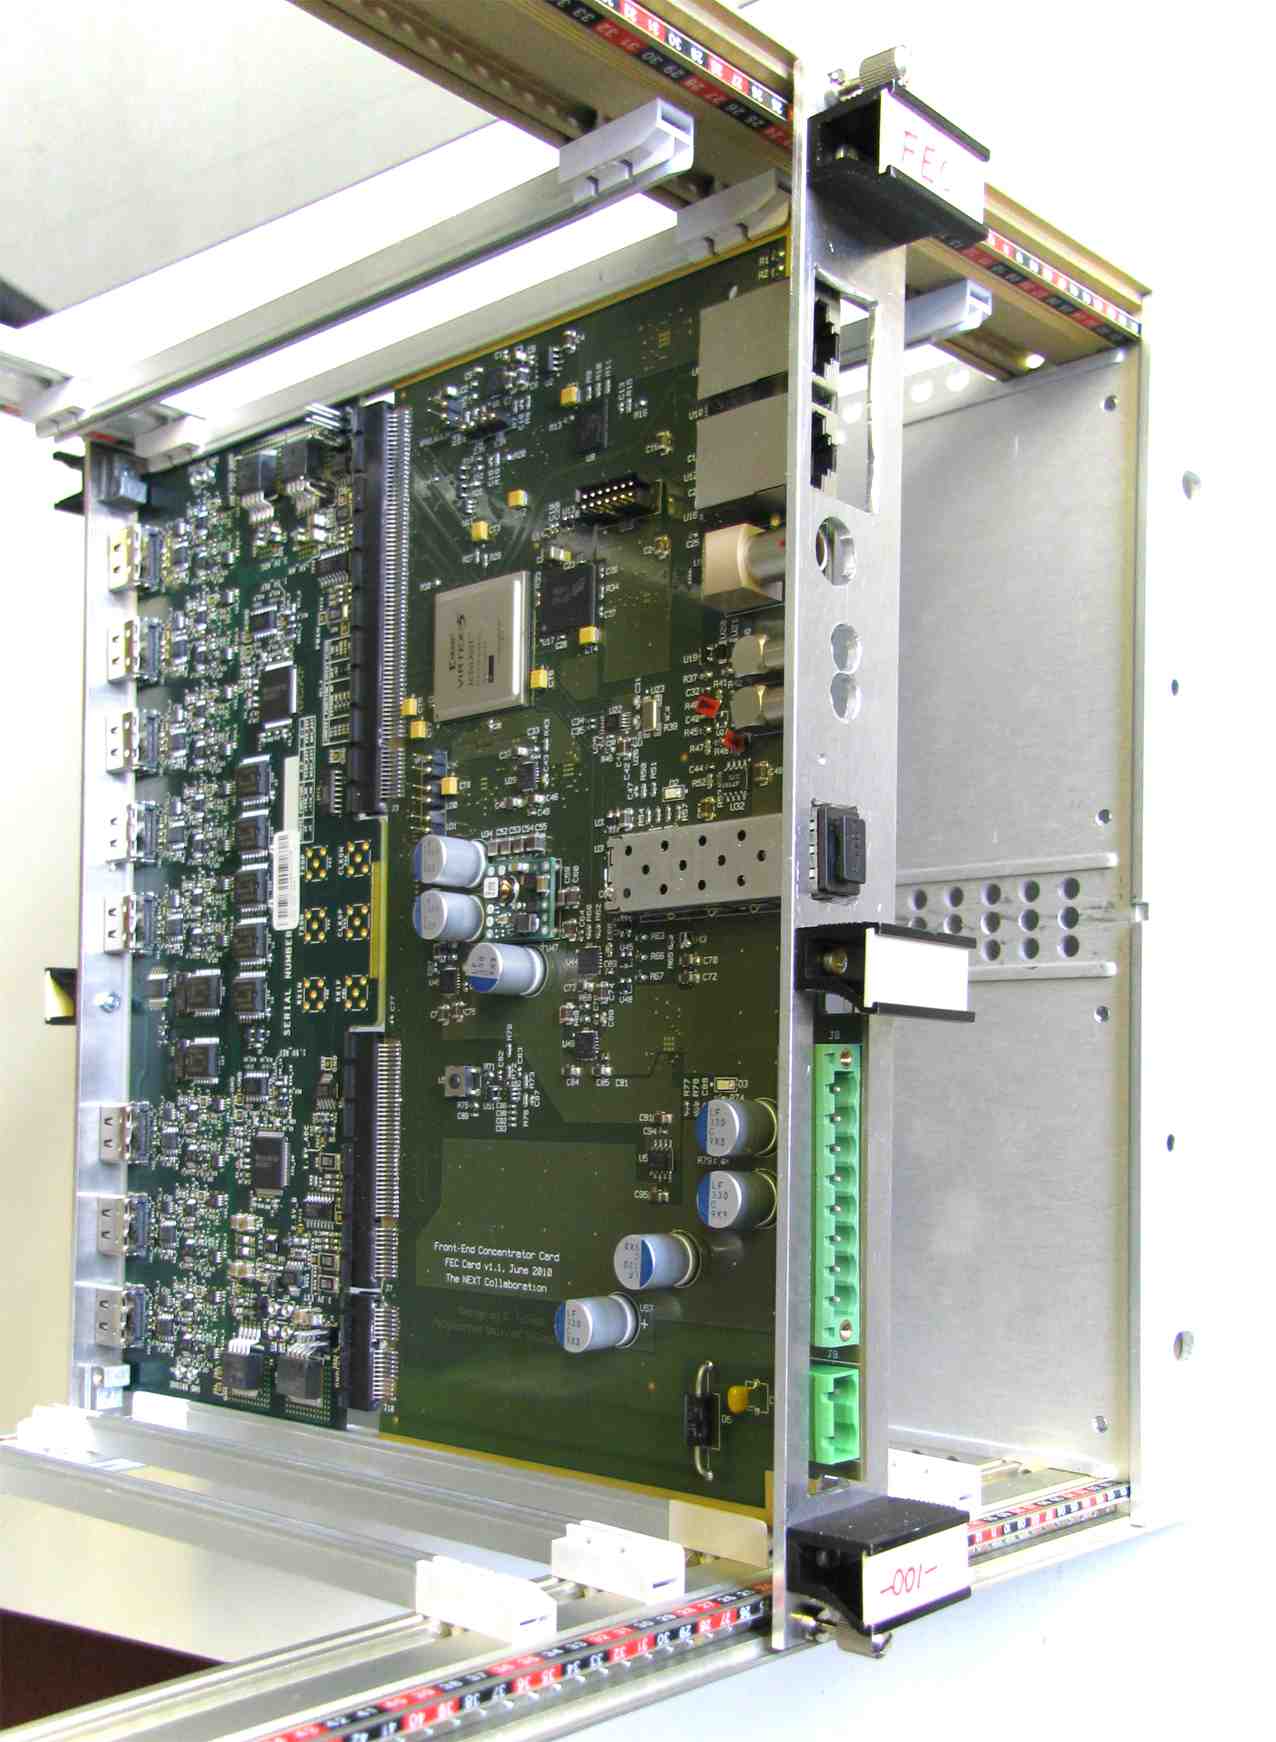
The three main hardware components in the proposed architecture for the DAQ and Trigger systems are:
-
•
The FEC card: The Front-End Concentrator card (FEC card) (Figure 8.19) is a generic interface between a wide range of front-ends and the Online system. This is accomplished by using interface add-in cards between the FEC module and the application-specific front-ends. The ensemble (FEC + add-in card) form a mm Eurocard that fits on a 6U 19” subchassis. Designed, produced and tested by UPV for RD51 and NEXT, it is currently used in several RD-51 applications other than NEXT, like a muon scanner application in the Florida Institute of Technology [66], the readout of a THGEM in Coimbra/Aveiro/Israel, the characterization of GEM foils at the Helsinki Institute of Physics and the readout of resistive strip MM at CERN (ATLAS group). Coming applications include BEETLE and TIMEPIX ASICs readout, as well as support for the future CERN GBT link. The FEC card design is currently being upgraded to accommodate a larger and more powerful FPGA, a 4x larger and 4x faster on-board event buffer, on-board power supply filters for enhanced noise immunity and extended I/O connectivity with the addition of three SFP+ sockets. This will allow Ethernet-based slow controls.
-
•
The CERN/RD-51 ADC add-in card: The CERN/RD-51 ADC add-in card is used to digitize energy and trigger outputs from up to 16 PMTs using HDMI cables between the front-end boards and the digitizers for enhanced signal integrity. The ADCs are 12 bits and the digitization rate for PMTs will be 50 MHz. Data are processed in the FEC module and are sent upstream to the Online system via gigabit ethernet links. Designed at CERN, there are currently 6 ADC add-in cards available for NEXT-1 operation and other 4 cards will be received from CERN in May 2011. This card is also successfully being used in other RD-51 applications. As shown in Figure 8.20, the FEC and the ADC card fit together to form a powerful 16-channel 12-bit 40-to-50 MHz digitizer with strong data processing capabilities in the FEC FPGA. Processed data are sent to the Online system or optionally to an upper DAQ stage (SRU modules) via gigabit ethernet (GbE) links (copper or optical) or dedicated LVDS links over standard RJ-45 connector and CAT6 network cable (400 Mb/s sustained throughput tested by UPV-ELEC in the NEXT-1 setup).
-
•
The CDTC16, a digital interface card for the tracking plane readout. This is a FEC add-in card and a NEXT design. It receives digitized data from up to sixteen SiPM front-end boards via standard network cables. Data are passed to the FEC module, where sub-events are built and then sent to the online system via gigabit Ethernet links.
-
•
The SRU (Scable Readout Unit) module is a derivative of an existing CERN module (named LCU, LED Control Unit). It accepts LVDS connections via standard CAT5 or CAT6 network cable from up to 36 FECs and is intended for large-scale setups. Though GbE is the chosen DAQ link technology for NEXT-1, 10-GbE will be implemented and tested in the SRU module in 2011, with the aim to evaluate 10-GbE for use in NEXT-100. The SRU module can be used for distributing trigger and precise timing to the readout modules, as well as to provide to the slow controls system with access to the readout modules and indirectly to the front-end electronics.
The Online System is a PC farm running the proven and supported CERN ALICE DAQ software (named DATE after Data Acquisition and Test Environment). DATE has been modified to support GbE technology in request of RD-51 and also as candidate technology for the ALICE DAQ upgrade. NEXT signed a memorandum of understanding that granted us the right to use DATE.
Figure LABEL:fig.ndaq shows the DAQ system currently operating at NEXT-1-IFIC. Each module can take up to 8 PMT channels in raw data mode in the current FEC version, but will be able to accommodate 16 channels with the revised FEC available in Winter 2011. We need 5 modules to run the current configuration of NEXT-1-IFIC (38 PMTs) and 8 modules to run the ANGEL detector (60 PMTs). The system is essentially ready for NEXT-100 operation.
The proposed DAQ system can work either in external trigger or in self-triggered mode. In the external trigger mode, either a single SRU or two dedicated FEC+CDTC16 ensembles act as clock+trigger fanout to all DAQ FECs using the available RJ-45 connectors. This scheme has already been proven in the NEXT-1 prototype in Valencia. In self-triggered mode, the upstream channels in the RJ-45 connectors carry trigger candidates from the DAQ FECs to the trigger SRU module, where a centralized low-latency trigger algorithm is run.
8.4.1 FE electronics and Data Acquisition for the tracking plane
The tracking plane poses a greater challenge due to the much higher number of channels. Although having ten thousand signal wires across the TPC vessel is in principle feasible, in-chamber electronics appears as a more practical solution. This implies installing SiPM front-end electronics, digitizers and data multiplexers inside the vessel in order to reduce the number of feedthroughs.
Currently we are studying two options: a) using 64-ch ASICs that include the analog chain (amplifier + integrator), the digitizers and the data multiplexer, and b) small scale discreet electronics mounted in 64 PC boards.
The possibility of adapting one of the existing ASICs for our application arises from the expertise existing in the UPV group concerning the development of chips such as the ALTRO, widely used in ALICE and in many other HEP experiments. On the other hand, we need a solution fully operative in less than 2 years. Therefore we will also explore the use small PCBs with discreet components. Each PCb would also serve 64 channels, corresponding to a Daughter Board.
In both cases a commercial serializer/deserializer chip interfaces the ASIC/PCb to an optical transceiver, using a single optical fiber for a full-duplex data connection to the DAQ stage (FECs equipped with specific add-in cards). With this multiplexing factor, 10k channels require just 157 optical links across the vessel.
The group’s expertise and know-how on ASIC design for PMT and SiPM readout is shown in [67, 68]. Moreover, R. Esteve is one of the co-designers of the popular ALTRO chip
A modification of the existing CDTC16 card in which RJ-45 connectors are replaced by optical transceivers has to be designed. This card will interface the readout of the SiPMs to the FEC cards. The multiplexing factor in the FECs is determined by the trigger rate and the channel occupancy, taking into account that the FEC throughput is limited to a nominal 1 Gb/s, but a factor of 8 is a conservative one and will result in the need of 157/8=20 FECs with its optical-to-electrical add-in cards.
We must also design and test a full-duplex optical link for 1.25 Gbps that includes the following elements:
-
•
Serializer/deserializer: a commercial IC that interfaces the ASIC via 8 or 10 bit buses and, on the other side, an optical transceiver. As an example, the TLK1221 part from Texas Instruments could be used. It has a power dissipation of 200 mW.
-
•
Optical transceiver in a reduced footprint like 19, low power, preferably carrying the upstream and downstream channels in a single fiber.
-
•
A fiber optic vacuum feedthrough and 4 or 8 optical fibers in order to reduce as much as possible the number of feedthroughs in the vessel.
-
•
An air-side fiber of approx. 25m, a mating optical transceiver and a receiving FPGA.
With a total of 30 FECs, a single SRU unit (3k€) can be used to receive trigger candidates and distribute trigger, slow controls commands and a common clock to all the approx. 30 DAQ FECs in the experiment, resulting in a compact and cost-effective trigger system.
8.5 The NEXT offline software
NEXT software includes the NEXUS detector simulation framework, the nextoffline software framework for reconstruction and data analysis, and the nextonline framework which has been summarized in the DAQ section.
NEXUS includes:
-
•
A simulation package using the latest version of Geant4 (version 4.9.3 at the time of preparing this CDR). This version contains important, non-backward compatible, improvements in the low-energy electromagnetic physics processes, an essential feature for our simulations.
-
•
Charge drift and electroluminescence packages.
-
•
Microscopic models of EL based on Garfield.
-
•
Detailed geometries for the different prototypes (NEXT-0, NEXT-1) as well as for NEXT-100, including the water tank (see, for instance, Figure 8.21).
-
•
A preliminary version of an event generator for the gamma particles reaching the LSC Hall-A has been developed. This uses measurements taken in the “old” laboratory. As soon as new measurements are available, they will be incorporated into the imulation.
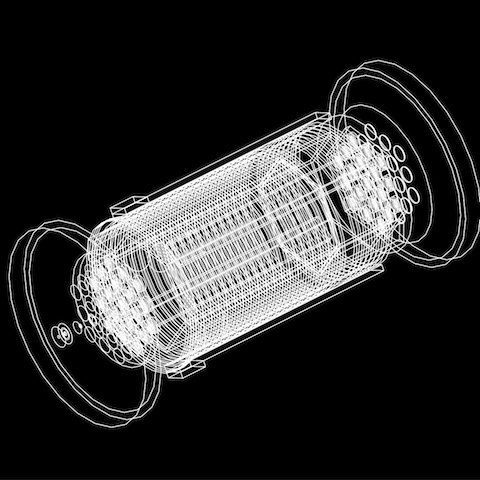
Concerning the nextoffline software framework:
-
•
It can read and process both real and simulated data.
-
•
In particular, simulation of electroluminescent light production, propagation and detection can now be made also in nextoffline and not just in NEXUS, using look-up tables. This approach is motivated by the need to speed up the NEXUS full simulation.
-
•
A simulation of the photosensor (both PMTs and SiPMs), front-end electronics, and digitization response properties has been implemented. This allows the study of effects related to dark current and electronics noise, photodetector gain spread, analog/digital signal non-linearity, deadtime, and thresholds.
-
•
Significant efforts were also devoted to the reconstruction code. Algorithms to reconstruct the total energy deposited within the chamber per event, as well as the imaging of the energy deposition within the chamber, were designed, developed, and tested. The imaging provides a pixelised 3-dimensional picture in terms of chamber volume elements (or voxels). These algorithms are based on the Maximum Likelihood Expectation Maximization method, typically used in medical imaging, and it assumes an EL TPC, although it could be easily adapted to other technologies. An example of a reconstructed track is shown in Figure 8.22.
-
•
An improved and more realistic algorithm to reconstruct tracks (for the topological signature) has been developed, starting from the imaging of the energy deposition within the chamber discussed above. Such algorithm is based on graph theory: for each event, the group of voxels with an energy deposition different from zero can be regarded as a graph, that is a set of vertices and edges that connect pairs of vertices. Notice that the algorithm is used to search for the two-electron (“spaghetti with two meat balls”) signature, but not to compute the total energy of the event, which is found by adding (after geometrical corrections) the contributions of all the PMTs.

Much progress has also been made in differentiating signal from background events via topological information, using simulated data, as described in the previous chapter.
8.6 Shifting the VUV light for NEXT
In NEXT detector application, the SiPMs are the photosensors mostly suitable for the pattern reconstruction as argued earlier, with the only drawback of poor sensitivity to the Xenon 175 nm scintillation light. The high cost of APD’s and UV sensitive photomultipliers makes the use of a wavelength shifter (WLS) on SiPMs an essential issue in the development of the tracking readout of NEXT detector. 1,1,4,4-Tetraphenyl-1,3-butadiene (TPB) of % purity grade is an organic WLS widely used in many experiments to shift scintillation light produced in the UV by Liquid Argon or Liquid Xenon to the visible, where it can be detected by commercial photomultipliers. Among the commonly used organic WLS fluors, TPB is the WLS whose emission spectrum matches best the photo-detection spectrum of the SiPMs (see Figure 3.10) as it absorbs light in a wide UV range and re-emits it in the blue with an emission peak around 430 nm. In addition, TPB can be applied by vacuum evaporation from crystalline form directly onto surfaces as vessel walls or the front face of photomultipliers. The TPB coating obtained that way is reported to be hard and durable with good adherence to the substrate and high resistance to mechanical abrasion. It is not soluble in water but may be degraded by humidity, and can be removed when necessary by the use of benzene or other organic solvents.
A TPB coating procedure on SiPMs has therefore been developed at ICMOL and IFIC with special attention to the search of the coating thickness that provides the optimal fluorescence efficiency as well as the conditions of long-term stability of the coatings. Indeed, the fluorescence efficiency of the coating depends on its thickness as has been shown in previous published studies [69]. It decreases with increasing coating thickness, whereas it is limited by evaporation inhomogeneity at small thicknesses. This is due to the evaporation pattern of TPB which does not sublime when heated as TPH does for instance, but goes through a liquid phase with appearance of bubbling that can lead to a poor quality coating if not well controled. The protocole of coating on SiPMs has therefore to be investigated in order to meet the requirements of both high fluorescence efficiency and high coating quality.
8.6.1 TPB coating technique at ICMOL
The coating facility of the Instituto de Ciencias de Materiales (ICMOL) was used. This is located in a class 10.000 clean-room since stringent cleanliness conditions are required for high quality depositions of the Molecules on different substrates. In Figure 8.23 a photograph of the evaporator s shown. This is enclosed in a glove-chamber filled with with N2 to insures the conservation of the organic compounds by avoiding their oxidation and hydration. The coating setup consists in a vacuum chamber enclosing 4 ceramic crucibles used to contain and melt simultaneously up to 4 compounds. During the TPB evaporation campaign for NEXT the whole setup was cleaned to remove any traces of other Molecules. One crucible only was used and filled with TPB pounder. It was heated by a cartridge with an adjustable current for monitoring the temperature and controling the evaporation rate to avoid bubbling and sputtering of the TPB onto the exposed substrate.
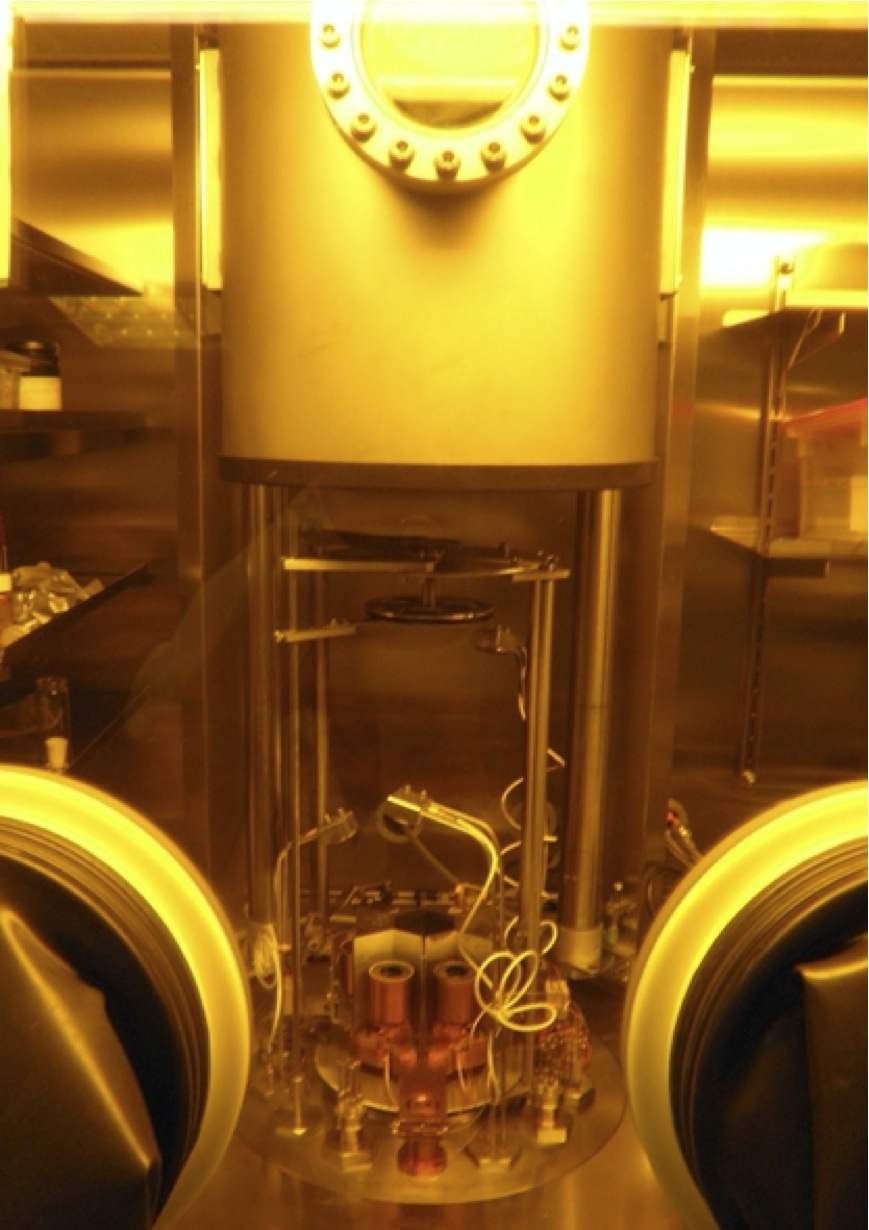
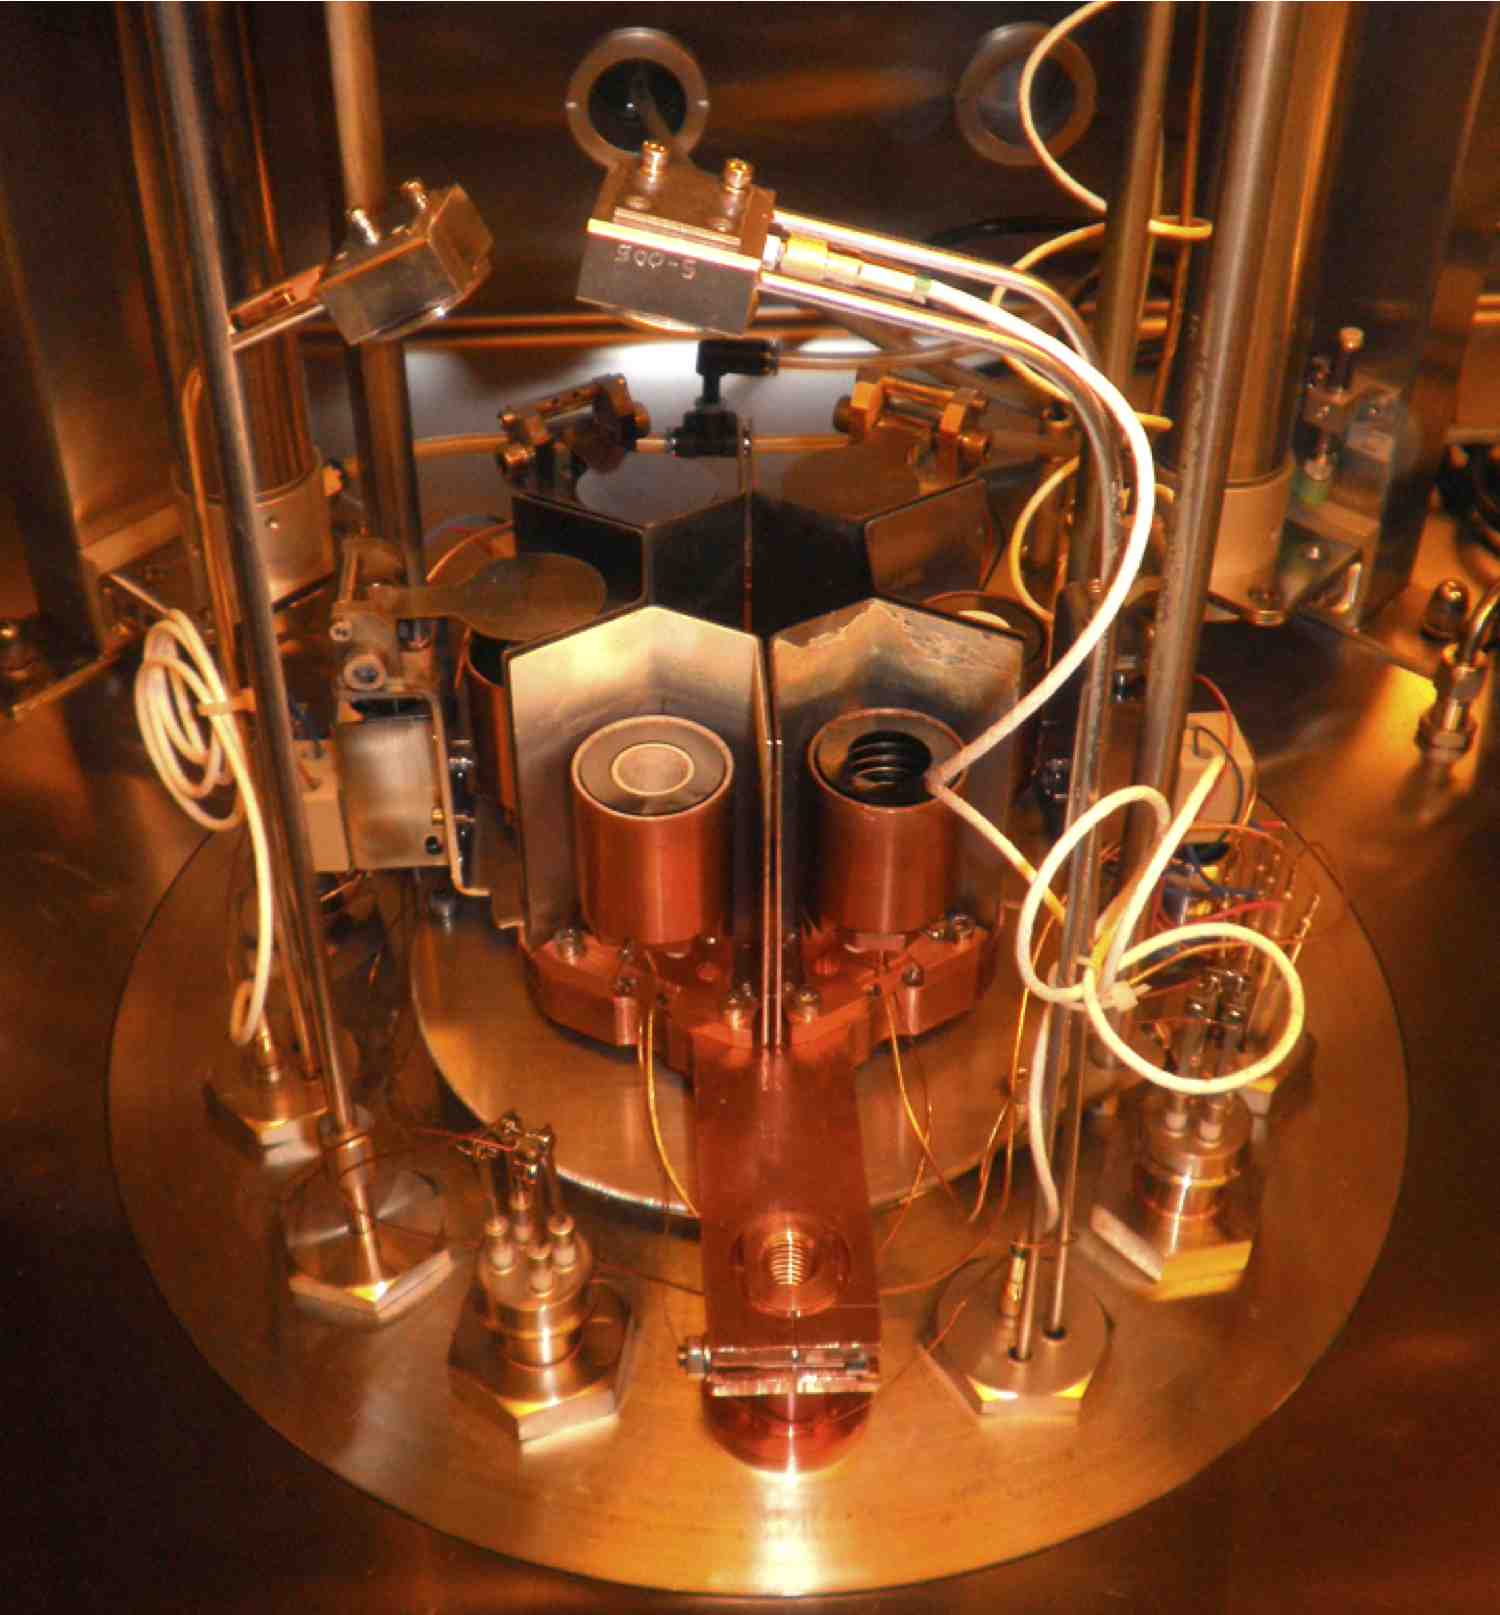

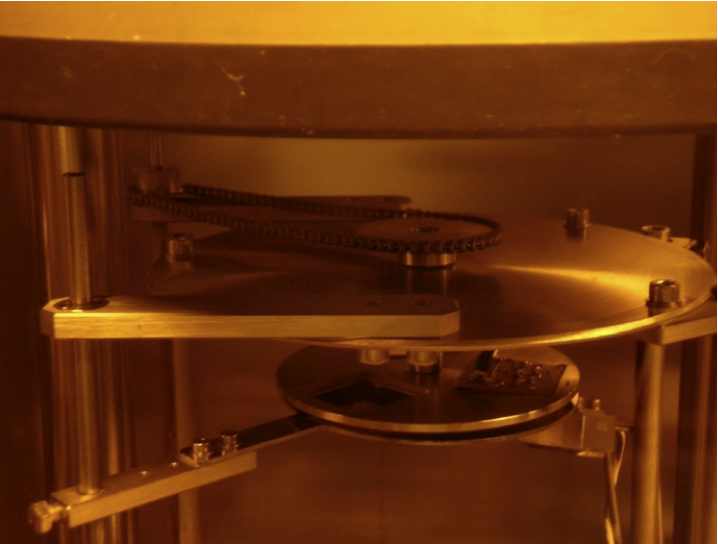
The surface to be coated is positioned on a sample-holder located 15 cm above the crucible. This holder is fixed on a spinning disk which allows the rotation, at a constant velocity, of the samples during evaporation. The spinning in the case of TPB has been proved to be essential to insure the uniformity of the deposition. Below the sample-holder a shutter allows to mask the exposed surfaces when stopping the TPB deposition is required. Another crucial element of the ICMOL coating system is the deposition-sensor (explain here the principle) to record the TPB deposition thickness in Åand the deposition rate in Å/s. This sensor is located half-way between the crucible and the surface to be coated as can be seen in Figure 8.24.
Prior to their introduction in the Evaporator, the samples to be coated are rigorously cleaned with alcohol at 150oC and dryed with pressurized N2. After positioning of the clean samples in the Evaporator, the vacuum-chamber is closed and evacuation is started using a diaphragm and a turbomolecular pumps. After the optimal vacuum-level is reached, typically mbar, heating of the crucible is started while the shutter is maintained closed. The relevant parameters as the vacuum level, the temperature in the crucible, the deposition rate and thickness are displayed in co-deposition control units, allowing a constant monitoring of the evaporation process. The TPB melting temperature is 203oC at atmospheric pressure. At the vacuum level reached, TPB starts evaporation at about 75oC. This is the temperature at which the deposition-sensor starts to record an increasing deposition thickness. The shutter is then opened when the deposition rate stabilizes around a constant value, typically between 1.8 and 2.4 Å/s. This is an indication that a steady evaporation process of the TPB is established. At the same time, the spinning of the sample-holder is initiated to insure a uniform deposition of the TPB on the exposed surface. When the desired thickness is reached the shutter is closed to avoid additional deposition on the coated surface.
The relationship between the recorded deposition thickness and the true thickness of the TPB coating on the substrate was determined using a profiler. The coated glass slice was scratched to produce a groove across the coating layer, using a sharp cutter. The thickness profile of the layer is recorded using the needle-sensor of the profiler, made to scan the TPB surface across the groove. A spectrogram of the thickness profile as shown in Figure 8.26 is produced and the thickness of the TPB layer is measured with a precision of Angstrˆm. The result from the profiler as compared to the value displayed by the deposition-sensor in the evaporator provides the calibration factor for the coating system. Several successive coating trials are produced on TiO2 glass-slices to adjust the coating parameters for the production of high quality coatings of a chosen thickness.


Several successive depositions of a chosen thickness have been successfully produced on TiO2 glass-slices and on several samples of 5-SiPM boards. The results have shown to be reproducible provided that the batch of TPB used has been properly conserved. In Figure 8.27 a glass-slice (left) and a 5-SiPM board (right) coated with TPB and illuminated with UV light at 240 nm, clearly appear re-emitting in the blue. The coated glass-slices and SiPM samples have been tested and characterized at IFIC and ICMOL with different UV light sources. Main results are described in the following subsections.
8.6.2 TPB fluorescence spectrum
A glass-slice coated with 0.1 mg/cm2 of TPB has been used to measure the fluorescence spectrum of the TPB, using a Xenon lamp coupled to a Monochromator for the selection of the input wavelength. A Spectrometer (Hamamatsu Photonic Multichannel Analyzer C10027) allowed to record the spectrogram of the output light from the TPB layer as shown in the diagram of Figure 8.28. The TPB re-emission spectra measured at nm and nm input wavelengths are shown in Figure 8.29. In these spectra one can see the light source peaks at nm and nm reflected by the glass-slice and the fluorescence peak which lies at nm. As one can see this fluorescence peak from the S1 Singlet States (see Figure 8.30) shows no dependance with the input wavelength in the UV range below 340 nm. The exposition time of the glass sample in the measurements at the two wavelengths were not the same, the statistics is though different. The phosphorescence peak which lies at 680 nm from T1 Triplet States has little contribution to the emission spectra. This however appears to be more significant at low input wavelength.


8.6.3 Deposition homogeneity
In the first trials the TPB evaporation process was performed without spinning the surface to be coated. The homogeneity of the deposit was poor in these conditions as one can see in Figure 8.31(left). The process was repeated with spinning at a constant velocity keeping other parameters as the deposition time and the vacuum level unchanged. The result can also be seen in Figure 8.31(right) where a nicely homogenous deposit was formed. This result depends however on the exposition time as the spinning velocity could not be changed and consequently on the deposition thickness. This effect was studied using ICMOL coated glass slices and a reference non-coated 5-SiPM Board. The Board was placed behind the coated glass slice with its TPB surface in close contact with the SiPMs.
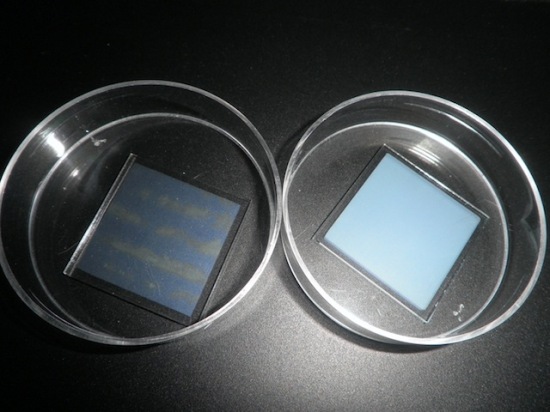

In Figure 8.32, this standard deviation is plotted as a function of the coating thickness. The coatings considered in the homogeneity measurement were produced on four identical glass-slices, with the same spinning velocity and at the same vacuum level in the evaporator. As one can see in Figure 8.32, the deviation from homogeneity is close to 10% in the worst case at the lowest coating thickness of 0.05 mg/cm2 and is slightly above 4% for the thickest coating of 0.6 mg/cm2.
8.6.4 Transmittance of the TPB at its emission wavelength
The transmittance of the TPB at its emission wavelength has been measured as a function of the coating thickness using an LED emitting at nm which illuminates successively four glass-slices of 3 cm 3 cm coated with 0.05 mg/cm2, 0.1 mg/cm2, 0.2 mg/cm2 and 0.6 mg/cm2 of TPB. The non-coated side of the glass-slices was coupled to the window of a 1 inch PMT Hamamatsu R8520. The anode current of the PMT was measured for each TPB thickness and compared to the current measured with a non-coated glass-slice of the same size and thickness as the coated ones. The illumination conditions were kept unchanged for all the samples measured. The transmittance of the TPB coating shown in Figure 8.33 as a function of the thickness indicates an increase of the absorption with the thickness as expected. However the amount of absorption keeps below 4% which is comparable to the uncertainties due the deposition inhomogeneity.

Several 5-SiPM boards coated with different TPB thickness have been tested with collimated light from LEDs emitting at different wavelengths. The response of the coated SiPMs to UV light as a function of the coating thickness has been measured and compared to their response to the same illumination prior to coating. The increase in the SiPMs photo-detection efficiency produced by the TPB layer is plotted in Figure 8.34 as a function of the TPB thickness. It is clearly seen that the response of the coated SiPMs increases with decreasing coating thickness and is maximum at 0.05 mg/cm2. This result confirms previous published studies on TPB depositions [69, 59].
8.6.5 Response of coated SiPMs as a function of TPB thickness
An important issue addressed for coating the SiPMs in NEXT is the search of the coating thickness which allows the optimal conversion efficiency of the TPB. For this purpose, depositions of various thickness of TPB were performed on 5-SiPM Boards which were characterized using a collimated LED emitting at 260 nm. The current output from the coated SiPMs was measured and compared to the current measured prior to coating with the same illumination and temperature conditions. In Figure 8.34 the increase of current of the SiPMs after coating when illuminated at 260 nm is shown as a function of the TPB thickness. This current increase similar to an increase of the photo-detection efficiency of the SiPMs depends on the coating thickness and is shown to have maximum value at 0.05 mg/cm2. This result confirms reported studies on TPB depositions performed on Photomultipliers [59]. However for the coating of the SiPMs of NEXT1-EL DBs and due to the small size of the active area of the SiPMs (11 mm2), a compromise between the deposition homogeneity and the fluorescence efficiency of the TPB was considered. Thus a thickness of 0.1 mg/cm2 was chosen as it fulfills both conditions of good homogeneity and high enough fluorescence efficiency.

8.6.6 Coating and testing of NEXT1-EL SiPM Daughter-Boards
Prior to coating the SiPM-DBs were tested with an LED and then cleaned using isopropanol in an ultrasonic bath. They were after dried in an oven at 70oC during 2 hours, then stored in the N2 atmosphere of the ICMOL coating facility until their introduction in the coating chamber. The cleaning protocol was previously agreed with Hamamatsu to be safe for the SiPMs which were tested before and after this process. The 18 SiPM-DBs of NEXT1-EL tracking plane were coated with 0.1 mg/cm2 of TPB and then stored in a vacuum chamber until their mounting on the readout Mother-Board. A couple of SiPM-DB samples have been dedicated to testing with an LED emitting at 240 nm immediately after coating. The currents produced in the SiPMs measured before and after coating in the same illumination and temperature conditions are compared. In Figure 8.36 the dispersion in the current increase measured in the 16 SiPMs of one coated DB is shown. More than 45% of current increase is measured at 240 nm which is more than what has been measured with previous samples at 260 nm. The dispersion of this measurement is within the current dispersion obtained in the SiPMs of one DB operated at the same voltage (71.15 V) and below the current dispersion due to the TPB inhomogeneity at 0.1mg/cm2 thickness, which is an indication of an excellent coating quality.
The response of the SiPMs of the DB sample as a function of the wavelength was measured using a Xenon lamp coupled to a Monochromator which allowed to select the input wavelength from the Xenon emission spectrum down to 240 nm, with a spread of nm. The DB was plugged into a readout PCB placed inside a testing black-box as shown in Figure 8.35. An SMA feedthrough on the top cover of the black-box allowed to plug the optical fiber from the Monochromator to illuminate a chosen SiPM of the DB.
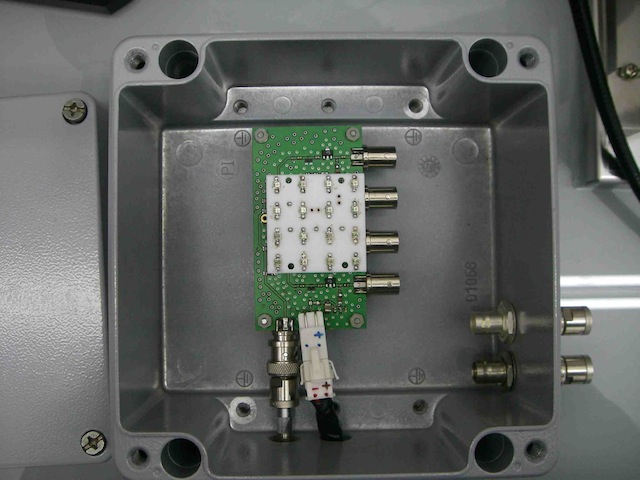
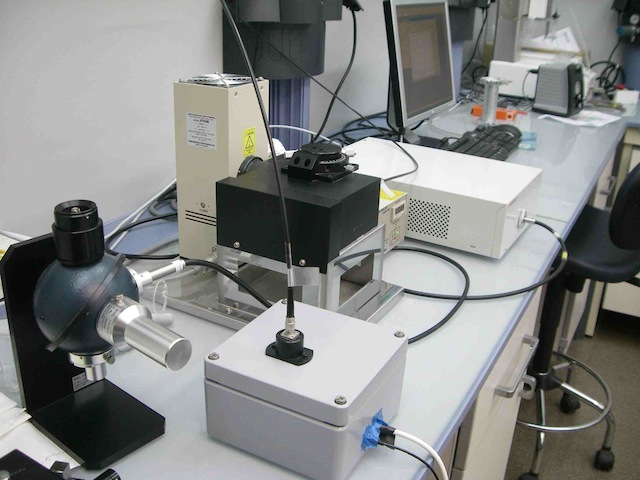
A spectrometer was also used to analyze the spectra from the Monochromator output in order to determine the input spectrum used to illuminate the coated SiPM-DBs. An example of such spectrum is shown in Figure 8.37 from the Monochromator set at 247 nm. The average current from the SiPMs of the DB is recorded at each input wavelength using an Electrometer and compared to the typical average current of the non-coated SiPMs of the DBs obtained in the same illumination conditions. In Figure 8.38 a significant increase of the current in the coated SiPMs is observed at input wavelengths below 340 nm.


8.7 NEXT Project
The NEXT project (NP) refers to the sharing, organization, coordination, tracking and resource management of the different tasks related with the construction, commissioning and operation of the NEXT-100 detector.
The NP defines the following projects.
-
1.
PV: Design and construction of the NEXT-100 pressure Vessel.
-
2.
EL: Design and construction of the field cage, EL grids and High Voltage feedthroughs.
-
3.
LT: Design and construction of the light tube.
-
4.
EP: Energy plane sensors (PMTs) and front end electronics.
-
5.
SiPM: Construction and testing of SiPMs daughter boards (DB).
-
6.
DB-TPB: Coating of the DB with TPB prior to mounting in Mother Board (MB).
-
7.
MB: Mother board design and construction.
-
8.
DB-FE: FE electronics for the DB (discreet version).
-
9.
DB-CHIP: FE electronics for the DB (ASICs version).
-
10.
DB-OPT: Optical links for SiPMs.
-
11.
DAQ: Data acquisition and online monitoring.
-
12.
SLOW: Slow controls.
-
13.
SHL: Shielding design and construction.
-
14.
Gas: Gas system.
-
15.
RAD: Radon depuration and monitoring.
-
16.
INT: Integration (includes interface between the shielding and the pressure vessel, electrical services and gas services).
-
17.
SFT: Safety and risk analysis.
-
18.
OFS: Offline software (reconstruction, data processing).
-
19.
ONS: Online software (DAQ, monitoring).
-
20.
QLTY: Quality control.
-
21.
MC: Monte Carlo simulation.
-
22.
Calib: Calibration.
-
23.
RPY: Screening of components, radiopurity measurements.
-
24.
GM: Study of gas mixtures to improve the response of pure Xenon.
In the following we briefly describe each project.
8.7.1 The Pressure vessel project
The PV project includes the design and construction of the vessel for NEXT-100. The project will be coordinated by LBNL (design) and IFIC (construction). Other institutions that have confirmed their participation are UPV, UdG (finite element simulations) and UniZar (overall design, together with IFIC).
The design using the ASME norm has been completed at the time of writing this CDR (LBNL, IFIC) and will be extended and further refined using finite elements analysis (UPV, UdG). The construction of the pressure vessel will be carried out by the company TRINOS vacuum system, which has obtained a special grant of the ministry of industry for this purpose.
8.7.2 The EL project
The EL project refers to the design and construction of the field cage, EL grids and High Voltage feedthroughs. The project will be coordinated by Texas A&M (TAMU), which has built the same systems for NEXT-1-IFIC. The participants institutions will be TAMU, and LBNL, as well as UniZar/Saclay (radiopure feedthroughs).
8.7.3 The light tube project
The light tube will be constructed along the lines developed by the ArDM collaboration, maximizing the synergy with this experiment.
A coating machine suitable for coating large TTX+3M foils has been made available to NEXT by Z. University. The machine will be assembled and tested at IFIC in the next few months.
The project will be coordinated by IFIC, with the participation of JINR.
8.7.4 Energy plane sensors
The procuration and testing of PMTs will be carried out at IFIC. The front-end electronics of the PMTs will be jointly developed by IFIC and UPV.
8.7.5 Construction and testing of SiPMs daughter boards
About 160 SiPM daughter boards, each with 64 SiPMs must be mounted and fully tested. The project will be coordinated by U. of Aveiro, with the participation of Coimbra, Aveiro, U. Santiago and UAN.
8.7.6 Coating of DB with TPB
The coating of NEXT1 DB with TPB will be done at IFIC, using a machine available from ICMOL.
8.7.7 Testing of functionality of DB
An acrylic chamber with gloves for external manipulation has been prepared at IFIC for NEXT-1. The chamber is being used to test the SiPM MB of NEXT-1. For NEXT-100 we plan to build a mother board ”mockup” (MBM) that will have the same functionality than the MB but smaller size. The MBM will be used to test all DB prior to installation in the final MB.
8.7.8 Mother board design and construction
The MB design and construction will be developed by UPV.
8.7.9 SiPM FE electronics
Three projects will run in parallel. The development of small-scale integrated electronics (LBNL), the development of a custom-chip (UPV) and the development of the Optical links for SiPMs (UPV, LBNL).
8.7.10 Data acquisition and online monitoring
The UPV will continue coordinating the DAQ, developed in the RD51 framework. IFIC will contribute with the development of the online software.
8.7.11 Slow Controls
Slow Controls refers to the system that follow operative parameters such as high voltages for the field cage, PMTs and SiPMTs, gas system, temperature and others. The project will be coordinated by U. Coimbra, with the participation of JINR.
8.7.12 Shielding
The shielding project has been coordinated by U. Zaragoza and UPV (mechanics group), and they will continue working in the project to choose a final scheme and proceed to the construction of the system.
8.7.13 The Gas system
The construction of the gas system will be a collaboration between IFIC and U. Zaragoza. The system for radon monitoring (including radon cold traps) can be developed by U. Zaragoza and the group of JINR.
8.7.14 Integration
The integration of the various subsystems will be coordinated by LSC, IFIC and U. de Zaragoza.
8.7.15 Safety
Safety will be primarily coordinated by LCS, in close collaboration with the technical coordination of NEXT (IFIC and U. Zaragoza).
8.7.16 Offline software and quality control
IFIC will coordinate the software offline and Monte Carlo development. Data Quality control will be developed by U. Nariño and U. Santiago.
8.7.17 Monte Carlo simulation
The Monte Carlo simulation of NEXT has been developed at IFIC, with substantial cooperation of U. Aveiro and UAN, who will continue contributing to the project.
8.7.18 Calibration
The development of calibration strategies (and equipment where needed) for NEXT will be coordinated by U. Santiago.
8.7.19 Radiopurity
The screening of components and radiopurity measurements will be jointly coordinated by LSC and U. Zaragoza.
8.7.20 Gas Mixtures
The study of gases that could improve the response of pure Xenon will be coordinated by Saclay and U. Zaragoza.
8.7.21 NEXT Project Management Plan
The NEXT Project Management Plan (NPMP) coordinates the construction of the NEXT-100 detector. It is under the direct supervision of the Spokesperson (SP) and the Project Manager (PM).
The PMP follows the progress of each NEXT project, monitors deliverables and dead lines and keeps track of invested resources including personnel. It also identifies potential show-stoppers and synergies (as well as possible conflicts) between the different projects and optimizes the sharing of resources.
A draft of the PMP is currently under preparation.
8.7.22 Further Developments
The Next Project and the Next Project Management Plan will be fully developed by the collaboration in the next few months, and will be the focus of our next report to the LSC. In addition we will submit a full costing of the detector.
Acknowledgements
This work received support by the Spanish Ministry of Science and Innovation (MICINN) under grants CONSOLIDER-INGENIO 2010 CSD2008-0037 (CUP), FPA2009-13697-C04-04 and RYC-2008-03169. J. Renner acknowledges the support of a US DOE NNSA Stewardship Science Graduate Fellowship, under contract number DE-FC52-08NA28752.
Bibliography
- [1] E. Majorana, Theory of the Symmetry of Electrons and Positrons, Nuovo Cim. 14 (1937) 171–184.
- [2] F. T. Avignone III, S. R. Elliott, and J. Engel, Double Beta Decay, Majorana Neutrinos, and Neutrino Mass, Rev. Mod. Phys. 80 (2008) 481–516, [arXiv:0708.1033].
- [3] A. Giuliani, Searches for neutrinoless double beta decay, Acta Phys. Polon. B41 (2010) 1447–1468.
- [4] J. Schechter and J. W. F. Valle, Neutrinoless double-beta decay in SU(2)U(1) theories, Phys. Rev. D25 (1982) 2951.
- [5] M. Hirsch, S. Kovalenko, and I. Schmidt, Extended Black Box Theorem for Lepton Number and Flavor Violating processes, Phys. Lett. B642 (2006) 106–110, [hep-ph/0608207].
- [6] M. C. Gonzalez-Garcia, M. Maltoni, and J. Salvado, Robust Cosmological Bounds on Neutrinos and their Combination with Oscillation Results, JHEP 08 (2010) 117, [arXiv:1006.3795].
- [7] E. Caurier, J. Menéndez, F. Nowacki, and A. Poves, The Influence of pairing on the nuclear matrix elements of the neutrinoless beta beta decays, Phys. Rev. Lett. 100 (2008) 052503, [arXiv:0709.2137].
- [8] J. Menendez, A. Poves, E. Caurier, and F. Nowacki, Disassembling the Nuclear Matrix Elements of the Neutrinoless beta beta Decay, Nucl.Phys. A818 (2009) 139–151, [arXiv:0801.3760].
- [9] J. Menéndez, A. Poves, E. Caurier, and F. Nowacki, The Occupancies of individual orbits and the nuclear matrix element of the Ge-76 neutrinoless beta beta decay, Phys.Rev. C80 (2009) 048501, [arXiv:0906.0179].
- [10] J. Suhonen and O. Civitarese, Effects of orbital occupancies and spin-orbit partners on 0 nu beta beta-decay rates, Nucl.Phys. A847 (2010) 207–232.
- [11] F. Simkovic, A. Faessler, V. Rodin, P. Vogel, and J. Engel, Anatomy of nuclear matrix elements for neutrinoless double-beta decay, Phys.Rev. C77 (2008) 045503, [arXiv:0710.2055].
- [12] F. Simkovic, A. Faessler, H. Muther, V. Rodin, and M. Stauf, The 0nbb-decay nuclear matrix elements with self- consistent short-range correlations, Phys. Rev. C79 (2009) 055501, [arXiv:0902.0331].
- [13] J. Barea and F. Iachello, Neutrinoless double-beta decay in the microscopic interacting boson model, Phys. Rev. C79 (2009) 044301.
- [14] T. R. Rodríguez and G. Martínez-Pinedo, Energy density functional study of nuclear matrix elements for neutrinoless decay, arXiv:1008.5260.
- [15] F. Simkovic, A. Faessler, and P. Vogel, 0 nu beta beta nuclear matrix elements and the occupancy of individual orbits, Phys.Rev. C79 (2009) 015502, [arXiv:0812.0348].
- [16] D.-L. Fang, A. Faessler, V. Rodin, and F. Simkovic, Neutrinoless double-beta decay of 150Nd accounting for deformation, Phys.Rev. C82 (2010) 051301, [arXiv:1009.5579].
- [17] H. Klapdor-Kleingrothaus et. al., Latest results from the Heidelberg-Moscow double beta decay experiment, Eur. Phys. J. A12 (2001) 147–154, [hep-ph/0103062].
- [18] H. V. Klapdor-Kleingrothaus, A. Dietz, H. L. Harney, and I. V. Krivosheina, Evidence for Neutrinoless Double Beta Decay, Mod. Phys. Lett. A16 (2001) 2409–2420, [hep-ph/0201231].
- [19] C. E. Aalseth et. al., Comment on ’Evidence for Neutrinoless Double Beta Decay’, Mod. Phys. Lett. A17 (2002) 1475–1478, [hep-ex/0202018].
- [20] J. J. Gomez-Cadenas et. al., Sense and sensitivity of double beta decay experiments, arXiv:1010.5112.
- [21] CUORE Collaboration, C. Arnaboldi et. al., Physics potential and prospects for the CUORICINO and CUORE experiments, Astropart. Phys. 20 (2003) 91–110, [hep-ex/0302021].
- [22] R. Ardito et. al., CUORE: A cryogenic underground observatory for rare events, hep-ex/0501010.
- [23] CUORE Collaboration, I. C. Bandac, Search for neutrinoless double beta decay with the CUORE detector, J. Phys. Conf. Ser. 110 (2008) 082001.
- [24] CUORE Collaboration, G. Gervasio, CUORICINO - Large cryogenic detector for double beta decay, WIMPS and solar axions, Nucl. Phys. A663 (2000) 873–876.
- [25] CUORE Collaboration, M. Sisti, From Cuoricino to CUORE: Investigating neutrino properties with double beta decay, J. Phys. Conf. Ser. 203 (2010) 012069.
- [26] CUORICINO Collaboration, C. Arnaboldi et. al., Results from a search for the decay of 130Te, Phys. Rev. C78 (2008) 035502, [arXiv:0802.3439].
- [27] GERDA Collaboration, I. Abt et. al., A new Ge-76 double beta decay experiment at LNGS, hep-ex/0404039.
- [28] M. Barnabé Heider et. al., Operation of a GERDA Phase I prototype detector in liquid argon and nitrogen, arXiv:0812.3976.
- [29] I. Barabanov et. al., Shielding of the GERDA experiment against external gamma background, Nucl. Instrum. Meth. A606 (2009) 790–794.
- [30] GERDA Collaboration, G. Zuzel, The GERDA experiment at Gran Sasso, Acta Phys. Polon. B41 (2010) 1469.
- [31] M. Danilov et. al., Detection of very small neutrino masses in double-beta decay using laser tagging, Phys. Lett. B480 (2000) 12–18, [hep-ex/0002003].
- [32] EXO Collaboration, E. Conti et. al., Correlated fluctuations between luminescence and ionization in liquid xenon, Phys. Rev. B68 (2003) 054201, [hep-ex/0303008].
- [33] M. Redshaw, E. Wingfield, J. McDaniel, and E. G. Myers, Mass and double-beta-decay value of , Phys. Rev. Lett. 98 (Feb, 2007) 053003.
- [34] KamLAND Collaboration, A. Terashima et. al., R&D for possible future improvements of KamLAND, J. Phys. Conf. Ser. 120 (2008) 052029.
- [35] M. Koga, KamLAND double beta decay experiment using 136Xe, in International Conference on High Energy Physics (ICHEP), 2010.
- [36] NEXT Collaboration, F. Grañena et. al., NEXT, a HPGXe TPC for neutrinoless double beta decay searches, arXiv:0907.4054.
- [37] A. Bolotnikov and B. Ramsey, The spectroscopic properties of high-pressure xenon, Nucl. Inst. Meth. A396 (1997) 360–370.
- [38] D. Nygren, High-pressure xenon gas electroluminescent TPC for 0nu beta beta-decay search, Nucl. Instrum. Meth. A603 (2009) 337–348.
- [39] A. Bolozdynya et. al., A high pressure xenon self-triggered scintillation drift chamber with 3D sensitivity in the range of 20-140 keV deposited energy, Nuc. Inst. Meth. A385 (1997) 225.
- [40] J. White, A high pressure xenon chamber read with 7 PMTs, xxx. xxx (xxx) xxx.
- [41] L. M. P. Fernandes et. al., Primary and secondary scintillation measurements in a xenon Gas Proportional Scintillation Counter, JINST 5 (2010) P09006, [arXiv:1009.2719].
- [42] C. Balan et. al., Micromegas operation in high pressure xenon: charge and scintillation readout, arXiv:1009.2960.
- [43] D. Nygren, Optimal detectors for WIMP and searches: Identical high-pressure xenon gas TPCs?, Nucl. Instrum. Meth. A581 (2007) 632–642.
- [44] U. Fano, Ionization Yield of Radiations. 2. The Fluctuations of the Number of Ions, Phys. Rev. 72 (1947) 26–29.
- [45] L. Távora, C. Conde, F. Santos, T. Dias, and P. Rachinhas, Intrinsic limitations in the energy resolution of drift-field based radiation detectors: a Monte Carlo simulation study of Xe-filled counters, Rad. Phys. Chem. 71 (2004) 723–725.
- [46] C. A. N. Conde, Gas Proportional Scintillation Counters for x-ray spectrometry. John Wiley & sons, 2004. Chapter 4.2 in X-ray Spectrometry: Recent Technical Advances, K. Tsuji, J. Injuk and R. van Greiken, eds.
- [47] C. A. N. Conde and A. J. P. L. Policarpo Nucl. Instr. Meth. 53 (1967) 7–12.
- [48] G. Charpak, S. Majewski, and F. Sauli, The scintillating drift chamber: A new tool for high accuracy, very high rate particle localization, Nucl. Instr. Meth. 126 (1975) 381.
- [49] E. Aprile, A. I. Bolotnikov, A. I. Bolozdynya, and T. Doke, Noble gas detectors. Wiley-VCN, 2006.
- [50] A. S. Tanaka, Y. Jursa and F. J. LeBlanc, Continuous Emission Spectra of Rare Gases in the Vacuum Ultraviolet Region II: Neon and Helium, Journal of the Optical Society of America 48 (1958) 304–308.
- [51] C. A. B. Oliveira et. al., A simulation toolkit for electroluminescence assessment in rare event experiments, arXiv:1103.6237.
- [52] R. S. Mulliken, Potential Curves of Diatomic Rare-Gas Molecules and Their Ions with Particular Reference to , JThe Journal of Chemical Physics 52 (1970) 5170–5180.
- [53] H. A. Koehler et. al., Vacuum-ultraviolet emission from high-pressure xenon and argon excited by high-current relativistic electron beams, Phys. Rev. A 9 (1974) 768–780.
- [54] http://garfield.web.cern.ch/garfield/.
- [55] S. F. Biagi, Monte Carlo simulation of electron drift and diffusion in counting gases under the influence of electric and magnetic fields, Nucl. Inst. Meth. A 421 (1999) 234–240.
- [56] http://consult.cern.ch/writeup/magboltz/.
- [57] T. H. V. T. Dias and others., Three-dimensional Monte Carlo calculation of the VUV electroluminescence and other electron transport parameters in xenon, Journal of Physics D 27 (1994) 42–48.
- [58] C. M. B. Monteiro and others., Secondary scintillation yield in pure xenon, Journal of Instrumentation 2 (2007) P05001.
- [59] The ArDM Collaboration, V. Boccone et. al., Development of wavelength shifter coated reflectors for the ArDM argon dark matter detector, JINST 4 (2009) P06001, [arXiv:0904.0246].
- [60] T. Dafni and I. Liubarsky, The Gas System for NEXT-10 and NEXT-100 (Conceptual Design Report), tech. rep., NEXT Collaboration, 2010.
- [61] “Unpublished Report.”.
- [62] E. O’Dwyer, Radon Background Reduction in DEAP-1 and DEAP-3600. PhD thesis, Queens University-Kingston, Ontario, Canada, 2011.
- [63] R. Walker for the ZEPLIN III Collaboration, “Electron Lifetime Monitor for ZEPLIN III.”.
- [64] RD51 Collaboration Collaboration, “Development of micro-pattern gas detectors technologies.” http://rd51-public.web.cern.ch/rd51-public/.
- [65] H. Mueller, What is SRS?, August 11th, 2010.
- [66] K. Gnanvo et al. (including J. Toledo as co author), Detection and Imaging of High-Z Materials with a Muon Tomography Station Using GEM Detectors, IEEE Nucl. Sci. Symp. Conference Records (2010) [arXiv:1011.3231].
- [67] V. Herrero et. al., “AMIC: An Expandable Front-End for Gamma-ray Detectors with Light Distribution Analysis Capabilities.” Presented at the IEEE Real Time Conference 2010.
- [68] V. Herrero et. al., Position sensitive scintillator based detector improvements by means o an integrated front-end, NIM A604 (2009) 77–81.
- [69] C. H. Lally, G. J. Davies, W. G. Jones, and N. J. T. Smith, UV quantum efficiencies of organic fluors, Nuclear Instruments and Methods in Physics Research B 117 (1996) 421–427.