FUSE observations of possible infalling planetesimals in the 51 Ophiuchi circumstellar disk
Abstract
We present the first observations of the circumstellar (CS) disk system 51 Ophiuchi with the Far Ultraviolet Spectroscopic Explorer. We detect several absorption lines arising from the unusual metastable atomic species N I (), N I (), and S II (). These levels lie 1.8 – 3.6 eV above the ground level and have radiative decay lifetimes of 2 days or less, indicating that the lines arise from warm CS gas. The high S/N FUSE spectra, obtained six days apart, also show time-variable absorption features arising from N I, N II, O I (), and Fe III, which are redshifted with respect to the stellar velocity. The resolved redshifted absorption extends over many tens of km s-1 (40 for N I, 100 for N II, 65 for O I (), and 84 for Fe III). We calculate column densities for all the variable infalling CS gasses, using the apparent optical depth method. The Fe III and N II infalling gasses must be produced through collisional ionization, and the ionization fraction of nitrogen suggests a gas temperature between 20000 and 34000 K. The infalling gas shows a peculiar, non-solar composition, with nitrogen and iron more abundant than carbon. We also set upper limits on the line-of-sight column densities of H2 and CO. These observations strengthen the connection between 51 Oph and the older debris-disk system Pictoris, and indicate that there may be infalling planetesimals in the 51 Oph system.
1 Introduction
51 Ophiuchi (catalog HD 158643) (HD 158643) is a young B9.5 Ve star ( yrs old; van den Ancker, de Winter, & Tjin A Djie (1998)), showing a large infrared emission excess arising from circumstellar (CS) dust. This dust is presumed to be located in a disk similar to that observed around Pictoris (Waters et al., 1988). However, although 51 Oph lies only pc away from the Sun (van den Ancker, de Winter, & Tjin A Djie, 1998), its CS dust disk has not yet been imaged. ISO spectroscopy of the 51 Oph CS dust shows the presence of crystalline silicates, which are seen in the spectra of Pic and Solar System meteorites and comets, but not in spectra of interstellar (IS) dust (Waelkens et al., 1996). The disk of 51 Oph is probably close to edge-on, because the very large projected rotational velocity of the star ( km s-1; Dunkin, Barlow, & Ryan (1997)) suggests that our line-of-sight is parallel to the equatorial plane of the system.
51 Oph also has a CS gas disk, as evidenced by double-peaked hydrogen emission (Slettebak, 1982) and narrow, non-IS absorption features in the ultra-high-resolution spectrum of the star (Crawford, Craig, & Welsh, 1997). Cold CS C I gas ( K) has also been observed toward 51 Oph; this species has a very short photoionization lifetime and must be continuously replenished (Lecavelier des Etangs et al., 1997a). Most interestingly, IUE spectra of 51 Oph show variable infalling gas absorption features arising from species with a wide range of ionization states, including C IV and Si IV, which must be produced by collisional ionization (Grady & Silvis, 1993). Such variable features are an indication of the presence of infalling planetesimals in the 51 Oph system (for a review of this phenomenon in the well-studied Pictoris system, see Vidal-Madjar et al. (1998)). All this evidence together strongly suggests that 51 Oph is similar to Pictoris, and represents a young planetary system with a debris disk of gas and dust.
In this paper, we present the first Far Ultraviolet Spectroscopic Explorer (FUSE) spectra of 51 Oph. We observe several narrow CS absorption lines arising from the unusual metastable species N I (), N I (), and S II (), and calculate the redshifts and equivalent widths of these lines. We also set low upper limits on the column densities of H2 and CO toward the star, which has interesting consequences in light of the recent detection of large quantities of warm molecular gasses in ISO spectra of 51 Oph (van den Ancker et al., 2001). The high S/N FUSE spectra were taken 6 days apart, permitting us to detect time-variable redshifted absorption from four species, Fe III, N II, N I, and metastable O I (). We examine the velocity structure of the resolved variable features, and carefully determine column densities of the infalling gasses. In §7, we investigate the unusual composition of the infalling gas, and demonstrate that it is most likely produced from infalling planetesimals, as in the case of Pictoris.
2 Observations and Data Reduction
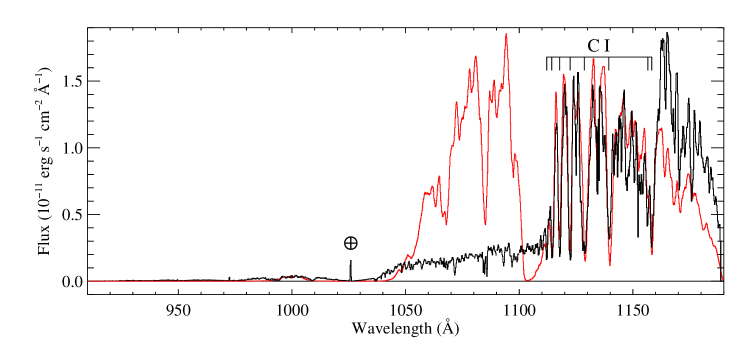
51 Oph was observed with FUSE on 2000 August 29 and 2000 September 4. The complete spectrum appears in Figure 1. The data were obtained using the low-resolution aperture, covering the wavelength range 905 – 1187 Å. The FUSE satellite has four coaligned optical channels (LiF 1, SiC 1, LiF 2, SiC 2), forming two nearly identical “sides”, each consisting of a LiF grating, a SiC grating, and a detector. Each detector is divided into two independent segments (a and b), separated by a small gap. The entire wavelength range is therefore covered with eight partially overlapping spectra that fall on different portions of the two detectors (LiF 1a, LiF 1b, etc.). A discussion of the on-orbit performance of FUSE may be found in Sahnow et al. (2000). The data were calibrated with the CALFUSE 1.8.7 pipeline processing software. Detailed information on this software is available at http://fuse.pha.jhu.edu/analysis/pipeline_reference.html. Since none of the observed lines were intrinsically narrow enough to use them to determine the true spectral resolution of our data, we conservatively assume 20 km s-1 spectral resolution ().
The total exposure time of the first observation was 9974 s, divided into 23 exposures, and the total exposure time of the second 9523 s, divided into 20 exposures. Since the target was not exactly centered within the aperture in every exposure, the resulting wavelength shifts were corrected by aligning the individual exposures before co-addition, using a linear cross-correlation procedure. Therefore, the image of the star usually fell on a slightly different portion of the detector in each exposure, greatly reducing the fixed pattern noise in the final co-added spectra. In each observation, we obtained the following signal-to-noise ratios per resolution element: 69 in LiF 1b near 1130 Å, 20 in SiC 2b near 1080 Å, and 36 in LiF 1a near 1050 Å.
The wavelength scales were corrected for the sign error in the CALFUSE 1.8.7 heliocentric velocity calculation. The uncertainty in the relative wavelength calibration of the data is about 5 pixels ( km s-1). In order to determine the absolute wavelength calibration of the data, we used a rotationally broadened synthetic stellar spectrum, overplotted in Figure 1, which included the photospheric C I lines seen in the data (Chayer, 2001). This synthetic spectrum was calculated at the FUSE spectral resolution, assuming solar metallicity and the following stellar parameters: km s-1. The synthetic spectrum does not fit the data well between about 1110 Å and 1040 Å; this may be due to non-LTE effects. A paper on improved modeling of the FUV spectra of A and late B stars is in preparation.
In the region of the C I lines, however, the synthetic spectrum does fit the data well. The synthetic spectrum was shifted to the km s-1 heliocentric velocity of the star, then aligned with the co-added LiF 1b spectra in the region where the photospheric C I lines appear, using the cross-correlation procedure mentioned above. This process allowed us to establish the small zero-point offsets of the absolute wavelength calibration for the LiF 1 spectra with an uncertainty of no more than 14 km s-1. Since the 51 Oph spectrum has few photospheric absorption lines shortward of 1100 Å, the offsets of the absolute wavelength calibration for the SiC 2b spectra were determined using the narrow IS/CS absorption lines of Ar I. Thus, the uncertainty in the absolute calibration for SiC 2b is larger, about 27 km s-1, due to the spread in velocity between the unresolved IS and CS components.
Data taken with FUSE between about 2000 August and 31 July 2001, when the detector high voltage was raised for the second time, may suffer from an effect called detector x-walk. This effect causes the position of a low pulse height photon event to be misplaced in the dispersion direction, and was caused by excess gain sag in localized places on the detectors where the brightest airglow lines fall. The x-walk causes a distortion in the shape of an absorption line that conserves photons but not equivalent width, and varies with time. No good post-aquisition remedies for this effect exist at this time. Thus, one must be very careful when quantitatively analyzing any absorption lines in FUSE spectra taken before the detector high voltage was increased, particularly when looking for time-variability. To deal with this problem, we carefully examined the shape of each line of interest in the spectra from two different detector channels, and determined which portions of the data suffered from the x-walk effect. We excluded the few portions of the data that showed significant x-walk from our analysis.
3 Overview of FUV Spectrum
The stellar flux from 51 Oph in the FUSE wavelength range drops off sharply below 1110 Å, as can be seen in Figure 1. The most prominent features are the broad C I photospheric absorption lines between 1110 Å and 1160 Å. No emission lines, or any other indications of stellar activity, are observed in the data. The non-photospheric absorption features in the 51 Oph FUSE spectrum are listed in Table 1. Since the absorption features from the local interstellar medium (ISM) are only separated from the stellar heliocentric velocity by about 6 km s-1 (Crawford, Craig, & Welsh, 1997), we are unable to resolve them in our spectrum. However, many lines in the spectrum arise from excited energy levels, and therefore are not usually seen in spectra of the ISM. These excited species indicate that there is warm CS gas present near 51 Oph.
4 Metastable species
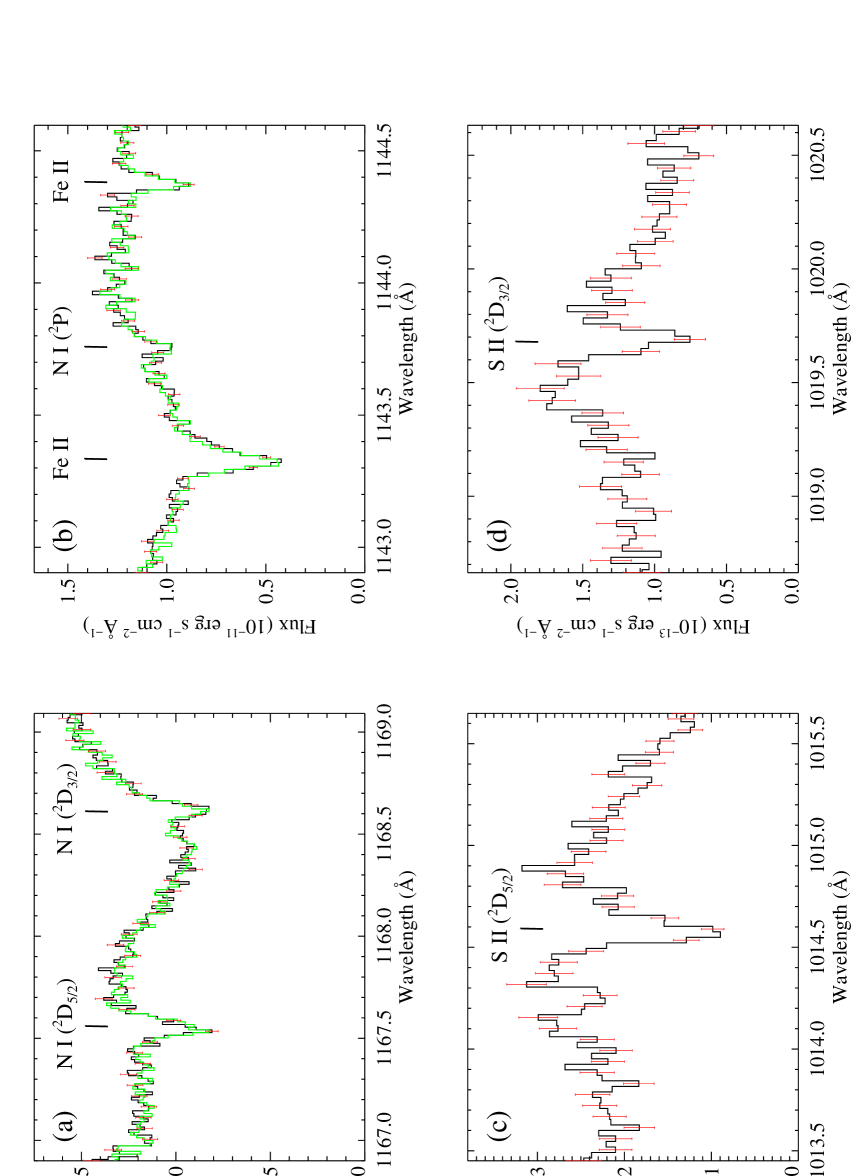
Several of the absorption lines arising from metastable states are shown in Figure 2. Only the strongest metastable line, arising from O I (), appeared to vary significantly between the two days of observation (shown in Figure 3c). For the other lines, we averaged the two days of data to improve the S/N ratio, and fit Gaussians to the lines to determine their redshifts. The strong S II () lines were slightly redshifted by km s-1with respect to the stellar velocity; the weaker N I () and N I () lines appeared to be unshifted. We calculated the equivalent widths of the lines from the data and converted them to column densities, assuming the lines were unsaturated; these values appear in Table 2. For the N I () lines, we had enough lines with different oscillator strengths available to determine that the two weakest lines were unsaturated, so the column density for this species should be accurate. For the N I (), N I (), and S II () lines, this was not the case, so our column densities for these species should be regarded as lower limits to the true values. In particular, the S II () lines are probably considerably saturated.
The energies of the metastable states above the ground state are 2.38 eV for N I (), 3.58 eV for N I (), and 1.84 eV for S II (). These energies roughly correspond to temperatures of 28000 K, 41000 K, and 21000 K, respectively. Therefore, these lines must arise solely from CS gas; additionally, this gas is quite warm. We calculated the radiative decay lifetimes of the metastable states by summing the probabilities of the spin-forbidden transitions to lower energy levels. These lifetimes appear in Table 2. All the lifetimes are quite a bit shorter than the six day interval between the two observations; therefore, the metastable levels must be continuously repopulated by collisional excitation, UV pumping, and/or molecular dissociation. Lines arising from the metastable level of C I are seen in spectra of Pictoris (Roberge et al., 2000) and solar system comets (Tozzi, Feldman, & Festou, 1998). We intend to more fully investigate the significance of metastable species in young CS disks in a future paper.
5 Molecular gasses
No molecular hydrogen or carbon monoxide is observed toward the star. The upper limits on the H2 line-of-sight column densities in the and rotational levels are cm-2 and cm-2. The non-detection of absorption in the C–X (0,0) band at 1088 Å allows us to set an upper limit on the line-of-sight column density of 12CO in the ground vibrational level, cm-2. These low upper limits for the line-of-sight column densities of the two most abundant molecular gasses are somewhat confusing in light of the recent detection of very large amounts of warm molecular gasses in ISO spectra of 51 Oph. Van den Ancker et al. (2001) detect emission from 12CO, 13CO, H2O, CO2 and, surprisingly, NO at a gas temperature of about 850 K. Our upper limit on is highly inconsistent with their column density of cm-2. Even at 850 K, such a large column density of 12CO should produce a C–X (0,0) absorption band that is completely saturated over several Angstroms. This is clearly not seen in our data. Our non-detection of the warm CO seen by ISO indicates that very little of it lies along the line of sight to the star through the edge-on disk.
Van den Ancker et al. (2001) propose two possible explanations for the large amount of molecular gas they detected, 1) that a large mass ejection from the star into the disk has recently occurred, or 2) that a planet-sized body orbiting the star has recently been destroyed, possibly by a collision with another similar body. Although the second scenario seems very exotic, it is more consistent with our conclusion that very little of the warm CO seen by ISO lies along the line of sight. However, this issue must be thoroughly investigated with more sensitive observations searching for absorption from CO and other molecular gasses.
6 Variable Features and Infalling Gasses
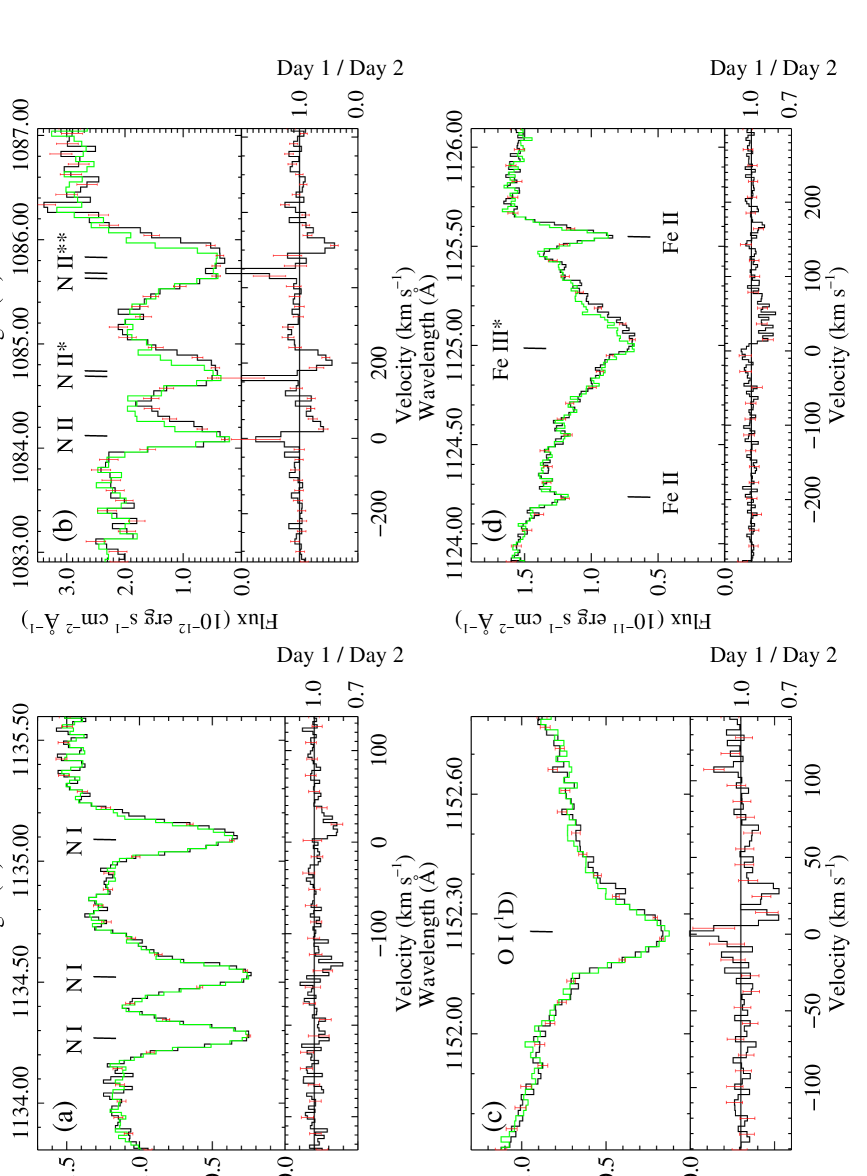
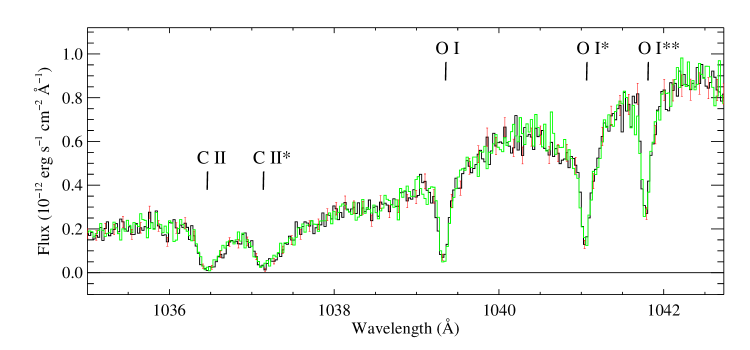
Comparison of the spectra from the two days of observation shows that they are practically identical. However, careful examination of the high S/N spectra revealed a few narrow absorption features that varied between the two days. They are shown in Figure 3, the N I triplet in Figure 3a, the N II multiplet in Figure 3b, the line arising from metastable O I () in Figure 3c, and one of the four Fe III lines (1124.87 Å) in Figure 3d. No other lines in the 51 Oph spectrum showed any significant time variation. For comparison, unvarying lines arising from C II and ground term O I () are shown in Figure 4. Note that most of the variable lines observed arise from excited energy levels, and therefore must represent purely CS gas.
In the August 29 spectrum, all the variable features show excess absorption that is redshifted with respect to the stellar velocity. The variable infalling gas absorption was isolated by dividing the August 29 (day 1) spectrum by the quiescent September 4 (day 2) spectrum, removing any possible IS, stellar, or non-varying CS absorption; the result is shown at the bottom of each panel of Figure 3. The spectra from the two days were cross-correlated using unvarying lines to align them exactly before normalization, but no shifting was necessary to align the LiF 1 spectra. All further analysis was performed on these normalized spectra.
The apparent “emission features” in the N II and O I () normalized spectra actually represent excess absorption in the day 2 spectrum, in a velocity range that is blueshifted relative to the day 1 excess absorption. Although they appear to be real because they are seen on the blue edge of all three N II features, they are not resolved and are only marginally (less than ) detected. No column densities were calculated for these day 2 excess absorption features; data with higher spectral resolution would have been necessary to confirm their reality.
The equivalent widths of the day 1 excess absorption features, calculated from the normalized spectrum, are shown in Table 3. They were then converted into column densities, assuming that the lines were unsaturated, and using the revised absorption oscillator strengths of Morton (1999). These column densities represent lower limits to the true column densities. More accurate measurement of the column densities was performed using the apparent optical depth method (see Savage & Sembach (1991) for a complete discussion). The apparent optical depth, in velocity space, is
| (1) |
where is the intensity without absorption, and is the observed intensity. The apparent optical depth will be a good representation of the true optical depth as long as no unresolved saturated structure is present in the absorption line. Unfortunately, for most of our lines we cannot prove this directly, as we do not have two well separated lines differing in arising from the same species and energy level. In our case, however, the excess absorption extends over at least 40 km s-1, and is therefore likely resolved. So, the apparent column density in some particular velocity range from to is
| (2) |
This method gives accurate column densities for lines that are not strongly saturated. A curve of growth analysis was not possible, because we did not observe enough lines arising from the same species and energy level. Since the N II* and N II** lines are blended and may be strongly saturated, we were not able to perform a reliable apparent optical depth analysis on them. However, the equivalent width analysis at least provides lower limits on the column densities of N II* and N II**.
The velocity ranges of the day 1 excess absorption features and the apparent column densities in these ranges are shown in Table 3. First, we can see that many of the lines are unsaturated, because the column densities obtained from the equivalent widths are equal (within ) to the apparent column densities. Second, the column densities of the Fe III lines show that the energy levels are statistically populated, within measurement errors. Therefore, the excitation temperature of the infalling Fe III gas must be greater than 1340 K, the temperature of the highest energy level observed. The presence of O I () absorption implies temperatures of around 23000 K.
The total column densities of infalling N I and Fe III gas, in all fine-structure levels, are cm-2 and cm-2. For N II, we find the total column density in all fine-structure levels to be at least cm-2. The maximum possible column density of N II may be calculated by assuming a statistical population of the fine-structure levels (1:3:5); the total column density in all levels must be less than or equal to cm-2. We conclude that the total column density of infalling N II gas, in all fine-structure levels, is in the range cm-2.
7 Discussion
Previous workers have suggested that 51 Oph might have a companion star, because its radial velocity was found to be variable (Buscombe, 1963). Our detection of time-variable, redshifted CS absorption lines in FUSE spectra of 51 Oph confirms the Grady & Silvis (1993) detection of such lines in IUE spectra. This confirmation leads us to believe that any previously measured variation in the star’s radial velocity is not due to the presence of a stellar companion, but rather due to the appearance and disappearance of redshifted CS absorption features.
7.1 Composition of the transient infalling gas
The ionization energies required to produce Fe III and N II are 16.19 eV and 14.53 eV, respectively. Since photons with wavelengths less than 766 Å and 853 Å are required to produce these species through photoionization, appreciable quantities cannot be produced by the IS UV field. Also, as can be seen from the FUSE spectrum of 51 Oph, the star has virtually no flux below about 1040 Å; therefore, these species cannot be produced by stellar photoionization either. They must be produced by collisional processes involving relatively dense gas. The fact that N II is more abundant than N I suggests a moderately high temperature for the infalling gas. A detailed analysis of the ionization balance is beyond the scope of this paper, but using the cooling functions of Sutherland & Dopita (1993) and assuming collisional ionization equilibrium, the ion fraction of N II suggests a temperature between 20000 and 34000 K for the transient infalling gas, which is consistent with the presence of O I () in this gas.
The composition of the transient infalling gas appears to be rather unusual. No C I, C II, or C III is detected in the transient infalling gas. In fact, the only carbon lines observed in the FUSE 51 Oph spectrum are photospheric C I lines and C II and C II* ground term () lines arising from IS/CS gas, which do not vary significantly between the two days. The strong metastable C II () line at 1010.37 Å is not seen, nor are the strong C III lines at 977.02 and 1175.71 Å. Given the estimated gas temperature range above, more than 80% of the carbon should be present as C II (Sutherland & Dopita, 1993). We find a conservative upper limit of cm-2 for the column densities of both C II and C II* in the infalling gas, giving an upper limit on the total carbon column density, cm-2.
The total nitrogen column density in the infalling gas, , is in the range cm-2. Therefore, the ratio of to in the transient infalling gas is at least 2.36. The solar abundance of nitrogen relative to carbon, , is 0.251 (Grevesse et al., 1990, 1991). The mean gas phase abundance of carbon atoms in the Local ISM is per H atoms (Cardelli et al., 1996) and that of nitrogen is per H atoms (Meyer et al., 1997). These values do not appear to vary with direction or with the physical conditions of the IS environment. Therefore, the infalling gas in the 51 Oph system does not appear to be composed of unprocessed IS gas, nor does it have a solar-like composition.
Given the gas temperature range determined from the nitrogen ionization balance, 63% to 64% of the total iron should be present as Fe III (Sutherland & Dopita, 1993). The total column density of iron in the infalling gas, , is therefore roughly cm-2. The ratio of to in the transient infalling gas is at least 3.83, while the solar abundance of iron relative to carbon is 0.0795 (Grevesse & Sauval, 1999), indicating that iron is even more overabundant relative to carbon than nitrogen is. We consolidate the results of our abundance analysis below.
We were not able to include the oxygen abundance in this analysis, because at temperatures of 20000 to 34000 K, less than 8% of the oxygen is present as O I. Therefore, we require a large extrapolation from our measured O I () column density to obtain the total oxygen column density. Unfortunately, there are no ground term O II lines longward of 911.7 Å.
Natta, Grinin, & Tambovtseva (2000) establish a useful test to determine if gas infall is related to planetesimal evaporation or magnetospheric accretion from a massive CS disk, as seen in classical T Tauri stars (Hartman et al., 1994). If the infalling gas is produced from star-grazing planetesimals, it should be depleted in hydrogen (or alternatively, it should be metal-rich). On the other hand, one would expect a roughly solar composition if the redshifted absorption is due to magnetospheric accretion. While our analysis of the composition of the infalling gas seen with FUSE is somewhat incomplete since we have no information on the hydrogen abundance, it does indicate that the composition of the transient infalling gas is extremely non-solar. Specifically, it appears that the gas must be either volatile-depleted or iron-rich, indicating that the gas is more likely to have been produced by vaporization of planetary material.
7.2 Dynamics of the transient infalling gas
We calculated the ratio of the force of radiation pressure from 51 Oph to the force of gravity for each variable species observed, using the equations
| (3) |
| (4) |
where is the absorption oscillator strength, is the stellar flux at some distance from the star, is the mass of 51 Oph, and is the mass of the atomic species. Note that the ratio of the forces, , is independent of the distance . The stellar fluxes were either measured from the FUSE spectrum, or estimated from our synthetic stellar spectrum at longer wavelengths. The strongest transitions are in the FUSE wavelength range, and the values of do not depend sensitively on the synthetic spectrum fluxes. We used a stellar mass of , estimated from the star’s position on the H-R diagram and assuming that it is on the zero-age main sequence. The calculated values of are shown in Table 3. We can see that for most of the variable species is greater than 1, and for N I and O I () it is quite large. One would therefore generally expect any optically-thin absorption from these species to be blueshifted, unless the gas was injected toward the star at a relatively high radial velocity, as would happen if it was produced from infalling planetesimals.
8 Concluding Remarks
A comparison of the characteristics of 51 Oph to those of Pictoris shows many similarities, strengthening the suggested evolutionary connection between the two systems. Both CS disks contain highly excited, metastable species that have short radiative decay lifetimes. Both systems also show the presence of variable, collisionally ionized CS material. The variable absorption features in both systems are most frequently redshifted with respect to the stellar velocity, despite the effect of radiation pressure. There are some differences between the two systems, however. If the variable redshifted events in the 51 Oph system are caused by infalling planetesimals, this system has a lower infall rate than Pic, since many observations of 51 Oph have not shown any variable infalling gas features (Lecavelier des Etangs et al., 1997b; Crawford, Craig, & Welsh, 1997).
The composition of the transient infalling gas in 51 Oph is highly non-solar, and is more likely produced by the destruction of a star-grazing planetesimal than by magnetospheric accretion of unprocessed gas. However, this conclusion needs to be tested by observation of additional infalling gas events in lines arising from many species, in order to perform a more complete analysis of the infalling gas composition. And detailed modeling is necessary to fully understand the significance of the metastable atomic species in both Pictoris and 51 Oph. Identification of 51 Oph as a planetary, rather than protoplanetary, system will at last firmly add another object to the class of Pictoris-type systems. Since 51 Oph is much younger than Pictoris, which is about yrs old (Barrado y Navascués et al., 1999), this will provide a tighter constraint on the time scale for planetary formation, and increase our knowledge about the evolution of CS disks.
References
- Barrado y Navascués et al. (1999) Barrado y Navascués, D., et al., ApJ, 520, L123
- Buscombe (1963) Buscombe, W. 1963, MNRAS, 126, 29
- Cardelli et al. (1996) Cardelli, J., A., Meyer, D. M., Jura, M., & Savage, B. D. 1996, ApJ, 467, 334
- Chayer (2001) Chayer, P. 2001, personal communication
- Crawford, Craig, & Welsh (1997) Crawford, I. A., Craig, N, & Welsh, B. Y. 1997, A&A, 317, 899
- Dunkin, Barlow, & Ryan (1997) Dunkin, S. K., Barlow, M. J., & Ryan, S. G. 1997, MNRAS, 290, 165
- Grady & Silvis (1993) Grady, C. A. & Silvis, J. M. S. 1993, A&A, 420, L61
- Grevesse et al. (1990) Grevesse, N., et al. 1990, A&A, 232, 225
- Grevesse et al. (1991) Grevesse, N., et al. 1991, A&A, 242, 488
- Grevesse & Sauval (1999) Grevesse, N. & Sauval, A. J. 1999, A&A, 347, 348
- Hartman et al. (1994) Hartman, L., Hewett, R., & Calvet, N. 1994, ApJ, 426, 669
- Lecavelier des Etangs et al. (1997a) Lecavelier des Etangs, A., Vidal-Madjar, A., Backman, D. E., et al. 1997a, A&A, 321, L39
- Lecavelier des Etangs et al. (1997b) Lecavelier des Etangs, A., Deleuil, M., Vidal-Madjar, A., et al. 1997b, A&A, 325, 228
- Meyer et al. (1997) Meyer, D. M., Cardelli, J. A., & Sofia, U. J. 1997, ApJ, 490, L103
- Morton (1999) Morton, D. C. 1999, personal communication
- Natta, Grinin, & Tambovtseva (2000) Natta, A., Grinin, V. P, & Tambovtseva, L. V. 2000, ApJ, 542, 412
- Roberge et al. (2000) Roberge, A., et al. 2000, ApJ, 538, 904
- Sahnow et al. (2000) Sahnow, D., et al. 2000, ApJ, 538, L7
- Savage & Sembach (1991) Savage, B. D. & Sembach, K. R. 1991, ApJ, 379, 245
- Slettebak (1982) Slettebak, A. 1982, ApJS, 50, 55
- Sutherland & Dopita (1993) Sutherland, R. S. & Dopita, M. A. 1993, ApJS, 88, 253
- Tozzi, Feldman, & Festou (1998) Tozzi, G. P., Feldman, P. D., & Festou, M. C. 1998, A&A, 330, 753
- van den Ancker, de Winter, & Tjin A Djie (1998) van den Ancker, M. E., de Winter, D., & Tjin A Djie, H. R. E. 1998, A&A, 330, 145
- van den Ancker et al. (2001) van den Ancker, M. E., Meeus, G., Cami, J., Waters, L. B. F. M., & Waelkens, C. 2001, A&A, 369, L17
- Vidal-Madjar et al. (1998) Vidal-Madjar, A., Lecavelier des Etangs, A., & Ferlet, R. 1998, Planet. Space Sci., 46, 629
- Waelkens et al. (1996) Waelkens, C. et al. 1996, A&A, 315, L245
- Waters et al. (1988) Waters, L. B. F. M., Coté, J., & Geballe, T. R. 1988, A&A, 203, 348
| Species | Wavelength | Energy Level | Comments |
|---|---|---|---|
| (Å) | (cm-1) | ||
| C II | 1036.34 | 0.00 | part IS |
| C II* | 1037.02 | 63.42 | purely CS |
| O I | 1039.23 | 0.00 | part IS |
| O I* | 1040.94 | 158.27 | purely CS |
| O I** | 1041.69 | 226.98 | ” |
| Si II | 989.87, 1020.70 | 0.00 | part IS |
| Si II* | 992.69, 1023.70 | 287.24 | purely CS |
| Ar I | 1048.22, 1066.66 | 0.00 | part IS |
| Fe II | 1142.37, …, 1055.26 | 0.00 | part IS |
| Fe II* | 1146.95, …, 1060.44 | 384.79 | purely CS |
| Fe II** | 1150.29, …, 1063.02 | 667.68 | ” |
| Fe II*** | 1153.27, …, 1065.84 | 862.61 | ” |
| Fe II**** | 1154.40, …, 1076.85 | 977.05 | ” |
| Metastable Species | |||
| N I | 1163.88, …, 1176.51 | 19224.47 | purely CS |
| N I | 1168.54, 1177.70 | 19233.18 | ” |
| N I | 1143.646, 1143.651 | 28839 | ” |
| S II | 1019.53 | 14852.87 | purely CS |
| S II | 1014.44 | 14884.67 | ” |
| Time-Variable Species | |||
| N I | 1134.17, 1134.41, 1134.98 | 0.00 | part IS |
| N II | 1083.99 | 0.00 | |
| N II* | 1084.57, 1084.58 | 48.67 | purely CS |
| N II** | 1085.53, 1085.55, 1085.71 | 130.80 | ” |
| O I | 1152.15 | 15867.86 | purely CS, metastable |
| Fe III | 1122.52 | 0.00 | |
| Fe III* | 1124.87 | 435.80 | purely CS |
| Fe III** | 1126.72 | 738.55 | ” |
| Fe III*** | 1129.19 | 932.06 | ” |
| Species | Wavelength | Energy level | Lifetime | aaFor the blended lines, we used an effective oscillator strength equal to the sum of the two individual line oscillator strengths. | bbThe metastable S II lines are slightly redshifted by km s-1 with respect to the stellar velocity. | Comments |
|---|---|---|---|---|---|---|
| (Å) | (cm-1) | (mÅ) | (cm-2) | |||
| N I () | 1168.42 | 19224.47 | 48.2 hrs | unshifted | ||
| N I () | 1177.70 | 19233.18 | 12.3 hrs | unshifted | ||
| N I () | 1143.646, 1143.651 | 28839 | 13 sec | unshifted, blendedaaFor the blended lines, we used an effective oscillator strength equal to the sum of the two individual line oscillator strengths. | ||
| S II () | 1019.53 | 14852.87 | 39 min | shiftedbbThe metastable S II lines are slightly redshifted by km s-1 with respect to the stellar velocity. | ||
| S II () | 1014.44 | 14884.67 | 36 min | shiftedbbThe metastable S II lines are slightly redshifted by km s-1 with respect to the stellar velocity. |
| Species | Wavelength | Energy level | aaEquivalent width. | bbColumn density calculated from , assuming the line is unsaturated. These values are lower limits to the true column densities. | Velocity rangeccVelocities given with respect to the stellar velocity. | ddRatio of radiation pressure to gravity for this species. | eeApparent column density, obtained by integrating the apparent optical depth over the velocity range. | Comments |
|---|---|---|---|---|---|---|---|---|
| (Å) | (cm-1) | (mÅ) | ( cm-2) | (km s-1) | ( cm-2) | |||
| N I | 1134.41 | 0.00 | 0 – 40 | 7.4 | unsaturated | |||
| N I | 1134.98 | ” | ” | ” | ” | |||
| N II | 1083.99 | 0.00 | 14 – 114 | 1.6 | saturated | |||
| N II* | 1084.57, 1084.58 | 48.67 | 1.6 | blendedffFor the blended lines, we used an effective oscillator strength equal to the sum of the individual line oscillator strengths. | ||||
| N II** | 1085.53, 1085.55, 1085.71 | 130.80 | 1.6 | blendedffFor the blended lines, we used an effective oscillator strength equal to the sum of the individual line oscillator strengths. | ||||
| O I ggMetastable species. | 1152.15 | 15867.86 | 6 – 71 | 4.7 | unsaturated | |||
| Fe III | 1122.52 | 0.00 | 0 – 84 | 0.25 | saturated | |||
| Fe III* | 1124.87 | 435.80 | ” | 1.3 | unsaturated | |||
| Fe III** | 1126.72 | 738.55 | ” | 0.68 | ” | |||
| Fe III*** | 1129.19 | 932.06 | ” | 0.46 | ” |