Study of the Cir X–1 Broad Band Spectrum at Orbital Phases Close to the Apoastron
Abstract
We report on the results of a BeppoSAX (1.8–200 keV) observation of the peculiar X–ray binary source Circinus X–1 (Cir X–1) at the orbital phases between 0.61 and 0.63. We find that three components are needed to fit the broad band spectrum: a blackbody component, at a temperature of keV, a Comptonized component, with a seed-photon temperature of keV, electron temperature of keV and optical depth of , and a power-law component dominating the spectrum at energies higher than 20 keV. We interpret the blackbody as the emission from the accretion disk, while the Comptonized component probably comes from a corona surrounding the inner part of the system. This spectrum is different from that observed at the periastron (Iaria et al. 2001a) because of the presence of the blackbody component. We discuss the implications of this difference and the presence of the power-law component.
1 Introduction
Cir X–1 is a peculiar Low Mass X-ray binary (LMXB). Generally in LMXBs the companion star has a mass M⊙ and the orbit is almost circular; contrarily Cir X–1 has a companion star of M⊙ (probably a subgiant, see Johnston et al., 1999), an orbital period of days and an eccentric orbit with (Murdin et al., 1980; Tauris et al., 1999). It is a widely accepted idea that Cir X–1 is a runaway binary, because of its association with the supernova remnant G321.9-0.3 (Clark et al., 1975). The most recent estimation of the distance to the supernova remnant G321.9-0.3, and hence to Cir X–1, is 5.5 kpc (Case & Bhattacharya, 1998). Therefore in the following we adopt 5.5 kpc as the distance to the source.
The spectral and fast-timing properties of accreting low magnetic field neutron stars permit distinguishing them into two classes, Z and atoll sources, using the pattern each source describes in an X-ray color-color diagram (Hasinger & van der Klis 1989). The Z sources are very bright and could have a moderate magnetic field, while the atoll sources have a lower luminosity and probably a weaker magnetic field. The timing analysis of RXTE data (Shirey et al., 1996) evidenced that Cir X–1 is more similar to LMXBs of the Z class. However no quasi periodic oscillations at kilohertz frequencies were observed in Cir X–1 (Shirey, 1996) contrarily to all the other Z-sources.
Brandt et al. (1996), using ASCA/GIS data taken on 1994 August 4–5, found a sudden variation (with a timescale of minutes) of the flux at the periastron phase, where the count rate increased from counts s-1 to counts s-1. In the low-count rate state they obtained a good fit to the 0.6–10 keV spectrum using a partial covering component, in addition to a two-blackbody model, with a corresponding hydrogen column of cm-2; in the high-count rate state the partial covering of the X-ray spectrum was not needed. Because of the similarity with the spectra of Seyfert 2 galaxies with Compton-thin tori, Brandt et al. (1996) suggested that matter at the outer edge of the accretion disk, together with an edge-on disc orientation, could explain the partial covering of the spectrum in Cir X–1.
Iaria et al. (2001a), using BeppoSAX data, analysed the 0.1–100 keV spectrum of Cir X–1 at orbital phases near the periastron. They found that the continuum could be well described by either a two-blackbody model or a Comptonization model. In the first case, the so-called “Eastern Model” proposed by Mitsuda et al. (1984), the soft blackbody emission is interpreted as the emission from the inner region of the accretion disk while the hard blackbody comes from the neutron star surface. In the case of Cir X–1 the radius of the soft blackbody was km, which should correspond to the inner radius of the accretion disk, while the radius of the harder blackbody component was km, that is too large to be interpreted as the neutron star radius. Therefore the Comptonization model was preferred. A hard power-law tail, dominanting the spectrum at energies higher than 15 keV, was also observed. A similar feature was observed in other Z-source LMXBs (GX 17+2, Di Salvo et al., 2000; GX 349+2, Di Salvo et al., 2001; GX 5–1, Asai et al., 1994; Sco X–1, D’Amico et al., 2000), suggesting that Cir X–1 shows a behaviour similar to that of other Z-sources. Finally a strong absorption edge at keV, produced by highly ionized iron, was needed to fit the spectrum of Cir X–1.
Brandt & Schulz (2000), using Chandra data, observed Cir X–1 near the periastron. They found, for the first time in the X-ray band, P-Cygni profiles of lines emitted by highly ionized matter. The outflow velocity necessary to explain the P-Cygni profiles was km/s. Under the hypothesis that the source is seen nearly edge-on, they supposed that the model of a thermally driven wind (Begelman et al., 1983) could explain this outflow of ionized matter from the system. Also they suggested that the absorption edge observed by Iaria et al. (2001a) could be connected to the outflow.
Iaria et al. (2001b), using ASCA data, studied the energy spectrum of Cir X–1 along its orbit. They distinguished three different X-ray states of the source as a function of its orbital phase. At first, when the source is near the periastron (according to the ephemeris of Stewart et al., 1991), the luminosity is super-Eddington and a large X-ray flaring activity is present. In the second state, corresponding to the orbital phase interval , the luminosity is sub-Eddington and the lightcurve does not show flaring activity. In the third state, in the orbital phase interval , an excess of neutral matter (probably the atmosphere of the companion star and/or the accreting matter) partially covers the emitting region. In all these states, the continuum was well fitted using a Comptonization model. Unfortunately, because of the relatively narrow band of ASCA (0.6–10 keV), the spectral evolution of the hard tail along the orbit could not be studied. On the other hand, it was possible to study the evolution of the absorption edge along the orbit of Cir X–1. At the phase of the flaring activity the hydrogen column derived from the edge was cm-2; when the source moved away from the periastron the hydrogen column decreased; the absorption edge (from ionized iron) was no longer detected at orbital phases from 0.78 to the periastron. It is possible that the outflowing wind is connected to the huge flaring activity at the periastron.
In this work we present the broad band (1.8–100 keV) spectrum of Cir X–1 from a BeppoSAX observation taken at orbital phases 0.61–0.63. The broad band allows us to constrain the continuum components of the spectrum and to detect the presence of a hard tail at energies higher than 20 keV.
2 Spectral Analysis of Cir X–1 at the Apoastron
A pointed observation of Cir X–1 was carried out between 1999 Feb 07 03:15:19 UT and 1999 Feb 08 19:25:33 UT, with the Narrow Field Instruments, NFIs, on board BeppoSAX (Boella et al. 1997). These consist of four co-aligned instruments covering the 0.1–200 keV energy range: a Low-Energy Concentration Spectrometer (LECS; operating in the range 0.1–10 keV), two Medium-Energy Concentration Spectrometers (MECS; 1.3–10 keV), a High-Pressure Gas Scintillation Proportional Counter (HPGSPC; 7–60 keV), and a Phoswich Detector System (PDS; 13–200 keV). The LECS and the HPGSPC were not active during this observation. The effective exposure time was 25 ks in the MECS and 11 ks in the PDS. In the MECS image, data were extracted from a circular region of radius centered on the source centroid. Data extracted from the same detector region during blank field observations were used for background subtraction. Background subtraction for the PDS data was obtained from data accumulated during off-source intervals. We rebinned the energy spectra in order to have at least 25 counts/channel and to oversample the instrument resolution with the same number of channels at all energies111see the BeppoSAX cookbook at http://www.sdc.asi.it/software/index.html.
Using the orbital parameters reported by Stewart et al. (1991), we have calculated that this observation corresponds to the orbital phase interval 0.61–0.63, just after the apoastron. In Figure 1 we plotted the hardness-intensity diagram, where the hardness is the ratio between the count rate in the 3–7 keV energy band to the count rate in the 1–3 keV energy band, and the intensity is the count rate in the 1–7 keV energy band. In this figure we show both the data of this observation and those of a previous BeppoSAX observation at the periastron (see Iaria et al., 2001a). The data at the apoastron show larger hardness and lower intensity with respect to the data at the periastron. In Figure 2 we plotted the color-color diagram of Cir X–1 data, where the hard color is the ratio between the count rate in the energy band 7–10 keV to that in the energy band 3–7 keV and the soft color is the hardness defined above. The data at the apoastron are at the top right in this figure while the data obtained at the periastron are at the bottom left, implying that the spectrum at the apoastron is harder in both the soft and hard color. In Figure 3 we plotted the lightcurve of the data at the apoastron in the energy band 1.8–10 keV (upper panel) together with the soft color as a function of time (lower panel). The count rate smoothly decreases from Counts s-1, at the beginning of the observation, to Counts s-1, at the end of the observation. No flaring activity is present.
Because no significant spectral variation is observed in the hardness ratios described above, we produced an unique spectrum, in the band 1.8–200 keV, from this observation. A systematic error of 1% was added to each spectrum. As customary, in the spectral fitting procedure we allowed for a different normalization of the PDS spectrum relative to the MECS spectrum, always checking that derived values are in the standard range for that instrument222see the BeppoSAX cookbook at http://www.sdc.asi.it/software/index.html. The energy ranges used for the spectral analysis are 1.8–10 keV for the MECS and 15–200 keV for the PDS. Because of the lack of low energy data we fixed the value of the average photoelectric absorption by cold matter at cm-2 (see e.g. Iaria et al. 2001a, 2001b). We started fitting the data to the Comptonization model Comptt (Titarchuk, 1994). This model gave an unacceptable fit with ; the residuals with respect to this model are shown in Figure 4 (upper panel). From the residuals, it is evident that there is a feature between 8 and 10 keV and an excess at energies higher than 15 keV. Note that because this simple model does not fit the high energy part of the spectrum, we had to fix the PDS normalization factor to 0.85 (its typical value) to avoid unreasonably high values of this parameter.
Then, in agreement with the model proposed by Iaria et al. (2001a) for the spectrum of Cir X–1 at the periastron, we added a power law to fit the high energy excess, an absorption edge at keV and a Gaussian emission line at keV (with the Gaussian fixed at 0.25 keV), keeping fixed the PDS normalization factor. The addition of each of these components is statistically significant and in this way the fit improves significantly, giving . In Table 1 (Model 1) we present the best fit parameters obtained for this model. Looking at the residuals with respect to Model 1 (Figure 4, middle panel), we still see modulations between 1.8 and 5 keV and between 20 and 40 keV, indicating that the continuum emission could be more complex.
The modulation in the residuals could be due to the large contribution at low energies of the power law which has a large normalization and a photon index of . We modified the power law multiplying it for an exponential cutoff at low energy (Expfac in XSPEC), fixing the low-energy cutoff at the electron temperature of the Comptonized component. In this way we found a stable (and reasonable) fit, with the PDS normalization factor and the width of the Gaussian emission line as free parameters (see Table 1, Model 2). The residuals (see Fig. 4, lower panel) show that the modulation between 1.8 and 5 keV is now smaller. We obtain and an F-Test with respect to the previous model gives a probability of chance improvement of the fit of . However, the modulation between 20 and 40 keV is still visible.
We, therefore, tried an alternative model, consisting of Model 1 to which we added a blackbody component at low energies. The addition of the blackbody component improved the fit significantly, giving , with a probability of chance improvement with respect to Model 1 of . Hence we consider this as the best fit model. The F-Test for the addition of the power law component in this case gives a probability of chance improvement of . In Table 1 (Model 3) we report the parameters of the best fit model. The blackbody temperature is keV. The parameters of the Comptonized component are as follows: the seed-photon temperature is keV, the electron temperature is keV and the optical depth of the Comptonizing cloud is . The centroid of the Gaussian emission line is at keV, with FWHM keV, and the absorption edge is at keV, with an optical depth . The PDS normalization factor is .
In Figure 5 we show the data and the residuals with respect to the Model 3. Note that in this case the modulations between 1.8 and 5 keV and between 20 and 40 keV disappear, confirming that Model 3 gives the best fit to these data. In Figure 6 we show the corresponding unfolded spectrum. The extrapolated unabsorbed flux, in the energy band 0.1–200 keV, is erg s-1 cm-2 for the Comptonized component, erg s-1 cm-2 for the blackbody component and erg s-1 cm-2 for the power-law component.
3 Discussion
We analyzed data of Cir X–1 from a BeppoSAX observation (in the orbital phase range 0.61–0.63) in the energy range 1.8–200 keV. The lightcurve and the hardness ratio do not show large variations during the observation. From Figures 1 and 2 it is clear that the spectrum, in the range 1–10 keV, is different from that observed at the periastron (Iaria et al., 2001a); in fact the spectrum at the apoastron is harder in both the soft and hard colors and the intensity is lower than that at the periastron. The spectrum of Cir X–1 during this observation is very similar to that of other Z-sources (see Di Salvo et al., 2000; Di Salvo et al., 2001). The soft X-ray continuum in the energy range 1.8–10 keV is well fitted by a blackbody and a Comptonized component, while a power-law component, with photon index , is present at energies higher than 20 keV.
The blackbody temperature is keV and the corresponding radius of the emitting region is km. This radius is too large to be associated with the emission from the neutron star surface; therefore the blackbody component is probably emitted by the inner part of the accretion disk. The seed-photon and electron temperature of the Comptonized component are keV and keV, respectively, and the optical depth is . We calculated the radius, , of the seed-photon emitting region using the parameters reported in Table 1 (Model 3) following in ’t Zand et al. (1999); we obtain km. This component could be produced by a corona surrounding the neutron star and occulting the inner region of the accretion disk.
We found an absorption edge at keV with . The energy of the absorption edge is compatible with iron ionization levels of Fe XXIII–XXIV (see Turner et al., 1992 for a correspondence between iron edge energy and ionization level). The best fit value for the optical depth , considering the photoionization cross section for the K-shell of Fe XXIII (Krolik & Kallman, 1987), corresponds to a hydrogen column density of cm-2. A Gaussian emission line is also detected at keV. The energy of the emission line corresponds to iron ionization levels Fe XXIV–XXV, compatible with that of the absorption edge (see Turner et al., 1992). This suggests that the iron emission line could be produced in the same region where the absorption edge is produced. Note that the ASCA spectrum at orbital phase 0.54–0.56, the nearest to the orbital phase of the BeppoSAX observation analyzed here, shows both the iron emission line and the absorption edge, and their parameters are in agreement with the values we found from this BeppoSAX observation (cf. Iaria et al. 2001b).
The best fit model obtained here is different from that used by Iaria et al. (2001a) for the BeppoSAX spectrum of Cir X–1 taken at the periastron, when a flaring activity was present. In that case only the Comptonized component was needed to fit the continuum from 0.12 to 10 keV and the blackbody component was not needed. The seed-photon and electron temperatures at the periastron were and keV, respectively, with a radius of the seed-photon emitting region of km.
One possibility to explain the large seed-photon radius observed at the periastron, in the hypothesis it is the inner radius of the accretion disk, might be the presence of a large neutron star magnetic field with a strength of G, more the one order of magnitude higher than the typical value estimated for the Z-sources. In light of the new results on Cir X–1, presented in this work, we can exclude this possibility. In fact, the flux from the source was larger than erg cm-2 s-1 during the observation at the periastron and, for a distance to the source of 5.5 kpc (Case & Bhattacharya, 1998), the corresponding luminosity is super-Eddington. During the observation analysed here, where Cir X–1 is near the apoastron, the estimated flux is erg cm-2 s-1 and the luminosity is sub-Eddington. Because the X-ray luminosity is connected to the accretion rate, the ram pressure of the disk should be lower, by a factor of at the apoastron than at the periastron. Consequently the magnetospheric radius (see e.g. Burderi et al., 1998) should be km at the apoastron, assuming the same strength of the magnetic field of G. However we find that the inner radius of the accretion disk is km.
Another possibility to explain the large inner radius of the accretion disk observed at the periastron can be the occultation of the inner region by a corona surrounding the neutron star. This corona should be therefore more extended at the periastron and cover a larger part of the accretion disk. This hypothesis is also supported by the differences between the spectrum at the periastron and at the apoastron. The seed-photon temperature is much lower at the periastron ( keV), with a comparatively higher accretion rate, than at the apoastron ( keV), implying that at the periastron the seed photons for the Comptonization come from a further region in the accretion disk. In particular at the periastron the seed photons probably come from a region which extends up to a radius of km in the accretion disk (see Iaria et al. 2001a). On the other hand at the apoastron, the seed photons probably come from a region which extends up to km in the accretion disk. This also explains why we observe a blackbody component at the apoastron, which we interpret as the emission of the part of the accretion disk not covered by the corona, i.e. from radii larger than km, while this component is not observed at the periastron. In fact the disk emission from radii larger than 150 km would probably be too soft to be significantly detected by the BeppoSAX/LECS.
A power-law component, dominanting the spectrum of Cir X–1 at energies higher than 20 keV, is also detected with high statistical significance. This component was observed two times in Cir X–1: at the periastron (Iaria et al., 2001a), and near the apoastron (present work). At the periastron of Cir X–1 the photon index was with a flux in the band 10–200 keV of erg s-1 cm-2. At the apoastron the photon-index is with a flux in the band 10–200 keV of erg s-1 cm-2. Note that the radio emission in Cir X–1 is maximum near the periastron (Stewart et al., 1993; Fender, 1997). Also, the observation of Cir X–1 presented in this work is at the orbital phase between 0.61–0.63; at the same orbital phases Fender (1997) detected a secondary radio flaring activity with a maximum intensity of mJy, lower than at the periastron (where the maximum intensity is mJy). Although a systematic study of the presence of the hard power-law component along the entire orbit is needed to draw a conclusion, the coincidence between the presence of this component and periods of radio flares suggests a connection between these two phenomena. In particular the power-law component might have a non-thermal origin and might be related to the presence of the high velocity electrons responsible for the radio emission.
As mentioned above, there is evidence that a jet is present at the periastron (Stewart et al., 1993; Fender, 1997). Also, the prominent absorption edge from highly ionized matter observed at the periastron of Cir X–1 is probably connected with the outflowing wind observed by Chandra (Brandt & Schulz, 2000; Iaria et al., 2001b). These observations could be explained using a model similar to that proposed for young stellar objects (YSOs). The source HH30 presents both a jet and a wind from the disk. Goodson et al. (1999) explain the presence of these two phenomenaby postulating that the interaction between the stellar magnetosphere and the surrounding accretion disk drives a two-component outflow, the jet and the disk wind. The magnetic loops connecting the accretion disk to the star, expand due to the differential rotation between the star and the disk (Hayashi at al., 1996; Lovelace et al. 1995). The plasma trapped in the loops is driven toward the rotation axis, giving a collimated jet and an outflowing wind outward along the disk surface. Magnetic reconnections can produce large X-ray flaring activity and allow for the process to repeat.
In this interpretation the P-Cygni profiles and the absorption edge observed near the periastron could be explained by the disk wind expected in this model, the radio emission by the collimated jet and the flaring activity at the periastron by the magnetic reconnections. The Comptonized emission observed at the periastron could also come from the outflowing wind. The outflow and then the Comptonizing region, because of the large magnetic activity, probably extends far from the neutron star above the disk, and, as mentioned above, this might explain why we do not observe the blackbody emission from the accretion disk at the periastron. However, note that the work of Goodson et al. (1999) is based on YSOs and possibly the results might not be applied in a straightforward way to the case of Cir X–1, because of the different strength of the neutron star magnetic field. A study of the consequences of this model in the more extreme case of magnetized neutron stars would be interesting in this context. Following this scenario we can suppose that at the apoastron there are no magnetic reconnections and consequently the source is not highly variable. However, the reason for this difference between the periastron and the apoastron is not clear, although we can suppose it can be related to the difference in the accretion rate and/or tidal interactions, and should be investigated with a proper model.
4 Conclusions
In this work we presented the analysis of the broad band (1.8–200 keV) spectrum of Cir X–1 at the orbital phase 0.61–0.63, using a BeppoSAX observation. The luminosity of the source is sub-Eddington, and the spectrum is harder than that at the periastron (Iaria et al., 2001a). The model used to fit this spectrum is the same that has been used for other Z-sources (see Di Salvo et al., 2000; Di Salvo et al., 2001); we find that the continuum is well fitted using three components. The first is a blackbody with a temperature of keV, probably produced by the inner region of the accretion disk. The corresponding blackbody radius is km. The second is a Comptonized component with a seed-photon temperature of keV, an electron temperature of keV and optical depth of . We interpret this component as the emission from a corona (or an outflowing wind) around the neutron star. In this case there is a weaker outflow of matter, suggested by the relatively low optical depth of the absorption edge, which is now , one order of magnitude lower than at the periastron. The third component is a power-law that could be produced by Comptonization off non-thermal electrons or by synchrotron emission in a jet. An emission line is also present at keV, with keV. The ionization level inferred from the line is Fe XXIV–XXV. The last observed feature is an absorption edge from highly ionized iron (Fe XXIII–XXIV), probably produced by an outflowing wind along the disk surface.
References
- (1) Asai, K. et al., 1994, PASJ, 46, 479
- (2) Begelman, M. C., McKee, C. F., Shields, G. A., 1983, ApJ, 271, 70
- (3) Boella G., Butler R. C., Perola G. C., Piro L., Scarsi L., Blecker J., 1997, A&AS, 122, 299
- (4) Brandt, W. N., Fabian, A. C., Dotani, T., Nagase, F., Inoue, H., Kotani, T., Segawa, Y., 1996, MNRAS, 283, 1071
- (5) Brandt, W. N.; Schulz, N. S., 2000, ApJL, 544, L123
- (6) Burderi, L.; Di Salvo, T.; Robba, N. R.; del Sordo, S.; Santangelo, A.; Segreto, A., 1998, ApJ, 498, 831
- (7) Case, G. L., Bhattacharya, D., 1998, ApJ, 504, 761
- (8) Clark, D. H., Parkinson, J. H., Caswell, J. L., 1975, Nature, 254, 674
- (9) D’Amico, F., Heindl, W. A., Rothschild, R. E., & Gruber, D. E., 2001, ApJ, 547, L147
- (10) Di Salvo, T., et al., 2000, ApJ, L544, 119
- (11) Di Salvo, T., et al., 2001, ApJ, 554, 49
- (12) Fender, R. P., 1997, Proceedings of the Fourth Compton Symposium, Editors Charles D. Dermer, Mark S. Strickman, and James D. Kurfess, Williamsburg, VA April 1997: AIP Conference Proceedings 410, p. 798
- (13) Goodson, A. P., Bohm, K. H., Winglee, R. M., 1999, ApJ, 524, 142
- (14) Johnston, H. M., Fender, R., Wu, K., 1999, MNRAS, 308, 415
- (15) Hayashi, M. R., Shibata, K., Matsumoto, R., 1996, ApJL, 468, 37
- (16) Hasinger, G., & van der Klis, M., 1989, A&A, 225, 79
- (17) Krolik, J. H., Kallman T. R., 1987, ApJL, 320, L5
- (18) Iaria, R.; Burderi, L., Di Salvo, T., La Barbera, A., Robba, N. R., 2001a, ApJ, 547, 412
- (19) Iaria, R., Di Salvo, T., Burderi, L., Robba, N. R., 2001b, ApJ, in press (astroph/0107202)
- (20) in ’t Zand, J. J. M. et al., 1999, A&A, 345, 100
- (21) Lovelace, R. V. E., Romanova, M. M., Bisnovatyi-Kogan, G. S., 1995, MNRAS, 275, 244
- (22) Mitsuda, K. et al., 1984, PASJ, 36, 741
- (23) Murdin, P., Jauncey, D. L., Haynes, R. F., Lerche I., Nicolson, G. D., Holt, S. S., Kaluzienski, L. J., 1980, A&A, 87, 292
- (24) Shirey R. E., Bradt, H. V., Levine, A. M., Morgan, E. H., 1996, ApJL, 469, L21
- (25) Stewart, R. T., Nelson, G. J., Penninx, W., Kitamoto, S., Miyamoto, S., Nicolson, G. D., 1991, MNRAS, 1991, 253
- (26) Stewart, R. T., Caswell, J. L., Haynes, R. F., Nelson, G. J., 1993, MNRAS, 261, 593
- (27) Tauris, T. M., Fender, R. P., van den Heuvel, E. P. J., Johnston, H. M., Wu, K., 1999, MNRAS, 310, 1165
- (28) Titarchuk L., 1994, ApJ, 434, 570
- (29) Turner, T. J., Done, C., Mushotzky, R., Madejski G., 1992, ApJ, 391, 102
TABLE
| Model 1 | Model 2 | Model 3 | |
| Comptt+ Power-law + | Comptt+ Modified Power-law+ | BB+Comptt+ | |
| Line +Edge | Line +Edge | Power-law+ Line +Edge | |
| 1.7 (fixed) | 1.7 (fixed) | 1.7 (fixed) | |
| Eedge (keV) | |||
| (keV) | – | – | |
| Nbb | – | – | |
| (keV) | |||
| (keV) | |||
| Ncomp | |||
| fbol( ergs cm-2 s-1) | 3.2 | 3.2 | 2.3 |
| EFe (keV) | |||
| (keV) | 0.25 (fixed) | ||
| IFe ph cm-2 s-1) | |||
| (eV) | |||
| Photon Index | |||
| NPL | |||
| Low-energy cutoff (keV) | – | – | |
| PDS normalization | 0.85 (fixed) | ||
| /d.o.f. |
FIGURE CAPTIONS
Figure 1: Hardness-intensity diagram of Cir X–1. We show in
the same box the data at the periastron binary phase (Iaria et al.,
2001a) and the new data taken near the apoastron phase, as indicated in the
figure. The hardness is defined by the ratio [3-7 keV]/[1-3 keV] and the
intensity of the source is calculated in the energy band [1-7 keV].
The bin time is 137 s.
The data at the apoastron correspond to lower intensity and higher
hardness (top left in the diagram).
Figure 2: Color-color diagram of Cir X–1. We report here the
same data shown in Figure 1. The hard color is the hardness ratio
[7-10 keV]/[3-7 keV] and the soft color is the hardness ratio [3-7
keV]/[1-3 keV]. The bin time is 137 s. The data at the apoastron are
at the top right of the box showing that the spectrum is harder in both
the soft and the hard color.
Figure3: Cir X–1 lightcurve in the energy band 1.8–10 keV (MECS data,
upper panel) and ratio of the count rate in the energy band 3–7 keV to that
in 1.8–3 keV (lower panel). The bin time is 137 s.
Figure 4: Residuals in units of with respect to the
Comptonization model (upper panel), to Model 1 (middle panel), to Model 2
(lower panel). The models are described in the text and in Table 1.
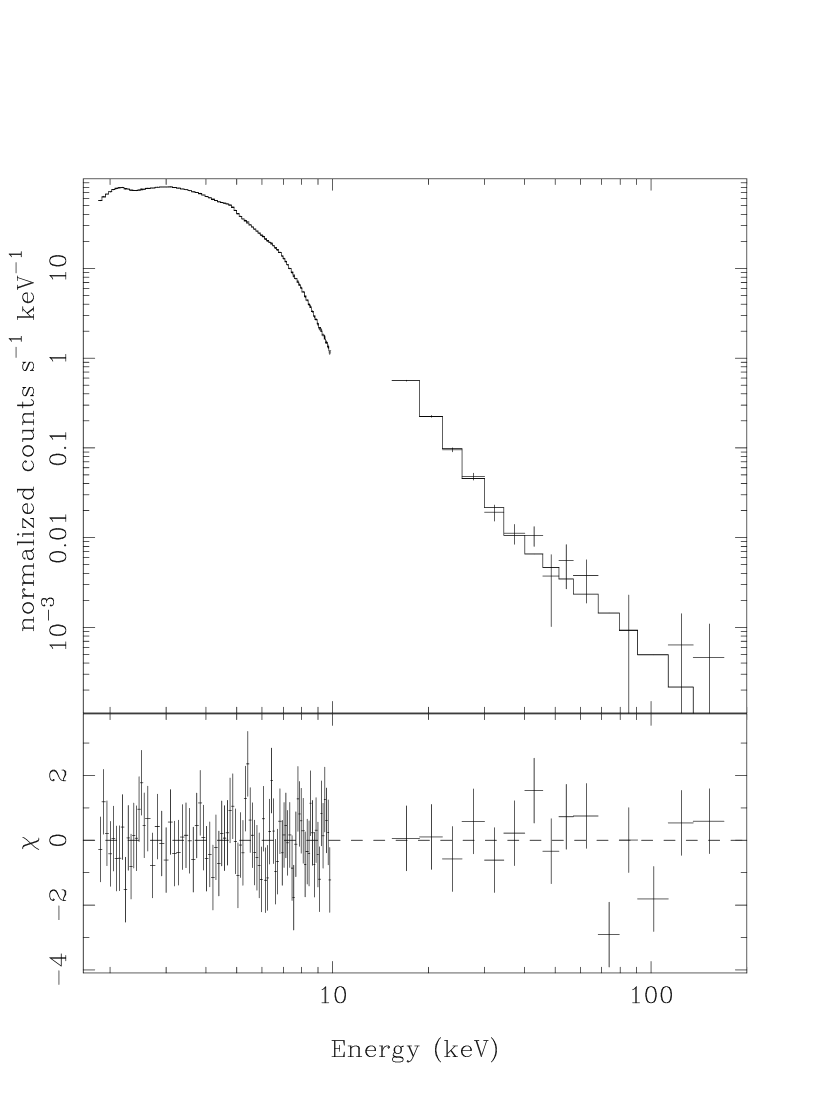
Figure 5: Energy spectrum (1.8–200 keV) of Cir X–1 at the
orbital phase 0.61–0.63. Data and the corresponding best fit model
(see Tab. 1, Model 3) are shown in the upper panel, residuals in units
of with respect to the best fit model are shown in the lower
panel.
Figure 6: Unfolded spectrum of Cir X–1 and the best fit model,
shown in this figure as a solid line. The single components of the
model are also shown, namely the blackbody (dashed line), Comptt
(dotted line), power-law (dot-dot-dashed line) and iron emission line
(dot-dashed line). The absorption edge at 8.45 keV is visible.