Monte Carlo Simulations of the Blinking-Checkers Model for Polyamorphic Fluids
Abstract
The blinking-checkers model [F. Caupin and M. A. Anisimov, Phys. Rev. Lett, 127,185701 (2021)] is a minimal lattice model which has demonstrated that, in the meanfield approximation, it can reproduce the phenomenon of fluid polyamorphism. This model is a binary lattice-gas, in which each site has three possible states: empty, occupied with particles of type 1, and occupied with particles of type 2. Additionally, the two types of particles may interconvert from one to another. Equilibrium interconversion imposes a constraint that makes this model thermodynamically equivalent to a single-component system. In this work, Monte-Carlo simulations of the blinking-checkers model are performed, demonstrating polyamorphic phase behavior. The locations of the liquid-liquid and liquid-gas critical points are found to be different from the meanfield predictions for this model with the same interaction parameters, as the phase behavior is significantly affected by critical fluctuations. Based on the computed values of the critical exponents of the order parameter, susceptibility, correlation length, and surface tension, we confirm that the blinking-checkers model, for both liquid-gas and liquid-liquid equilibria, belongs to the three-dimensional Ising class of critical-point universality.
keywords:
Monte Carlo simulations, binary-lattice model, molecular interconversion, fluid polyamorphism1 Introduction
Typically, pure substances may be found with only one gaseous or liquid state, while their solid state may exist in various polymorphic crystalline states. The existence of multiple distinct liquid forms in a single-component substance is more unusual since liquids lack the long-range order common to crystals. Yet, the existence of multiple amorphous liquid states in a single component substance, a phenomenon known as “liquid polyamorphism,” [1, 2, 3] has been observed or predicted in a wide variety of substances, such as superfluid helium [4, 5], high-pressure hydrogen [6, 7, 8, 9, 10], high-density sulfur [11, 12], phosphorous [13, 14], carbon [15], silicon [16, 17, 18, 19], selenium and tellurium [20, 21], cerium [22], and in various oxides [3] - e.g. silica [23, 24]. It has also been hypothesized in deeply supercooled liquid water [25, 26, 1, 2, 3, 27, 28, 29, 30, 31, 32, 33, 34].
A substance may be found to be polyamorphic by experimentally or computationally detecting a liquid-liquid phase transition (LLPT), which may terminate at a liquid-liquid critical point (LLCP) or a triple point. For example, liquid polyamorphism, via the existence of two alternative supramolecular structures, may explain the remarkable anomalies in the thermodynamic properties of supercooled water, namely a maximum in the temperature dependence of its density and its isothermal compressibility [35, 36], a maximum in the isobaric heat capacity [37], and an inflection point in its surface tension [38, 39, 40, 41]. Simulations of water-like models [27, 29, 30, 42, 43, 44, 28, 32, 45], potentially supported by experiment [46, 47], have demonstrated the hypothesized LLPT in supercooled water. For instance, TIP4P/2005, a rigid model for water introduced by Abascal and Vega in 2005 [48], is arguably one of the most realistic interaction potentials for water [49]. It exhibits the same thermodynamic anomalies as real water, and it predicts more anomalies in the metastable regions of the phase diagram [42]. In particular, in the negative pressure region, TIP4P/2005 predictions compare well with experiments [50, 51, 35]. Recently, state-of-the-art simulations (with histogram reweighting and large-system scattering calculations) proved the existence of a LLCP in TIP4P/2005 water, consistent with the three-dimensional Ising universality class [45].
Liquid (or, more generally, fluid) polyamorphism ultimately originates from the complex interactions between molecules or supramolecular structures. However, it may be phenomenologically modeled through the reversible interconversion of two alternative molecular or supramolecular states [2, 52, 53]. The application of this “two-state” approach to the variety of polyamorphic substances could be a useful phenomenology, or it may reflect the true microscopic origin of fluid polyamorphism. Indeed, there are a few substances, such as hydrogen, sulfur, phosphorous, and carbon, where the existence of alternative liquid or dense-fluid states is explicitly induced by a reversible chemical reaction: dimerization in hydrogen [10, 54] or polymerization in sulfur, phosphorus, and carbon [12, 55].
The interconversion of two-states significantly affects both the thermodynamics and dynamics of fluid mixtures. In particular, fast molecular interconversion imposes an additional thermodynamic constraint, the chemical-reaction equilibrium condition, which reduces the number of thermodynamic degrees of freedom. In this case, the concentration of a binary mixture is no longer an independent variable, being a function of temperature and pressure. Consequently, a binary mixture with interconversion of species follows the Gibbs phase rule for a single-component substance. In the absence of interconversion, the binary mixture exhibits a critical point for each concentration. Collectively, these critical points make up a critical locus. The interconversion of species selects a single path through the planes of phase coexistence at fixed concentration, crossing the critical locus of the binary mixture at a unique point. Moreover, this path could cross the critical line, the line of triple points, or any other unique line on the phase diagram more than once. The resulting phase diagram can be viewed as the phase diagram of a polyamorphic single-component fluid with multiple fluid-fluid critical points.
Interestingly, a phenomenological meanfield model incorporating interconversion between two states was shown to be able to reproduce quantitatively thermodynamic properties of real [33] and TIP4P/2005 [32] water. A simpler model, based on the two-state approach, that is still capable of qualitatively describing the anomalies in the thermodynamic properties of supercooled water (and systems exhibiting similar anomalies) is the “blinking-checkers lattice model” [52, 56]. This is a compressible binary-lattice model, thermodynamically equivalent to the mixture of two lattice gases, in which “blue” (state 1) and “red” (state 2) species interact, while interconversion of species is implemented by allowing the particles to change their “color” by tuning the energy and/or entropy of interconversion. Previous lattice models were able to reproduce the anomalous behavior of water through complex interactions between particles [57, 58, 59], while the blinking-checkers model represents a minimalistic microscopic approach. Additionally, the blinking-checkers model may be phenomenologically applied to describe the structural interconversion of any two states, like that predicted for supercooled water.
Building on previous studies of the blinking-checkers model [52, 56], in this work, we account for critical fluctuations of concentration or density by conducting Monte Carlo (MC) simulations of the model. The rest of this manuscript is outlined as follows. In section 2, the application of the MC method to the blinking-checkers model is described. A method for calculating the pressure of a MC system is reported. In section 3, the behavior of the blinking-checkers model in the vicinity of the liquid-gas critical point (LGCP) and LLCP are investigated through the coexistence, isothermal compressibility (susceptibility), correlation length, and surface tension. It is demonstrated that both critical points belong to the three-dimensional Ising-model class of critical-point universality.
2 Monte Carlo Simulation Technique
MC simulations of the blinking-checkers model were performed on a simple cubic lattice with total sites and periodic boundary conditions. Simulations of coexistence were performed in a rectangular box with sides, , while all other simulations were performed in a cubic box with length . Systems of size to were investigated. Each lattice site, , may be in one of three possible states: (empty), (particle of type 1), and (particle of type 2). The number of empty sites, , is fixed, while the number of sites filled with particles of types 1 and 2 (given by and , respectively) are varied through an interconversion reaction. The number of sites in each state are related to the total number of sites as . The overall density and mole fractions are defined as in Ref. [52], as , , and .
We use a nearest-neighbor approximation, in which each lattice site has nearest neighbors, , belonging to the nearest neighborhood, , of site which may interact with site , such that the potential energy of site is given by
| (1) |
where is a symmetric matrix, such that . Interactions with an empty site, , are assumed to be zero. In this work, the case of , , and is considered.
2.1 Interconversion “Flipping” and Diffusion “Swapping” Steps
At each MC step, a diffusion “swapping” (Kawasaki) step [60] or an interconversion “flipping” (Glauber) step [61] is attempted (see details in Ref. [62]). For either step, the change in the free energy is computed as , where is the change in the total potential energy caused by the attempted swap or flip. The potential energy of the system is given by the application of Eq. (1) to all sites as
| (2) |
where is the internal energy associated with state, .
For any Kawasaki swap, the change in the entropy, , while for a Glauber flip , where is the internal entropy of the reaction, such that “” indicates when a state of this site changes from 1 to 2, while “” indicates the opposite scenario. In accordance with the Metropolis criterion [63], the new state is accepted with probability for , while for , the new state is always accepted. In this work, just as in Ref. [52], the case and is considered. With use of these parameters, simulation snapshots for this system at different temperatures and densities are presented in Fig. 1.
Calculations of pressure are generally challenging in MC simulations. In the main text of this work, we employ the Widom-insertion method, detailed in Section 2.2. We also considered a more contemporary method, which utilizes “ghost” lattice sites and is discussed in Appendix A.
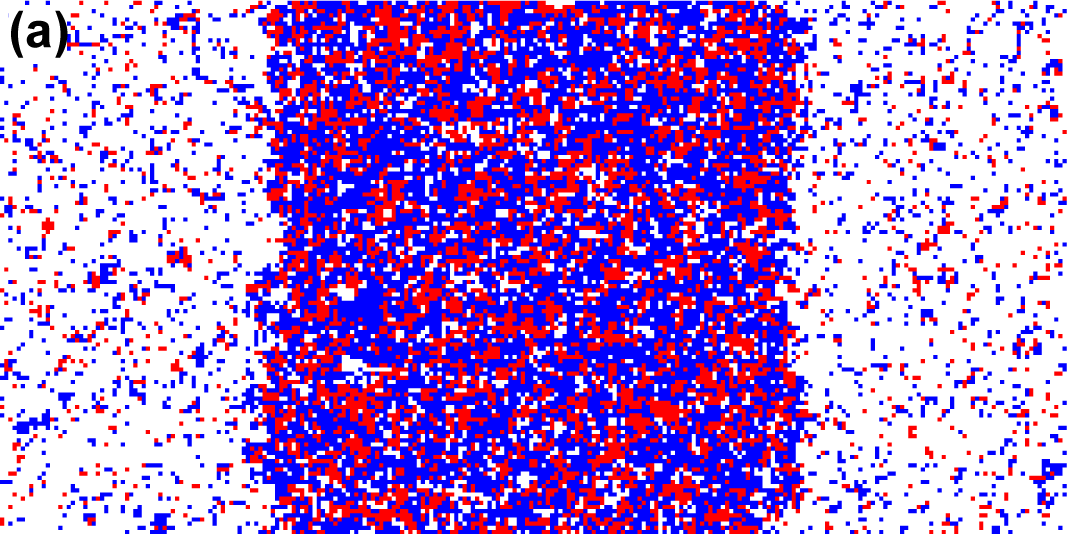
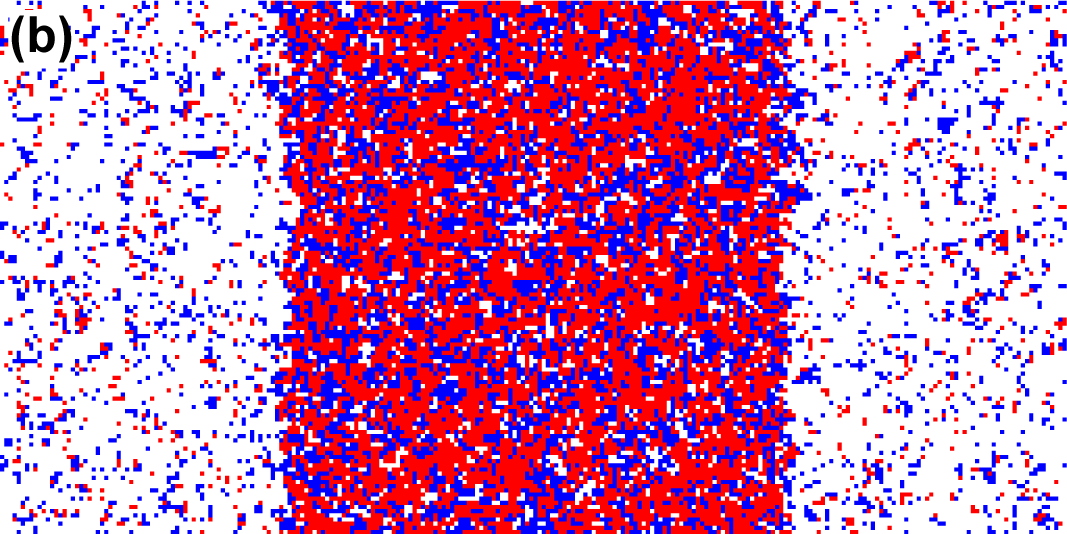
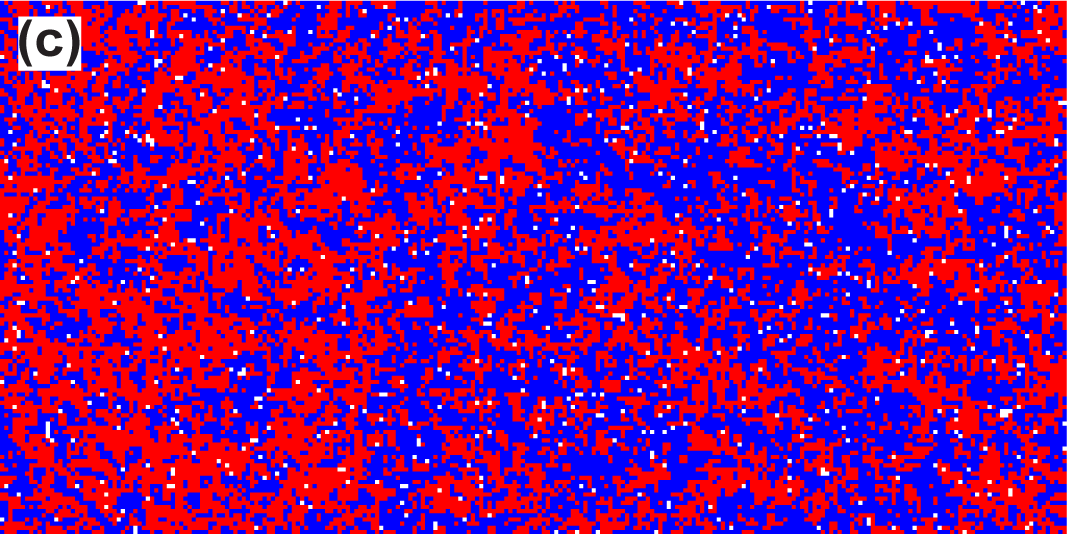
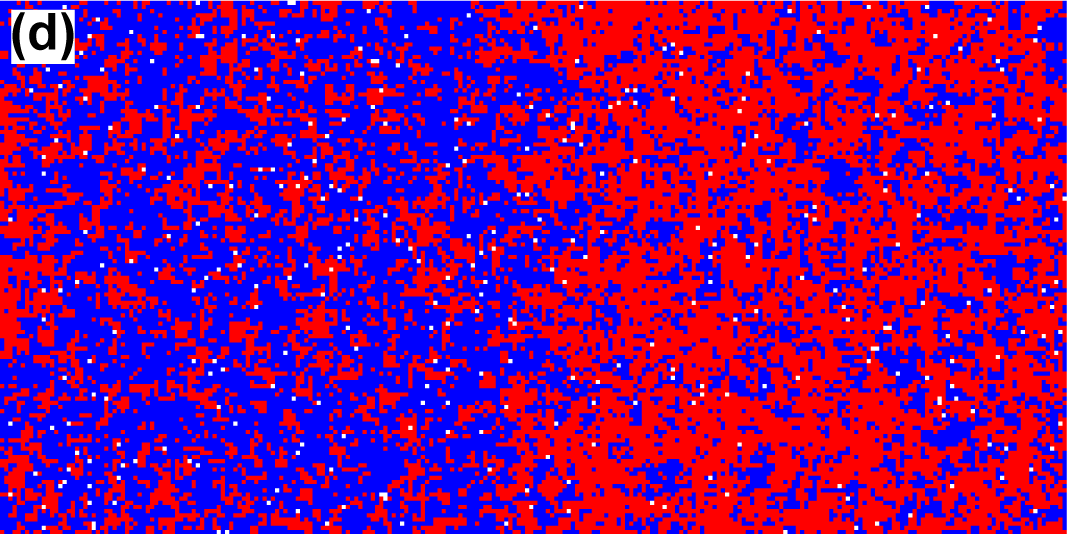
2.2 Widom-Insertion Method for Pressure Calculations
The traditional method for calculating the pressure in MC simulations is known as the “Widom-insertion” method [64]. In this work, this method is adjusted to apply to a system of several species. In the adjusted Widom-insertion method, the pressure is calculated by first attempting to insert a particle of type 1 in all sites one-by-one. If a site is occupied, the change in the potential energy due to insertion is , while if the cell is empty, . The insertion parameter for a particle of type 1, is given by
| (3) |
Analogously, is computed by the insertion of a particle of type 2. Note that for the case of a particle of type 2, there is no need to include the term with , as in Eq. (2), since this term is canceled in the final calculation of the pressure. The total excess chemical potential is defined as
| (4) |
and is averaged over time with an interval of one MC time unit ( MC steps) after the system reaches equilibrium. This calculation must be repeated for all densities from to the density of the system at a given state point with a sufficiently small step size, , at fixed and without interconversion, so that the mole fractions, and are fixed to the values obtained for the state point with interconversion. Finally, the pressure is obtained from the thermodynamic relation as
| (5) |
We note that the Widom-insertion method is a computationally expensive calculation. A contemporary (less expensive) calculation of the pressure is considered in Appendix A. However, since it was found that the increase in the computational efficiency of this alternative method came at a cost to its accuracy, all further calculations of pressure presented in the main text were performed with the Widom-insertion method.
3 Results and Discussion
In this work, the liquid-gas and liquid-liquid phase coexistence, isothermal compressibility, correlation length, and interfacial tension for a system of varying sizes with , , , , and was investigated. The following three subsections detail the results of the analysis of these properties.
3.1 Liquid-Gas and Liquid-Liquid Coexistence
| Thermodynamic property | Critical exponent | 3 Ising system | Meanfield value |
|---|---|---|---|
| Heat capacity | 0 | ||
| Order parameter | 0.5 | ||
| Susceptibility | 1 | ||
| Correlation length | 0.5 | ||
| Correlation function | 0 | ||
| Surface tension | 1.5 |
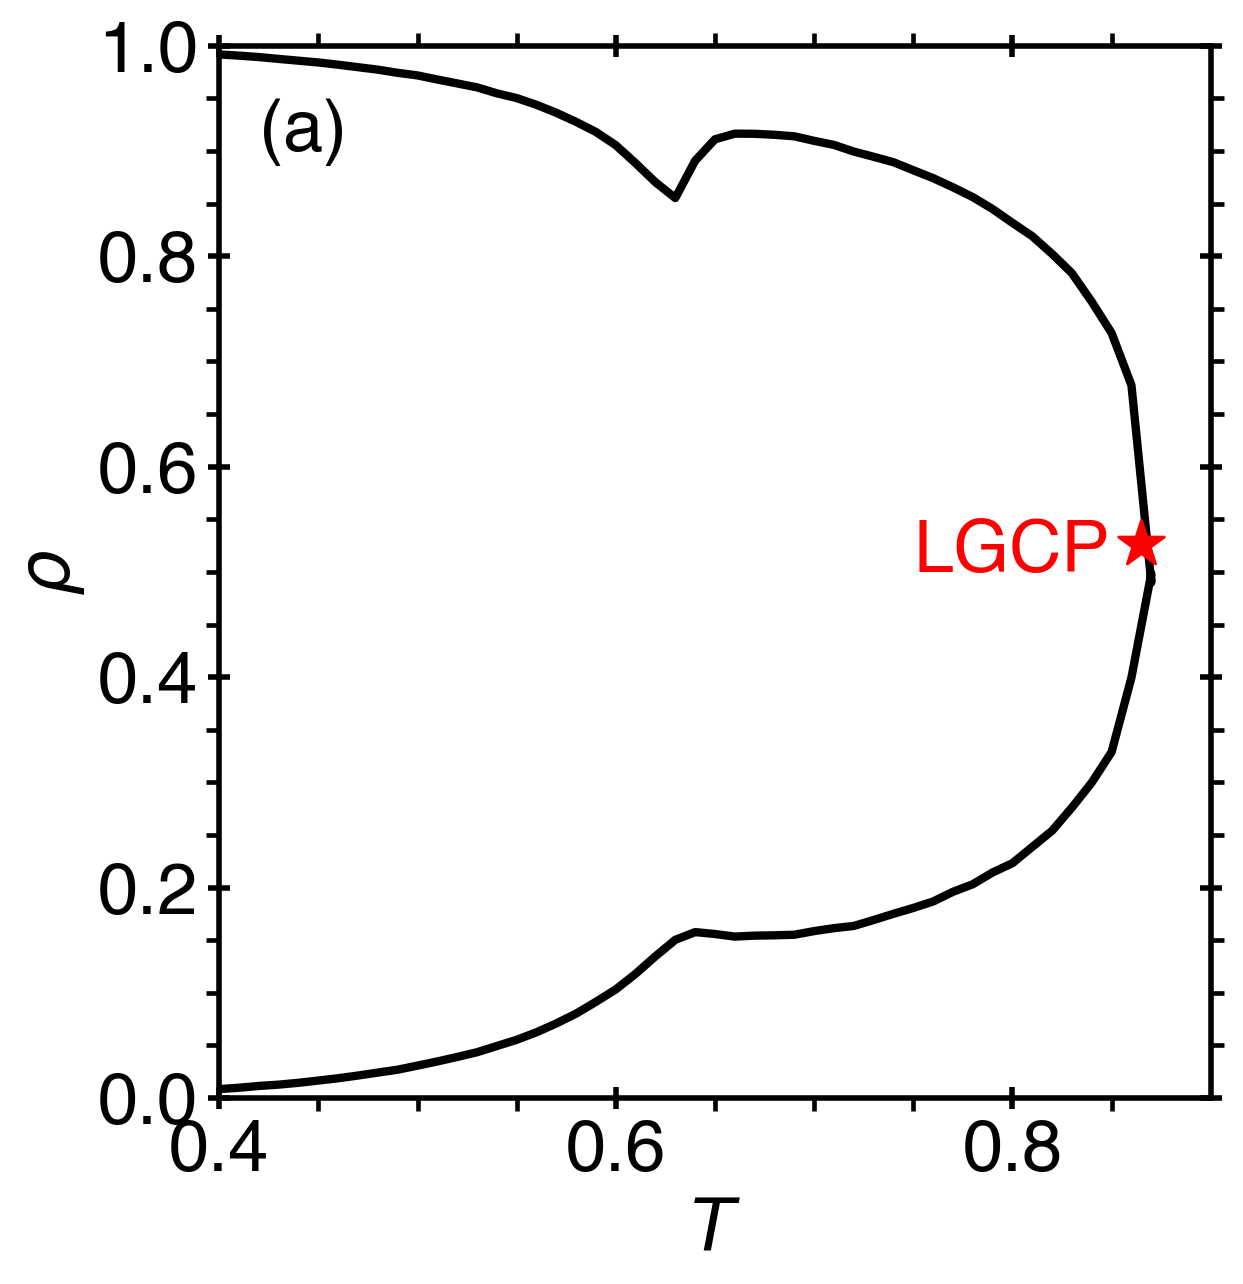
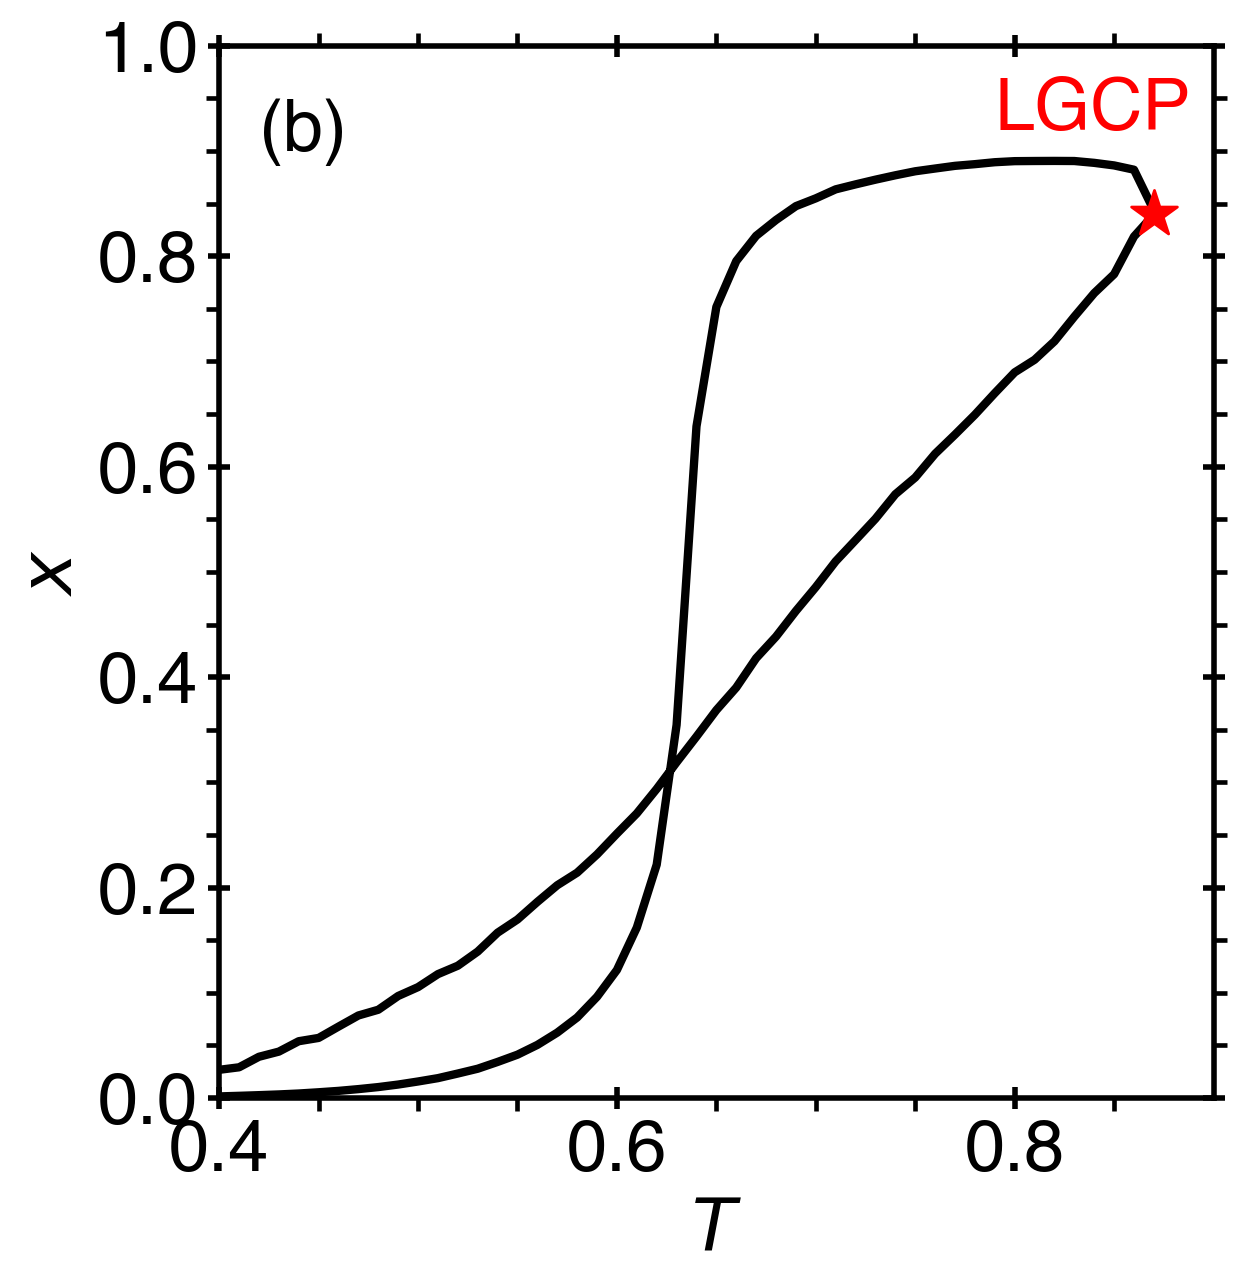
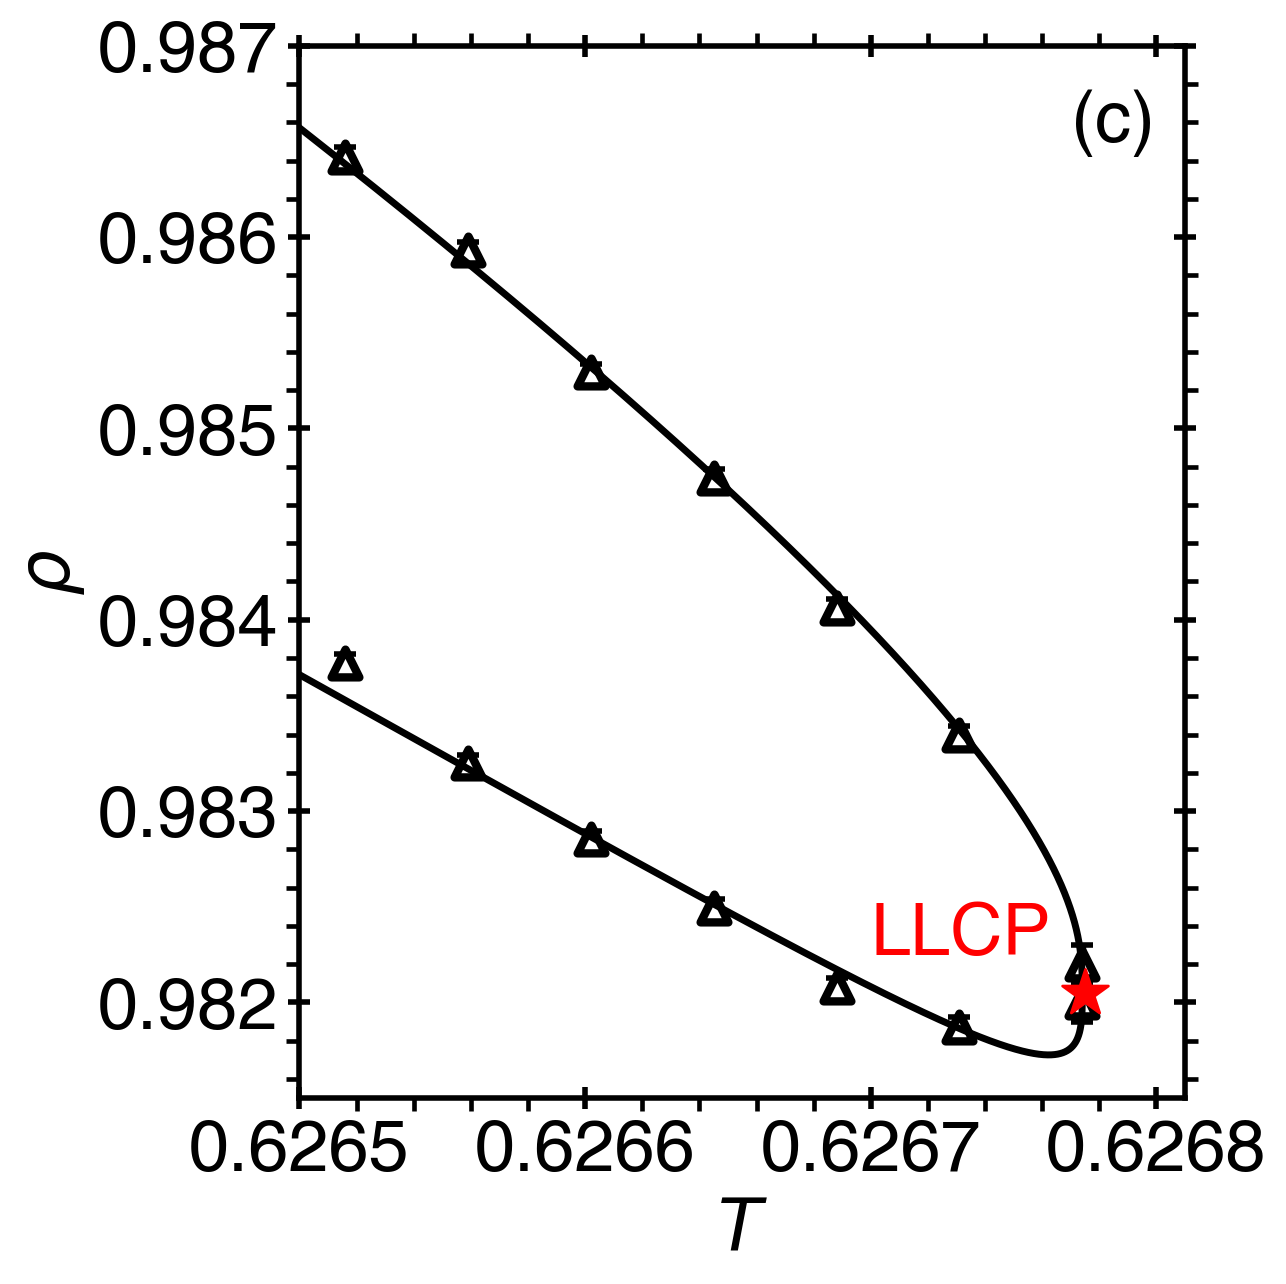
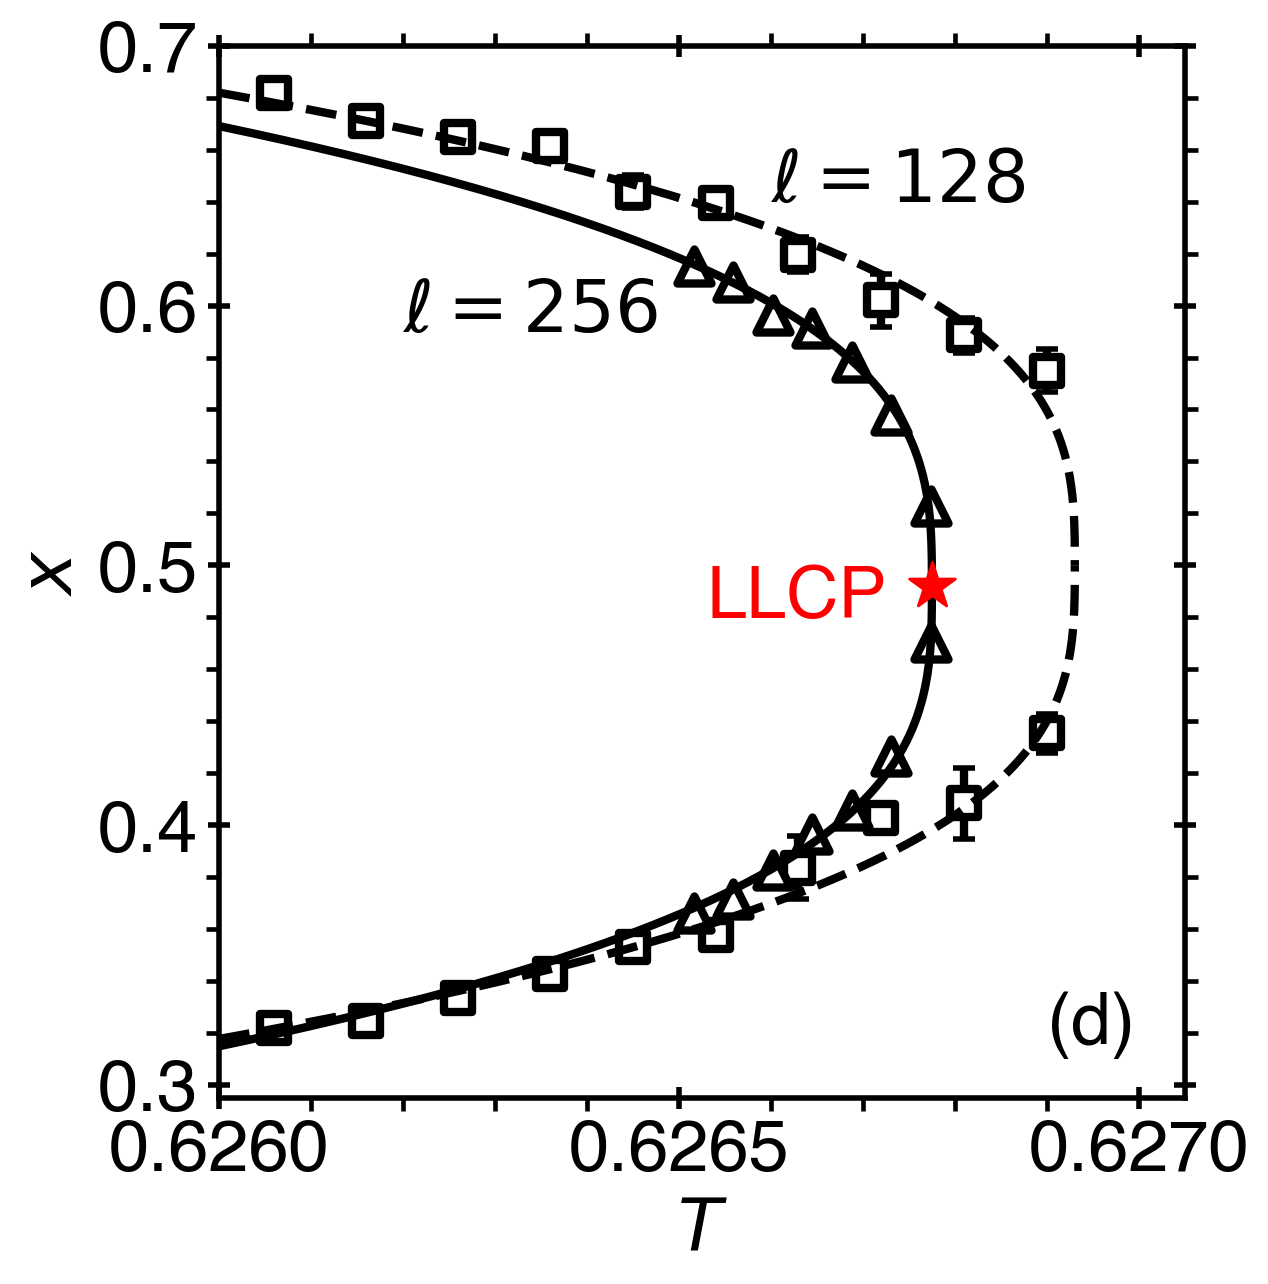
MC simulations of coexistence were obtained in a box with sides, . The liquid-gas (LG) and liquid-liquid (LL) coexistence curves are presented in Fig. 2. Away from the LGCP and LLCP, the results of the MC simulations are in agreement with the predictions of the meanfield theory [56]. As depicted in Fig. 2a, the LG coexistence exhibits a “bottleneck” in the vicinity of the LL critical temperature. This feature is characteristic of systems where polyamorphism is induced by interconversion, a result of the interaction between the thermodynamic path selected by interconversion and the critical line [33, 52, 56].
The scaling theory predicts that, in the vicinity of the critical point, the coexistence curve is described by an asymptotic power law of the form [65]
| (6) |
where is the order parameter for the phase transition, is the reduced distance to the critical temperature (), is the critical amplitude, is the critical exponent, and the symbol “” corresponds to each branch of the coexistence.
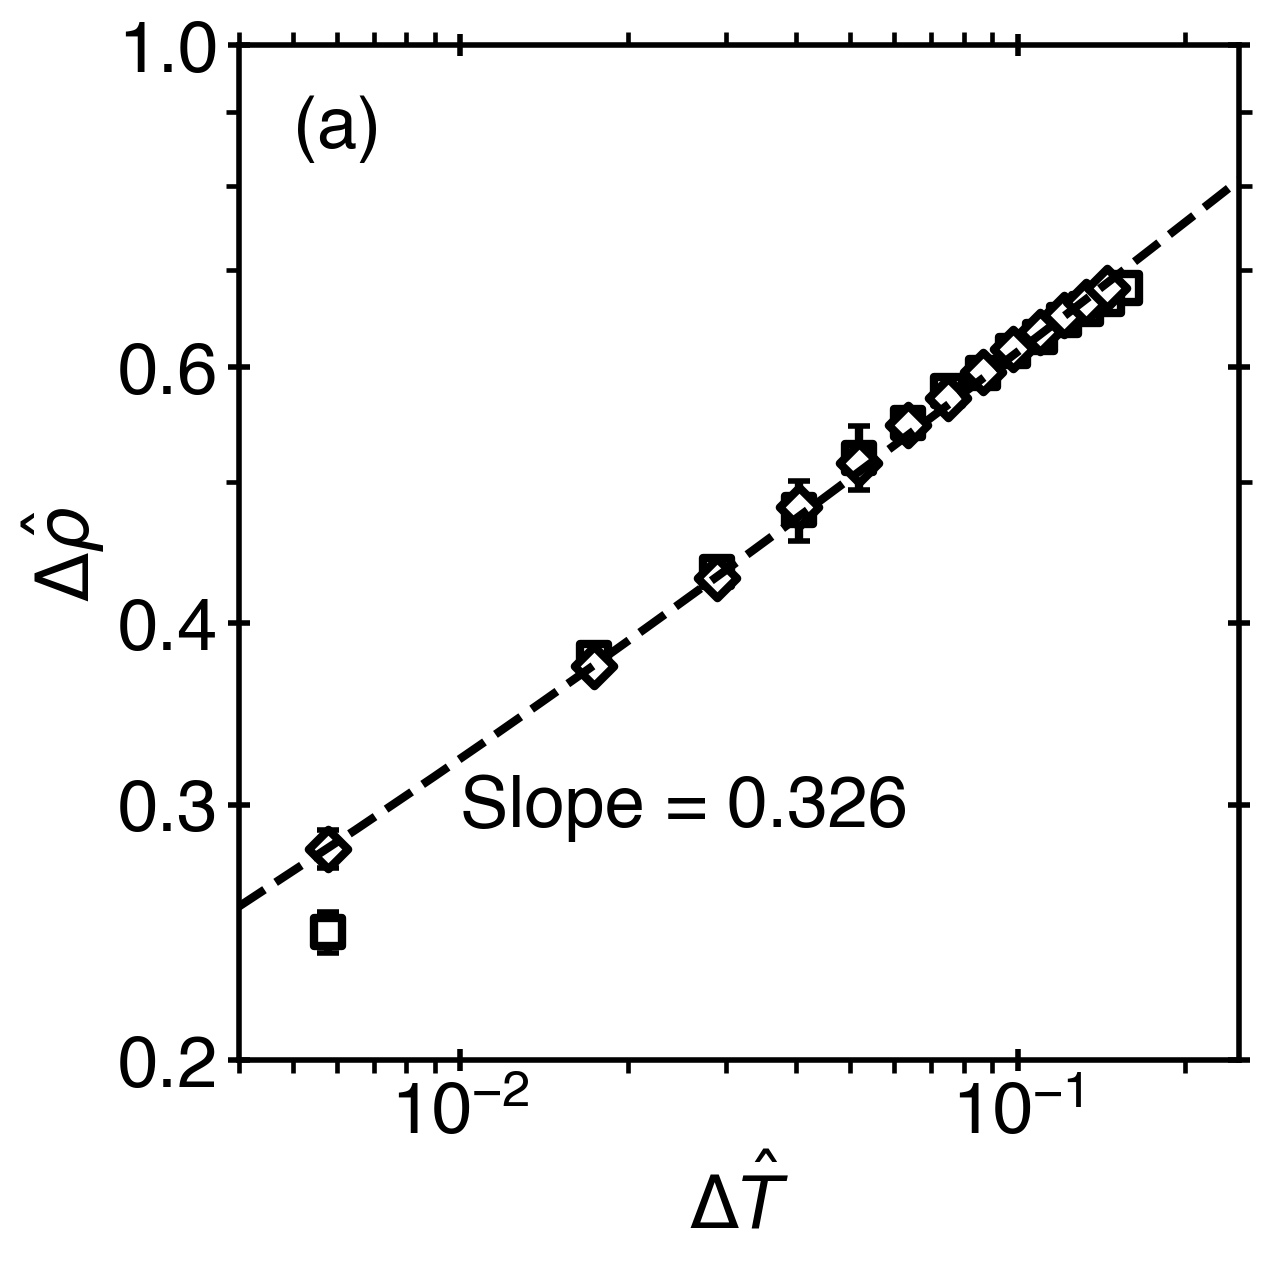
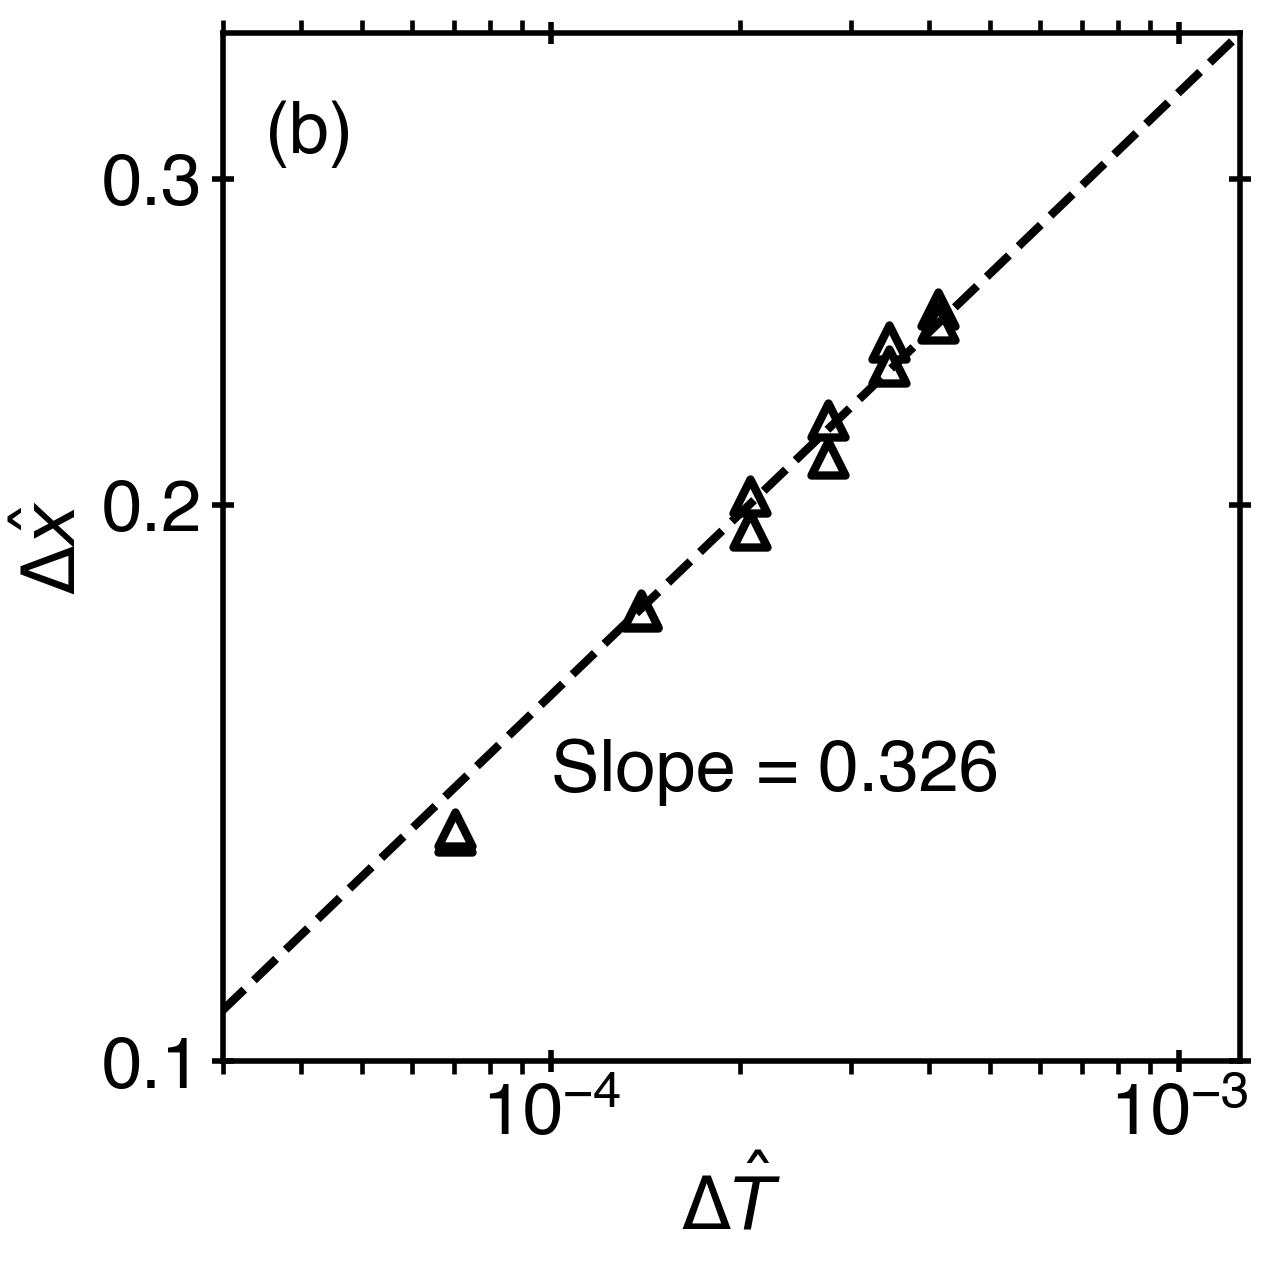
Like similar lattice models [62], this system is expected to be in the three-dimensional Ising model universality class; the critical exponents for which are presented in Table 1. For a binary mixture, in the vicinity of the LLCP, the order parameter is generally a nonlinear combination of the density and the molecular fraction [66]. For an almost incompressible binary mixture, asymptotically close to the critical point, the density and the molecular fraction may be uncoupled and described by power laws given by
| (7) | ||||
| (8) |
where and are the distances to the critical density, , and the critical molecular fraction, , respectively. From the fit of Eqs. (7) and (8) to the MC simulation data, presented in Fig. 2(c,d), the critical amplitudes of the density and the molecular fraction are obtained as, , , and . The ratio , where , , and are the reduced (by the corresponding critical parameters) pressure, temperature, and density, respectively, and the subscript “c” indicates that the derivative is to be evaluated at the critical point.
| Critical point | |||
|---|---|---|---|
| LGCP | 256 | 0.5290 | 0.8605 |
| LLCP | 64 | 0.9780 | 0.62683(1) |
| 128 | 0.9790 | 0.62681(1) | |
| 256 | 0.9810 | 0.62680(1) | |
| 0.9815 | 0.62679 |
Figure 3 illustrates the LG and LL coexistence in the vicinity of the critical point through the dominant contributions to the order parameter, the density and molecular fraction, respectively. The slope of the curve in the vicinity of the critical point confirms the prediction of scaling theory, [65] for both critical points. The error bars depicted in Fig. 3 were calculated by averaging over realizations. Note that the data point closest to the critical point is most affected by the finite-size of the system, producing the apparent deviation from the asymptotic power law.
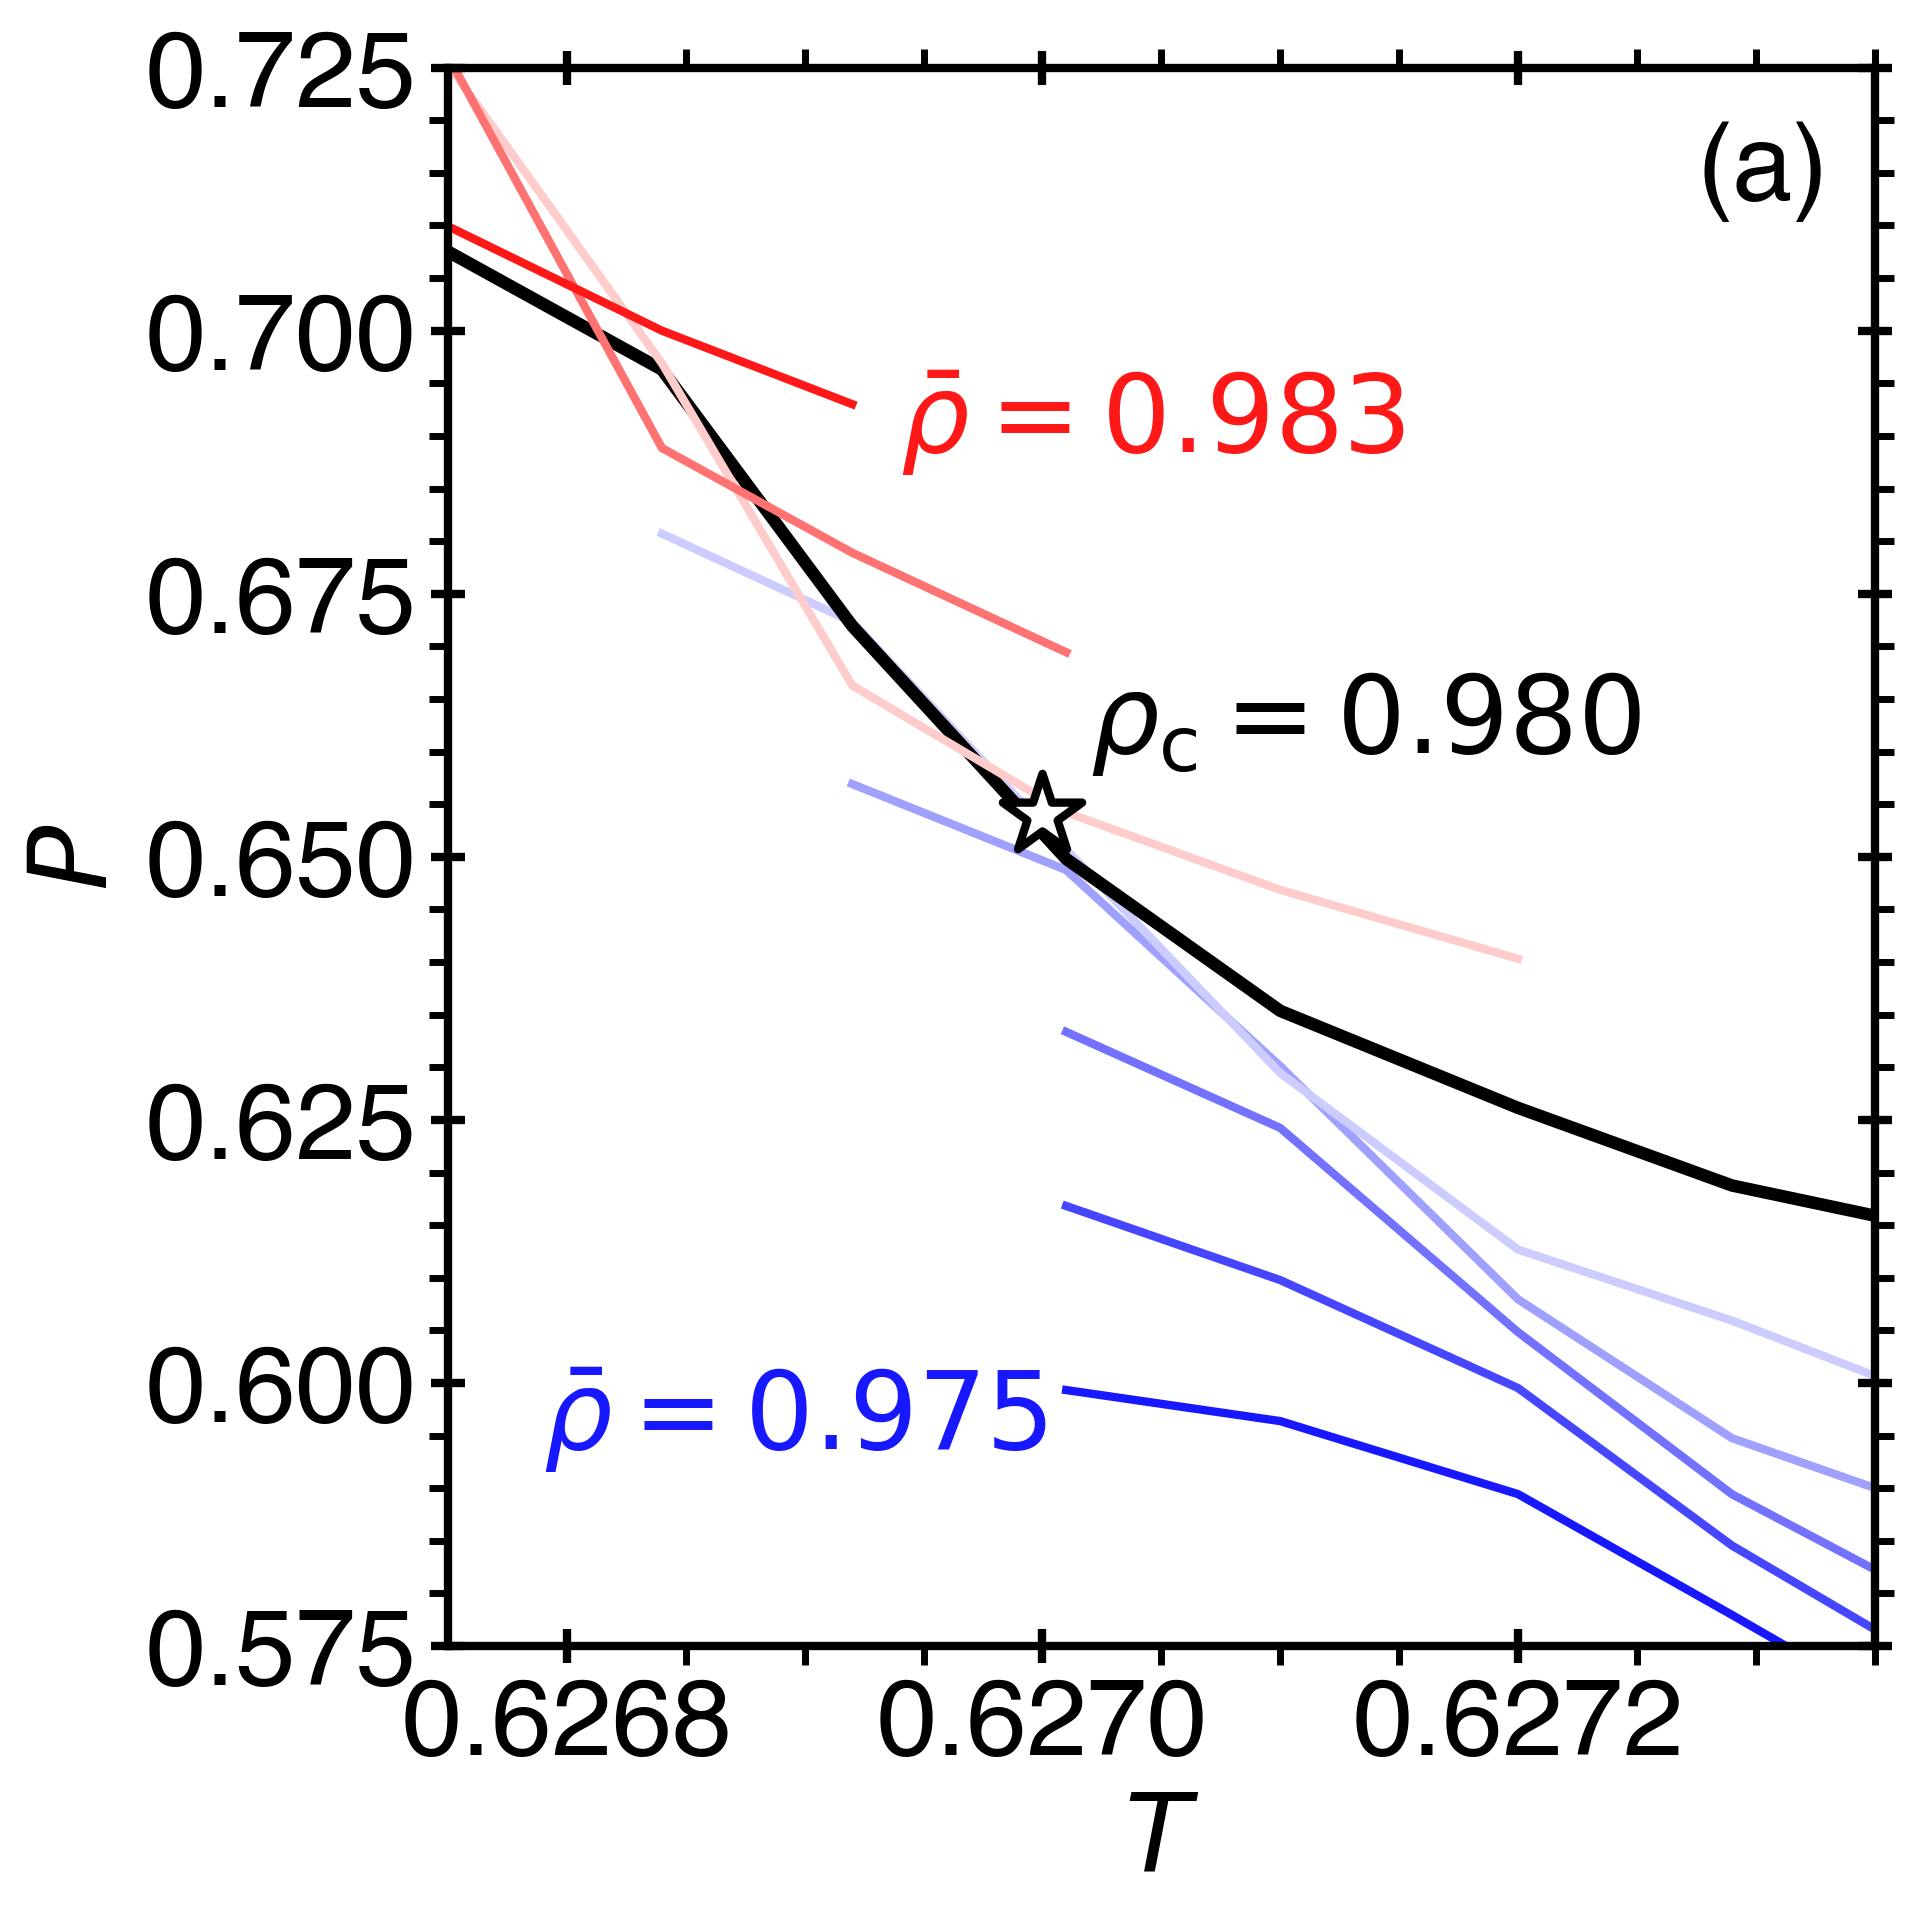
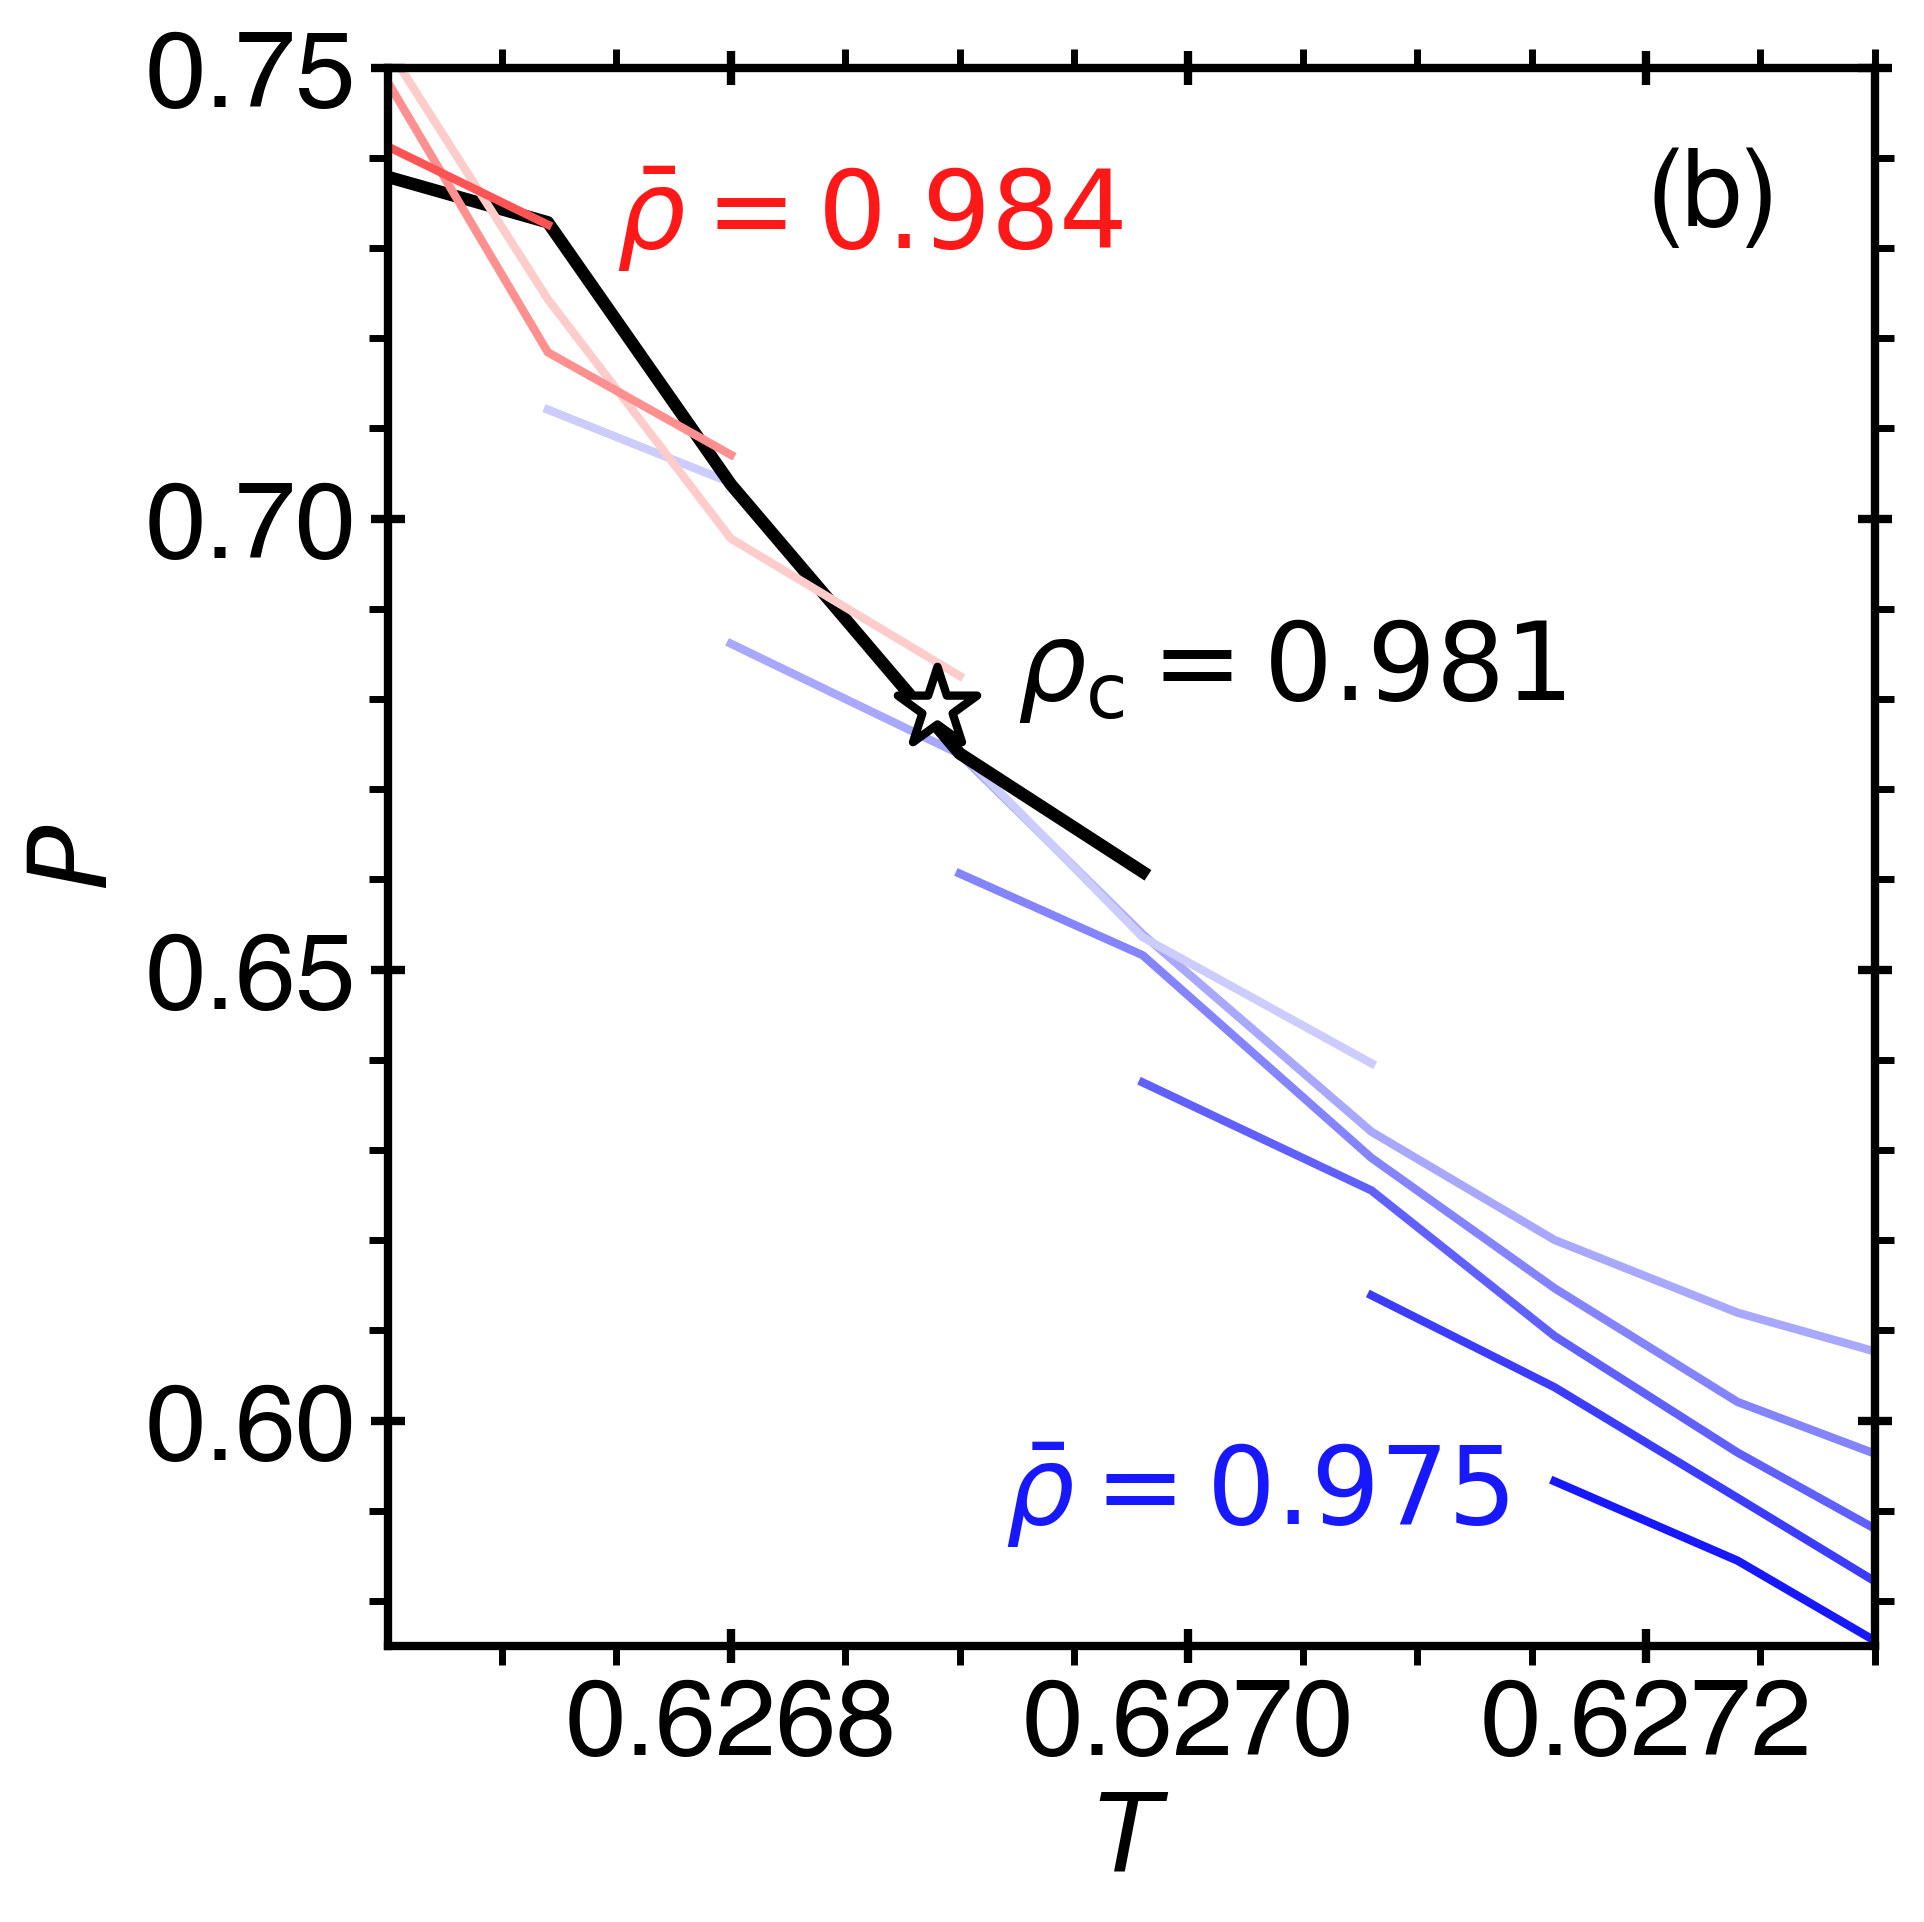
Pressure-temperature isochores in the vicinity of the LLCP, as depicted in Fig. 4, also yield an estimate for the location of the critical point. As mentioned in Section 2.2, the pressure calculations, based on the adjusted Widom-insertion method, are computationally expensive, and hence, they are only performed in the narrow region of the phase diagram close to the critical point for small system sizes: and . One can see that both systems near the critical point exhibit a negative with an order of magnitude of approximately , which is near the value , predicted from the ratio of the amplitudes and for a larger size (). Also, from Fig. 2d and Fig. 4, it is clear that the apparent critical temperature shifts towards lower values for increasing system sizes, which is consistent with the results obtained by the studies of the phase equilibrium. The location of the apparent (size-dependent) critical parameters for the systems investigated in this study are presented in Table 2.
3.2 Isothermal Compressibility and Correlation Length
The structure factor was calculated using the method described in Ref. [68] as
| (9) |
where is the discrete Fourier transform of the positions of particles of type (in which is the Kronecker symbol), q is a wave vector with components , in which , , and are integers between and for each coordinate direction, , respectively. The structure factor, , was averaged over radial bins of and over realizations.
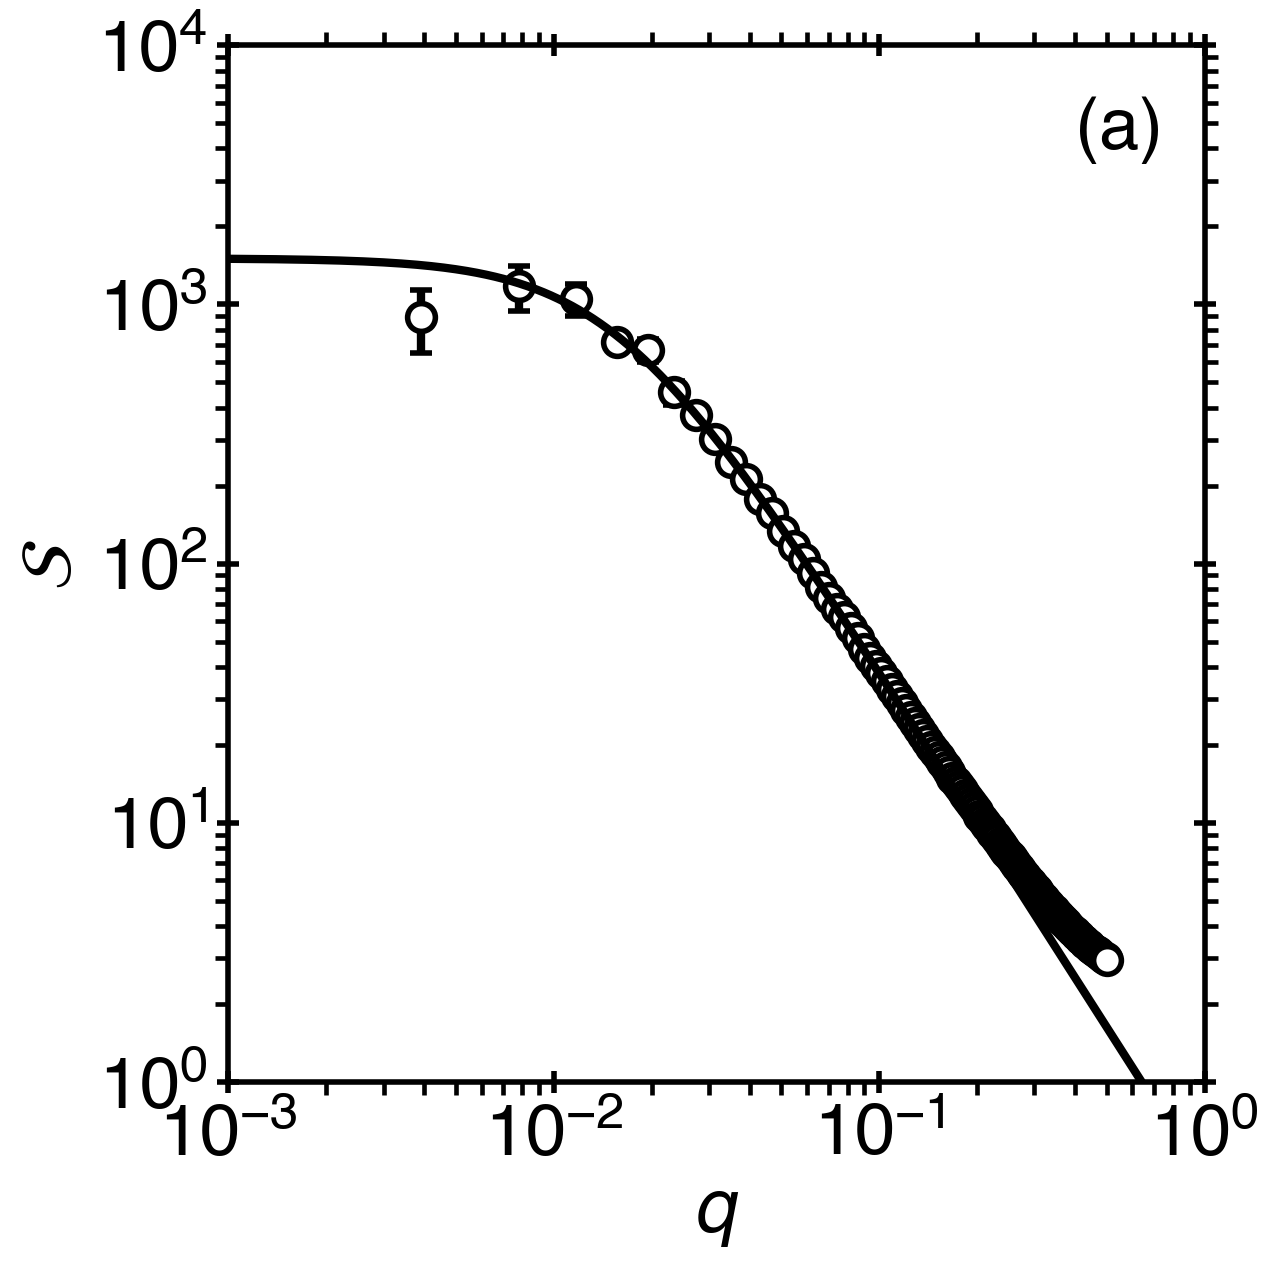
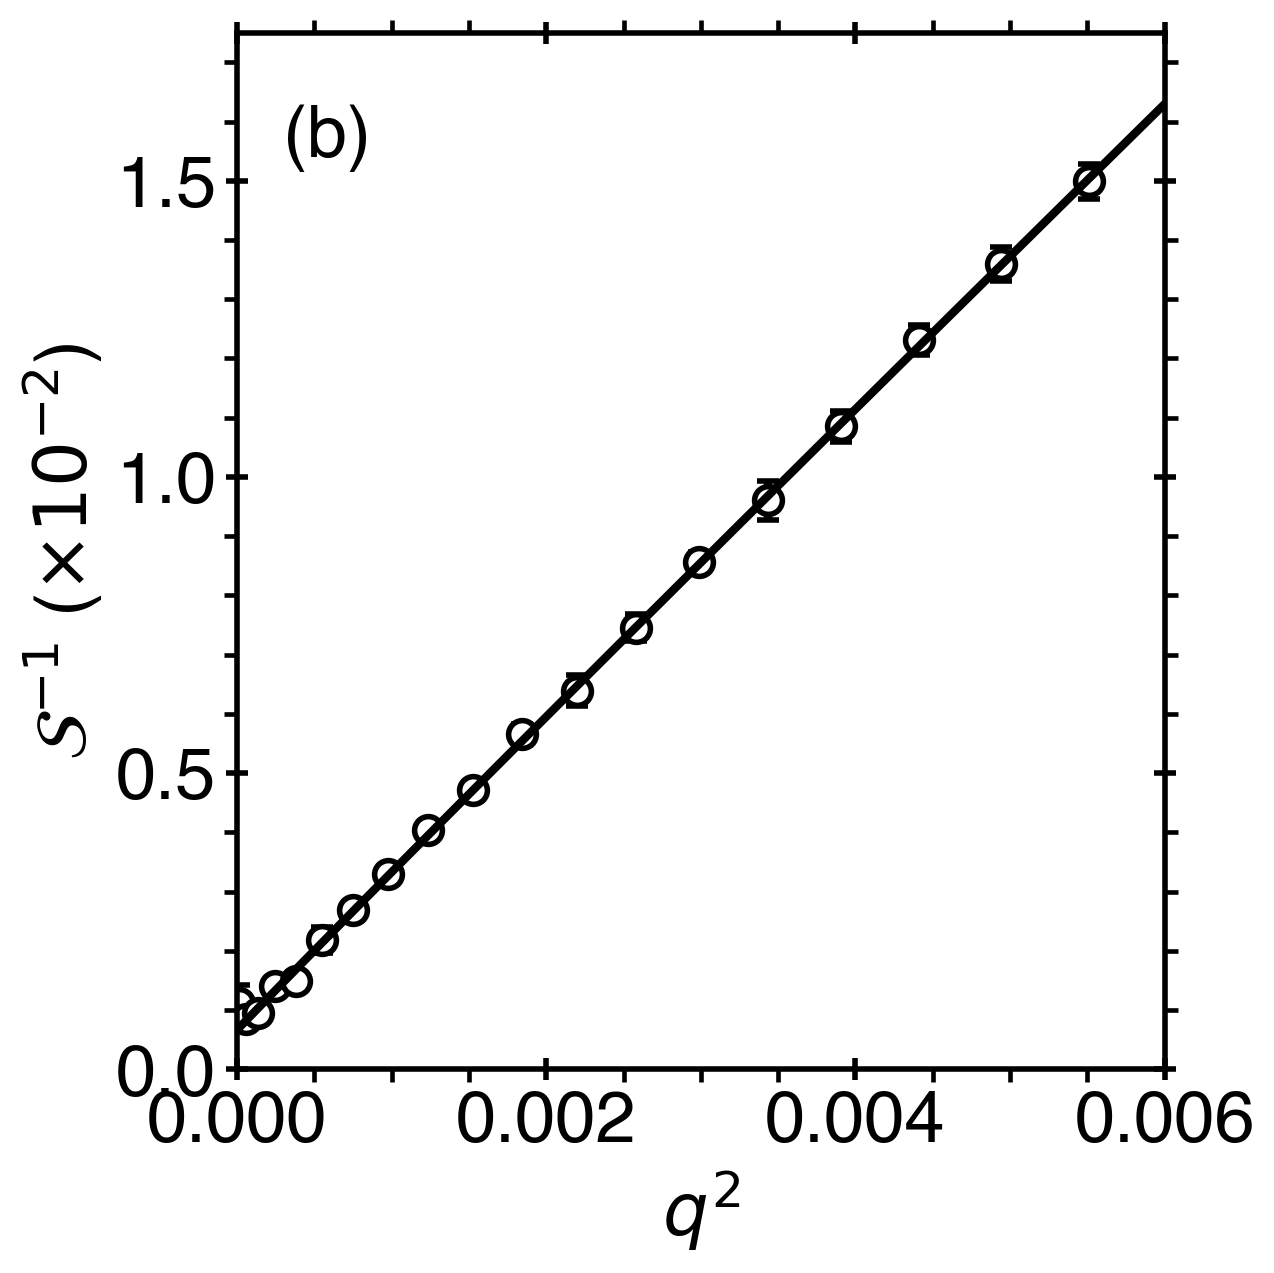
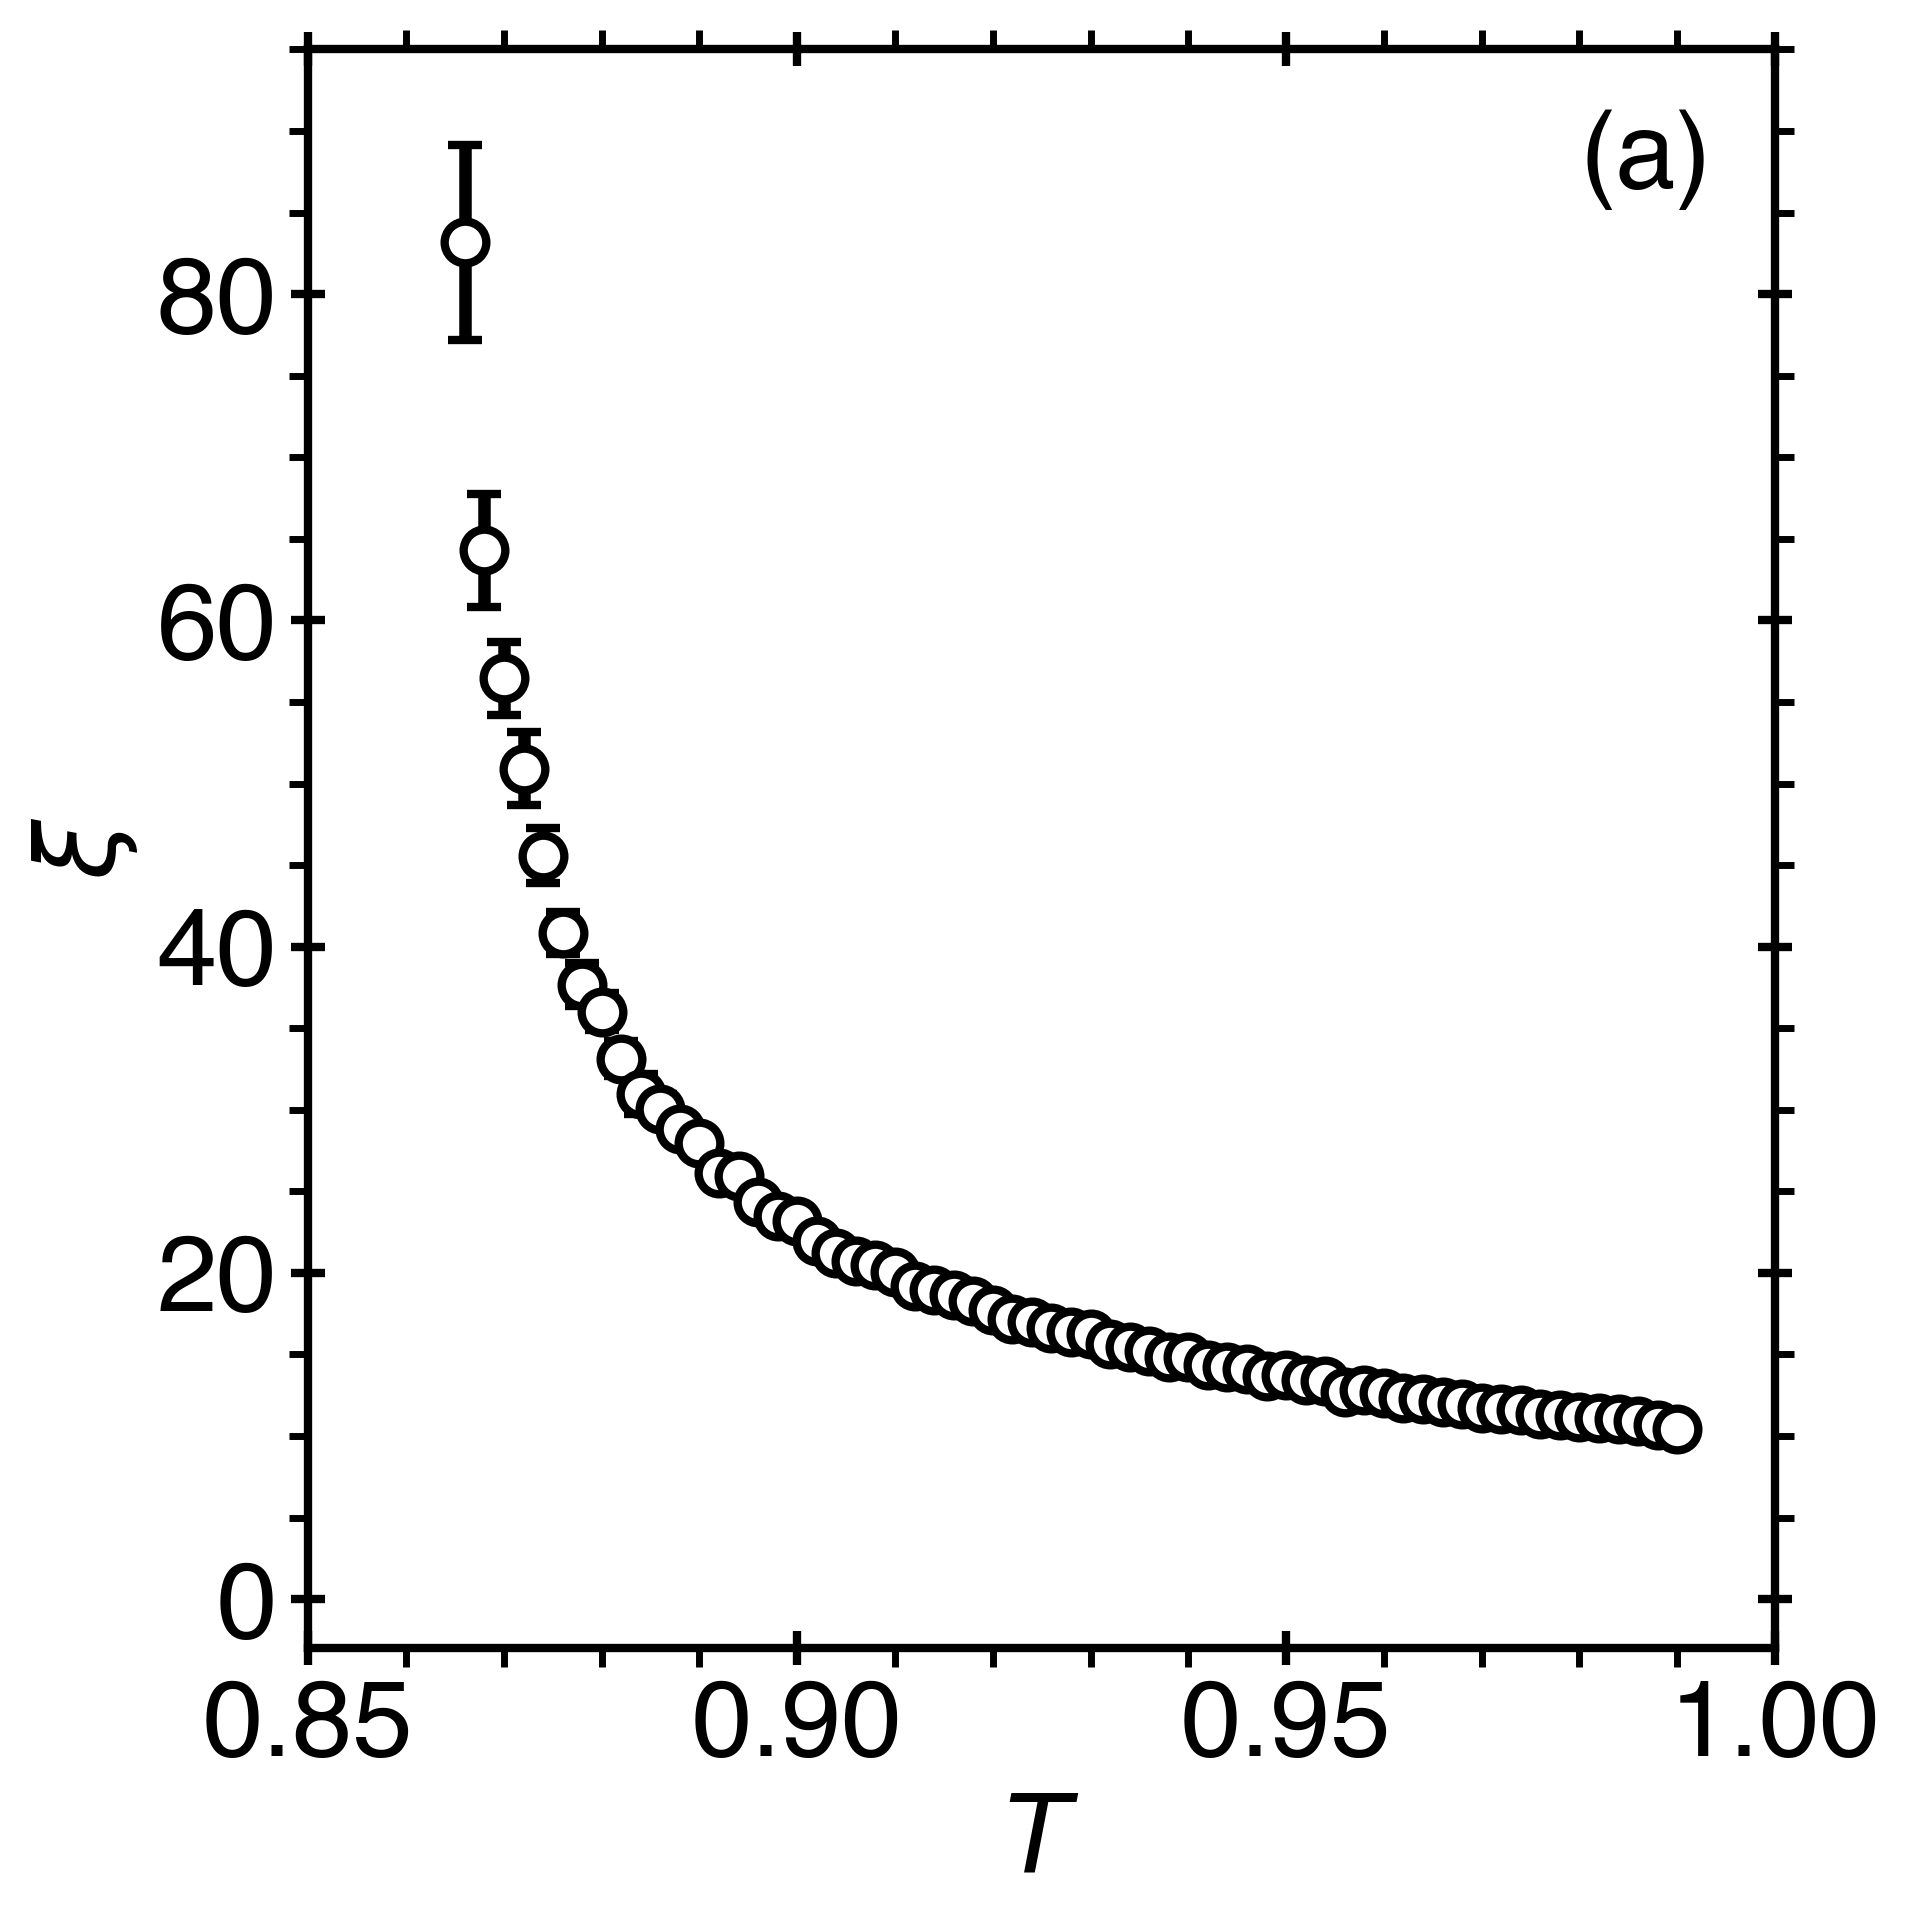
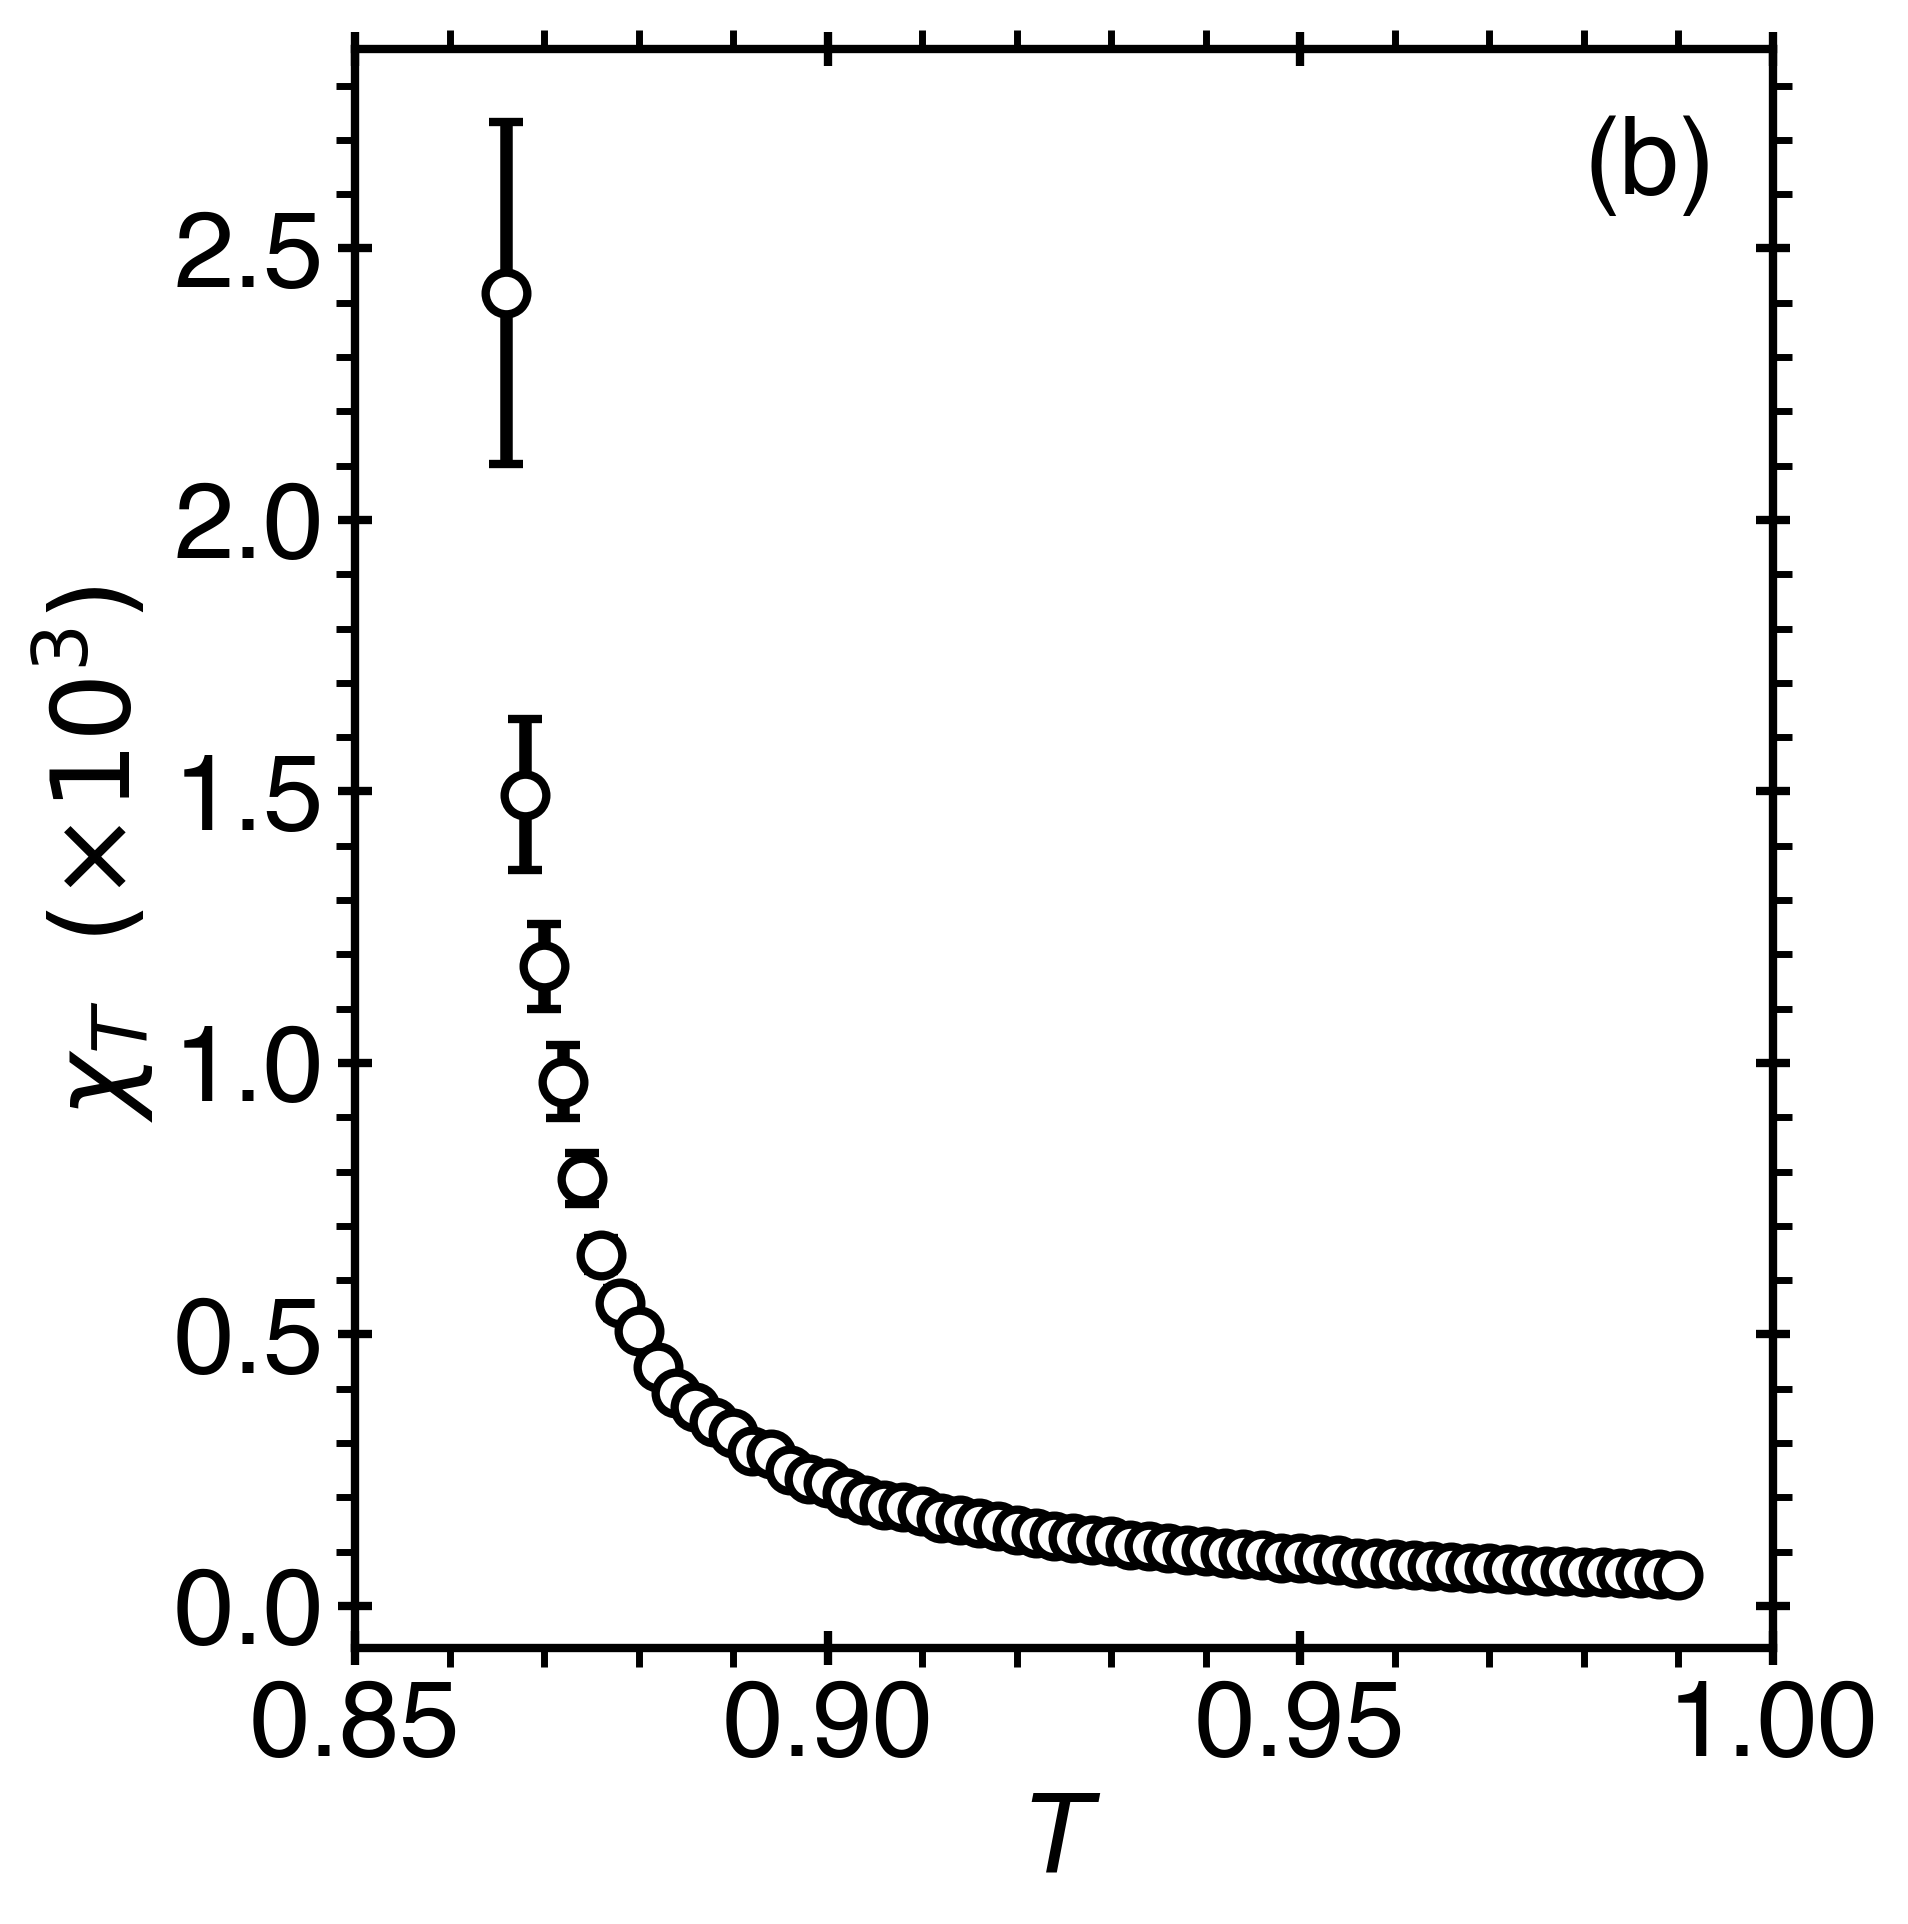
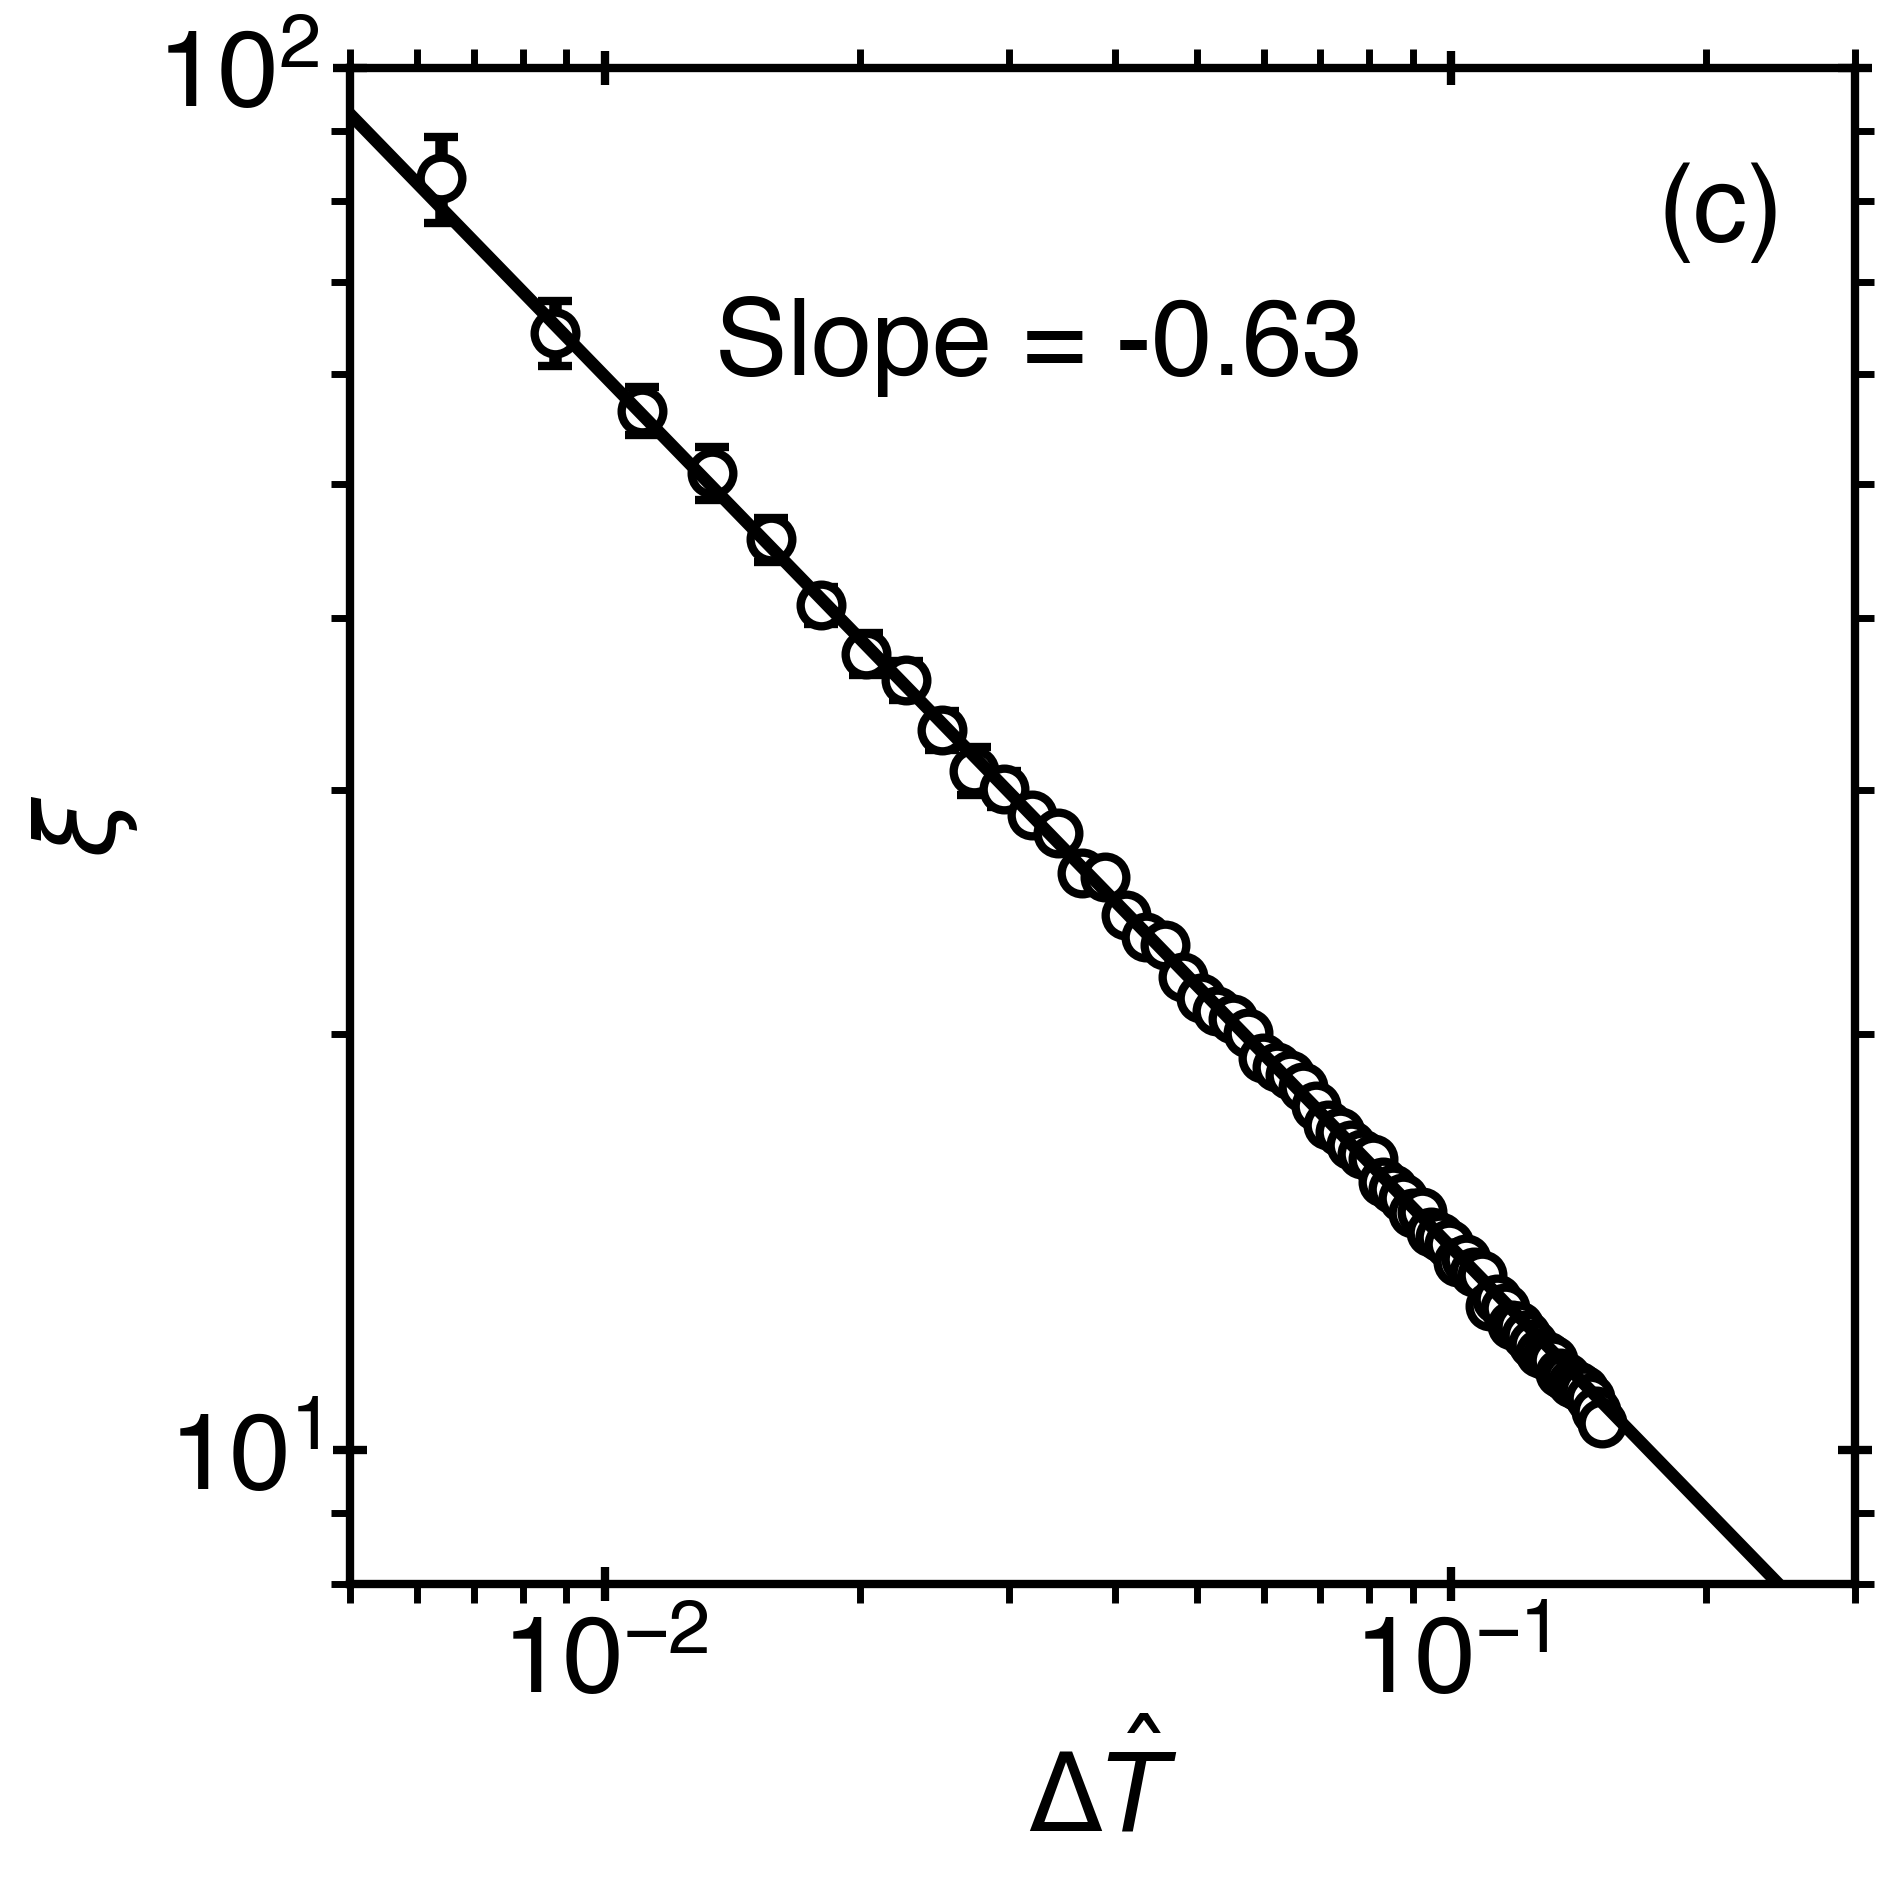
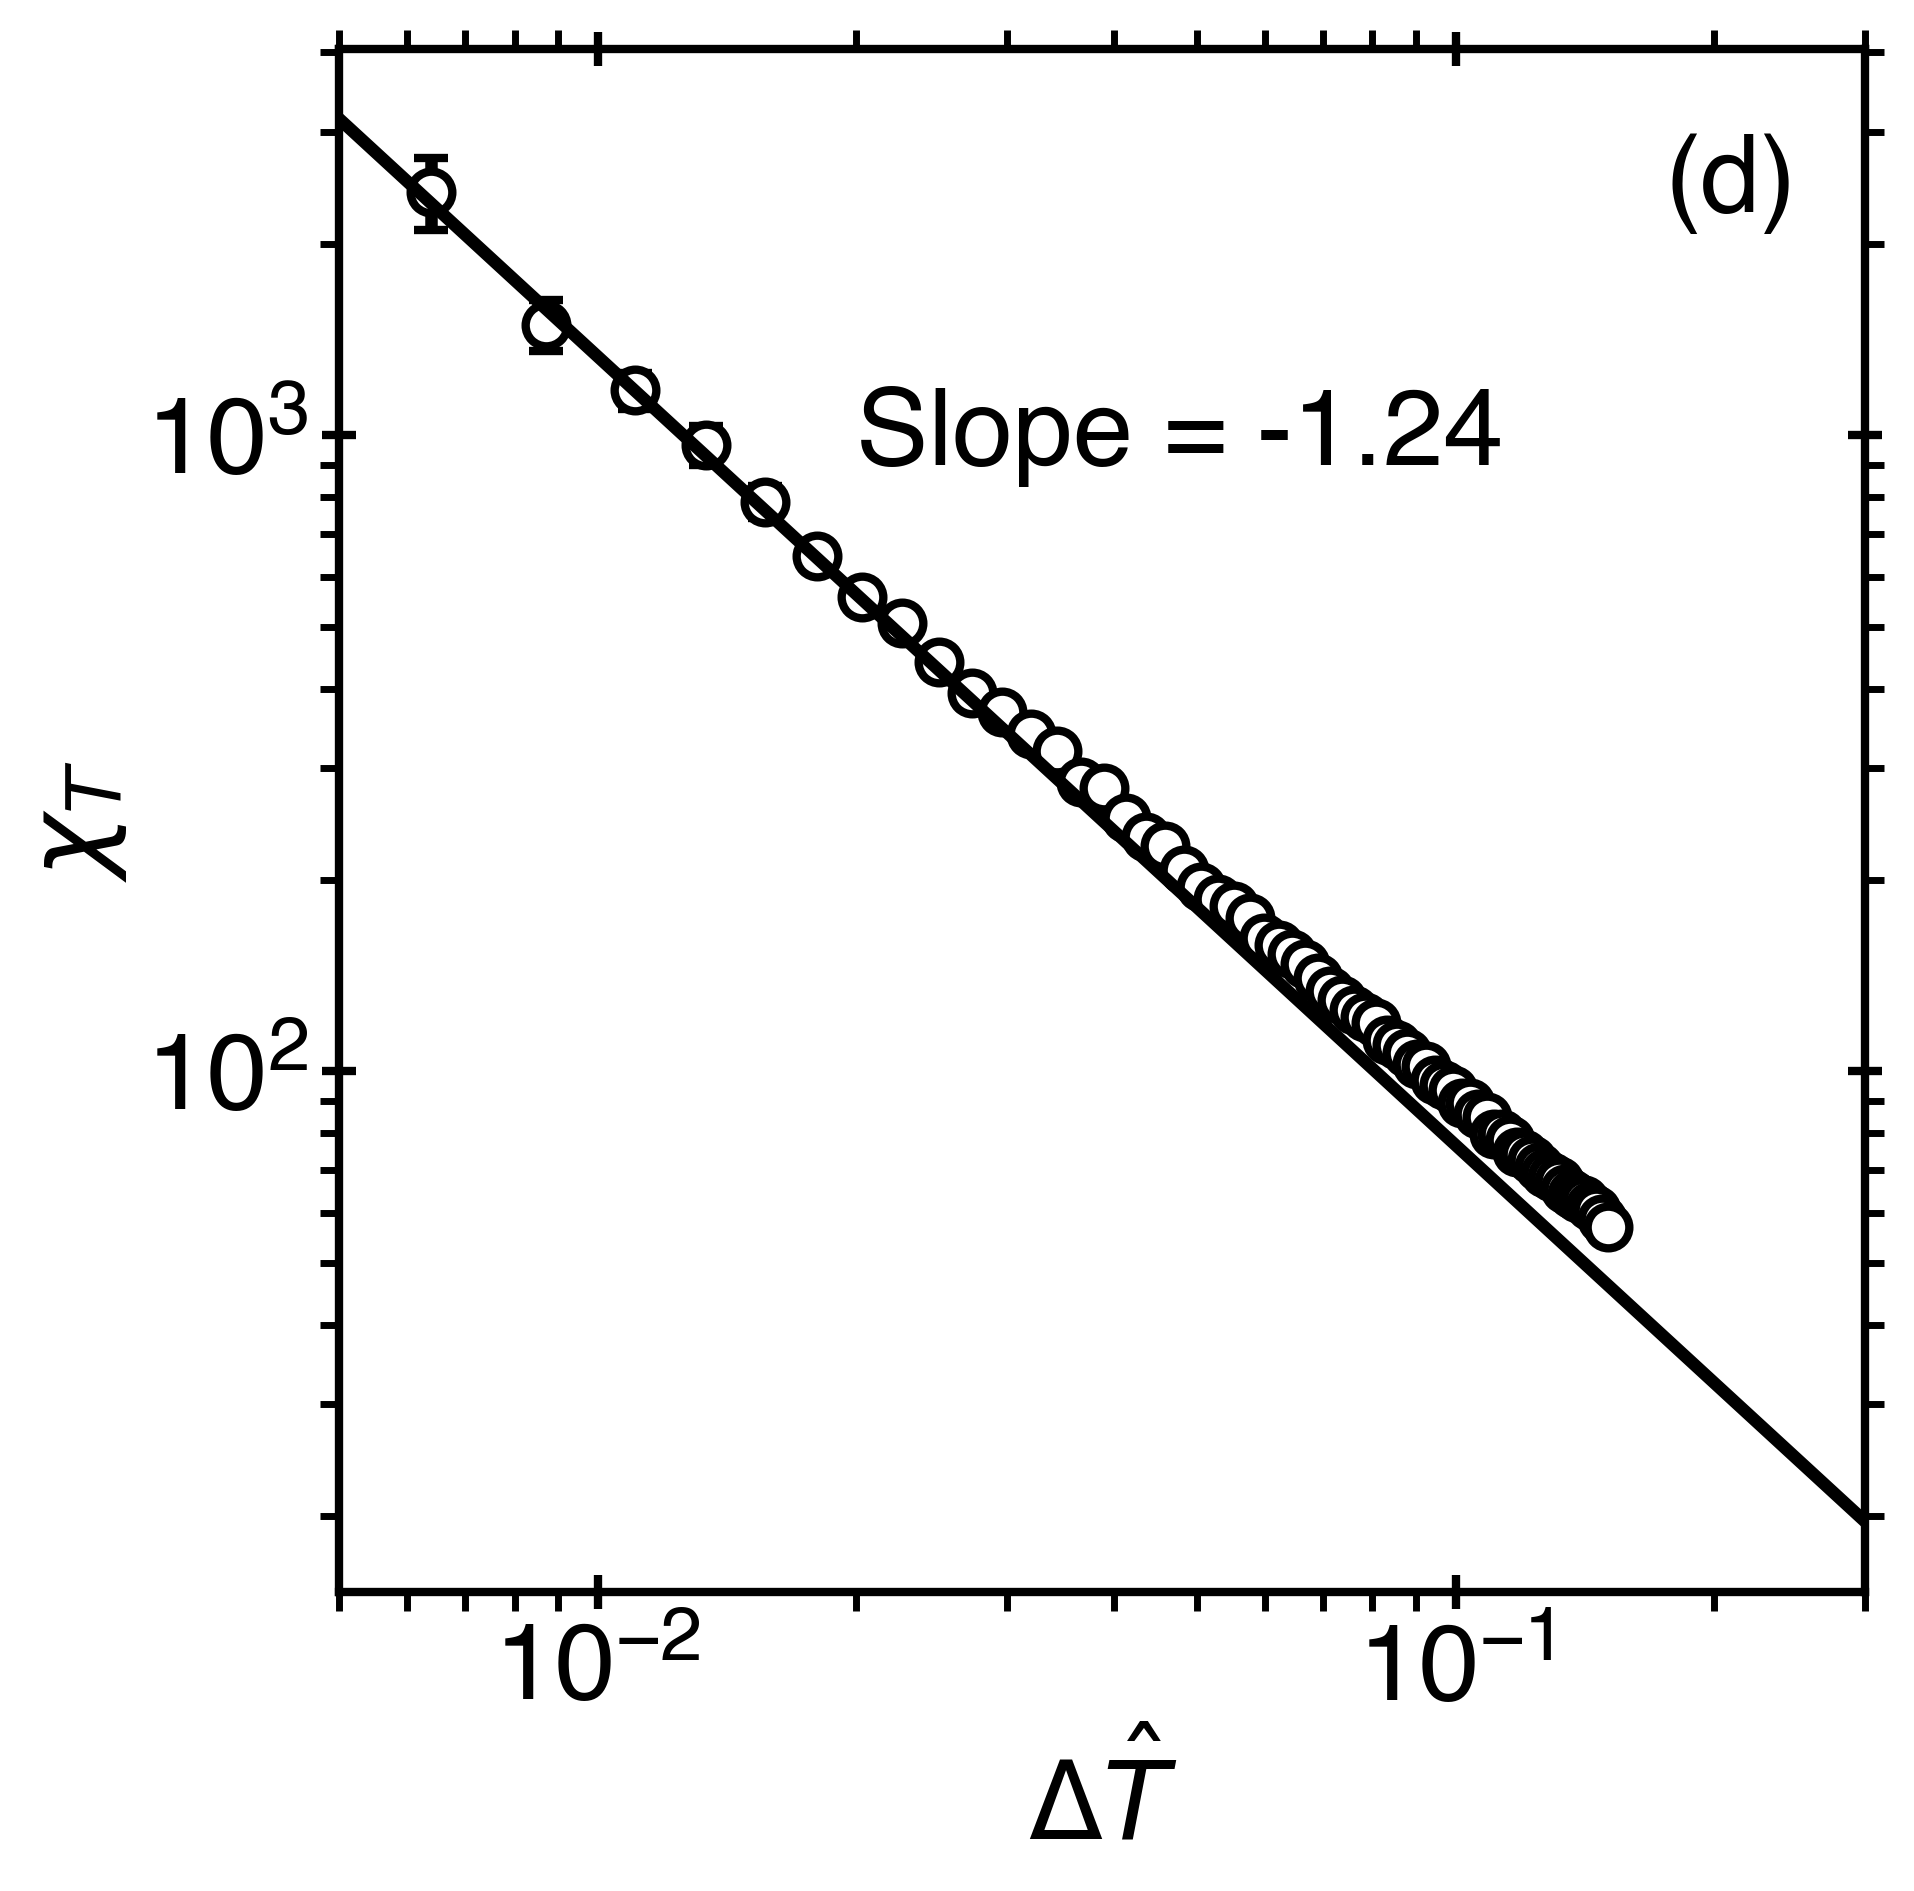
Figure 5 depicts the simulation results, performed in a cubic box of length , of the structure factor as a function of the wavenumber, , in the vicinity of the LGCP. The structure factor is related to the size-dependent isothermal compressibility (susceptibility), , multiplied by the correlation function, as [70],
| (10) |
where is the correlation length and is the size of the system. Typically, the Ornstein-Zernike approximation for the correlation function, is sufficient to describe the structure factor. However, in the vicinity of the critical point, when , the Ornstein-Zernike becomes insufficient as . A simplified version of the Fisher-Burford approximation [71] that satisfies this scaling requirement can be expressed as
| (11) |
The fit of the structure factor to Eq. (10), with use of the simplified Fisher-Burford approximation, is illustrated by the black curves on Fig. 5(a,b).
From the structure factor, the size-dependent susceptibility and the correlation length of order parameter fluctuations may be determined. Scaling theory predicts that the size-independent correlation length and susceptibility (for an infinite-sized system), asymptotically close to the critical point, follow power laws of the form
| (12) | ||||
| (13) |
where and are the critical amplitudes of the correlation length and susceptibility, respectively, while and are the corresponding critical exponents (see Table 1). Note that these two properties are related as since .
However, as the susceptibility is strongly dependent on the size of the system, finite-size effects cause deviations as when , while when . A form of the susceptibility that satisfies these limits is given by
| (14) |
where the finite-size scaling function can be approximated as
| (15) |
In the thermodynamic limit , such that and the susceptibility is given by Eq. (13). In the finite-size limit , such that , hence the susceptibility is given by . The critical amplitudes for the systems studied are given in Table 3. In conceptual agreement with the finite-size scaling theory, the amplitudes, within their error bars, are independent of the system size.
With use of Eq. (10) for the structure factor, the correlation length and the size-dependent susceptibility may be extracted from the structure factor data. Results of this process in the vicinity of the LGCP are presented in Fig. 6. The susceptibility and correlation length follow asymptotic scaling laws typical of the three-dimensional Ising-like universality class as illustrated in Fig. 6(c,d). Note that, for the large system of size of , since the simulation data are relatively far from the LGCP, the effect of finite-size is not observed in Fig. 6d. Instead, one may notice that the susceptibility deviates from the asymptotic scaling power law away from the critical point, which occurs since this region () is associated with the crossover to the meanfield behavior. This observation is consistent with other MC simulations of the three-dimensional Ising model with a short range of interactions () [69].
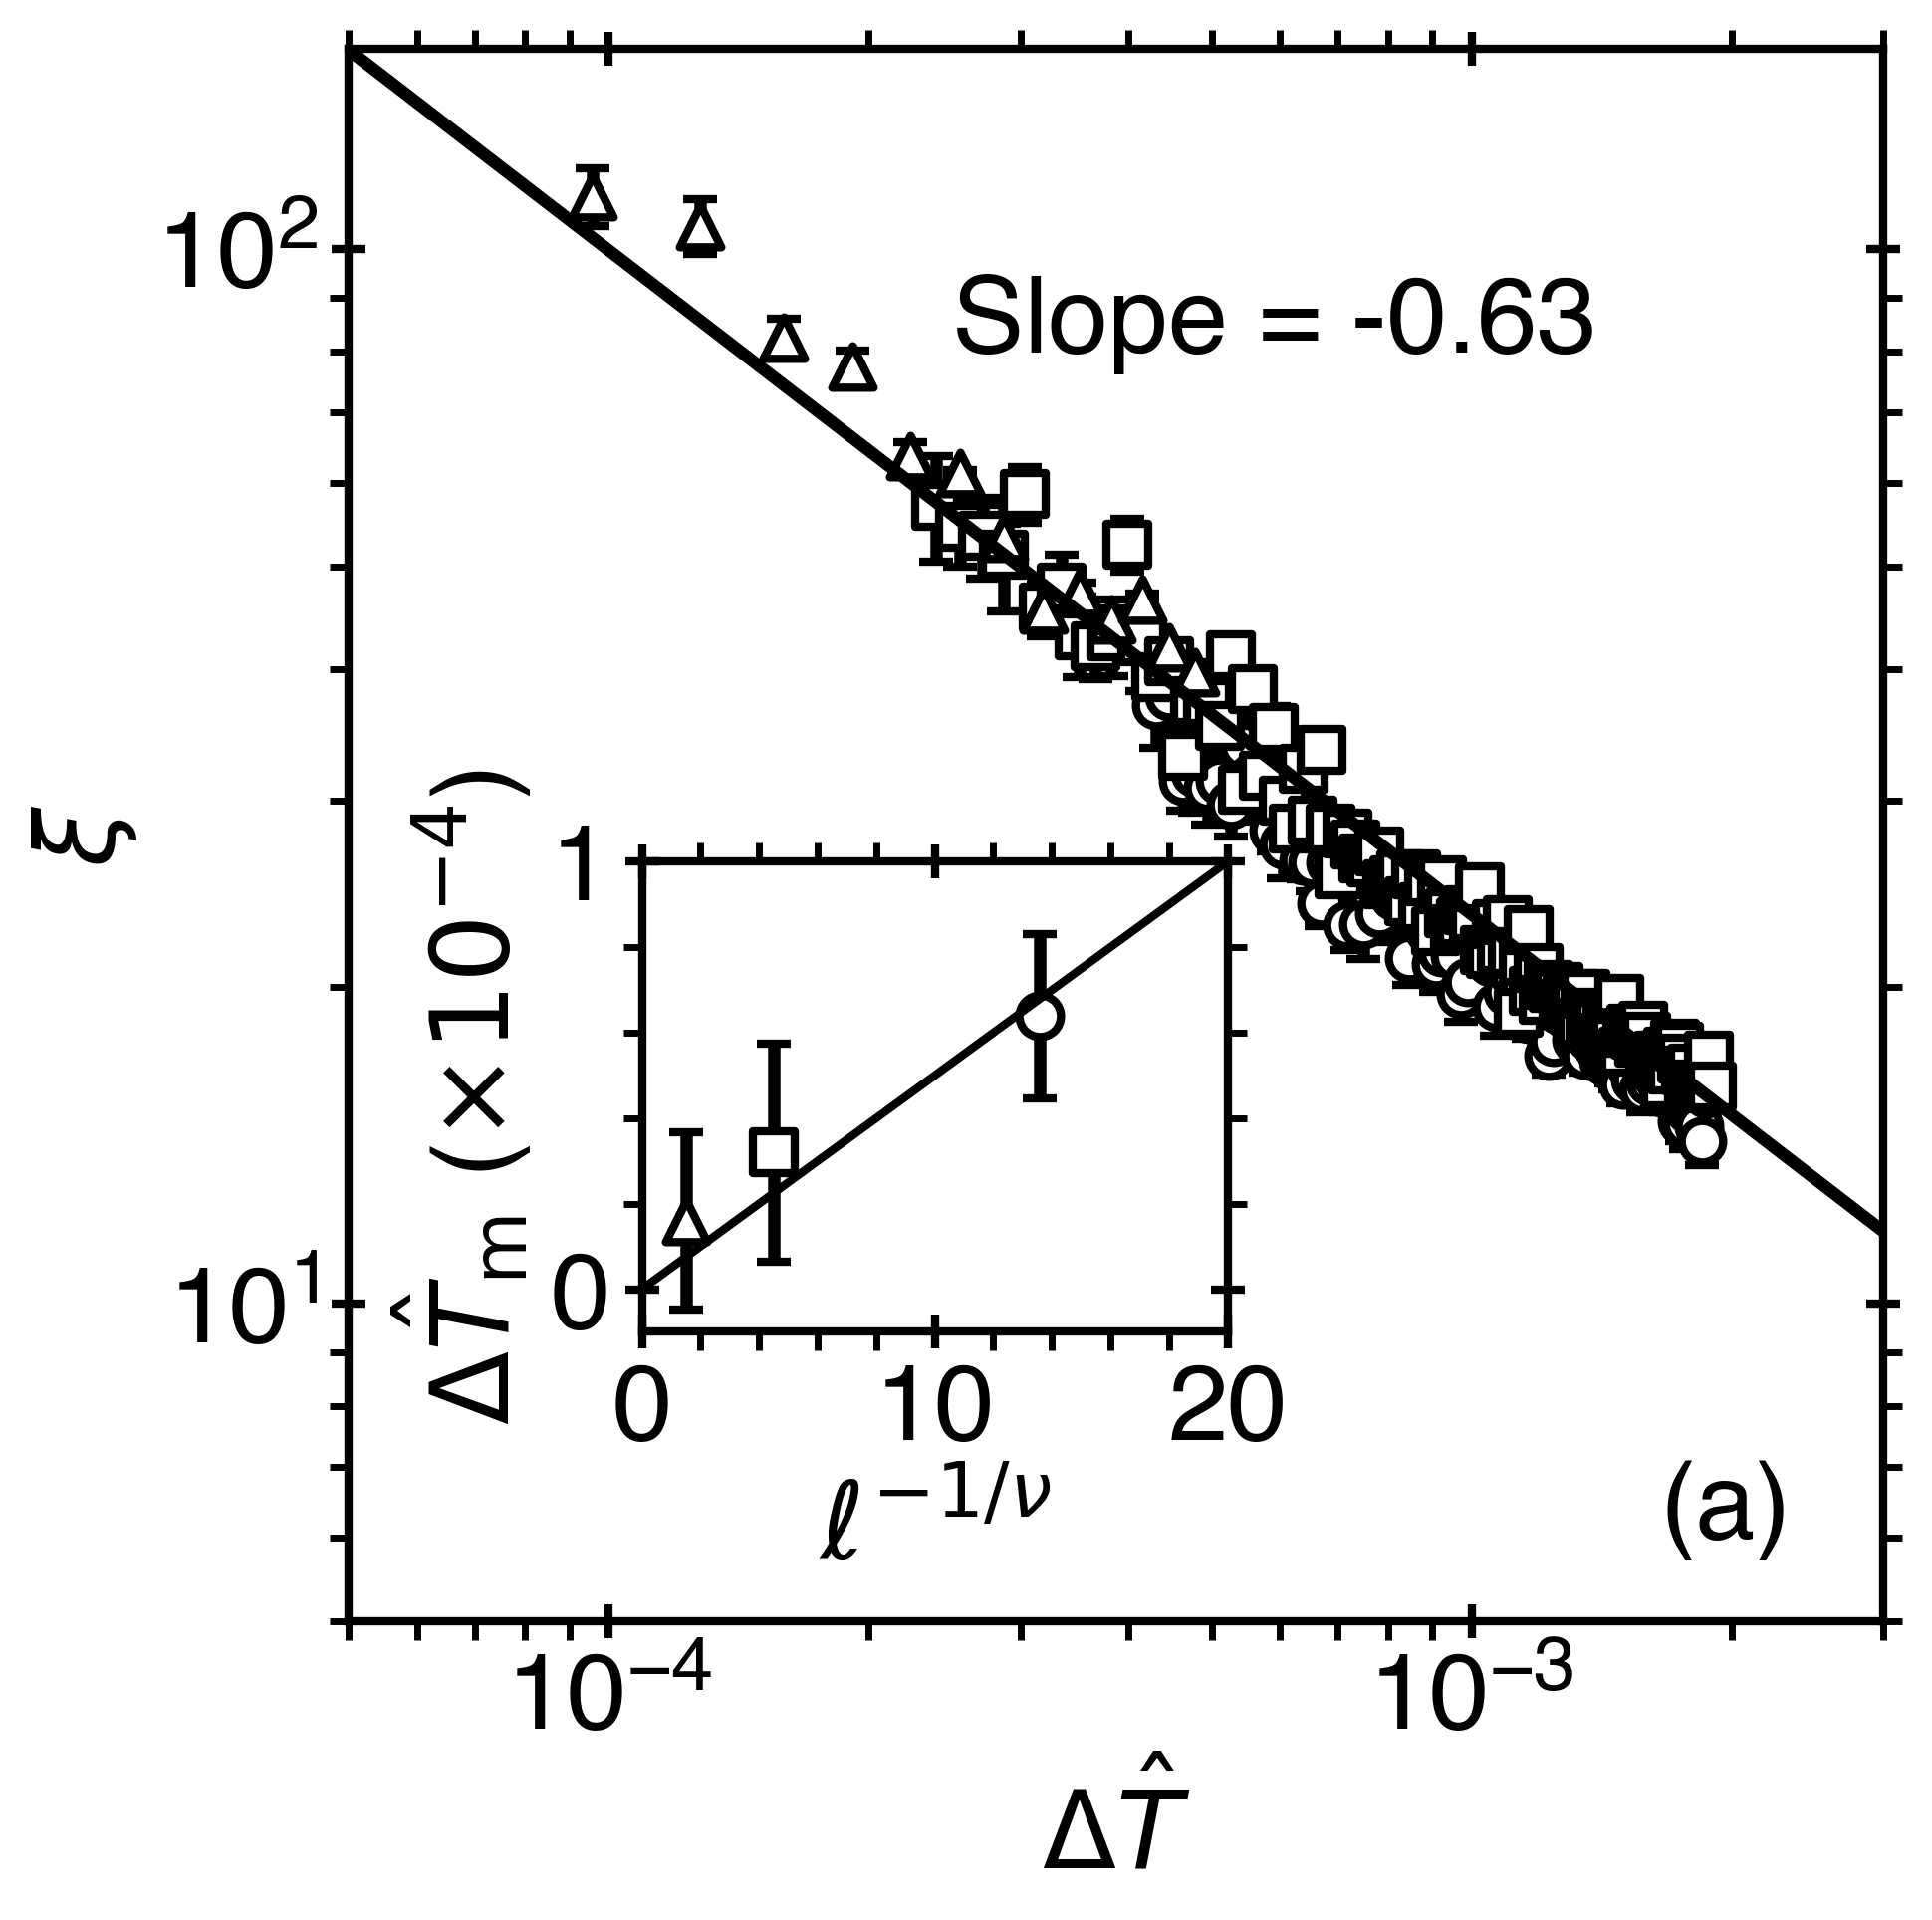
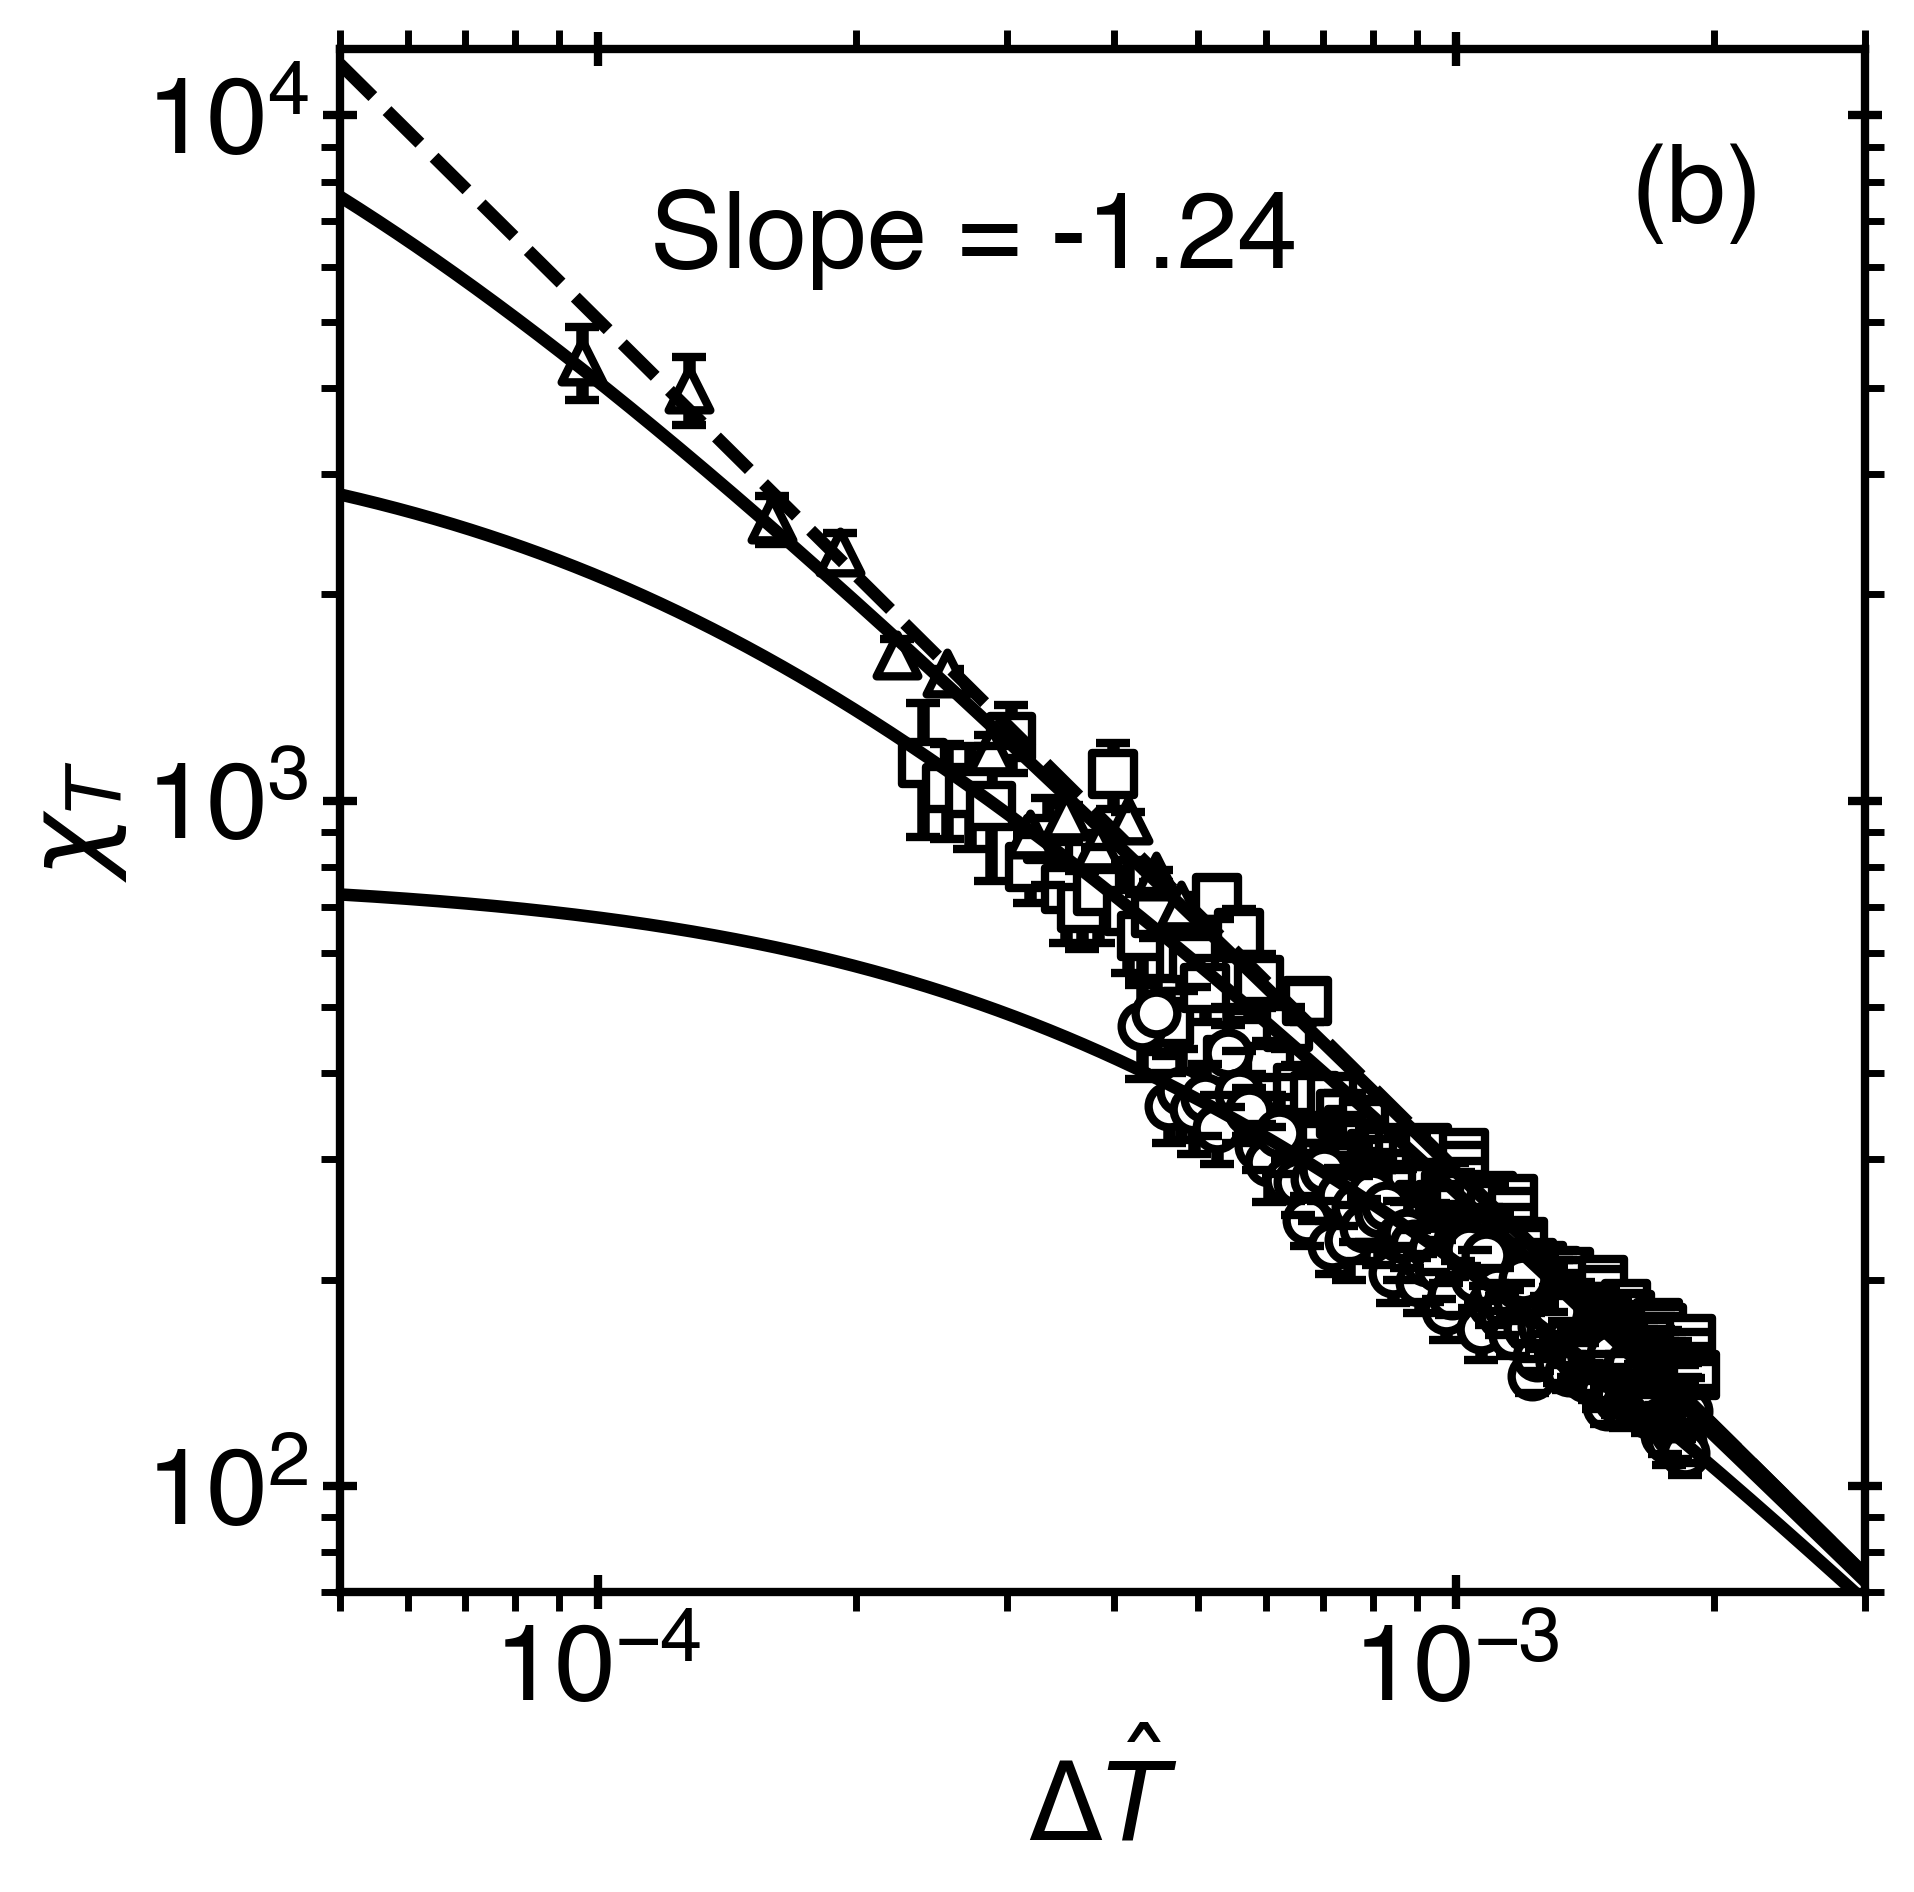
Results of extracting the correlation length and susceptibility from the structure factor in the vicinity of the LLCP for systems of three different sizes are presented in Fig. 7. The parameters from the fit of Eq. (14) to the susceptibility data are provided in Table 3. As illustrated on Fig 7b, the susceptibility for the smallest size considered, , is the most strongly affected by the finite-size effect, significantly deviating from the predictions of Eq. (13), while the susceptibility for the largest size considered, , is only slightly affected. Note that the simulation data presented in Fig. 7 are much closer to the LLCP than the simulation data presented in Fig. 6, such that the finite-size effect may be readily observed for all system sizes.
The finite-size scaling theory predicts that the apparent critical temperature, , given in Table 2, obtained from Eq. (14), scales with the system size as [67]
| (16) |
where is the critical temperature of a system with infinite size. The inset on Fig. 7a confirms this prediction. Additionally, from the extrapolation of the apparent critical temperatures, it is predicted that .
Note that there is a small discrepancy between the prediction of the locations for the LGCP and LLCP obtained from the phase coexistence, presented in Figs. 2 and 4, with those obtained from the structure factor, presented in Table 2. For a system of size , the critical temperature obtained from coexistence is and , while from the structure factor and . This effect requires further investigation. However, one may attribute this discrepancy (on the order of ) to the different geometries used for simulations of phase coexistence (rectangular box) and structure factor (cubic box).We believe the prediction of the critical point from the correlation length to be the most accurate.
| Critical point | System size | ||
|---|---|---|---|
| LGCP | 256 | 3.284(2) | 4.407(2) |
| LLCP | 64 | 0.245(7) | 0.055(5) |
| 128 | 0.228(5) | 0.055(3) | |
| 256 | 0.190(3) | 0.055(2) |
3.3 Surface Tension
In this subsection, the liquid-gas interfacial tension, , is obtained from two methods. First, the surface tension was calculated via Binder’s thermodynamic integration of the Helmholtz free energy [72]. An additional constraint, that the interfacial tension must be zero at the critical point, was incorporated as a constant shift in the surface tension calculated via this method. Second, the interfacial tension was obtained from calculations of the Laplace pressure. The Laplace pressure, , is the pressure difference between the inner and outer phases of a system consisting of a vapor bubble in equilibrium with a surrounding liquid phase. It is related to the surface tension as , in which is the radius of the bubble, calculated as
| (17) |
where and are the equilibrium values of the densities of the liquid (outside the bubble) and the vapor (inside the bubble), respectively, while is the fixed average density of the system. The Laplace pressure can be obtained from the difference between the liquid pressure for a system with a flat interface, , and the liquid pressure for a system with a bubble, . A good approximation for the expression of is given by the Poynting correction in the incompressible limit [73, 74]: . Finally, the interfacial tension is written as
| (18) |
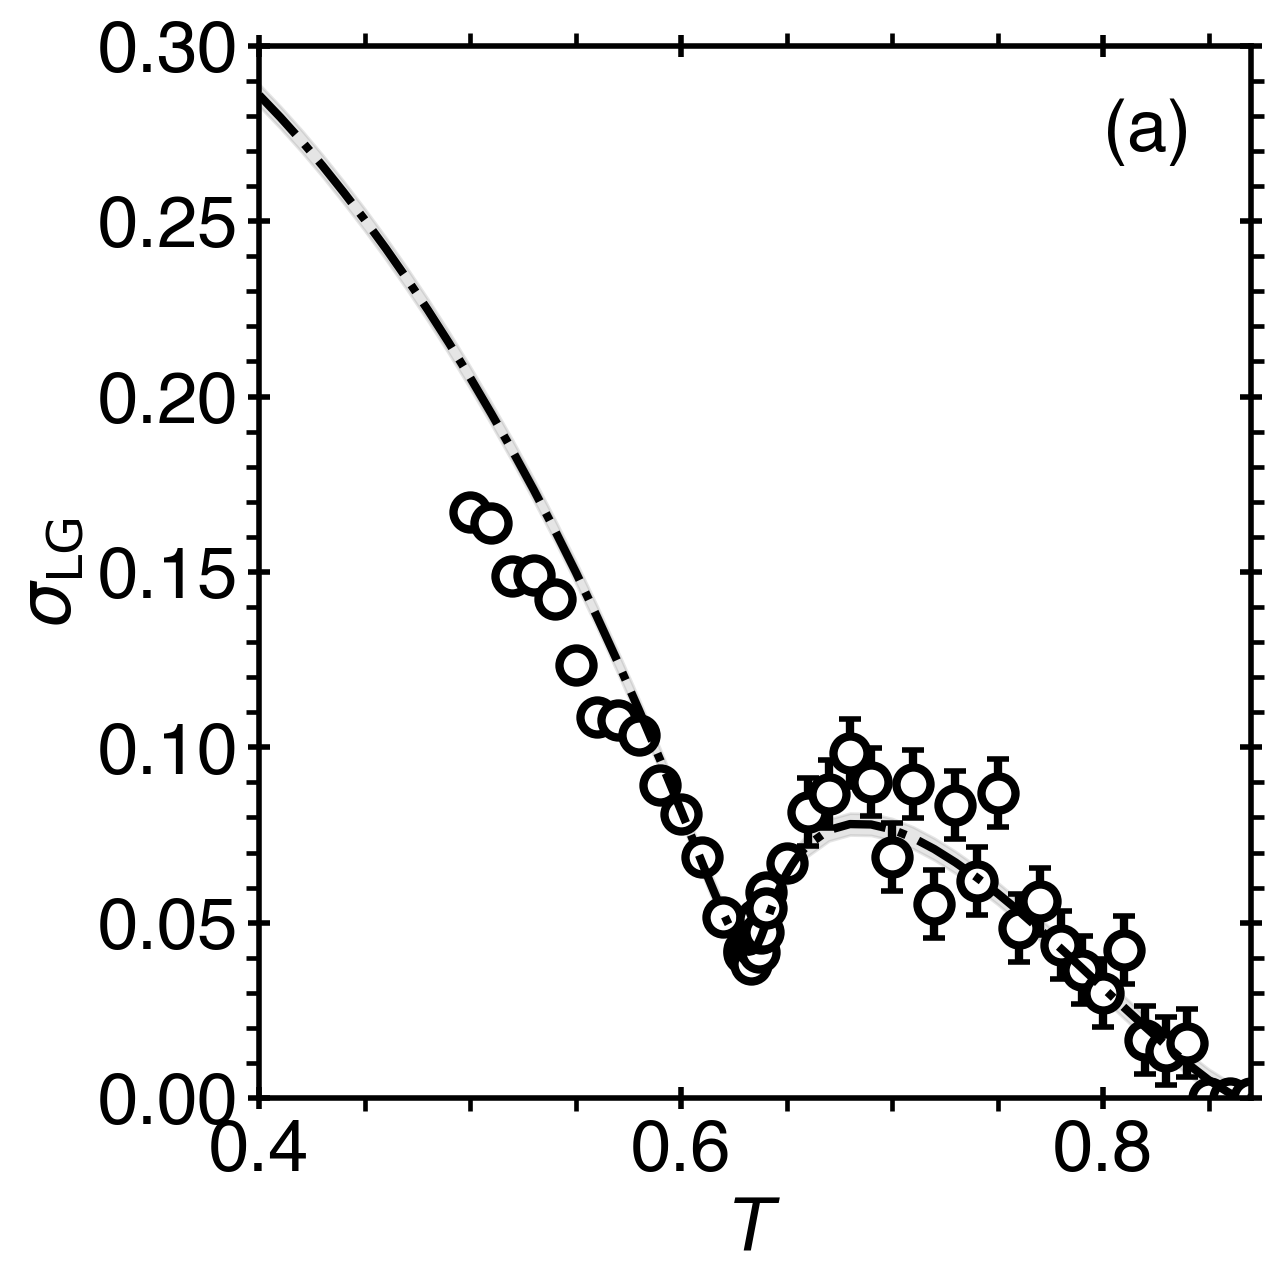
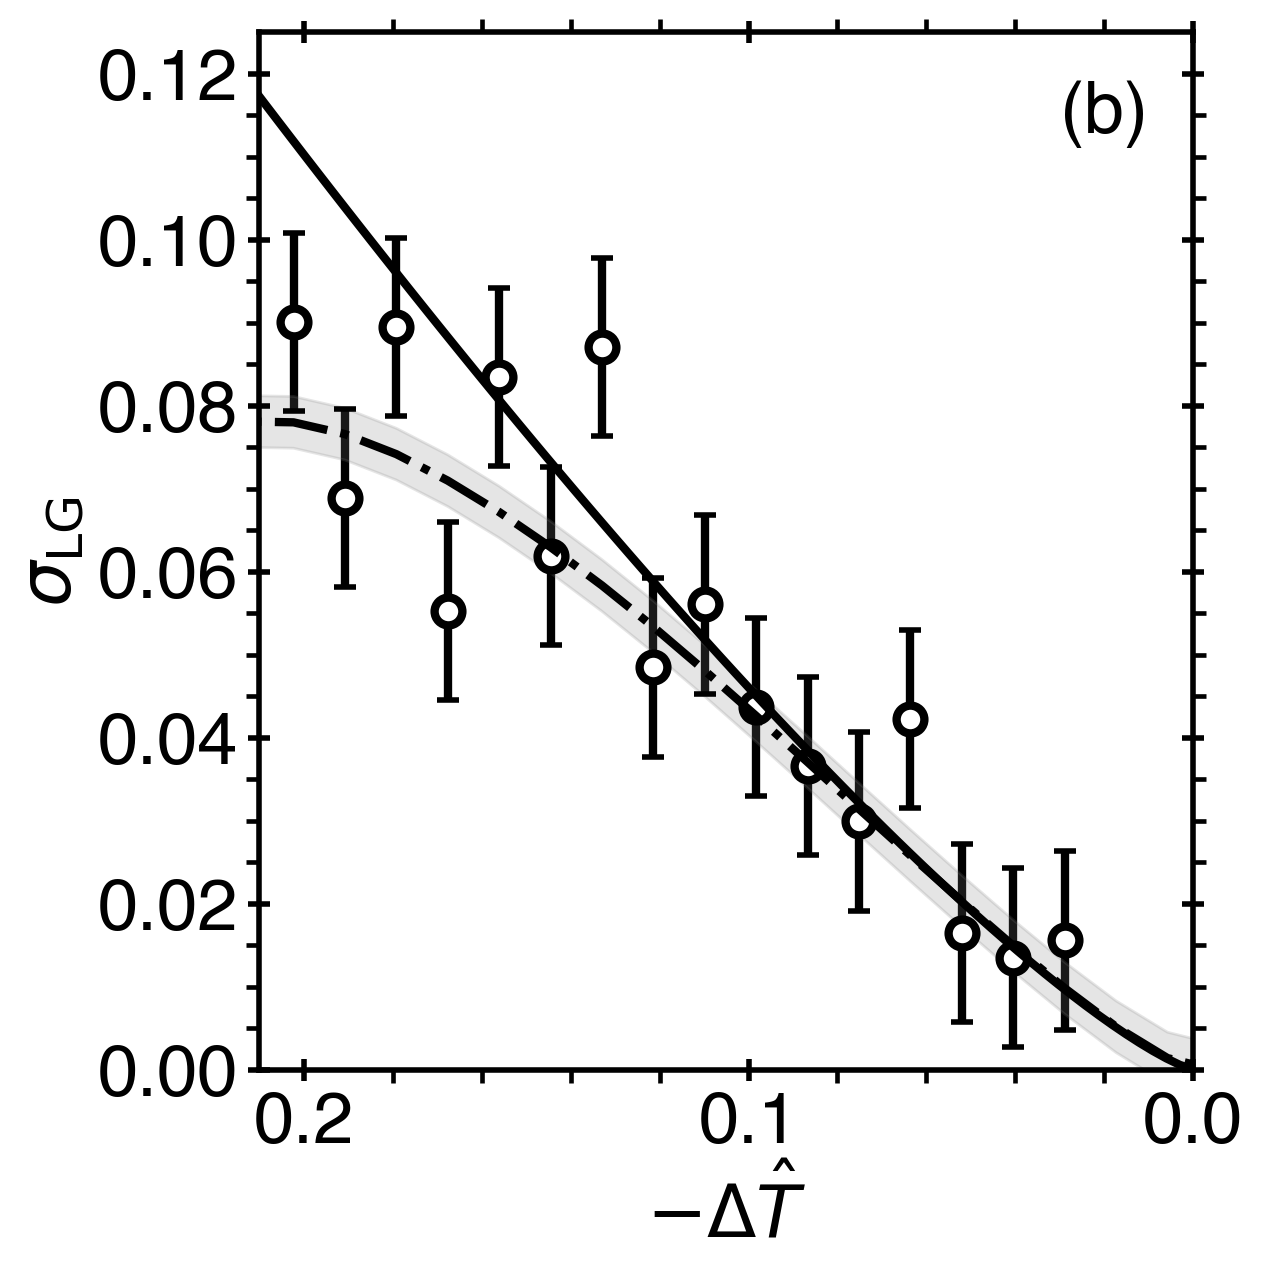
Figure 8a displays the results for the liquid-gas surface tension, , obtained from these two methods, demonstrating a reasonably good agreement. They both show an anomalous behavior: upon warming, the surface tension reaches a minimum, followed by a maximum, before vanishing at the LGCP. This surprising non-monotonic variation was already observed in our previous meanfield approach [56] for sufficiently low values of , and is confirmed by the present MC simulations. The extrema in surface tension occurs at temperatures close to the density extrema along LG coexistence, see Fig. 2a.
To our knowledge, there is yet no other report of a surface tension minimum for a water-like system. A maximum in the surface tension was previously reported in a van der Waals-Cahn-Hilliard treatment of a water-like fluid, but a different assumption about the influence parameter involved in the treatment lead, instead, to a monotonic temperature dependence with an inflection point. Surface tension measurements in the deeply supercooled liquid suggest that water may possess such an inflection point [41]. This property has received much attention throughout the years, with a number of predictions from molecular dynamics simulations with various water-like potentials [75, 76, 77, 78, 79, 80]. The low-temperature inflection point in the surface tension also occurs in the blinking-checkers model for large enough [56] in the meanfield treatment; in that case, the fluid exhibits water-like anomalies but no liquid-liquid transition. It would be interesting, in a future work, to study this case with the exact calculation.
Scaling theory predicts that in the vicinity of the critical point, the surface tension is described by an asymptotic power law of the form [81]
| (19) |
where is the critical amplitude of the surface tension, while is the critical exponent, being for three-dimensional Ising-like systems (see Table 1). Figure 8b shows in the vicinity of the LGCP, but due to the computational expense of the calculations, it is difficult to ascertain which method is more accurate. The two methods are in agreement with the scaling theory, to the limit of the estimated error, being characterized by a critical amplitude of , indicated by the black curve in Fig. 8b.
4 Conclusions
In this study, Monte Carlo simulations of the blinking-checkers model [52] for polyamorphic fluids are performed, demonstrating the fluid phase behavior and confirming the predictions of the meanfield theory [56]. In addition, Monte Carlo simulations provide access to information on the correlation length, which is not available from the meanfield prediction. Calculations of the coexistence, isothermal compressibility, correlation length, and surface tension from the simulation data demonstrate that both the liquid-gas critical point and the liquid-liquid critical point exhibit three-dimensional Ising-like critical behavior. The locations of these critical points are found to be different from their meanfield counterparts for this model with the same set of interaction parameters [56], as the behavior of the thermodynamic properties are significantly affected by critical fluctuations and finite-size effects.
Acknowledgements
The authors would like to thank Nikolay Shumovskyi for his assistance with the initial simulations. F.C. and M.A. appreciate the beneficial collaborations with the scientists at Universidad Complutense de Madrid. In particular, F.C. thanks José Luis F. Abascal for a fruitful collaboration and for his hospitality during visits in Madrid.
Disclosure statement
The authors declare no conflicts of interest.
Funding
The research of S.V.B. was supported by NSF Award No. 1856496, and partially supported through the Bernard W. Gamson Computational Science Center at Yeshiva College. The research of T.J.L. and M.A.A. was partially supported by NSF award no. 1856479. FC acknowledges support from Agence Nationale de la Recherche, grant number ANR-19-CE30-0035-01.
References
- [1] H.E. Stanley, in Advances in Chemical Physics, edited by Stuart A. Rice and Aaron R. Dinner, Vol. 152 (, , 2013).
- [2] M.A. Anisimov, M. Duška, F. Caupin, L.E. Amrhein, A. Rosenbaum and R.J. Sadus, Phys. Rev. X 8, 011004 (2018).
- [3] H. Tanaka, J. Chem. Phys. 153, 130901 (2020).
- [4] D. Vollhardt and P. Wölfle, The Superfluid Phases of Helium 3 (Taylor and Francis, London, UK, 1990).
- [5] A. Schmitt, Introduction to Superfluidity, Lecture Notes in Physics, Vol. 888 (Springer International Publishing, Cham, 2015).
- [6] K. Ohta, K. Ichimaru, M. Einaga, S. Kawaguchi, K. Shimizu, T. Matsuoka, N. Hirao and Y. Ohishi, Sci. Rep. 5 (16560) (2015).
- [7] M. Zaghoo, A. Salamat and I.F. Silvera, Phys. Rev. B 93, 155128 (2016).
- [8] R.S. McWilliams, D.A. Dalton, M.F. Mahmood and A.F. Goncharov, Phys. Rev. Lett. 116, 255501 (2016).
- [9] G.E. Norman and I.M. Saitov, Phys. Usp. 64, 1094 (2021).
- [10] N.R. Fried, T.J. Longo and M.A. Anisimov, J. Chem. Phys. 157, 101101 (2022).
- [11] L. Henry, M. Mezouar, G. Garbarino, D. Sifré, G. Weck and F. Datchi, Nature 584, 382–386 (2020).
- [12] N.A. Shumovskyi, T.J. Longo, S.V. Buldyrev and M.A. Anisimov, Phys. Rev. E 106, 015305 (2022).
- [13] Y. Katayama, T. Mizutani, W. Utsumi, O. Shimomura, M. Yamakata and K. ichi Funakoshi, Nature 403, 170–173 (2000).
- [14] Y. Katayama, Y. Inamura, T. Mizutani, M. Yamakata, W. Utsumi and O. Shimomura, Science 306 (5697), 848–851 (2004).
- [15] J.N. Glosli and F.H. Ree, Phys. Rev. Lett. 82, 4659–4662 (1999).
- [16] S. Sastry and C.A. Angell, Nature Mater 2, 739–743 (2003).
- [17] M. Beye, F. Sorgenfrei, W.F. Schlotter, W. Wurth and A. Föhlisch, Proc. Natl. Acad. Sci. 107 (39), 16772–16776 (2010).
- [18] V.V. Vasisht, S. Saw and S. Sastry, Nat. Phys. 7, 549–553 (2011).
- [19] F. Sciortino, Nat. Phys. 7, 523–524 (2011).
- [20] Y. Tsuchiya and E.F.W. Seymour, J. Phys. C Solid State Phys. 15 (22), L687–L695 (1982).
- [21] V.V. Brazhkin, S.V. Popova and R.N. Voloshin, Physica B 265, 64–71 (1999).
- [22] A. Cadien, Q.Y. Hu, Y. Meng, Y.Q. Cheng, M.W. Chen, J.F. Shu, H.K. Mao and H.W. Sheng, Phys. Rev. Lett. 110, 125503 (2013).
- [23] I. Saika-Voivod, F. Sciortino and P.H. Poole, Phys. Rev. E 63, 011202 (2000).
- [24] E. Lascaris, M. Hemmati, S.V. Buldyrev, H.E. Stanley and C.A. Angell, J. Chem. Phys. 140, 224502 (2014).
- [25] C.A. Angell, J. Phys. Chem. 75 (24), 3698 (1971).
- [26] C.A. Angell, Annual Review of Physical Chemistry 55 (1), 559–583 (2004).
- [27] P.H. Poole, F. Sciortino, U. Essmann and H.E. Stanley, Nature 360, 324–328 (1992).
- [28] P.G. Debenedetti, Nature 392, 127–128 (1998).
- [29] V. Holten and M.A. Anisimov, Sci. Rep. 2, 713 (2012).
- [30] V. Holten, J.C. Palmer, P.H. Poole, P.G. Debenedetti and M.A. Anisimov, J. Chem. Phys. 140, 104502 (2014).
- [31] P. Gallo, K. Amann-Winkel, C.A. Angell, M.A. Anisimov, F. Caupin, C. Chakravarty, E. Lascaris, T. Loerting, A.Z. Panagiotopoulos, J. Russo, J.A. Sellberg, H.E. Stanley, H. Tanaka, C. Vega, L. Xu and L.G.M. Pettersson, Chem. Rev. 116, 7463–7500 (2016).
- [32] J.W. Biddle, R.S. Singh, E.M. Sparano, F. Ricci, M.A. González, C. Valeriani, J.L.F. Abascal, P.G. Debenedetti, M.A. Anisimov and F. Caupin, J. Chem. Phys. 146, 034502 (2017).
- [33] F. Caupin and M.A. Anisimov, J. Chem. Phys. 151, 034503 (2019).
- [34] M. Duška, J. Chem. Phys. 152, 174501 (2020).
- [35] V. Holten, C. Qiu, E. Guillerm, M. Wilke, J. Rička, M. Frenz and F. Caupin, J. Phys. Chem. Lett. 8 (22), 5519–5522 (2017).
- [36] K.H. Kim, A. Späh, H. Pathak, F. Perakis, D. Mariedahl, K. Amann-Winkel, J.A. Sellberg, J.H. Lee, S. Kim, J. Park, K.H. Nam, T. Katayama and A. Nilsson, Science 358 (6370), 1589–1593 (2017).
- [37] H. Pathak, A. Späh, N. Esmaeildoost, J.A. Sellberg, K.H. Kim, F. Perakis, K. Amann-Winkel, M. Ladd-Parada, J. Koliyadu, T.J. Lane, C. Yang, H.T. Lemke, A.R. Oggenfuss, P.J.M. Johnson, Y. Deng, S. Zerdane, R. Mankowsky, P. Beaud and A. Nilsson, Proc. Natl. Acad. Sci. 118 (6), e2018379118 (2021).
- [38] V.V. Jan Hrubý, R. Mareš, J. Hykl and J. Kalová, J. Phys. Chem. Lett. 5 (3), 425–428 (2014).
- [39] V. Vinš, M. Fransen, J. Hykl and J. Hrubý, J. Phys. Chem. B 119 (17), 5567–5575 (2015).
- [40] V. Vinš, J. Hošek, J. Hykl and J. Hrubý, J. Chem. Eng. Data 62 (11), 3823–3832 (2017).
- [41] V. Vinš, J. Hykl, J. Hrubý, A. Blahut, D. Celný, M. Čenský and O. Prokopová, J. Phys. Chem. Lett. 11 (11), 4443–4447 (2020).
- [42] M.A. Gonzàlez, C. Valeriani, F. Caupin and J.L.F. Abascal, J. Chem. Phys. 145, 054505 (2016).
- [43] J. Guo, R.S. Singh and J.C. Palmer, Molecular Physics 116 (15-16), 1953–1964 (2018).
- [44] R.S. Singh, J.C. Palmer, A.Z. Panagiotopoulos and P.G. Debenedetti, J. Chem. Phys. 150, 2224503 (2019).
- [45] P.G. Debenedetti, F. Sciortino and G.H. Zerze, Science 369 (6501), 289–292 (2020).
- [46] O. Mishima and H.E. Stanley, Nature 392, 164–168 (1998).
- [47] K.H. Kim, K. Amann-Winkel, N. Giovambattista, A. Späh, F. Perakis, H. Pathak, M.L. Parada, C. Yang, D. Mariedahl, T. Eklund, T.J. Lane, S. You, S. Jeong, M. Weston, J.H. Lee, I. Eom, M. Kim, J. Park, S.H. Chun, P.H. Poole and A. Nilsson, Science 370 (6519), 978–982 (2020).
- [48] J.L.F. Abascal and C. Vega, J. Chem. Phys. 123, 234505 (2005).
- [49] C. Vega and J.L.F. Abascal, Phys. Chem. Chem. Phys. 13, 19663–19688 (2011).
- [50] G. Pallares, M.E.M. Azouzi, M.A. González, J.L. Aragones, J.L.F. Abascal, C. Valeriani and F. Caupin, Proc. Natl. Acad. Sci. 111 (22), 7936–7941 (2014).
- [51] G. Pallares, M.A. Gonzalez, J.L.F. Abascal, C. Valeriani and F. Caupin, Phys. Chem. Chem. Phys. 18, 5896–5900 (2016).
- [52] F. Caupin and M.A. Anisimov, Phys. Rev. Lett. 127, 185701 (2021).
- [53] T.J. Longo and M.A. Anisimov, J. Chem. Phys. 156, 084502 (2022).
- [54] N.A. Shumovskyi and S.V. Buldyrev, Phys. Rev. E 107, 024140 (2023).
- [55] S.V. Buldyrev, Cond. Matt. Physics 27, xxxx (2024).
- [56] T.J. Longo, S.V. Buldyrev, M.A. Anisimov and F. Caupin, J. Phys. Chem. B 127 (13), 3079–3090 (2023).
- [57] S. Sastry, P.G. Debenedetti, F. Sciortino and H.E. Stanley, Phys. Rev. E 53, 6144–6154 (1996).
- [58] J. Hrubý and V. Holten, Proceedings of the 14th International Conference on the Properties of Water and Steam, Maruzen pp. 241–246 (2004).
- [59] A. Ciach, W. Góźdź and A. Perera, Phys. Rev. E 78, 021203 (2008).
- [60] K. Kawasaki, Physical Review 145 (1), 224–230 (1966).
- [61] R.J. Glauber, J. Math. Phys. 4 (2), 294–307 (1963).
- [62] N.A. Shumovskyi, T.J. Longo, S.V. Buldyrev and M.A. Anisimov, Phys. Rev. E 103, L060101 (2021).
- [63] N. Metropolis and R.L. Ashenhurst, IEEE Trans. Comput EC-12 (6), 896–904 (1963).
- [64] B. Widom, J. Chem. Phys. 39 (6), 2808–2812 (1963).
- [65] H. Behnejad, J.V. Sengers and M.A. Anisimov, in Applied Thermodynamics of Fluids, edited by Anthony R. Goodwin, Cor J Peters and Jan Sengers, Chap. 10 (Royal Society of Chemistry, Cambridge, 2010), pp. 321–367.
- [66] J. Wang, C.A. Cerdeiriña, M.A. Anisimov and J.V. Sengers, Phys. Rev. E 77, 031127 (2008).
- [67] M.E. Fisher and M.N. Barber, Phys. Rev. Lett. 28, 1516–1519 (1972).
- [68] J.P. Hansen and I.R. McDonald, Theory of Simple Liquids: with Applications to Soft Matter, 4th ed. (Academic Press, Oxford, 2013).
- [69] Y.C. Kim, M.A. Anisimov, J.V. Sengers and E. Luijten, J. Stat. Phys. 110, 591–609 (2003).
- [70] M.A. Anisimov, A.F. Kostko, J.V. Sengers and I.K. Yudin, J. Chem. Phys. 123, 164901 (2005).
- [71] M.E. Fisher and R.J. Burford, Phys. Rev. 156, 583–622 (1967).
- [72] K. Binder, Phys. Rev. A 25, 1699–1709 (1982).
- [73] P.G. Debenedetti, Metastable liquids (Princeton University Press, Princeton, NJ, 1996).
- [74] A. Arvengas, E. Herbert, S. Cersoy, K. Davitta and F. Caupin, J. Phys. Chem 115, 14240–14245 (2011).
- [75] Y.J. Lü and B. Wei, Appl. Phys. Lett. 89 (16), 164106 (2006).
- [76] T.R. Rogers, K.Y. Leong and F. Wang, Sci. Rep. 6, 33284 (2016).
- [77] X. Wang, K. Binder, C. Chen, T. Koop, U. Pöschl, H. Su and Y. Cheng, Phys. Chem. Chem. Phys. 21, 3360–3369 (2019).
- [78] S.M.A. Malek, P.H. Poole and I. Saika-Voivod, J. Chem. Phys. 150, 234507 (2019).
- [79] A. Gorfer, C. Dellago and M. Sega, J. Chem. Phys. 158, 054503 (2023).
- [80] F. Hrahsheh, I. Jum’h and G. Wilemski, J. Chem. Phys. 160, 114504 (2024).
- [81] B. Widom, J. Chem. Phys. 43, 3892–3897 (1965).
- [82] M. Sellitto, J. Chem. Phys. 153, 161101 (2020).
Appendix A Sellitto’s “Ghost Site” Method for Pressure Calculations
In addition to the traditional Widom-insertion method to calculate the pressure in a MC system (see Section 2.2), we also considered a contemporary method to calculate the pressure. In this appendix, we describe this alternative approach and provide initial pressure calculations for the blinking-checkers model.
Sellitto’s ghost-site method, described in Ref. [82], introduces ghost sites, each identified as a specific . The ghost sites exchange states with randomly selected sites in the lattice. The ghost sites can be empty or occupied by particles of types 1 and 2. A particle of type 1 or 2 in the th ghost site has a potential . If the ghost site is empty, it has zero potential energy.
When a MC time step becomes equal to a multiple of , each ghost site is allowed to exchange its content with a randomly selected site in the lattice. If a particle of type is moved to a ghost site, it has a potential energy or . Alternatively, if a particle of type is moved from the ghost site to a randomly selected lattice site, , it contributes to the total internal energy, , through the introduction of the term
| (20) |
For instance, suppose that site is occupied by a particle of type and the ghost site is occupied by a particle of type . Accordingly, the probability of an exchange of particles between the ghost site and the lattice site is computed as , where .
The average occupancy of a ghost site is , such that the pressure is computed as
| (21) |
Note that for non-interacting particles of density , this method gives the exact result, .
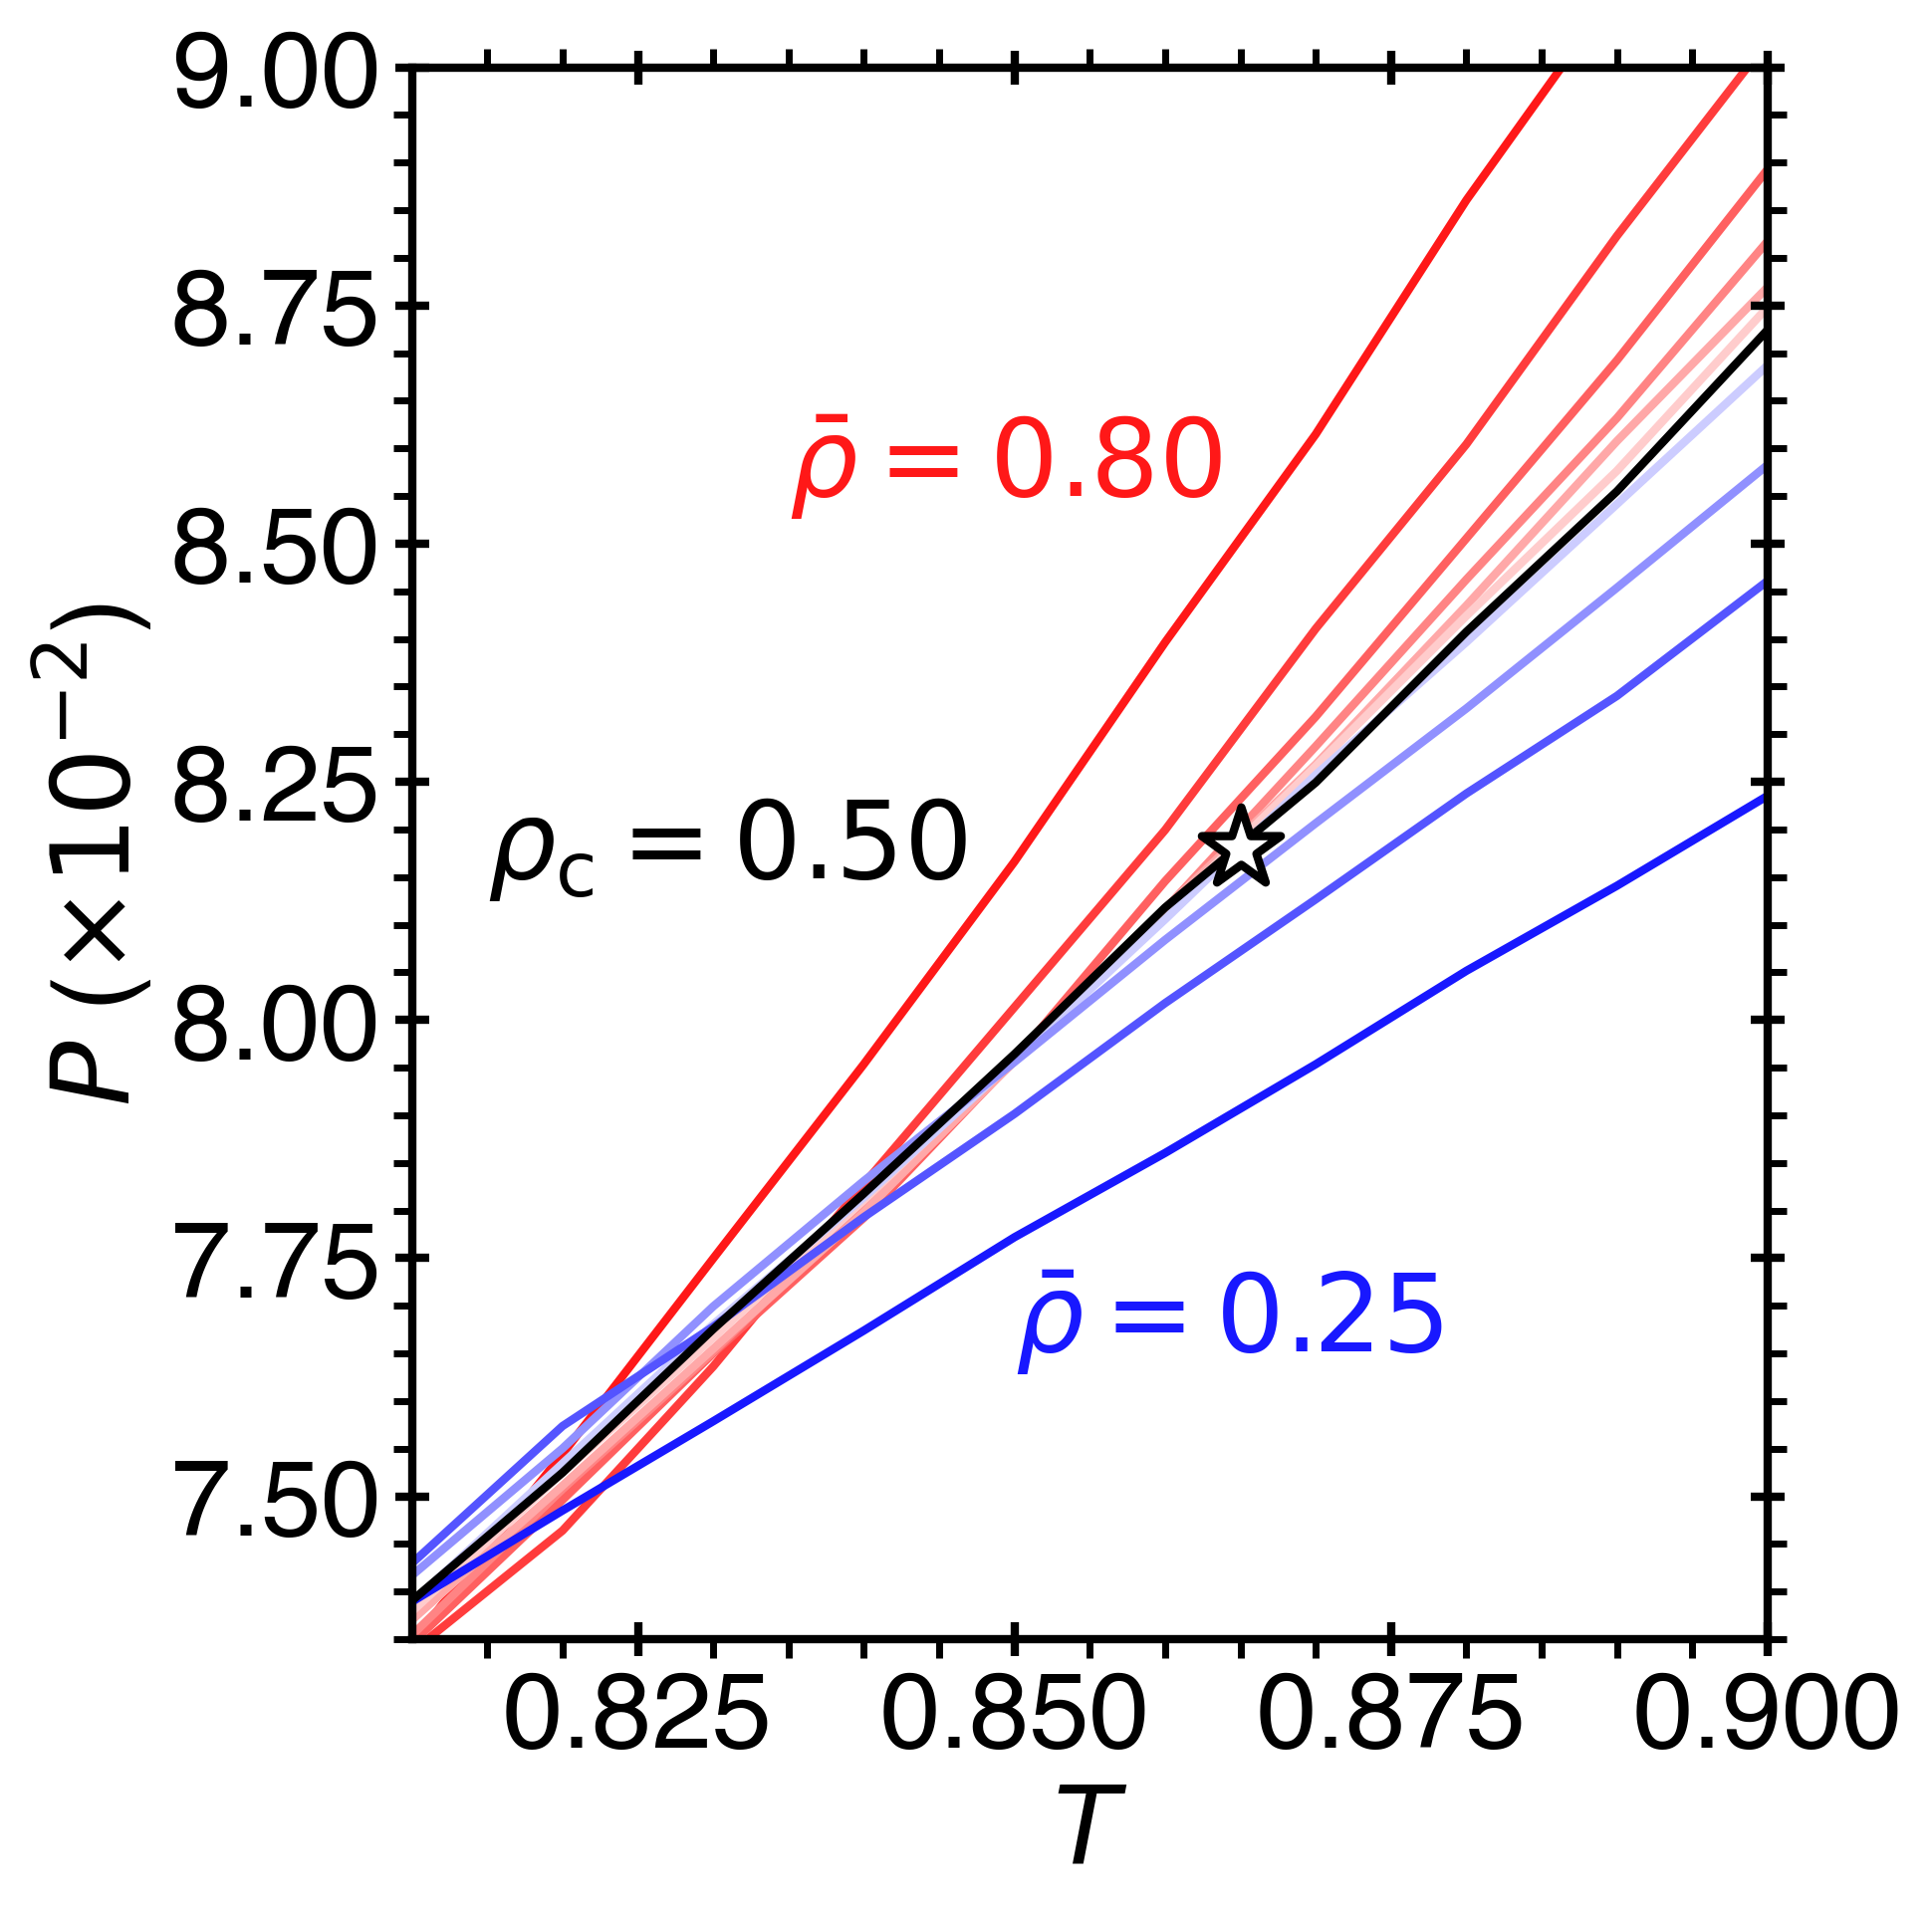
The pressure-temperature phase diagram in the vicinity of the LGCP, calculated with use of Sellitto’s method, is presented in Fig. 9. While the prediction of the critical temperature () and critical density () are in good agreement with the prediction from the Widom-insertion method (see Fig. 2a), the prediction for the critical pressure () does not share the same order of magnitude as that from the traditional method nor from the meanfield prediction [56]. Consequently, in the main text, all pressure calculations were performed with use of the Widom-insertion method. That being said, Sellitto’s method is much more efficient computationally than the Widom-insertion method, since, in the traditional method, the pressure calculation must be repeated for all densities from to the state point (see Eq. (5) and the discussion in Section 2.2). Therefore, Sellitto’s method was found to be useful for quickly generating and evaluating the phase diagram for a given set of model parameters (, , , , and ).