DE3-BERT: Distance-Enhanced Early Exiting
for BERT based on Prototypical Networks
Abstract
Early exiting has demonstrated its effectiveness in accelerating the inference of pre-trained language models like BERT by dynamically adjusting the number of layers executed. However, most existing early exiting methods only consider local information from an individual test sample to determine their exiting indicators, failing to leverage the global information offered by sample population. This leads to suboptimal estimation of prediction correctness, resulting in erroneous exiting decisions. To bridge the gap, we explore the necessity of effectively combining both local and global information to ensure reliable early exiting during inference. Purposefully, we leverage prototypical networks to learn class prototypes and devise a distance metric between samples and class prototypes. This enables us to utilize global information for estimating the correctness of early predictions. On this basis, we propose a novel Distance-Enhanced Early Exiting framework for BERT (DE3-BERT). DE3-BERT implements a hybrid exiting strategy that supplements classic entropy-based local information with distance-based global information to enhance the estimation of prediction correctness for more reliable early exiting decisions. Extensive experiments on the GLUE benchmark demonstrate that DE3-BERT consistently outperforms state-of-the-art models under different speed-up ratios with minimal storage or computational overhead, yielding a better trade-off between model performance and inference efficiency. Additionally, an in-depth analysis further validates the generality and interpretability of our method.
Index Terms:
Adaptive inference, early exiting, pre-trained language model (PLM), bidirectional encoder representations from transformers (BERT), prototypical network.I Introduction
In recent years, large-scale pre-trained language models (PLMs), such as GPT [1], BERT [2], RoBERTa [3], and ALBERT [4], have brought significant improvements to natural language processing tasks. Despite the tremendous success, these transformer-based models still suffer from high memory and computational overhead in both training and inference. In particular, the prolonged inference latency hinders their deployment in edge devices or real-time scenarios. Besides, overthinking [5] poses another challenging issue for these large PLMs. It refers to the phenomenon where the model performs well in the intermediate layers for easy samples but experiences a decline in performance in the deeper layers, leading to redundant computation and performance degradation.
To speed up the inference of PLMs, numerous attempts have been made by employing model compression to condense their sizes. These approaches encompass network pruning [6, 7, 8, 9, 10], weight quantization [11, 12, 13], knowledge distillation [14, 15, 16, 17], and weight sharing [18, 19]. These methods can effectively save memory usage and computational costs to accelerate inference. However, they often necessitate additional training costs to meet different acceleration requirements, leading to inflexible adjustments to the speed-up ratio.
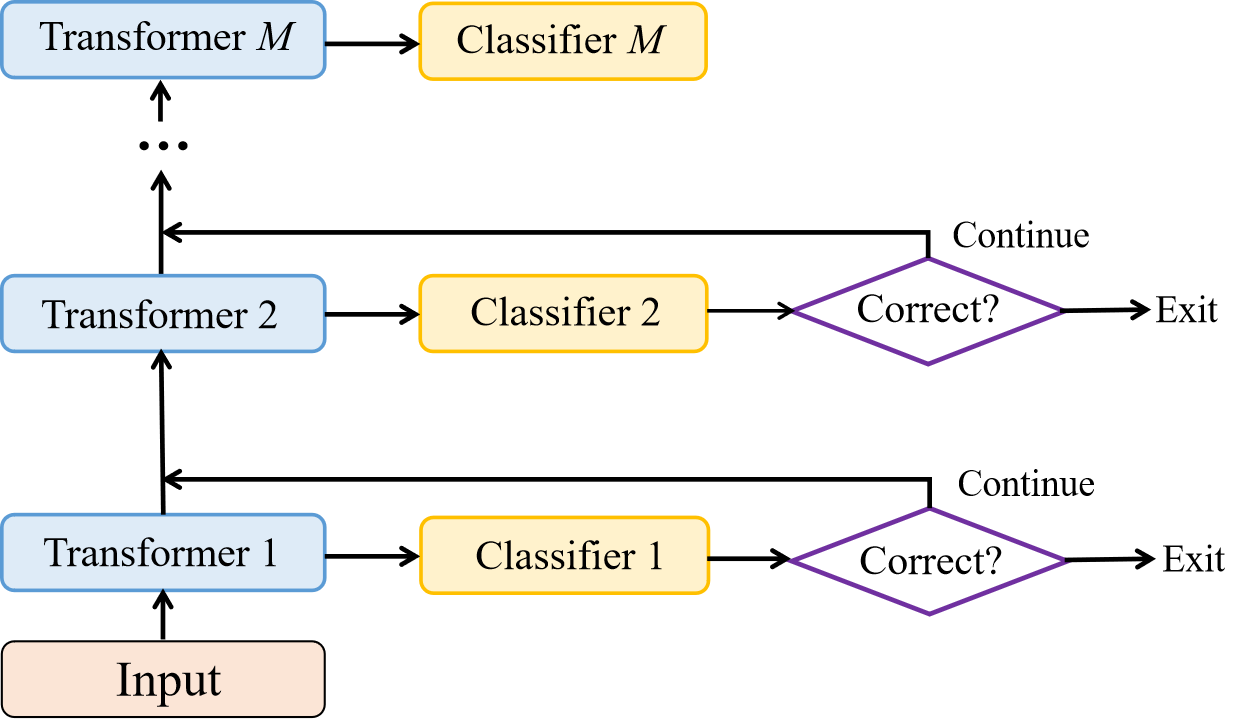
To address these issues, early exiting [20, 21, 22, 23, 24, 25, 26, 27] has been applied to accelerate the inference of PLMs. Unlike model compression, early exiting can easily adapt to different acceleration requirements by simply adjusting the threshold, without incurring additional training costs. In Fig. 1, we illustrate early exiting based on BERT, where an internal classifier is added to each intermediate layer of BERT. This enables the early exiting of samples when the early predictions from these internal classifiers are deemed sufficiently correct, eliminating the need to traverse the entire model. This strategy employs adaptive inference to deal with easy samples with shallow layers of BERT and process difficult samples with deeper layers. This approach effectively mitigates the overthinking problem and accelerates model inference while maintaining high accuracy.
A typical implementation for early exiting is to devise an early exiting indicator that reflects the correctness of early predictions (i.e., prediction correctness) to establish the exiting criteria. According to the types of exiting indicators, there are mainly three early exiting strategies for the dynamic exiting of BERT models. The first strategy is confidence-based early exiting (e.g., Deebert [20], RightTool [28] and CascadeBERT [25]). It utilizes the model confidence, i.e., entropy or label score of the prediction probability distribution, to estimate the correctness of early predictions for exit decision-making. The second strategy is patience-based early exiting (e.g., PABEE [21] and LeeBERT [29]), relying on the cross-layer consistency to determine when to exit. Early exiting in the third type learns to generate an early exiting indicator that scores the prediction correctness (e.g., BERxiT [22]). However, a reliable exiting decision is to exit when the early predictions are sufficiently correct. Unfortunately, the absence of ground-truth labels during inference poses extreme challenges to estimating prediction correctness, which compromises the reliability of exiting decisions.
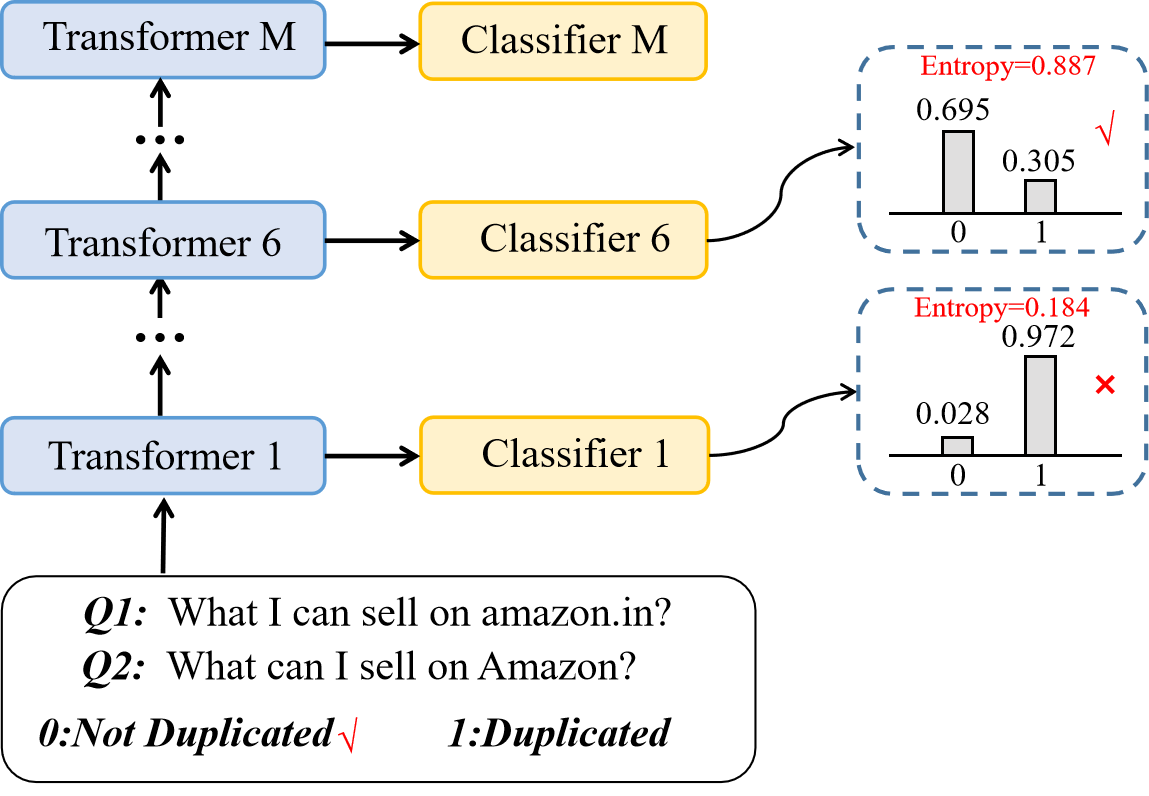
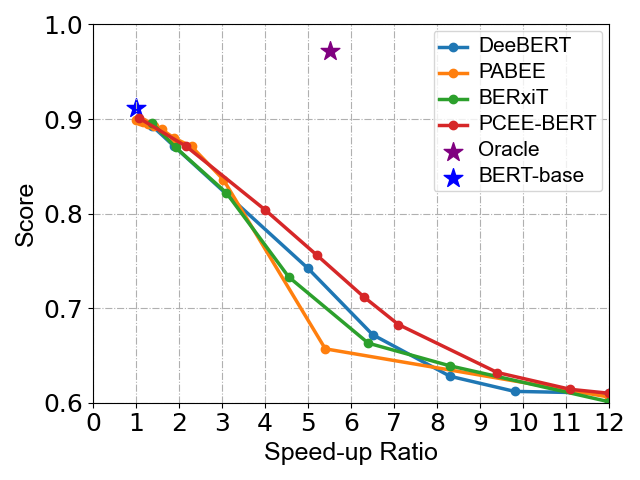
In Fig. 1, we illustrate the confidence-based exit decision-making process for a sample in the QQP task. Notably, we observe that a high-confidence prediction made by a classifier is not necessarily correct [30]. This indicates that model confidence may not always accurately reflect prediction correctness, potentially leading to erroneous exiting decisions. In Fig. 2, we further compare the existing exiting strategies with the original backbone model, as well as the oracle which is an ideal model that can always enable each sample to exit at the shallowest internal classifier that provides a correct label prediction [28]. Essentially, the oracle serves as the upper bound for early exiting strategies as it provides the most accurate estimation of prediction correctness to achieve an optimal trade-off between model performance and efficiency. We can observe that the oracle outperforms the backbone model and existing exiting strategies by a large margin in both model performance and inference speed, which indicates significant room for improving the estimation of prediction correctness. We believe that the global information offered by the sample population can reflect the latent class information of test samples, which can be utilized to estimate the correctness of early predictions. However, the aforementioned strategies primarily focus on local information (e.g., entropy, consistency, and label scores) from an individual test sample to formulate their early exiting indicators, while neglecting global information provided by the sample population. Hence, insufficient information exacerbates the difficulty of estimating prediction correctness, resulting in unreliable exiting decisions.
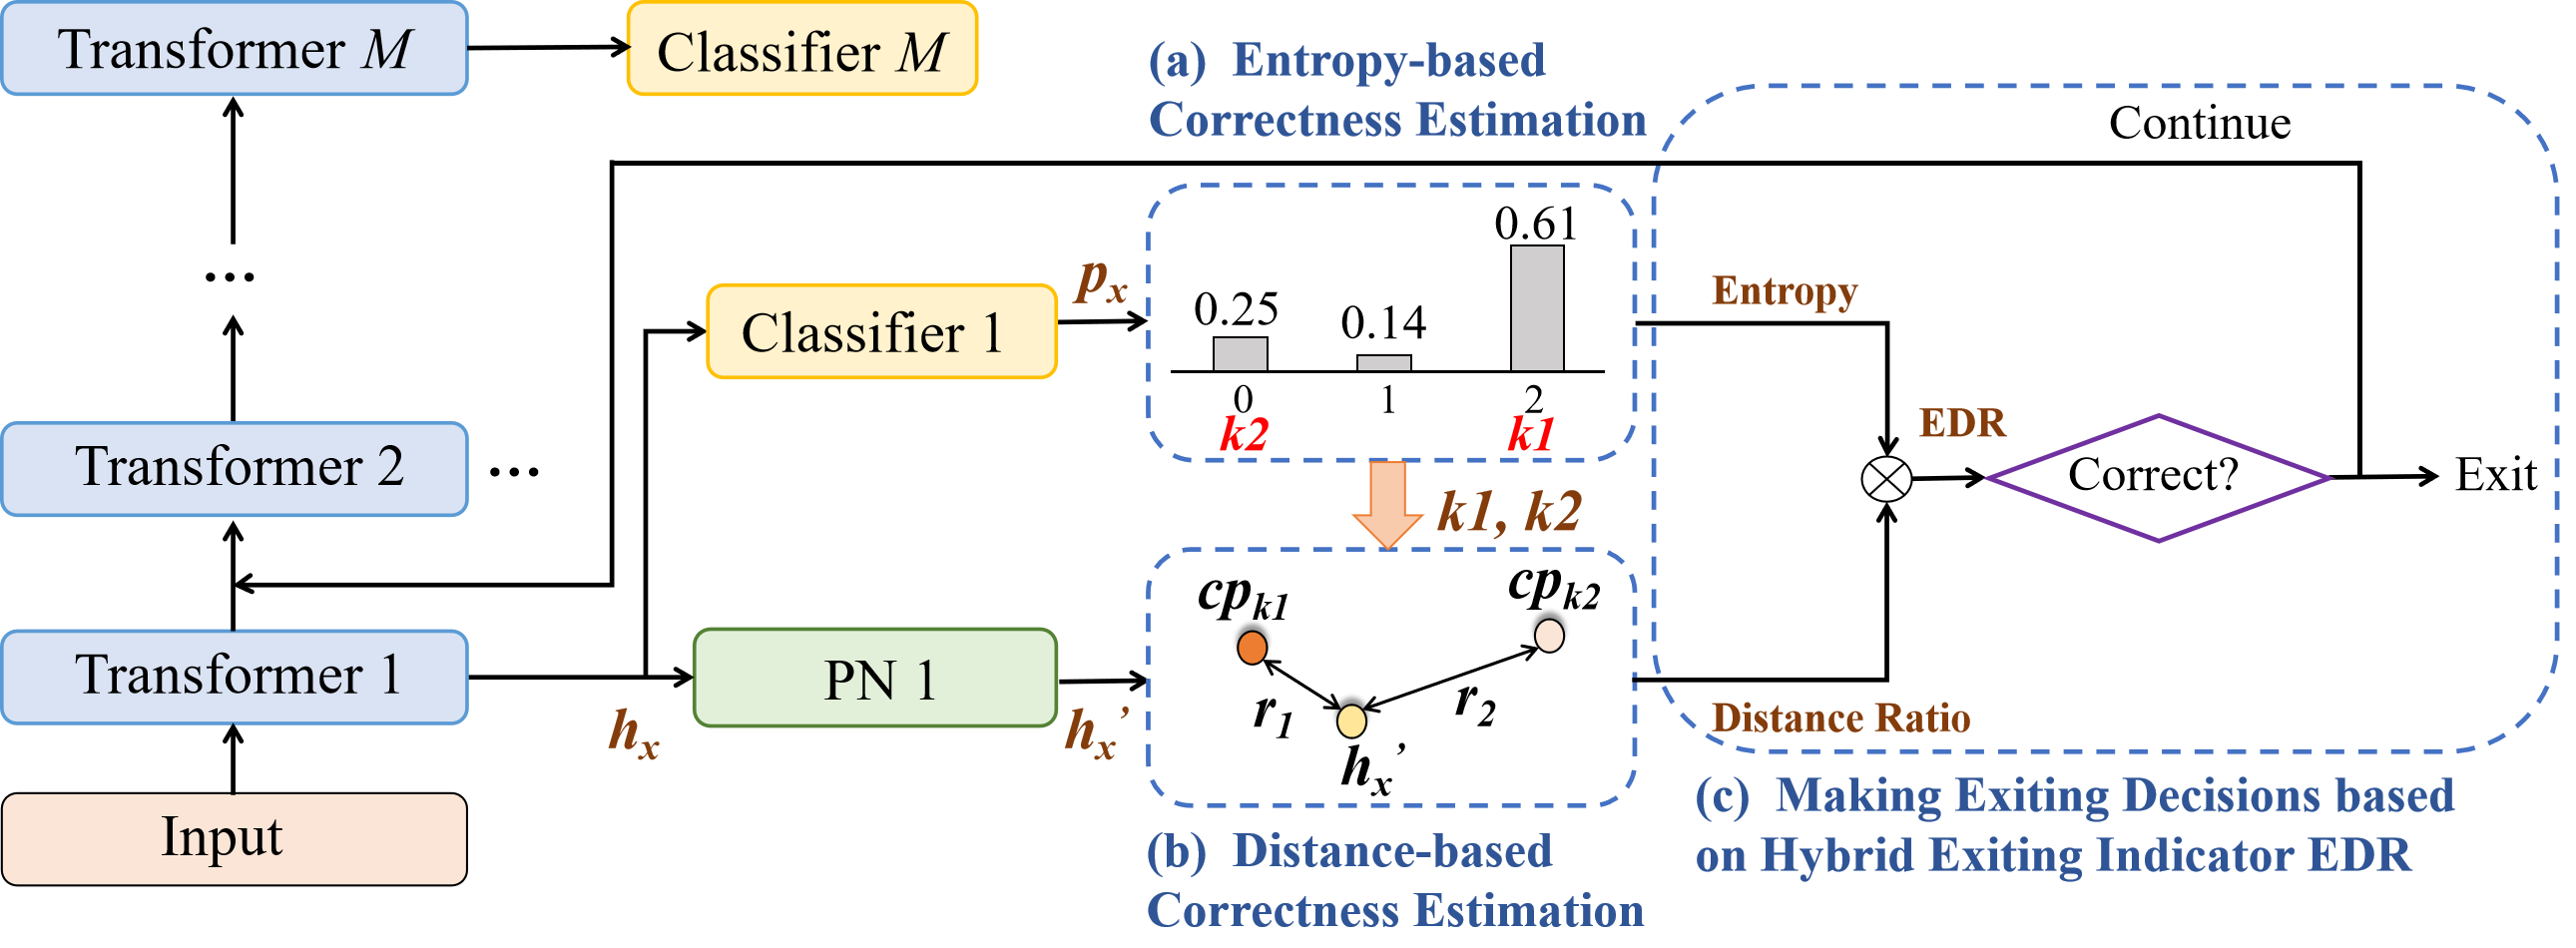
To bridge the gap, we explore the necessity of integrating both the local information from an individual test sample and the global information provided by the sample population to accurately estimate prediction correctness and formulate reliable early exiting during inference. Inspired by prototype learning [31] that involves learning class prototypes from a set of samples, we introduce a prototypical network paired with each internal classifier to learn class prototypes during training, as shown in Fig. 3LABEL:sub@fig:overview_ours. Then we devise a distance metric between samples and class prototypes to incorporate global information for estimating the correctness of early predictions. Accordingly, we propose a novel Distance-Enhanced Early Exiting framework for BERT models (DE3-BERT) based on prototypical networks. DE3-BERT leverages distance-based global information to enhance the classic entropy-based early exiting through information fusion. Concretely, in DE3-BERT, each prototypical network is implemented with a simple linear layer and is jointly trained with other components under an elaborate distance-aware regularization (DAR). During the inference stage, we calculate distance scores between samples and class prototypes as a form of global information, in conjunction with the classic entropy-based local information, to facilitate estimating prediction correctness for reliable early exiting. To achieve this, a harmonic indicator integrating the distance-based global information and the entropy-based local information is proposed to formulate a hybrid exiting strategy. Our main contributions can be summarized as follows.
-
•
We disclose that the performance limitation of existing early exiting methods primarily stems from the discrepancy between the exiting indicators and prediction correctness. We claim that this discrepancy arises from solely depending on local information from an individual test sample to make exiting decisions while neglecting the global information provided by the sample population.
-
•
We leverage prototypical networks to learn class prototypes and devise a distance metric between samples and class prototypes to incorporate global information for estimating the prediction correctness from a global perspective.
-
•
We propose a novel Distance-Enhanced Early Exiting framework for BERT (DE3-BERT) with a hybrid exiting strategy incorporating both the traditional entropy-based local information and the distance-based global information to facilitate the estimation of prediction correctness for making reliable exiting decisions.
-
•
Extensive experiments on the GLUE benchmark demonstrate that our DE3-BERT consistently outperforms state-of-the-art baselines under various speed-up ratios with minimal storage or computational overhead, yielding a superior trade-off between model performance and inference efficiency. Further analysis provides in-depth insights into the parameter sensitivity, the model’s interpretability and generality, storage and computational costs, as well as the contribution of each component.
The rest of this article is organized as follows. Section II provides a review of relevant work. Section III details our proposed DE3-BERT framework. Extensive experiments and in-depth analysis are given in Section IV and Section V, respectively. Section VI discusses the experimental results and limitations of our framework, as well as directions for future work. Section VII concludes this article.
II RELATED WORK
In this section, we review prior related works from three aspects, including static model compression, dynamic early exiting, and prototypical networks.
II-A Static Model Compression
Model compression effectively compresses large PLMs to speed up inference while the compressed models remain static for all samples during inference. Specifically, network pruning [6, 7, 8, 9, 10] involves removing unnecessary weights and connections from the network. Weight quantization [11, 12, 13] reduces the precision of weight representations to save the computational and storage overhead of the model. Knowledge distillation [14, 15, 16, 17] transfers knowledge from a larger teacher model to a smaller student model. Weight sharing [18, 19] achieves model compression by sharing weights across different network components. However, compared with early exiting, these methods are less flexible to meet varying acceleration conditions, requiring additional training costs for speed-up ratio adjustments.
II-B Dynamic Early Exiting
Early exiting, a parallel line of research for accelerating the inference of PLMs, is to dynamically stop inference for various input samples. DeeBERT [20], FastBERT [32], and RightTool [28] are pioneers in applying early exiting to accelerate the inference of BERT-style models. These studies employ the confidence level, such as entropy or label score of the prediction probability distribution, to estimate the correctness of early predictions for exit decision-making. On this basis, Lin et al. [33] extended confidence-based early exiting from classification tasks to sequence labeling tasks. To further improve the acceleration performance of early exiting models, one approach is to explore new exiting strategies for the inference stage. PABEE [21] uses the cross-layer consistency to determine early exiting. PCEE-BERT [23] employs a hybrid exiting strategy that combines confidence-based and patience-based strategies. BERxiT [22] learns to generate an exiting indicator that scores the correctness of early predictions. HASHEE [24] utilizes hash functions to assign each token to a fixed exiting layer, providing a novel static paradigm for early exiting. In addition, an alternative approach to improve acceleration performance is to strengthen the capability of internal classifiers through various techniques, such as model calibration, architecture refinement, and optimized training schemes. CascadeBERT [25] employs early exiting within multiple cascaded complete models, thus strengthening the representation capability of internal classifiers. Moreover, it formulates a difficulty-aware objective to calibrate the prediction probability distribution. LeeBERT [29] introduces a cross-layer distillation loss with learned weights to promote the training of internal classifiers. GPFEE [26] integrates both past and future states as inputs for each internal classifier, facilitating high-quality early predictions.
II-C Prototypical Networks
Prototypical networks are first proposed in [31], which enable the learning of class prototypes from a set of training samples to classify the test sample based on the distances between the test sample and these prototypes. Prototypical networks provide an effective framework to learn a metric space for classification, which have been widely applied in few-shot image classification [34, 35] and image recognition tasks [36]. In recent years, prototypical networks have been further extended to the field of natural language processing, demonstrating successful applications in few-shot relation classification [37, 38] and named entity recognition tasks [39]. Additionally, prototypical networks have proven to be effective in the field of speech processing, particularly for speech recognition tasks in low-resource scenarios [40]. Besides the few-shot learning domain, prototype networks have also been successfully applied to domain adaptation [41] and anomaly detection [42].
Despite significant efforts dedicated to early exiting methods, there is still ample potential for improvement. The existing early exiting approaches rely solely on local information from an individual test sample to determine when to exit, overlooking the valuable global information conveyed by the sample population. This limited perspective can impact the accuracy of prediction correctness estimation, leading to unreliable exiting decisions. In contrast, inspired by prototype learning, we propose to leverage prototypical networks to enhance the classic entropy-based early exiting by incorporating global information based on a distance metric between the test sample and class prototypes. Our framework comprehensively considers both entropy-based local information and distance-based global information to improve the estimation of prediction correctness, thereby achieving a better trade-off between model performance and efficiency.
III The DE3-BERT Framework
III-A Overview
III-A1 Problem Definition
Given a BERT-style model with layers, we denote the hidden states at the th layer as . To enable early exiting for the model’s inference on a classification task with classes, each of its intermediate layers is attached with an internal classifier to give an early prediction , i.e., a probability distribution over the classes.
III-A2 Framework Overview
We propose a novel Distance Enhanced Early Exiting framework for BERT models (DE3-BERT) based on the prototypical networks, which leverages the distance-based global information to enhance the classic entropy-based early exiting, aiming for reliable exiting decisions with sufficiently correct early predictions. Fig. 3LABEL:sub@fig:overview_ours provides an overview of our framework. Structurally, we first add one prototypical network (paired with one internal classifier) into each intermediate layer of BERT to learn class prototype representations. Each prototypical network consists of a simple linear layer that maps the hidden states of each layer to a metric space for distance calculation. We further propose distance-aware regularization (DAR) as the loss function to jointly train the prototypical networks with the BERT. Then, we devise a normalized distance ratio to provide global information for estimating the prediction correctness by calculating the distances between the sample representation and class prototypes. Finally, we propose a hybrid exiting strategy with a harmonic indicator that integrates both local information (entropy) and global information (distance ratio) to improve the estimation of prediction correctness.
III-B Training Scheme
III-B1 Update of Class Prototypes
Each intermediate layer owns a set of class prototypes, where each is updated using its corresponding class centroid through sliding average during training. Class centroids are obtained by averaging the sample representations class-by-class from each prototypical network separately. Accordingly, given the th layer with , the update strategy for its th class prototype representation is formulated:
| (1) |
where is to adjust the strength of the update, denotes the update step, and denote the class prototype and class centroid for the th class of the th layer, respectively.
III-B2 Distance-Aware Regularization
We introduce distance-aware regularization (DAR) to train the prototypical networks and learn class prototype representations. Incorporated with the Center Loss [43, 44] that minimizes the intra-class distances, DAR is formulated as the average distance between each sample representation and the prototype of its class:
| (2) |
where denotes the representation of the th sample derived from the th prototypical network, is the ground-truth label of the th sample, and is the number of samples. Note that the class prototypes are fixed when calculating DAR, i.e., no gradients back-propagating through .
In addition, we further consider two variants of DAR via incorporating with Alienation Loss and Combined Loss. The Alienation Loss is used to enlarge the difference between intra-class and inter-class distances. It is formulated as the average ratio between the distances from each sample to the prototype of its class and to the nearest prototype of a different class:
| (3) |
where denotes the number of layers, denotes the number of samples, denotes the ground-truth label for the th sample, denotes the distance from the th sample to its class prototype, and denotes the distance from the th sample to the nearest prototype of a different class. The Combined Loss is utilized to reduce the intra-class distance and increase the difference between the intra-class and inter-class distances, which is formulated as a weighted sum of Center Loss and Alienation Loss:
| (4) |
where , denotes the Center Loss, denotes the Alienation Loss, and is a hyper-parameter used to balance the two losses.
III-B3 Training Objective
The cross-entropy loss is used to train the internal classifiers. Accordingly, the loss of each intermediate layer is formulated as the weighted sum of the cross-entropy loss and DAR:
| (5) |
where , denotes the cross-entropy loss at the th layer, and is a hyper-parameter used to balance the cross-entropy loss and DAR. Since there is no need to exit early at the last layer, we minimize the cross-entropy loss for the classifier at the last (th) layer:
| (6) |
The total loss function is the weighted average of the losses across all layers:
| (7) |
where is the loss of the th layer. Following PABEE [21] and GPFEE [26], the weight of each layer is proportional to its layer number to balance parameter updates across shallow and deep layers. Neither prototypical networks nor internal classifiers share parameters across layers.
III-C Inference Strategy
Building upon the classic entropy-based exiting framework, we incorporate the class prototypes to deliver reliable early exiting by jointly considering local and global information to estimate the correctness of early predictions.
III-C1 Entropy-based Correctness Estimation
The entropy provides local information that reflects the model’s confidence level in its predictions for an individual test sample. Following previous works [20, 26, 23], we use the classic normalized entropy to estimate the correctness of early predictions:
| (8) |
where denotes the early prediction provided by the th internal classifier, i.e. the probability distribution over the classes, denotes the probability score of class suggested by the th internal classifier. The normalized entropy always falls between 0 and 1, and a lower entropy value indicates a higher confidence level of the internal classifier, typically leading to higher prediction correctness on the test sample.
III-C2 Distance-based Correctness Estimation
Apart from local information, we calculate the distances between the sample representation and class prototypes to provide global information for estimating the prediction correctness. Specifically, from the total classes, we select the classes with the highest two probability scores suggested by the th internal classifier and then compute the distances between the test sample and the prototypes of these two classes respectively:
| (9) |
where denotes the sample representation from the th prototypical network. and denote the prototypes of the classes with the highest and the second highest probability scores at the th layer, respectively, and denotes the cosine distance. Intuitively, if , it indicates a consistency with the early prediction, otherwise, it suggests a contradiction with the early prediction result. Therefore, we define a normalized distance ratio to describe the relative relationship between and , which can effectively reflect the correctness of early predictions:
| (10) |
The value of is between and . A lower value indicates a smaller relative to , suggesting a higher correctness of the early prediction. Since and effectively reflect the correctness of early predictions, we focus on these two distances and ignore the distances between the sample and prototypes of other classes for efficiency.
III-C3 Hybrid Exiting Strategy
Based on the above analysis, we propose a hybrid exiting strategy that integrates entropy and distance ratio. We argue the early predictions are sufficiently correct only when the estimation results of prediction correctness derived from both local and global information are sufficiently high. Therefore, we devise a hybrid exiting indicator to improve the estimation of prediction correctness through information fusion, which calculates the harmonic mean of entropy and distance ratio:
| (11) |
where is the normalized distance ratio, and is a parameter used to balance the two factors. The value is always between 0 and 1. A lower value indicates a higher correctness of early prediction from both global and local perspectives. Therefore, once the value falls below the predefined threshold , the inference process is terminated. The inference process of our DE3-BERT is summarized in Algorithm 1. For simplicity in expression, entropy and distance ratio mentioned in this paper refer to normalized values.
IV Experiments
In this section, we evaluate the DE3-BERT framework’s performance in accelerating inference on the GLUE benchmark. Additionally, we conduct ablation studies to demonstrate the effectiveness of each component within the framework.
IV-A Tasks and Datasets
We select six classification tasks from the GLUE benchmark [45] for experiments, including SST-2, MRPC, QNLI, RTE, QQP, and MNLI. We exclude the STS-B task since it is a regression task. Besides, following the previous studies in [22, 26, 20, 29], we also exclude the WNLI and CoLA tasks. The dataset statistics for all tasks are listed in Table I.
| Dataset | Classes | Train | Test | Task |
|---|---|---|---|---|
| SST-2 | 2 | 67k | 1.8k | Sentiment |
| MRPC | 2 | 3.7k | 1.7k | Paraphrase |
| QQP | 2 | 364k | 391k | Paraphrase |
| MNLI | 3 | 393k | 20k | NLI |
| QNLI | 2 | 105k | 5.4k | QA/NLI |
| RTE | 2 | 2.5k | 3k | NLI |
IV-B Baselines
We compare DE3-BERT with four groups of baselines:
-
•
Backbone: The original backbone provides a reference for all inference acceleration methods, with the speed-up ratio of . We choose the widely used BERT-base [2] as the backbone model for easy comparison.
-
•
Budget Exiting: We directly train a BERT-base with layers and denote it as BERT-L. We take and to obtain compressed models with the speed-up ratios of and , respectively. These two baselines enable the exit of all samples at a fixed layer, establishing a lower bound for dynamic early exiting methods as no techniques are employed.
-
•
Knowledge Distillation: We select several classic knowledge distillation methods as references, including DistilBERT [46], PD-BERT [47], BERT-PKD [48], and BERT-of-Theseus [49]. These methods leverage different distillation strategies to compress a 12-layer BERT-base model into a 6-layer version, achieving a speed-up ratio.
-
•
Early Exiting: We primarily include two groups of early exiting methods for comparison. The first group of baseline methods encompasses all existing exiting strategies, which serves to validate the effectiveness of our DE3-BERT framework. It includes the confidence-based strategy DeeBERT [20], the patience-based strategy PABEE [21], the learnable strategy BERxiT [22], and the hybrid strategy PCEE-BERT [23]. The second group includes orthogonal works relevant to our study, GPFEE [26] and LeeBERT [29], offering a benchmark for the performance gains achieved by our DE3-BERT within the broader early exiting community. Notably, different from our method which improves exiting strategies, these works focus on improving the training schemes or architectures of internal classifiers for reliable early exiting, addressing early exiting issues from different perspectives. Hence, comparisons with these orthogonal works may not fully reflect the effectiveness of our method.
For fair comparisons, HashEE [24] is not included since it employs a more fine-grained token-level early exiting method, whereas our method focuses on sentence-level early exiting. CascadeBERT [50] is also excluded from the comparison, as it implements early exiting within multiple cascaded complete models instead of a single model with multiple exits employed by our method.
More details about the above baselines can be found in Appendix A.
IV-C Experimental Settings
IV-C1 Speed Measurement
Since the actual runtime is unstable across different runs, following [23, 26], we manually adjust the threshold and calculate the corresponding speed-up ratio by comparing the number of executed layers during forward propagation and the total number of layers:
| (12) |
where is the total number of layers and is the number of samples exiting from the th layer. The rationality of this speed measurement is demonstrated in Appendix C-B.
IV-C2 Training
Our implementation is based on Hugging Face’s Transformers [51]. Both the internal classifiers and the prototypical networks are composed of a single linear layer. We choose Center Loss as DAR if not specified and cosine distance as the distance metric. Following the previous work [21, 23, 26], we perform a grid search over learning rates of {1e-5, 2e-5, 3e-5, 5e-5}, batch sizes of , and values in Equation (5) of (the impact of is explored in Section V-A). We set the value in Equation (1) as . The maximum sequence length is fixed at . We employ a linear decay learning rate scheduler and the AdamW [52] optimizer. We conduct experiments on one single RTX3090 GPU with 24GB.
IV-C3 Inference
Following the previous work [23, 26], we use a batch size of during inference, which simulates a common industry scenario where requests from different users arrive one by one. We select in Equation (11) from {0.667, 1.0, 1.5, 2.0, 3.0} for each task. The impact of is explored in Section V-A. We manually adjust the threshold for each task to achieve the speed-up ratios of and , respectively, and focus on the task performance of different methods under these two speed-up ratios.
| Method | MNLI | MRPC | QNLI | QQP | RTE | SST-2 | AVG | |
|---|---|---|---|---|---|---|---|---|
| Acc | F1/Acc | Acc | F1/Acc | Acc | Acc | |||
| BERT-base† | 84.6 (1.00) | 88.9/- (1.00) | 90.5 (1.00) | 71.2/- (1.00) | 66.4 (1.00) | 93.5 (1.00) | - | |
| 2 | BERT-6L | 80.8 (2.00) | 85.1/78.6 (2.00) | 86.7 (2.00) | 69.7/88.3 (2.00) | 63.9 (2.00) | 91.0 (2.00) | 80.5 |
| DeeBERT | 74.4 (1.87) | 84.4/77.4 (2.07) | 85.6 (2.09) | 70.4/88.8 (2.13) | 64.3 (1.95) | 90.2 (2.00) | 79.2 | |
| PABEE | 79.8 (2.07) | 84.4/77.4 (2.01) | 88.0 (1.87) | 70.4/88.6 (2.09) | 64.0 (1.81) | 89.3 (1.95) | 80.3 | |
| BERxiT‡ | 74.5 (2.06) | 84.3/77.2 (1.99) | 85.5 (1.98) | 70.2/88.5 (2.01) | 64.2 (1.97) | 90.2 (1.98) | 79.1 | |
| PCEE-BERT‡ | 81.0 (1.98) | 86.1/80.2 (2.02) | 87.9 (2.04) | 70.8/89.1 (2.02) | 65.7 (1.99) | 91.0 (2.04) | 81.5 | |
| GPFEE† | 83.3 (1.96) | 87.0/81.8 (1.98) | 89.8 (1.97) | 71.2/89.4 (2.18) | 64.5 (2.04) | 92.8 (2.02) | 82.5 | |
| LeeBERT† | 83.1 (1.97) | 87.1/- (1.97) | - | - | - | 92.6 (1.97) | - | |
| DE3-BERT (ours) | 83.2 (2.04) | 86.6/81.5 (1.98) | 90.0 (2.07) | 71.2/89.4 (2.16) | 65.7 (1.99) | 92.5 (2.02) | 82.6 | |
| 3 | BERT-4L | 77.6 (3.00) | 82.9/74.9 (3.00) | 85.4 (3.00) | 67.7/87.5 (3.00) | 63.0 (3.00) | 88.7 (3.00) | 78.5 |
| DeeBERT | 61.0 (2.80) | 83.5/75.5 (2.61) | 80.8 (2.88) | 66.1/86.9 (3.19) | 60.5 (2.90) | 84.7 (2.71) | 73.8 | |
| PABEE | 75.9 (2.70) | 82.6/73.1 (2.72) | 82.6 (3.04) | 69.5/88.2 (2.57) | 60.5 (2.38) | 85.2 (3.15) | 76.8 | |
| BERxiT‡ | 60.9 (3.01) | 83.4/75.4 (3.06) | 80.3 (2.89) | 64.3/86.2 (3.14) | 60.7 (2.87) | 84.5 (2.86) | 73.5 | |
| PCEE-BERT‡ | 77.8 (3.08) | 82.8/74.3 (2.98) | 85.6 (3.06) | 69.6/88.3 (2.96) | 63.1 (2.89) | 88.9 (2.92) | 78.8 | |
| GPFEE† | 78.4 (2.99) | 84.5/77.7 (2.87) | 87.3 (2.78) | 70.4/89.2 (3.16) | 63.0 (2.88) | 91.1 (2.97) | 80.1 | |
| DE3-BERT (ours) | 79.9 (2.99) | 83.8/76.5 (3.01) | 87.0 (3.02) | 70.6/89.3 (3.18) | 63.6 (2.97) | 91.4 (2.98) | 80.3 |
IV-D Overall Performance Comparison
In Table II, we report the classification performance of each early exiting method on the GLUE test sets under the speed-up ratios of 2.0 and 3.0, respectively. To make a fair comparison with the baseline methods, we carefully adjust the threshold to achieve similar speed-up ratios as the baseline methods, and then further compare their task performance. Overall, our method demonstrates a superior performance-efficiency trade-off in nearly all cases when compared to the baseline methods. Concretely, in the context of similar research that improves the exiting strategies during inference, namely BERT-L, DeeBERT [20], PABEE [21], BERxiT [22], and PCEE-BERT [23], our method consistently outperforms these baseline methods across all speed-up ratios by a clear margin, which verifies the effectiveness of our design. Besides, as the speed-up ratio increases, the performance of baseline methods drops dramatically, while the superiority of our method becomes more significant. For instance, under the 2.0 and 3.0 speed-up ratios, our DE3-BERT outperforms the state-of-the-art baseline PCEE-BERT [23] by 0.9 and 1.5 points on average across all tasks, respectively. This further indicates that through incorporating class prototypes, our framework can effectively enhance the reliability of exiting decisions, thereby yielding a better trade-off between model performance and efficiency. Notably, our method introduces minimal additional computational or storage costs (see Section V-C). Moreover, in the context of orthogonal works that improve the training schemes or architectures of internal classifiers, namely GPFEE [26] and LeeBERT [29], our method yields comparable results to these baselines. We believe that exploring the combination of our method and these orthogonal works would be an intriguing direction for further research, potentially further boosting the acceleration performance. Besides, we further examine the generality of our method on RoBERTa [3] in Section V-D. We also analyze the impact of different forms of DAR on the acceleration performance of our DE3-BERT framework. Please refer to Section V-G for more details.
| Method | MNLI | QNLI | QQP | SST-2 | AVG | |
|---|---|---|---|---|---|---|
| 2 | DistilBERT‡ | 81.9 | 88.2 | 88.4 | 92.1 | 87.7 |
| PD-BERT | 82.8 | 88.9 | 88.9 | 91.8 | 88.1 | |
| BERT-PKD | 81.5 | 89.0 | 88.9 | 92.0 | 87.9 | |
| BERT-of-Theseus | 82.4 | 89.6 | 89.3 | 92.2 | 88.4 | |
| DE3-BERT (ours) | 83.2 | 90.0 | 89.4 | 92.5 | 88.8 |
In addition, we compare DE3-BERT with several classic knowledge distillation methods in Table III. The experimental results consistently demonstrate the superiority of our method. Knowledge distillation methods achieve model compression by distilling the knowledge from a large teacher model to a more compact student model. However, during inference, the compressed model treats samples of different complexities equally, which leads to redundant computations. Instead, our DE3-BERT framework enables reliable early exiting through the incorporation of class prototypes. This allows an adaptive number of layers to be executed for each sample based on its complexity, which effectively avoids redundant computations and accelerates the model’s inference speed.
IV-E Ablation Studies
IV-E1 Effect of Distance Ratio
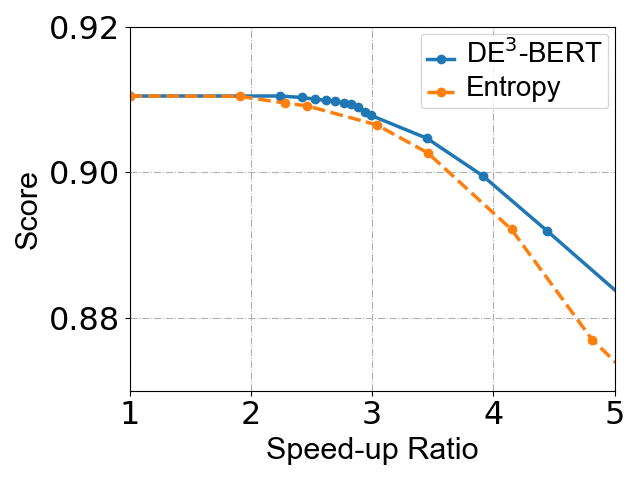
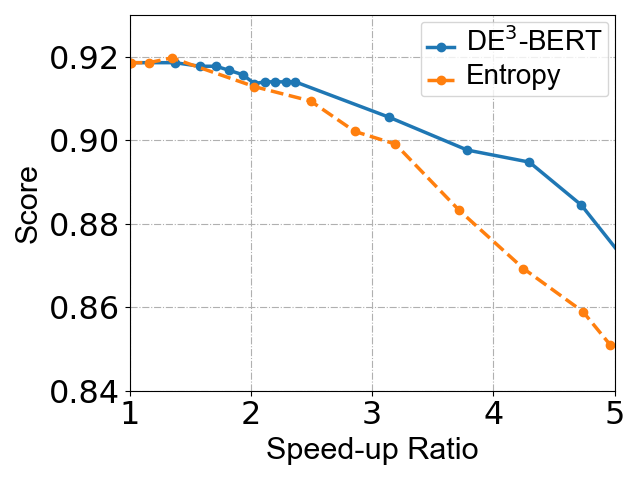
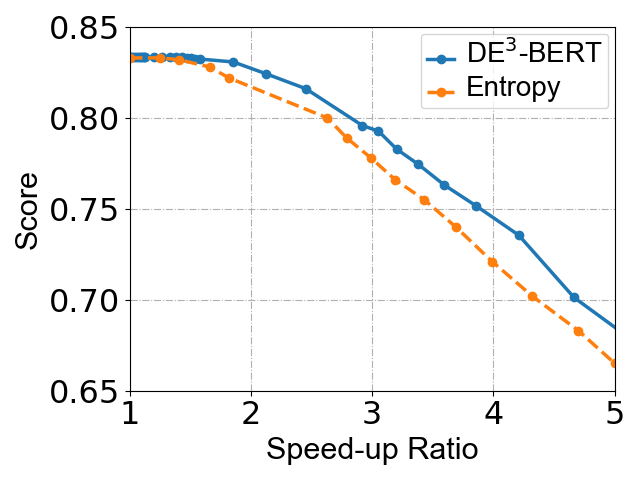
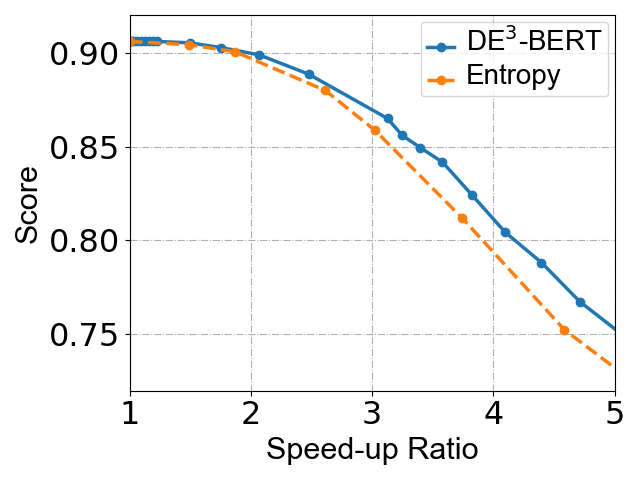
As mentioned in Section III-A, our DE3-BERT leverages the global information (distance ratio) to enhance the entropy-based early exiting. To further investigate the effect of distance ratio in exit decision-making, we conduct ablation studies on a representative subset of GLUE to compare the entropy-based exiting strategy with our hybrid exiting strategy. Note that these exiting strategies are applied to the same model trained as illustrated in Section III-B for each task. Consequently, the experimental results encompass the performance improvements brought by DAR, and our focus is solely on the effect of different exiting strategies employed during inference. Fig. 4 shows the performance-efficiency trade-off curves of different exiting strategies. As we can see, our hybrid exiting strategy consistently outperforms the entropy-based strategy by a clear margin under various speed-up ratios across all tasks, confirming the effectiveness of incorporating the distance ratio into the exit decision-making process. This suggests that the distance-based global information can effectively complement the entropy-based local information, which enhances the reliability of exiting decisions, achieving a better trade-off between model performance and inference efficiency. In addition, it is noticeable that the performance improvements brought by the distance ratio appear to be more significant under high speed-up ratios, which confirms the advantage of our DE3-BERT framework in high acceleration scenarios. We subsequently analyze the reasons for this observation through experiments. Please refer to Section V-B for details.
IV-E2 Effect of DAR and Prototypical Networks
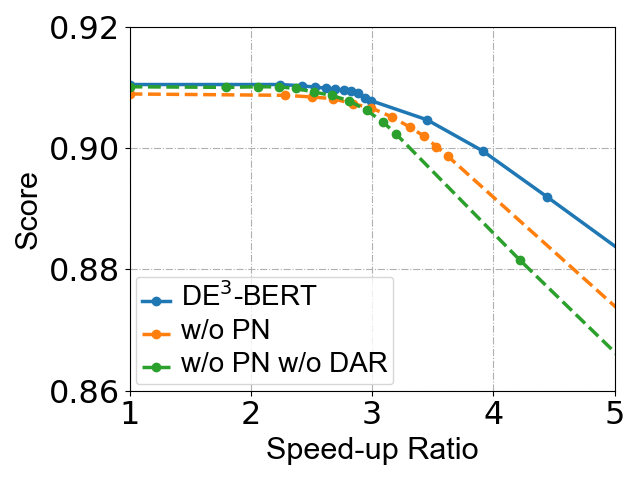
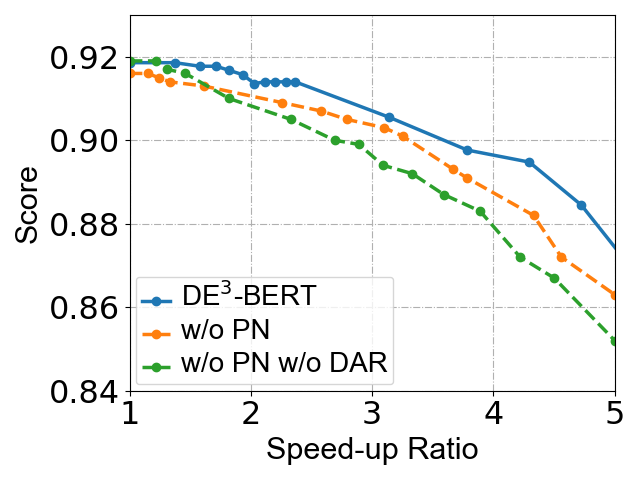
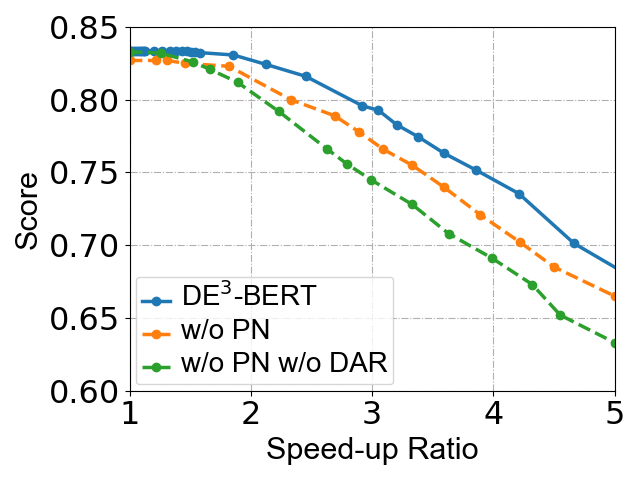
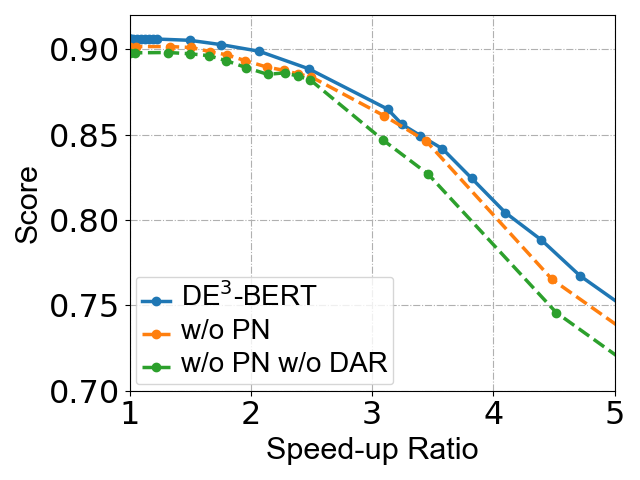
To investigate the effect of DAR and the prototypical networks, we plot the performance-efficiency trade-off curves of different models on a representative subset of GLUE, as shown in Fig. 5. All models adopt the proposed hybrid exiting strategy during inference. Implementation details can be found in Appendix B. We can see that removing either DAR or the prototypical networks causes significant performance degradation. The experimental results confirm the effectiveness of the prototypical networks and DAR in our framework, as they are indispensable for learning high-quality class prototype representations and metric space. This, in turn, plays a crucial role in accurately estimating the correctness of early predictions and making reliable exiting decisions. For DAR, the visualization results of sample representations demonstrate that our proposed DAR can effectively promote the learning of high-quality metric space and class prototype representations, which can be found in Section V-E. For the prototypical network, further correlation analysis experiments in Section V-F reveal that the introduction of prototypical networks effectively prevents the homogenization of entropy and distance ratio, facilitating their mutual correction.
V In-depth Analysis
In this section, we conduct an in-depth analysis of the parameter sensitivity, interpretability, storage and computational costs, generality, and the contribution of each component of our DE3-BERT model. Most experiments are conducted on a representative subset of GLUE, including MNLI, QNLI, QQP, and SST-2 tasks, to guarantee consistent and reliable results.
V-A Impact of and
In this section, we conduct experiments on two representative tasks, i.e., SST-2 and QNLI, to investigate the impact of two parameters: in Equation (11) and in Equation (5).
V-A1 Impact of
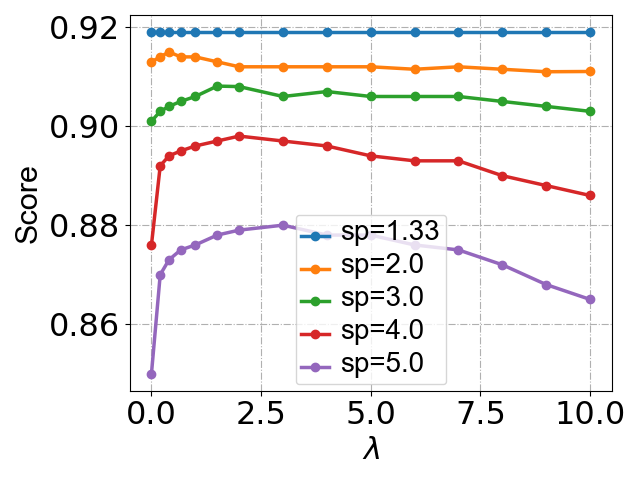
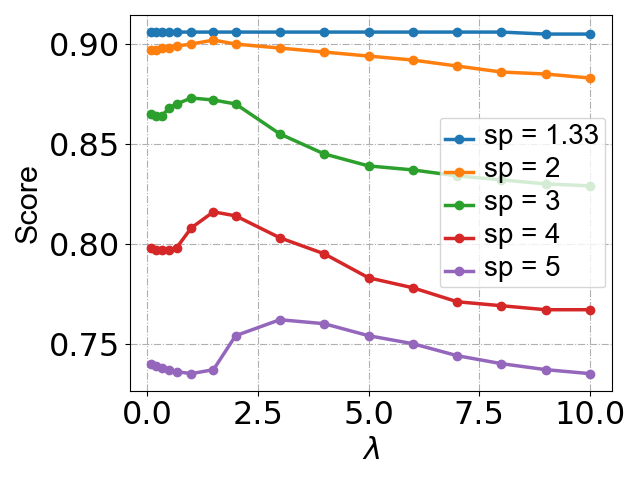
The parameter in Equation (11) balances the contribution of entropy (local information) and distance ratio (global information) in the exit decision-making process. A higher value of indicates a stronger emphasis on the distance ratio (global information). We train the models as illustrated in Section III-B with a fixed value: 0.1 for SST-2, and 0.001 for QNLI, and then evaluate the performance-efficiency trade-off under different values of during inference. Fig. 6 shows the impact of on task performance under different speed-up ratios. Note that the experimental results in Fig. 6 include the performance improvements brought by DAR, and we only focus on the impact of on the model’s acceleration performance during inference.
Overall, we observe that, as the value of increases, the task performance exhibits a consistent pattern of initially increasing and then decreasing under different speed-up ratios. This indicates that the incorporation of the distance ratio can consistently improve the acceleration performance of the model under various speed-up ratios. It also suggests an optimal trade-off between entropy and distance ratio. Additionally, it is noticeable that as the speed-up ratio increases, the optimal value of tends to increase, and compared to entropy-based exiting strategies (), the introduction of distance ratio yields more significant performance improvements. We believe that this observation can be attributed to the following reasons. Under high speed-up ratios, samples tend to exit at shallow layers (see Appendix C-A). The limited capability of shallow classifiers amplifies the gap between the confidence level reflected by entropy and the correctness of early predictions. This makes it crucial to introduce the distance ratio (global information) to improve the estimation of prediction correctness, thus enhancing the reliability of exiting decisions. Consequently, the performance gains brought by distance ratio tend to be more significant. This explanation is subsequently demonstrated through experiments, as detailed in Section V-B. Finally, for parameter selection, the optimal value differs across tasks and speed-up ratios, as shown in Fig. 6. Therefore, it is recommended to conduct a parameter search within the range between 0 and 10 according to specific scenarios.
V-A2 Impact of
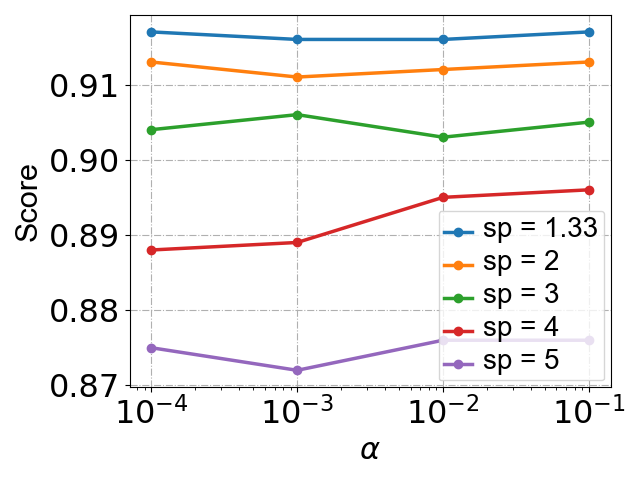
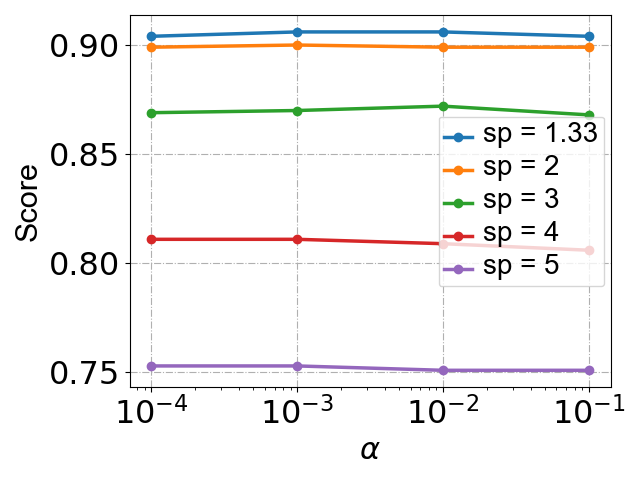
The parameter in Equation (5) balances the cross-entropy loss and DAR during training. A higher value of indicates a stronger emphasis on optimizing DAR. We train the models as illustrated in Section III-B, with values of {0.0001, 0.001, 0.01, 0.1}. During inference, the proposed hybrid exiting strategy is employed with a fixed value of 1.0 for SST-2 and 2.0 for QNLI. Fig. 7 shows the impact of on task performance under different speed-up ratios. It can be observed that the optimal value of differs across tasks and speed-up ratios, but the performance changes caused by different values are always less than 1, indicating that the acceleration performance is not significantly affected by selection. Moreover, an value between 0.0001 and 0.1 can always lead to satisfactory performance on different tasks.
V-B Accuracy of Prediction Correctness Estimation
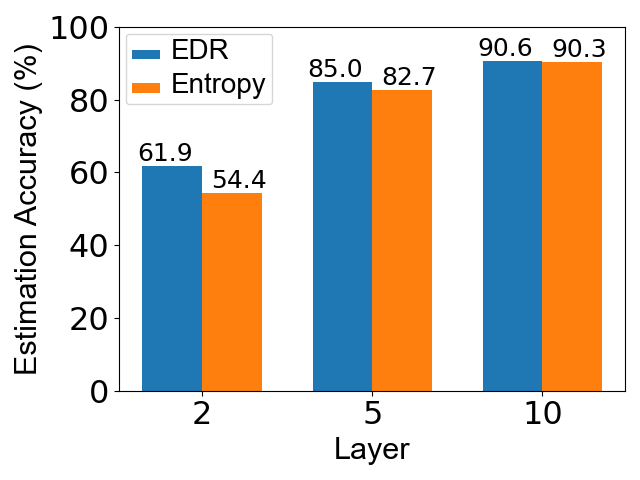
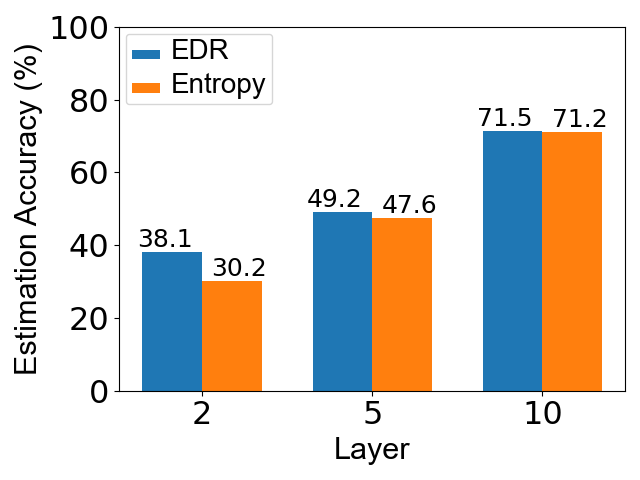
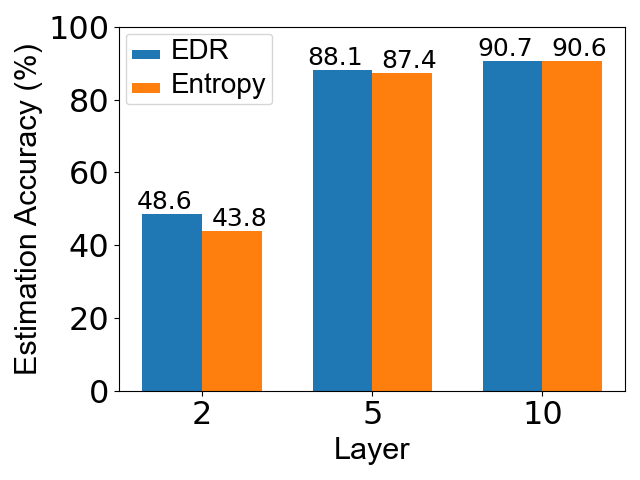
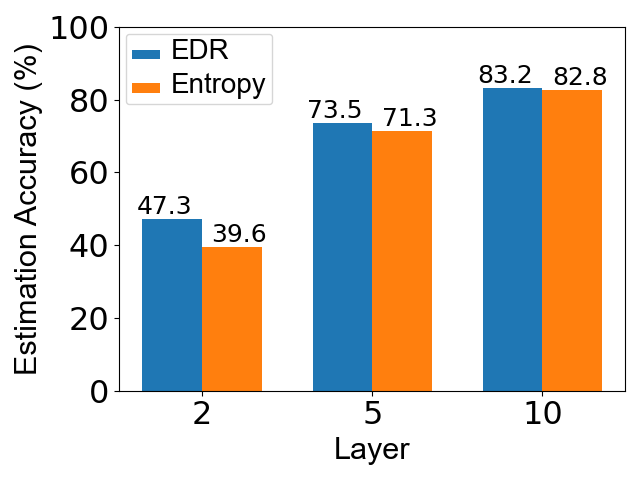
To further investigate the effect of distance ratio (global information) on the estimation of prediction correctness, we quantitatively analyze the estimation accuracy based on entropy and our hybrid exiting indicator ( value), respectively. Specifically, we first estimate the prediction correctness by comparing the entropy or value with the predefined threshold . An entropy or value below (above) the threshold indicates a correct (incorrect) early prediction. Then, we compare the early prediction with the sample’s ground-truth label to obtain the true value of prediction correctness. On this basis, we finally derive the accuracy of prediction correctness estimation. Fig. 8 shows the experimental results at the 2nd, 5th, and 10th layers on a representative subset of GLUE, where the threshold is set to 0.2.
Overall, we observe that the value consistently outperforms the entropy in estimating the correctness of early predictions across different layers and tasks. This demonstrates that distance-based global information can complement entropy-based local information, offering a more accurate estimation of prediction correctness. Additionally, it is noticeable that as the number of layers decreases, the accuracy of prediction correctness estimation based on both entropy and values tends to decline, and the introduction of distance ratio yields more significant improvements in estimating prediction correctness. We believe that this observation can be attributed to the following reasons. The limited representation capability of internal classifiers in shallow layers leads to insufficient local information based on entropy, exacerbating the difficulty of estimating prediction correctness. Consequently, compared to deeper layers, introducing distance ratio at shallow layers is particularly crucial for enhancing the accuracy of prediction correctness estimation. This, in turn, contributes to more reliable exiting decisions and better trade-offs between model performance and efficiency. This further explains our observations in Fig. 4 and Fig. 6, that as the speed-up ratio increases, the introduction of distance ratio tends to yield greater performance improvements.
Based on the above analysis, we can conclude that the introduction of the distance ratio can effectively improve the estimation of prediction correctness (especially for shallow layers), which further enhances the reliability of exiting decisions, leading to a better trade-off between model performance and inference efficiency.
V-C Storage and Computational Costs
V-C1 Parameter Volumes and Training Time Costs
Table IV presents the parameter volumes and training time costs of our DE3-BERT model and those of DeeBERT [20] for comparison. As shown in Table IV, compared to the classic entropy-based early exiting model DeeBERT, our DE3-BERT model requires only an additional 5.9 of parameters due to the incorporation of prototypical networks. Notably, the number of additional parameters is irrelevant to the number of classes, which is attributed that the introduced prototypical networks are -agnostic. Furthermore, despite additional parameters, the training time costs are not significantly increased and are even reduced in some tasks such as MRPC and QQP. This is attributed that the additional supervision provided by DAR accelerates the model convergence during training. Therefore, our method can achieve a better trade-off between model performance and efficiency during inference with minimal additional parameters and comparable training time costs, compared to the classic entropy-based early exiting model.
| Model | Params | Training Time (min) | ||||||
|---|---|---|---|---|---|---|---|---|
| MRPC | SST-2 | QQP | MNLI | |||||
| DeeBERT | 109.50M | 109.51M | 1.3 | 34 | 304 | 163 | ||
| DE3-BERT (ours) | 6.50M | 6.50M | 0.95 | 44 | 293 | 165 | ||
V-C2 Computational Complexity
Table V shows each module’s computational complexity within the DE3-BERT model. We can observe that, due to the substantial self-attention operations, the computational complexity of each encoder block is 1813.5M, comprising the major part of the model’s computational costs. In contrast, the computational complexity of each prototypical network is only 1.2M, leading to a 0.066 increase in computational costs per layer. Consequently, the incorporation of prototypical networks can enhance the reliability of exiting decisions with negligible additional computational costs arising from distance calculation. Moreover, it can be observed that the additional computational costs provided by prototypical networks are irrelevant to the number of classes , indicating that the prototypical networks are -agnostic. Furthermore, as shown in Table V, the computational complexity of an encoder block significantly surpasses that of other modules. Therefore, we can draw a conclusion that the model’s computational costs during inference are approximately proportional to the number of executed layers, confirming the rationality of the speed measurement illustrated in Equation (12). Further exploration of this point is provided in Appendix C-B.
| Module | FLOPs | |
|---|---|---|
| Embedding | 786.4K | 786.4K |
| Encoder | 1813.5M | 1813.5M |
| Pooler | 1.2M | 1.2M |
| Prediction Head | 3.1K | 4.6K |
| Prototypical Network | 1.2M | 1.2M |
| Internal Classifier | 3.1K | 4.6K |
V-D Generality on Different PLMs
To investigate the generality of our method on different PLMs, we conduct experiments on a representative subset of GLUE with RoBERTa [3] as the backbone model. RoBERTa is an optimized PLM based on the BERT architecture. Compared to BERT, RoBERTa utilizes more training data, larger batch sizes, and better training strategies, leading to improved performance. Table VI shows the classification performance of each early exiting method under the speed-up ratio 3.0. We can observe that our method outperforms all competing early exiting methods in general, demonstrating its potential as a generic method for accelerating the inference of different types of PLMs.
| Method | MNLI | QNLI | QQP | SST-2 | AVG |
|---|---|---|---|---|---|
| RoBERTa-base | 87.0 | 92.4 | 71.8 | 94.3 | 86.4 |
| RoBERTa-4L | 80.3 | 86.2 | 69.8 | 90.8 | 81.8 |
| DeeBERT | 53.9 | 77.2 | 67.6 | 88.6 | 71.8 |
| PABEE | 74.0 | - | - | 87.5 | - |
| GPFEE† | 81.4 | 89.2 | 71.9 | 93.5 | 84.0 |
| DE3-RoBERTa (ours) | 83.1 | 89.3 | 71.6 | 93.7 | 84.4 |
V-E Visualization of Sample Representations
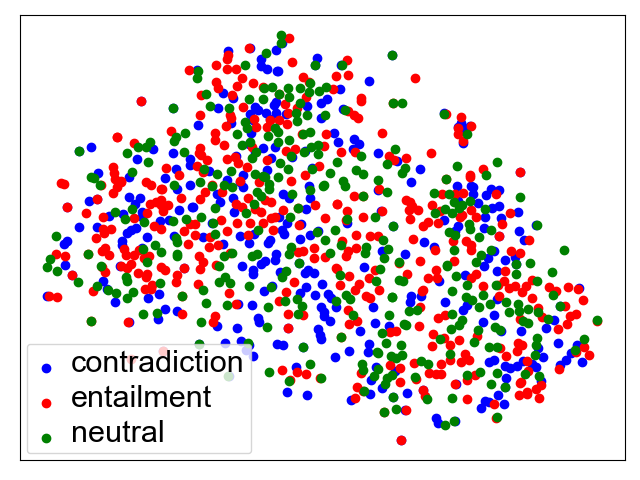
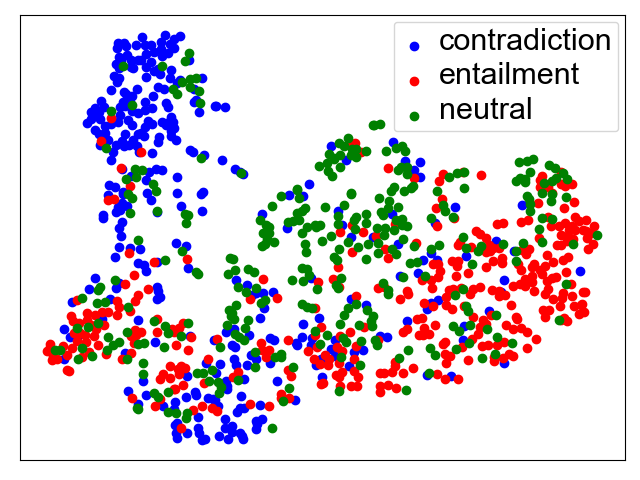
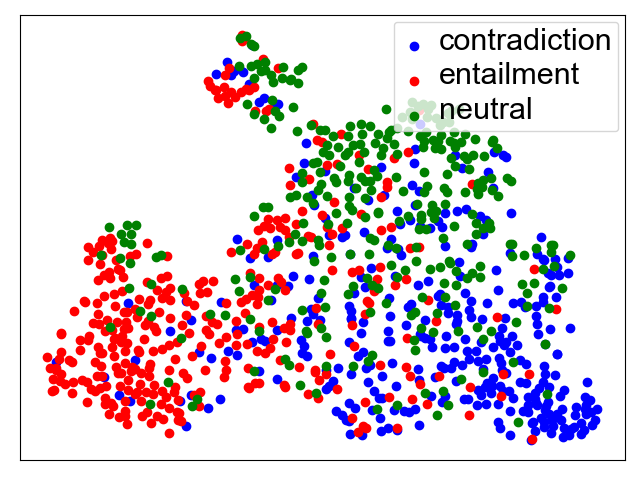
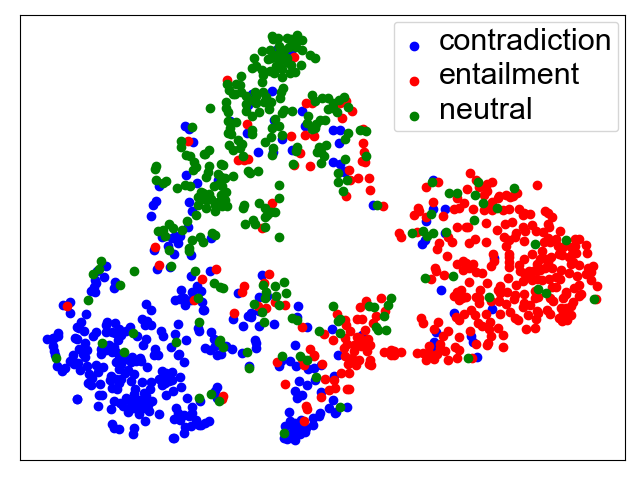
To verify whether DAR facilitates the learning of metric space and class prototype representations, we use the t-SNE projection [54] to visualize the sample representations generated by the prototypical networks of the DE3-BERT model. For comparison, we train a variant (denoted by DE3-BERT w/o DAR) of the DE3-BERT model using only cross-entropy loss and visualize the sample representations obtained by pooling the hidden states of encoder layers (i.e., inputs to internal classifiers). Fig. 9 shows the visualization results on layers 2 and 5 of the two models on the MNLI development set. We can observe that, on both layers 2 and 5, DAR encourages clearer classification boundaries between different classes. This indicates that DAR can facilitate the learning of high-quality metric space and class prototype representations, which is crucial for accurately estimating the prediction correctness and making reliable exiting decisions, as shown in Fig. 5.
V-F Additional Effect of Prototypical Networks
As mentioned in Section III-A, the main purpose of introducing the prototypical networks is to learn the class prototype representations and the associated metric space. Additionally, we believe that the introduction of prototypical networks can help avoid the homogeneity issue between entropy and distance ratio since they are computed in different representation spaces. This enables them to mutually correct each other. To verify our claim, we analyze the Spearman correlation coefficient between the entropy and distance ratio of our DE3-BERT models with and without prototypical networks, respectively. Concretely, we train a variant (denoted by DE3-BERT w/o PN) of our DE3-BERT model as illustrated in Section III-B. The computation of DAR terms and the updating of class prototype representations during training, as well as the calculation of distance ratios during inference, are all based on the sample representations obtained by pooling the hidden states of encoder layers (i.e., inputs to internal classifiers). We then analyze the Spearman correlation coefficient between the entropy and distance ratio of this variant and the full DE3-BERT model. Table VII illustrates the analysis results on a representative subset of GLUE based on the model outputs at the second layer. The results indicate a significant increase in correlation between entropy and distance ratio when the prototypical networks are removed. These results are consistent with the results shown in Fig. 5 that removing the prototypical networks impairs the acceleration performance of the model, which further confirms that the prototypical networks can effectively avoid the homogeneity between entropy and distance ratio, thus enhancing their integration.
| Model | QQP | MNLI | SST-2 | QNLI |
|---|---|---|---|---|
| DE3-BERT | 0.207 | 0.018 | 0.145 | 0.066 |
| DE3-BERT w/o PN | 0.569 | 0.389 | 0.479 | 0.422 |
V-G Experimental Results of Different DAR Forms
Table VIII shows the performance comparison of different DAR forms on the GLUE development sets under various speed-up ratios. Overall, the experimental results show that different forms of DAR yield comparable results, which confirms the generality of our framework across various metric learning methods. Specifically, as the speed-up ratio increases, Center Loss exhibits a slight advantage over the other two DAR forms in terms of performance degradation, yielding a better trade-off between model performance and efficiency, although the performance gaps are not significant. We speculate that this is caused by the conflicting optimization of Alienation Loss and cross-entropy loss during the training phase. Concretely, both Alienation Loss and cross-entropy loss have the effect of enlarging the difference between intra-class and inter-class distances, but their different implementation mechanisms lead to conflicting optimization during training. As a result, this affects the learning of metric space and class prototype representations, which ultimately compromises the acceleration performance of the model. In contrast, Center Loss, which aims to reduce intra-class distances, is better suited to cross-entropy loss. This facilitates the learning of high-quality metric space and class prototype representations, thus improving the acceleration performance of the model. Therefore, considering the above analysis and the computational efficiency, we primarily use Center Loss in DAR.
| Method | MNLI | MRPC | QNLI | QQP | RTE | SST-2 | AVG | |
| (393K) | (3.7K) | (105K) | (364K) | (2.5K) | (67K) | |||
| BERT- | 83.5 (1.00) | 87.5 (1.00) | 91.2 (1.00) | 89.8 (1.00) | 71.1 (1.00) | 91.5 (1.00) | 85.8 | |
| 1.33 | DE3-BERT | 83.4 (1.41) | 88.0 (1.36) | 90.6 (1.39) | 91.1 (1.38) | 69.5 (1.45) | 91.8 (1.34) | 85.7 |
| DE3-BERT-v2 | 83.2 (1.39) | 87.1 (1.38) | 91.1 (1.38) | 91.1 (1.37) | 69.8 (1.44) | 91.9 (1.33) | 85.7 | |
| DE3-BERT-v3 | 83.2 (1.41) | 87.3 (1.34) | 91.1 (1.39) | 91.2 (1.39) | 69.7 (1.42) | 91.8 (1.32) | 85.8 | |
| 2 | DE3-BERT | 82.7 (2.13) | 85.3 (2.13) | 90.0 (2.18) | 91.1 (2.06) | 69.6 (1.99) | 91.3 (1.96) | 85.0 |
| DE3-BERT-v2 | 82.7 (2.14) | 84.6 (2.15) | 90.3 (2.17) | 91.1 (1.98) | 69.7 (2.07) | 91.5 (1.99) | 84.9 | |
| DE3-BERT-v3 | 82.6 (2.13) | 85.1 (2.13) | 90.1 (2.18) | 91.2 (1.99) | 69.7 (1.99) | 91.4 (2.02) | 85.0 | |
| 4 | DE3-BERT | 73.8 (4.37) | 79.2 (4.35) | 81.1 (4.02) | 88.0 (5.52) | 60.4 (4.38) | 89.6 (4.36) | 78.7 |
| DE3-BERT-v2 | 74.0 (4.38) | 81.6 (4.36) | 80.5 (4.05) | 87.4 (5.50) | 58.5 (4.37) | 89.3 (4.35) | 78.6 | |
| DE3-BERT-v3 | 74.0 (4.36) | 80.3 (4.36) | 80.7 (3.97) | 87.5 (5.54) | 58.8 (4.35) | 89.4 (4.37) | 78.5 |
VI Discussion
VI-A Discussion of Experimental Results
In our study, we investigate the impact of integrating distance-based global information into the exit decision-making process. Accordingly, we introduce the distance ratio (global information) into the classic entropy-based early exiting method. Our experimental results indicate that incorporating the distance ratio can effectively improve the estimation of prediction correctness. This further facilitates more reliable exiting decisions, yielding a better trade-off between model performance and efficiency. Specifically, the performance improvements attributed to the distance ratio appear to be more significant in high acceleration scenarios.
In general, the experimental results demonstrate our hypothesis that the performance bottleneck of existing early exiting methods primarily stems from their exclusive reliance on local information from an individual test sample to make exiting decisions, while overlooking the global information provided by the sample population. We believe that the latent class information of a test sample can be reflected by its distances from class prototypes, which can effectively complement the entropy-based local information and improve the accuracy of prediction correctness estimation from a global perspective. In this way, the proposed DE3-BERT approximates the behavior of the oracle, thus achieving a better trade-off between model performance and efficiency. Furthermore, the limited representation capability of shallow internal classifiers leads to insufficient local information based on entropy, which emphasizes the importance of introducing global information. This explains the superiority of our hybrid exiting strategy in high acceleration scenarios.
Our study provides a new perspective on estimating the prediction correctness for early exiting models, which inspires facilitating reliable exiting decisions by integrating distance-based global information.
VI-B Limitations and Future Work
For further research in the near future, we comprehensively discuss the limitations of this work from three perspectives. Firstly, our DE3-BERT framework caters to classification tasks only since DE3-BERT incorporates the distance ratio that requires the prototype representations of all classes, which is unavailable for other non-classification tasks. One of our future studies is to extend our DE3-BERT framework to more sophisticated regression tasks by training a neural network to map continuous regression values to their corresponding prototype representations. Secondly, our framework DE3-BERT improves the entropy-based early exiting by transferring knowledge from the training set to the test set via class prototypes, assuming that the distribution is identical between the training and test data, i.e., in-distribution generalization. The out-of-distribution case brings extreme challenges to DE3-BERT, which is worth further research and exploration. Finally, different from our DE3-BERT which focuses on improving the exiting strategies, some research, such as CascadeBERT [50], GPFEE [26], and LeeBERT [29], primarily address different issues of early exiting, including training schemes, model architecture, and model calibration. Exploring the combination of our DE3-BERT with the aforementioned methods would be an interesting endeavor, as it contributes to further enhancing the acceleration performance of early exiting models by investigating the potential orthogonality and complementarity between different techniques.
VII Conclusion
In this article, we point out that the performance limitation of existing early exiting methods primarily lies in their excessive focus on local information from an individual test sample while neglecting the global information offered by the sample population, which compromises the estimation of prediction correctness, leading to erroneous exiting decisions. To remedy this, we propose the DE3-BERT framework, which leverages prototypical networks to provide distance-based global information, improving the estimation of prediction correctness for reliable early exiting. Our framework is both intuitive and interpretable. Extensive experiments on the GLUE benchmark demonstrate the superiority of our framework under various speed-up ratios with minimal additional storage and computational costs. Further analysis also validates our framework’s interpretability, insensitivity to parameters, and generality on different PLMs.
References
- [1] A. Radford, J. Wu, R. Child, D. Luan, D. Amodei, I. Sutskever et al., “Language models are unsupervised multitask learners,” OpenAI blog, vol. 1, no. 8, p. 9, 2019.
- [2] J. Devlin, M. Chang, K. Lee, and K. Toutanova, “BERT: pre-training of deep bidirectional transformers for language understanding,” in NAACL-HLT (1). Association for Computational Linguistics, 2019, pp. 4171–4186.
- [3] Y. Liu, M. Ott, N. Goyal, J. Du, M. Joshi, D. Chen, O. Levy, M. Lewis, L. Zettlemoyer, and V. Stoyanov, “Roberta: A robustly optimized BERT pretraining approach,” CoRR, vol. abs/1907.11692, 2019.
- [4] Z. Lan, M. Chen, S. Goodman, K. Gimpel, P. Sharma, and R. Soricut, “ALBERT: A lite BERT for self-supervised learning of language representations,” in ICLR. OpenReview.net, 2020.
- [5] Y. Kaya, S. Hong, and T. Dumitras, “Shallow-deep networks: Understanding and mitigating network overthinking,” in ICML, ser. Proceedings of Machine Learning Research, vol. 97. PMLR, 2019, pp. 3301–3310.
- [6] S. Han, J. Pool, J. Tran, and W. J. Dally, “Learning both weights and connections for efficient neural network,” in NIPS, 2015, pp. 1135–1143.
- [7] A. Fan, E. Grave, and A. Joulin, “Reducing transformer depth on demand with structured dropout,” in ICLR. OpenReview.net, 2020.
- [8] M. A. Gordon, K. Duh, and N. Andrews, “Compressing BERT: studying the effects of weight pruning on transfer learning,” in RepL4NLP@ACL. Association for Computational Linguistics, 2020, pp. 143–155.
- [9] E. Kurtic, D. Campos, T. Nguyen, E. Frantar, M. Kurtz, B. Fineran, M. Goin, and D. Alistarh, “The optimal BERT surgeon: Scalable and accurate second-order pruning for large language models,” in EMNLP. Association for Computational Linguistics, 2022, pp. 4163–4181.
- [10] M. Xia, Z. Zhong, and D. Chen, “Structured pruning learns compact and accurate models,” in ACL (1). Association for Computational Linguistics, 2022, pp. 1513–1528.
- [11] D. D. Lin, S. S. Talathi, and V. S. Annapureddy, “Fixed point quantization of deep convolutional networks,” in ICML, ser. JMLR Workshop and Conference Proceedings, vol. 48. JMLR.org, 2016, pp. 2849–2858.
- [12] S. Shen, Z. Dong, J. Ye, L. Ma, Z. Yao, A. Gholami, M. W. Mahoney, and K. Keutzer, “Q-BERT: hessian based ultra low precision quantization of BERT,” in AAAI. AAAI Press, 2020, pp. 8815–8821.
- [13] Y. Xiao, P. P. Liang, U. Bhatt, W. Neiswanger, R. Salakhutdinov, and L. Morency, “Uncertainty quantification with pre-trained language models: A large-scale empirical analysis,” in EMNLP (Findings). Association for Computational Linguistics, 2022, pp. 7273–7284.
- [14] G. E. Hinton, O. Vinyals, and J. Dean, “Distilling the knowledge in a neural network,” CoRR, vol. abs/1503.02531, 2015.
- [15] X. Jiao, Y. Yin, L. Shang, X. Jiang, X. Chen, L. Li, F. Wang, and Q. Liu, “Tinybert: Distilling BERT for natural language understanding,” in EMNLP (Findings), ser. Findings of ACL, vol. EMNLP 2020. Association for Computational Linguistics, 2020, pp. 4163–4174.
- [16] C. Liu, C. Tao, J. Feng, and D. Zhao, “Multi-granularity structural knowledge distillation for language model compression,” in ACL (1). Association for Computational Linguistics, 2022, pp. 1001–1011.
- [17] M. Li, F. Ding, D. Zhang, L. Cheng, H. Hu, and F. Luo, “Multi-level distillation of semantic knowledge for pre-training multilingual language model,” in EMNLP. Association for Computational Linguistics, 2022, pp. 3097–3106.
- [18] M. Reid, E. Marrese-Taylor, and Y. Matsuo, “Subformer: Exploring weight sharing for parameter efficiency in generative transformers,” in EMNLP (Findings). Association for Computational Linguistics, 2021, pp. 4081–4090.
- [19] C. Liang, P. He, Y. Shen, W. Chen, and T. Zhao, “CAMERO: consistency regularized ensemble of perturbed language models with weight sharing,” in ACL (1). Association for Computational Linguistics, 2022, pp. 7162–7175.
- [20] J. Xin, R. Tang, J. Lee, Y. Yu, and J. Lin, “Deebert: Dynamic early exiting for accelerating BERT inference,” in ACL. Association for Computational Linguistics, 2020, pp. 2246–2251.
- [21] W. Zhou, C. Xu, T. Ge, J. J. McAuley, K. Xu, and F. Wei, “BERT loses patience: Fast and robust inference with early exit,” in NeurIPS, 2020.
- [22] J. Xin, R. Tang, Y. Yu, and J. Lin, “Berxit: Early exiting for BERT with better fine-tuning and extension to regression,” in EACL. Association for Computational Linguistics, 2021, pp. 91–104.
- [23] Z. Zhang, W. Zhu, J. Zhang, P. Wang, R. Jin, and T. Chung, “PCEE-BERT: accelerating BERT inference via patient and confident early exiting,” in NAACL-HLT (Findings). Association for Computational Linguistics, 2022, pp. 327–338.
- [24] T. Sun, X. Liu, W. Zhu, Z. Geng, L. Wu, Y. He, Y. Ni, G. Xie, X. Huang, and X. Qiu, “A simple hash-based early exiting approach for language understanding and generation,” in ACL (Findings). Association for Computational Linguistics, 2022, pp. 2409–2421.
- [25] L. Li, Y. Lin, D. Chen, S. Ren, P. Li, J. Zhou, and X. Sun, “Cascadebert: Accelerating inference of pre-trained language models via calibrated complete models cascade,” in Findings of the Association for Computational Linguistics: EMNLP 2021, 2021, pp. 475–486.
- [26] K. Liao, Y. Zhang, X. Ren, Q. Su, X. Sun, and B. He, “A global past-future early exit method for accelerating inference of pre-trained language models,” in NAACL-HLT. Association for Computational Linguistics, 2021, pp. 2013–2023.
- [27] W. Liu, X. Zhao, Z. Zhao, Q. Ju, X. Yang, and W. Lu, “An empirical study on adaptive inference for pretrained language model,” IEEE Transactions on Neural Networks and Learning Systems, 2021.
- [28] R. Schwartz, G. Stanovsky, S. Swayamdipta, J. Dodge, and N. A. Smith, “The right tool for the job: Matching model and instance complexities,” in ACL. Association for Computational Linguistics, 2020, pp. 6640–6651.
- [29] W. Zhu, “Leebert: Learned early exit for bert with cross-level optimization,” in Proceedings of the 59th Annual Meeting of the Association for Computational Linguistics and the 11th International Joint Conference on Natural Language Processing (Volume 1: Long Papers), 2021, pp. 2968–2980.
- [30] Z. Zhao, L. Cao, and K.-Y. Lin, “Revealing the distributional vulnerability of discriminators by implicit generators,” IEEE Transactions on Pattern Analysis and Machine Intelligence, 2022.
- [31] J. Snell, K. Swersky, and R. Zemel, “Prototypical networks for few-shot learning,” Advances in neural information processing systems, vol. 30, 2017.
- [32] W. Liu, P. Zhou, Z. Wang, Z. Zhao, H. Deng, and Q. Ju, “Fastbert: a self-distilling BERT with adaptive inference time,” in ACL. Association for Computational Linguistics, 2020, pp. 6035–6044.
- [33] X. Li, Y. Shao, T. Sun, H. Yan, X. Qiu, and X. Huang, “Accelerating bert inference for sequence labeling via early-exit,” arXiv preprint arXiv:2105.13878, 2021.
- [34] S. Huang, X. Zeng, S. Wu, Z. Yu, M. Azzam, and H.-S. Wong, “Behavior regularized prototypical networks for semi-supervised few-shot image classification,” Pattern Recognition, vol. 112, p. 107765, 2021.
- [35] B. Xi, J. Li, Y. Li, R. Song, Y. Xiao, Q. Du, and J. Chanussot, “Semisupervised cross-scale graph prototypical network for hyperspectral image classification,” IEEE Transactions on Neural Networks and Learning Systems, 2022.
- [36] R.-Q. Wang, X.-Y. Zhang, and C.-L. Liu, “Meta-prototypical learning for domain-agnostic few-shot recognition,” IEEE Transactions on Neural Networks and Learning Systems, vol. 33, no. 11, pp. 6990–6996, 2021.
- [37] Y. Xiao, Y. Jin, and K. Hao, “Adaptive prototypical networks with label words and joint representation learning for few-shot relation classification,” IEEE Transactions on Neural Networks and Learning Systems, 2021.
- [38] G. Yin, X. Wang, H. Zhang, and J. Wang, “Cost-effective cnns-based prototypical networks for few-shot relation classification across domains,” Knowledge-Based Systems, vol. 253, p. 109470, 2022.
- [39] Y. Huang, W. Lei, J. Fu, and J. Lv, “Reconciliation of pre-trained models and prototypical neural networks in few-shot named entity recognition,” arXiv preprint arXiv:2211.03270, 2022.
- [40] N. Shashaank, B. Banar, M. R. Izadi, J. Kemmerer, S. Zhang, and C.-C. J. Huang, “Hissnet: Sound event detection and speaker identification via hierarchical prototypical networks for low-resource headphones,” in ICASSP 2023-2023 IEEE International Conference on Acoustics, Speech and Signal Processing (ICASSP). IEEE, 2023, pp. 1–5.
- [41] L. Zhou, M. Ye, D. Zhang, C. Zhu, and L. Ji, “Prototype-based multisource domain adaptation,” IEEE Transactions on Neural Networks and Learning Systems, vol. 33, no. 10, pp. 5308–5320, 2021.
- [42] R. Zarei-Sabzevar, K. Ghiasi-Shirazi, and A. Harati, “Prototype-based interpretation of the functionality of neurons in winner-take-all neural networks,” IEEE Transactions on Neural Networks and Learning Systems, 2022.
- [43] Y. Wen, K. Zhang, Z. Li, and Y. Qiao, “A discriminative feature learning approach for deep face recognition,” in ECCV (7), ser. Lecture Notes in Computer Science, vol. 9911. Springer, 2016, pp. 499–515.
- [44] Z. Shi, H. Wang, and C.-S. Leung, “Constrained center loss for convolutional neural networks,” IEEE Transactions on Neural Networks and Learning Systems, 2021.
- [45] A. Wang, A. Singh, J. Michael, F. Hill, O. Levy, and S. R. Bowman, “GLUE: A multi-task benchmark and analysis platform for natural language understanding,” in ICLR (Poster). OpenReview.net, 2019.
- [46] V. Sanh, L. Debut, J. Chaumond, and T. Wolf, “Distilbert, a distilled version of BERT: smaller, faster, cheaper and lighter,” CoRR, vol. abs/1910.01108, 2019.
- [47] I. Turc, M. Chang, K. Lee, and K. Toutanova, “Well-read students learn better: The impact of student initialization on knowledge distillation,” CoRR, vol. abs/1908.08962, 2019.
- [48] S. Sun, Y. Cheng, Z. Gan, and J. Liu, “Patient knowledge distillation for BERT model compression,” in EMNLP/IJCNLP (1). Association for Computational Linguistics, 2019, pp. 4322–4331.
- [49] C. Xu, W. Zhou, T. Ge, F. Wei, and M. Zhou, “Bert-of-theseus: Compressing BERT by progressive module replacing,” in EMNLP (1). Association for Computational Linguistics, 2020, pp. 7859–7869.
- [50] L. Li, Y. Lin, D. Chen, S. Ren, P. Li, J. Zhou, and X. Sun, “Cascadebert: Accelerating inference of pre-trained language models via calibrated complete models cascade,” in EMNLP (Findings). Association for Computational Linguistics, 2021, pp. 475–486.
- [51] T. Wolf, L. Debut, V. Sanh, J. Chaumond, C. Delangue, A. Moi, P. Cistac, T. Rault, R. Louf, M. Funtowicz, J. Davison, S. Shleifer, P. von Platen, C. Ma, Y. Jernite, J. Plu, C. Xu, T. L. Scao, S. Gugger, M. Drame, Q. Lhoest, and A. M. Rush, “Transformers: State-of-the-art natural language processing,” in EMNLP (Demos). Association for Computational Linguistics, 2020, pp. 38–45.
- [52] I. Loshchilov and F. Hutter, “Decoupled weight decay regularization,” in ICLR (Poster). OpenReview.net, 2019.
- [53] Z. Sun, H. Yu, X. Song, R. Liu, Y. Yang, and D. Zhou, “Mobilebert: a compact task-agnostic bert for resource-limited devices,” in Proceedings of the 58th Annual Meeting of the Association for Computational Linguistics, 2020, pp. 2158–2170.
- [54] L. van der Maaten and G. Hinton, “Visualizing high-dimensional data using t-sne,” JMLR, vol. 9, no. nov, pp. 2579–2605, 2008.
![[Uncaptioned image]](/html/2402.05948/assets/bio/he.jpg) |
Jianing He is currently a doctoral candidate with the School of Computer Science, Tongji University, China. Her primary research interests focus on natural language processing, dynamic inference acceleration, and model compression. |
![[Uncaptioned image]](/html/2402.05948/assets/x1.png) |
Qi Zhang received his first Ph.D. from the Beijing Institute of Technology, Beijing, China in 2020, and his second Ph.D. from the University of Technology Sydney, Sydney, NSW, Australia, in 2023. He is currently a Research Fellow at Tongji University, Shanghai, China. He has authored more than 30 high-quality papers in premier conferences and journals, including NeurIPS, AAAI, IJCAI, WWW, SIGIR, ICDM, ECAI, TKDE, TOIS, TNNLS, and Pattern Recognition et al. His primary research interests include multimodal learning, time series analysis, frequency neural networks in various tasks such as recommender systems, fake news detection, mental health analysis, and neuroscience analysis. |
![[Uncaptioned image]](/html/2402.05948/assets/bio/ding.jpg) |
Weiping Ding (M’16-SM’19) received the Ph.D. degree in Computer Science, Nanjing University of Aeronautics and Astronautics, Nanjing, China, in 2013. From 2014 to 2015, he is a Postdoctoral Researcher at the Brain Research Center, National Chiao Tung University, Hsinchu, Taiwan. In 2016, He was a Visiting Scholar at the National University of Singapore, Singapore. From 2017 to 2018, he was a Visiting Professor at the University of Technology Sydney, Australia. He is a Full Professor with the School of Information Science and Technology, Nantong University, Nantong, China. His main research directions involve deep neural networks, granular data mining, and multimodal machine learning. He ranked within the top 2 Ranking of Scientists in the World by Stanford University (2020-2023). He has published over 250 articles, including over 100 IEEE Transactions papers. His eighteen authored/co-authored papers have been selected as ESI Highly Cited Papers. He serves as an Associate Editor/Editorial Board member of IEEE Transactions on Neural Networks and Learning Systems, IEEE Transactions on Fuzzy Systems, IEEE/CAA Journal of Automatica Sinica, IEEE Transactions on Emerging Topics in Computational Intelligence, Information Fusion, Information Sciences, Applied Soft Computing, et al. He is the Leading Guest Editor of Special Issues in several prestigious journals, including IEEE Transactions on Evolutionary Computation, IEEE Transactions on Fuzzy Systems, and Information Fusion. |
![[Uncaptioned image]](/html/2402.05948/assets/x2.png) |
Duoqian Miao is currently a Professor and a Ph.D. Tutor with the College of Electronics and Information Engineering, Tongji University. He serves as the President of the International Rough Set Society (IRSS), the Chair of the CAAI Granular Computing Knowledge Discovery Technical Committee, the Vice Director for MOE Key Lab of Embedded System & Service Computing, the Vice President of Shanghai Computer Federation and Shanghai Association for Artificial Intelligence. His interests include machine learning, data mining, big data analysis, granular computing, artificial intelligence, and text image processing. He has published more than 200 papers in IEEE Trans. Cybern., IEEE Trans. Inf. Forensic Secur., IEEE Trans. Knowl. Data Min., IEEE Trans. Fuzzy Syst., Pattern Recognit., Inf. Sci., Knowl-Based Syst. and so on. Representative awards include the Second Prize of Wuwenjun AI Science and Technology (2018), the First Prize of Natural Science of Chongqing (2010), the First Prize of Technical Invention of Shanghai (2009), the First Prize of Ministry of Education Science and Technology Progress Award (2007). He serves as an Associate Editor for Int. J. Approx. Reasoning, Inf. Sci. and an Editor of the Journal of Computer Research and Development (in Chinese). |
![[Uncaptioned image]](/html/2402.05948/assets/bio/zhao.jpg) |
Jun Zhao received the Ph.D. degree from Tsinghua University, Beijing, China, in 1998. He is currently a Professor with the National Laboratory of Pattern Recognition (NLPR), Institute of Automation, Chinese Academy of Sciences, Beijing. He has published more than 70 papers in international journals and conferences, including TKDE, ACL, EMNLP, IJCAI, AAAI, WWW, and CIKM. His research interests focus on natural language processing, relation extraction, event extraction, question answering, and dialog systems. |
![[Uncaptioned image]](/html/2402.05948/assets/bio/hu.jpg) |
Liang Hu received dual Ph.D. degrees from Shanghai Jiao Tong University, China and University of Technology Sydney, Australia. He is currently a distinguished research fellow at Tongji University and chief AI scientist at DeepBlue Academy of Sciences. His research interests include recommender systems, machine learning, data science, and general intelligence. |
![[Uncaptioned image]](/html/2402.05948/assets/x3.png) |
Longbing Cao (@SM in 2006) received the Ph.D. in pattern recognition and intelligent systems from the Chinese Academy of Science, China, and Ph.D. in computing sciences from the University of Technology Sydney, Australia. He is a professor at Macquarie University, an ARC Future Fellow (professorial level), and the EiCs of IEEE Intelligent Systems and J. Data Science and Analytics. His research interests include artificial intelligence, data science, machine learning, behavior informatics, and enterprise applications. |
Appendix A Baseline Competitors
In this section, we introduce the comparative baselines in our experiments in detail.
A-1 Backbone
BERT-base [2] consists of 12 encoders with a single-layer classifier attached to the last encoder. With 110M parameters, a hidden size of 768, and 12 attention heads per layer, it is first pre-trained on the Wiki corpus and then fine-tuned on specific tasks.
A-2 Budget Exiting
BERT-L preserves the first encoders of the BERT-base with a single-layer classifier attached on top. It is initialized with pre-trained weights from the first layers of the BERT-base and then fine-tuned on specific tasks. BERT-4L and BERT-6L essentially employ static early exiting strategies, where all samples exit early at a fixed layer. Hence, these models serve as a lower bound for comparison with dynamic early exiting methods.
A-3 Knowledge Distillation
Knowledge distillation methods compress models by transferring knowledge from a larger teacher model to a more compact student model. DistilBERT [46] is distilled during the pre-training phase. PD-BERT [47] is first pre-trained on a corpus and then distilled during the fine-tuning stage. BERT-PKD [48] is distilled using both the final predictions and intermediate-layer outputs provided by the teacher model during the fine-tuning stage. BERT-of-Theseus [49] is distilled using a progressive module replacement strategy during the fine-tuning stage. All of the compressed models mentioned above consist of 6 encoders, resulting in a speed-up ratio of 2.0.
A-4 Early Exiting
Regarding the inference stage, DeeBERT [20] and GPFEE [26] employ confidence-based exiting strategies, which use the entropy of early predictions to reflect the confidence level of internal classifiers. The inference process is terminated once the entropy value falls below a predefined threshold. PABEE [21] and LeeBERT [29] both employ a patience-based exiting strategy, which utilizes cross-layer consistency as the exiting indicator. The exiting criterion is met when there are enough (i.e., the patience threshold) consecutive internal classifiers that agree with each other. BERxiT [22] incorporates the LTE module, a one-layer fully-connected network that learns to score the correctness of early predictions. Early exit is triggered once the correctness score surpasses the threshold. PCEE-BERT [23] employs a hybrid exiting strategy that combines confidence-based and patience-based strategies. It uses entropy as the confidence measure and terminates the inference if there are enough numbers (i.e., the patience threshold) of consecutive internal classifiers being confident for their predictions.
Regarding the architectures of internal classifiers, GPFEE [26] enhances the internal classifiers by integrating both past and future states as its inputs to facilitate high-quality early predictions, while the remaining models utilize a single-layer fully-connected network as the internal classifier.
Regarding the training phase, DeeBERT [20], PABEE [21], and PCEE-BERT [23] are trained by minimizing the cross-entropy losses for all classifiers. For the remaining models, despite the cross-entropy loss for internal classifiers, additional training objectives are needed. BERxiT [22] introduces the MSEs for all LTE modules to encourage high-quality scoring results for prediction correctness. GPFEE [26] leverages the imitation loss for generating approximations of future states based on all available past states. LeeBERT [29] leverages a cross-layer distillation objective with learned weights to encourage mutual learning among internal classifiers, thus improving the training process.
The above information is summarized in Table IX.
Appendix B Implementation Details for Ablation Studies
To verify the effectiveness of the prototypical networks (PNs) and DAR, we train two variants of our DE3-BERT model and employ the proposed hybrid exiting strategy for these models as well as the full DE3-BERT model during inference. We then compare the performance-efficiency trade-offs of different models.
B-1 DE3-BERT w/o PN
To demonstrate the effectiveness of the prototypical networks, we design and train a variant of the DE3-BERT model (denoted by DE3-BERT w/o PN) as illustrated in Section III-B in the main paper. During inference, we use the proposed hybrid exiting strategy. Note that the computation of DAR terms and the updating of class prototype representations during training, as well as the calculation of distance ratios during inference, are all based on the sample representations obtained by pooling the hidden states of encoder layers (i.e., inputs to internal classifiers).
B-2 DE3-BERT w/o PN w/o DAR
To further demonstrate the effectiveness of DAR, we also train another variant of the DE3-BERT model (denoted by DE3-BERT w/o PN w/o DAR) only using the cross-entropy loss as the training objective. To ensure the feasibility of the proposed hybrid exiting strategy during inference, the class prototype representations are still updated during training. Note that the updating of class prototype representations during training, as well as the calculation of distance ratios during inference, are all based on the sample representations obtained by pooling the hidden states of encoder layers (i.e., inputs to internal classifiers).
| Method | Exiting Strategy | IC Architecture | Exiting Criterion | Training Objective |
|---|---|---|---|---|
| DeeBERT | Confidence-based | Single-layer FC | ||
| PABEE | Patience-based | Single-layer FC | ||
| BERxiT | Learnable | Single-layer FC | , MSE | |
| PCEE-BERT | Hybrid | Single-layer FC | ||
| GPFEE | Confidence-based | Enhanced | , | |
| LeeBERT | Patience-based | Single-layer FC | , |
Appendix C Additional Experimental Results
C-A Sample Distribution of Exiting Layers
To intuitively analyze the sample distribution of exiting layers for the DE3-BERT framework, we calculate the fraction of early exiting samples in each exiting layer on the QNLI task using different threshold settings, as shown in Fig. 10. It can be observed that as the threshold increases, the samples tend to exit from shallow layers, resulting in a higher speed-up ratio, as well as a certain degree of performance degradation. This is consistent with our intuitive understanding.
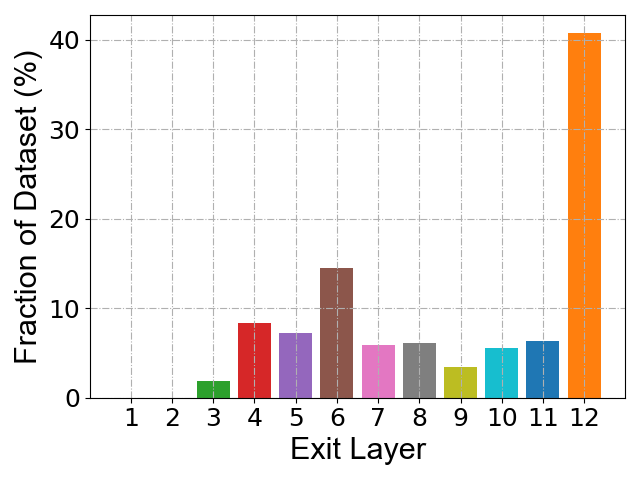
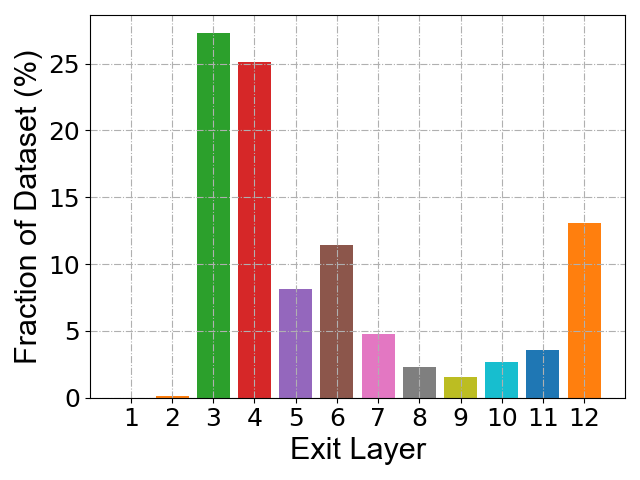
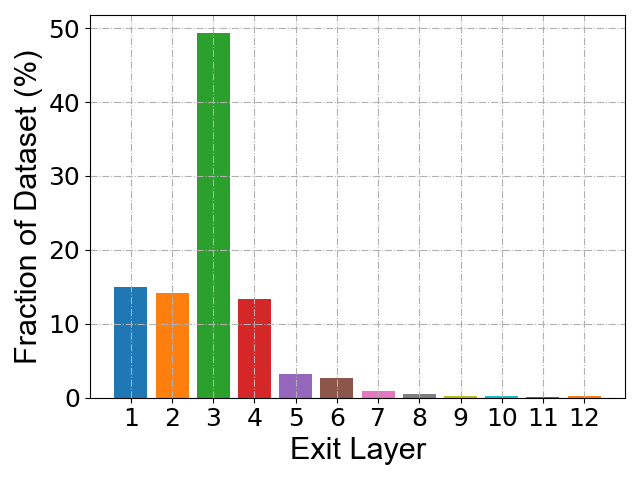
C-B An Analysis of Different Speed Measurements
As mentioned in Section IV-C in the main paper, since the actual inference time is unstable across different runs, we calculate the speed-up ratio based on the number of executed layers during forward propagation as illustrated in Equation (12) in the main paper. To validate the rationality of this speed measurement, we manually adjust the threshold during inference and collect the corresponding three types of speed measurements, including the total number of executed layers, the actual inference time, and the computational costs (FLOPs), on the SST-2 development set, as shown in Table X. We can observe that the total number of executed layers is approximately proportional to the model’s computational costs, with a high Pearson correlation coefficient of 0.99 between them. This is because the encoder block constitutes the majority of the model’s computational complexity, as depicted in Table V in the main paper. Additionally, the number of executed layers is highly positively correlated with the actual inference time, with a Pearson coefficient of 0.96. Therefore, the above analysis validates the rationality of the speed measurement based on the number of executed layers.
| Threshold | Executed Layers | Inference Time (s) | FLOPs () |
|---|---|---|---|
| 0.000 | 10464 | 17.07 | 19.0 |
| 0.001 | 10159 | 16.90 | 18.4 |
| 0.007 | 7118 | 15.24 | 12.9 |
| 0.010 | 6155 | 13.66 | 11.1 |
| 0.070 | 4491 | 12.64 | 8.1 |
| 0.140 | 3751 | 12.19 | 6.8 |
| 0.210 | 3332 | 11.46 | 6.1 |
| 0.290 | 3024 | 11.46 | 5.5 |
| 0.430 | 2649 | 11.94 | 4.8 |
| 0.570 | 2346 | 10.28 | 4.3 |
| 0.710 | 2110 | 11.77 | 3.8 |
| 0.790 | 2032 | 10.16 | 3.7 |
| 0.860 | 1934 | 9.70 | 3.5 |
| 0.930 | 1829 | 9.70 | 3.3 |
| 0.980 | 1284 | 9.23 | 2.3 |
| 1.000 | 872 | 10.87 | 1.6 |