Ying-Yang Competitive Harmony between Direct and Indirect Pathways in A Spiking Neural Network of The Basal Ganglia
Abstract
The basal ganglia (BG) in the brain exhibit a variety of functions for motor and cognition. There are two competing pathways in the BG; direct pathway (DP), facilitating movement and indirect pathway (IP), suppressing movement. It is well known that diverse functions of the BG could be done via “balance” between DP and IP. But, to the best of our knowledge, no quantitative analysis for such balance was done. In this paper, we consider a spiking neural network of the BG and make quantitative analysis for competitive harmony (i.e., competition and cooperative interplay) between DP and IP by introducing their competition degree , given by the ratio of strength of DP () to strength of IP () (i.e., ). We first consider the case of normal dopamine (DA) level of . In the case of phasic cortical input (10 Hz) in the phasically-active state, a healthy state with (i.e., DP is 2.82 times stronger than IP) appears. In this case, normal movement occurs via harmony between DP and IP. Next, we consider the case of decreased DA level, (). With decreasing from 1, the competition degree between DP and IP decreases monotonically from , which results in appearance of a pathological state (e.g., Parkinson’s disease) with decreased competition degree. In this pathological state, strength of IP () is much increased than that in the case of normal healthy state, leading to disharmony between DP and IP. Due to such break-up of harmony between DP and IP, impaired movement occurs. Finally, we also study treatment of the pathological state via recovery of harmony between DP and IP.
pacs:
87.19.lj, 87.19.lu, 87.19.rsI Introduction
The basal ganglia (BG) in the brain are a group of subcortical deep-lying nuclei, receive cortical inputs from most regions of cortex, and provide output to the thalamus/brainstem Luo ; Kandel ; Squire ; Bear . Their main function is motor control (e.g., initiation and execution of movement) Luo ; Kandel ; Squire ; Bear . They also play an important role in cognitive processes (e.g., action selection) GPR1 ; GPR2 ; Hump1 ; Hump2 ; Hump3 ; Man . Dysfunction in the BG is associated with a number of movement disorders, such as Parkinson’s disease (PD), as well as cognitive disorders. As is well known, patients with PD show motor deficits such as slowed movement (bradykinesia), rigidity, and (resting) tremor, and they may also develop cognitive deficits such as dementia PD1 ; PD2 ; PD3 ; PD4 .
Our spiking neural network (SNN) of the BG is based on anatomical and physiological data derived from rat-based studies Ana4 ; Ana5 ; Ana6 ; Ana7 ; Phys1 ; Phys2 ; Phys3 ; Phys4 ; Phys5 ; Phys6 ; Phys7 ; Phys8 ; Phys9 ; Phys10 ; Phys11 ; Phys12 ; Phys13 ; Phys14 ; Phys15 ; Phys16 ; Phys17 ; Phys18 ; Phys19 ; Phys20 . Hence, we use rat-brain terminology. The BG receive input from cortex through the input nuclei [striatum (Str) and subthalamic nucleus (STN)] and project output through the output nucleus [substantia nigra pars reticulata (SNr)] to the thalamus/brainstem Hump1 ; Man . Here, the principal input nucleus, Str, receives cortical inputs from all over the cortex and is the primary recipient of dopamine (DA), coming from the substantia nigra pars compacta (SNc). Within the Str, spine projection neurons (SPNs), comprising up to 95 of the whole striatal population, are the only primary output neurons Str1 ; Str2 . There are two types of SPNs with D1 and D2 receptors for the DA. The DA modulates firing activity of the D1 and D2 SPNs in a different way SPN1 ; SPN2 ; CN6 .
Two competing pathways, direct pathway (DP) and indirect pathway (IP), exist in the BG DIP1 ; DIP2 ; DIP3 ; DIP4 . D1 SPNs in the Str project inhibition directly to the output nucleus, SNr, via DP, and then the thalamus is disinhibited. As a result, movement facilitation occurs. On the other hand, D2 SPNs are connected to the SNr via IP, crossing the intermediate control nucleus, GP (globus pallidus), and the STN. In this case of IP, the firing activity of the SNr becomes enhanced mainly due to excitatory input from the STN. Consequently, firing activity of the thalamus becomes reduced, leading to movement suppression. In the case of normal DA level, DP is more active than IP, and an action is initiated (i.e., “Go” behavior occurs). In contrast, for low DA level, IP could be more active than DP, and then the action is withheld (i.e., “No-Go” behavior takes place). In this way, DP and IP are also called the “Go” and “No-Go” pathways, respectively Frank1 ; Frank2 ; Go1 ; Go2 .
As is well known, diverse functions of the BG could be done via “balance” between the “Go” DP and the “No-Go” IP, and such balance is regulated by the DA level. So far, diverse subjects for the BG have been investigated in many computational works GPR1 ; GPR2 ; Hump1 ; Hump2 ; Hump3 ; Man ; Str2 ; SPN1 ; SPN2 ; Frank1 ; Frank2 ; CN1 ; CN2 ; CN3 ; CN4 ; CN5 ; CN6 ; CN7 ; CN8 ; CN9 ; CN10 ; CN11 ; CN12 ; CN13 ; CN14 ; CN15 ; CN16 ; CN17 ; CN18 ; CN19 ; CN20 ; CN21 ; CN22 . But, to the best of our knowledge, no quantitative analysis for balance between DP and IP was made. To make clear the concept of such balance, we make quantitative analysis for competitive harmony (i.e., competition and cooperative interplay) between DP and IP in our SNN of the BG. To do so, we introduce the competition degree between DP and IP, given by the ratio of strength of DP () to strength of IP () (i.e., ). Here, is given by the magnitude of the total time-averaged synaptic current into the output nucleus, SNr, via DP (IP).
We first consider the case of normal DA level of . For the tonic cortical input (3 Hz) in the resting state, a default state with (i.e., DP and IP are balanced) appears. In this default state, the neurons in the output nucleus, SNr, fire actively with the frequency 25.5 Hz, resulting in the locked state of the BG gate to the thalamus. Consequently, no movement occurs. On the other hand, for the phasic cortical input (10 Hz) in the phasically-active state, a healthy state with (i.e., DP is 2.82 times stronger than IP) is found to appear. In this healthy state, the firing frequency of the SNr becomes much reduced to 5.5 Hz from 25.5 Hz (default state), which leads to the opened state of the BG gate to the thalamus. Through this kind of competitive harmony between DP and IP, normal movement occurs in the healthy state, in contrst to the case of default state.
Next, we consider the case of reduced DA level, (). As (i.e., fraction of the DA level) is decreased from 1, the competition degree between DP and IP is found to decrease monotonically from , which leads to appearance of a pathological state with reduced competition degree. For the pathological state, strength of IP () is much increased than that for the normal healthy state, resulting in disharmony between DP and IP. Because of such break-up of harmony between DP and IP, arising from deficiency in DA production in the neurons of the SNc PD5 ; PD6 , PD with impaired movement occurs. Finally, we also investigate treatment of the pathological state through recovery of harmony between DP and IP.
II Spiking Neural Network of The Basal Ganglia
In this section, we describe our SNN for the BG, and briefly present the governing equations for the population dynamics; for details, refer to Appendices A and B. Based on the anatomical and the physiological properties of the BG Ana4 ; Ana5 ; Ana6 ; Ana7 ; Phys1 ; Phys2 ; Phys3 ; Phys4 ; Phys5 ; Phys6 ; Phys7 ; Phys8 ; Phys9 ; Phys10 ; Phys11 ; Phys12 ; Phys13 ; Phys14 ; Phys15 ; Phys16 ; Phys17 ; Phys18 ; Phys19 ; Phys20 , this BG SNN, composed of D1/D2 SPNs, STN neurons, GP neurons, and SNr neurons, is developed. For simplicity, within the Str, only the dominant D1/D2 SPNs are taken into consideration (without considering a minor subpopulation of fast spiking interneurons). In addition, we also consider the modulation effect of DA on D1/D2 SPN and afferent synapses into the D1/D2 SPNs, the STN, and the GP SPN1 ; SPN2 ; CN6 .
II.1 Architecture of The Spiking Neural Network
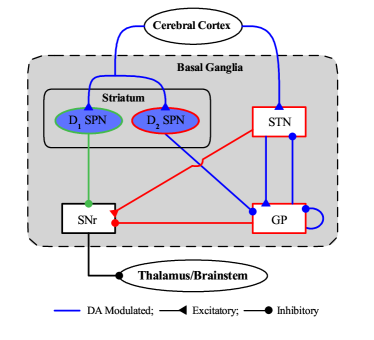
Figure 1 shows a box diagram of major neurons and synaptic connections in our BG SNN. This BG SNN is composed of the input nuclei (Str and STN), the output nucleus (SNr), and the intermediate controller (GP). Here, STN is the only excitatory neuron in the BG, while all the other ones are inhibitory neurons. Particularly, we note that the SNr makes inhibitory output projections to the thalamus/brainstem, in contrast to the usual case of excitatory outputs.
Both Str and STN receive inputs from the cortex. Cortical inputs are modeled in terms of 1,000 independent Poisson spike trains with firing rate . In the case of tonic cortical input in the resting state, Hz, while for the phasic cortical input in the phasically-active state, Hz, independently of Hump1 ; CI1 ; CI2 ; CI3 ; CI4 ; CI5 ; Str2 ; CN6 ; CN14 . Also, the principal input nucleus, Str, is the primary recipient of the DA (coming from the SNc).Within the Str, there are two types of SPNs with D1 and D2 receptors for the DA, comprising up to 95 of the whole striatal population; a minor subpopulation of fast spiking interneurons are not considered in our SNN Str1 ; Str2 . These D1 and D2 SPNs exhibit different firing activities due to DA modulation SPN1 ; SPN2 ; CN6 .
There are two competing pathways in the BG DIP1 ; DIP2 ; DIP3 ; DIP4 ; Frank1 ; Frank2 ; Go1 ; Go2 . The D1 SPNs make inhibitory projection to the output nucleus, SNr, directly via the “Go” DP (green color in Fig. 1). Then, the thalamus becomes disinhibited, leading to movement facilitation. In contrast, the D2 SPNs are connected to the SNr through the “No-Go” IP (red color in Fig. 1), crossing the GP an the STN. Here, the GP plays a role of intermediate controller to modulate the firing activity of the STN. In this case of IP, the firing activity of the SNr becomes increased mainly because of excitatory input from the STN. As a result, firing activity of the thalamus becomes decreased, resulting in movement suppression. In this way, the firing activity of the output nucleus, SNr, is controlled via competition between “Go” DP (green) and “No-Go” IP (red).
| 1,325 | |
| 1,325 | |
| 14 | |
| 46 | |
| 26 |
| D1 SPN SNr | 0.033 |
|---|---|
| D2 SPN GP | 0.033 |
| STN GP | 0.3 |
| GP GP | 0.1 |
| GP STN | 0.1 |
| STN SNr | 0.3 |
| GP SNr | 0.1066 |
Based on the anatomical information Ana6 , we choose the numbers of the striatal neurons, the STN neurons, the SNr neurons, and the GP neurons in the BG. Here we develop a scaled-down SNN where the total number of striatal neurons is , corresponding to of the striatal cells found in the rat BG. Thus, we make scaling down with ratio for all the BG neurons CN11 ; CN17 . The total numbers of the BG neurons are shown in Table 1. We note that 90-97 of the whole striatal population corresponds to the major subpopulation of D1/D2 SPNs CN11 ; here, we choose 95 . The remaining 5 corresponds to a minor subpopulation of fast spiking interneurons (which are not considered in our SNN).
From the outside of the BG, the cortex (Ctx) provides the external excitatory inputs randomly to the D1/D2 SPNs and the STN neurons with the connection probabilities, = 0.084 (8.4 ) and = 0.03 (3 ), respectively CN6 . As shown in Fig. 1, we consider random synaptic connections between BG cells; random recurrent connections between GP neurons are also considered. Table 2 shows the synaptic connection probabilities from a presynaptic neuron in the source population () to a postsynaptic neuron in the target population () in the BG CN14 .
II.2 Single Neuron Models, Synaptic Currents, and DA Effects
As elements of our BG SNN, we use the Izhikevich spiking neuron model which is computationally efficient as well as biologically plausible Izhi1 ; Izhi2 ; Izhi3 ; Izhi4 , as in our previous works for spike-timing-dependent plasticity Kim1 ; Kim2 ; Kim3 . The Izhikevich model matches neurodynamics by tuning its intrinsic parameters, instead of matching electrophysiological data, in contrast to the Hodgkin-Huxley-type conductance-based models.
Our BG SNN is composed of 5 populations of D1 SPNs, D2 SPNs, STN neurons, GP neurons, and SNr neurons. The state of a neuron in each population is characterized by its membrane potential and the slow recovery variable in the Izhikevich neuron model. Time-evolution of and is governed by three types of currents into the neuron, (external current), (synaptic current), and (stimulation current). Here, , and represent stochastic external excitatory input from the external region (i.e., corresponding to the background part not considered in the modeling), the synaptic current, and the injected stimulation DC current, respectively. As the membrane potential reaches its apex (i.e., spike cutoff value), the neuron fires, and then the membrane potential and the recovery variable are reset.
Detailed explanations on the Izhikevich neuron models for the D1/D2 SPNs, the STN neuron, the GP neuron, and the SNr neuron are presented in Appendix A SPN1 ; SPN2 ; CN6 . Each Izhikevich neuron model has 9 intrinsic parameters which are shown in Table 3 in Appendix A. These values are based on physiological properties of the D1/D2 SPNs, the STN neurons, the GP neurons, and the SNR neurons Phys1 ; Phys2 ; Phys3 ; Phys4 ; Phys5 ; Phys6 ; Phys7 ; Phys8 ; Phys9 ; Phys10 ; Phys11 .
Next, we consider the synaptic currents into the BG neurons. As in our previous works Cere1 ; Cere2 ; Hippo1 ; Hippo2 ; Hippo3 ; Hippo4 , we follow the “canonical” formalism for the synaptic currents; for details, refer to Appendix B. There are two types of excitatory AMPA and NMDA receptor-mediated synaptic currents and one kind of inhibitory GABA receptor-mediated synaptic current. Synaptic conductance for each synaptic current is provided by multiplication of maximum conductance per synapse, average number of afferent synapses, and fraction of open postsynaptic ion channels. We note that, postsynaptic ion channels are opened via binding of neurotransmitters to receptors in the target population. A sum of the exponential-decay functions (controlled by the synaptic decay time constant and the synaptic latency time constant) over presynaptic spikes provide temporal evolution of the fraction of open ion channels. The synaptic parameter values (based on the physiological properties of the BG neurons) for the maximum synaptic conductance, the synaptic decay time constant, the synaptic latency time constant, and the synaptic reversal potential for the synaptic currents are given in Table 6 in Appendix B SPN2 ; CN6 ; CN14 ; Phys2 ; Phys12 ; Phys13 ; Phys14 ; Phys15 ; Phys16 ; Phys17 ; Phys18 ; Phys19 ; Phys20 .
Finally, we consider the DA effect on our BG SNN SPN1 ; SPN2 ; CN6 . Figure 1 shows effects of DA modulation on D1/D2 SPNs and synaptic currents into the D1/D2 SPNs, the STN neurons, and the GP neurons (blue color). The DA effects on the D1/D2 SPNs are well shown in the current-frequency (f-I) curves in Fig. 2A of Ref. SPN1 . We note changes from the basic model (without DA; red) to the D1 (green) and the D2 (blue) SPN models. Such changes occur due to different DA effects, depending on the D1 and D2 SPNs. D1 receptor activation has two opposing effects. Due to a hyperpolarizing effect, activation threshold is increased in comparison to the bare case, while after threshold, the slope of the f-I curve increases rapidly because of another depolarizing effect. In contrast, in the case of D2 SPN, only the depolarizing effect occurs, leading to left-shift of the bare f-I curve. As a result of DA effects, excitatory cortical inputs into the D1 (D2) SPNs are upscaled (downscaled), as shown well in Fig. 2C of Ref. SPN1 . All the other synaptic currents into the STN neurons and the GP neurons become downscaled due to DA effects. More details on the DA effects on the SPNs and synaptic currents are given in Appendices A and B, respectively.
III Quantitative Analysis of Competitive Harmony between DP and IP
In this section, we quantitatively analyze competitive harmony (i.e., competition and cooperative interplay) between DP and IP by introducing the competition degree between them. is given by the ratio of strength of DP () to strength of IP () (i.e., ).
We first consider the normal DA level of ; (DA level for the D1 SPNs) = (DA level for the D2 SPNs) = . For the tonic cortical input ( Hz) in the resting state, a default state with (i.e., DP and IP are nearly balanced) appears. In this default state, the BG gate to the thalamus is locked due to active firing activity of the neurons in the output nucleus SNr, which results in no movement. On the other hand, for the phasic cortical input (10 Hz) in the phasically-active state, a healthy state with (i.e., DP is 2.82 times stronger than IP) appears. In this healthy state, the BG gate to the thalamus becomes opened because the firing activity of the SNr neurons is much reduced. Thus, normal movement occurs via competitive harmony between DP and IP.
Next, we consider the case of decreased DA level, (). With reducing from 1, the competition degree between DP and IP decreases monotonically from (= 2.82), which results in appearance of a pathological state with reduced competition degree. In the pathological state, strength of IP () is much increased than that for the normal healthy state, leading to disharmony between DP and IP. Due to break-up of harmony between DP and IP, arising from deficiency in DA production in the neurons of the SNc PD5 ; PD6 , PD with impaired movement occurs. Finally, we also study treatment of the pathological state via recovery of harmony between DP and IP.
III.1 Healthy BG States with Harmony between DP and IP
We consider the case of normal DA level of for the D1 and D2 SPNs. As explained in Sec. II.1, cortical inputs are modeled in terms of 1,000 independent Poisson spike trains with firing rate . We first consider the case of tonic cortical input with Hz in the resting state Hump1 ; CI1 ; CI2 ; CI3 ; CI4 ; CI5 ; Str2 ; CN6 ; CN14 .
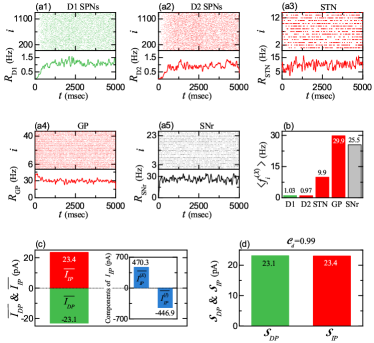
Population firing activity of BG neurons may be well visualized in the raster plot of spikes which is a collection of spike trains of individual BG neurons. Figures 2(a1)-2(a5) show the raster plots of spikes for D1 SPNs (green), D2 SPNs (red), STN neurons (red), GP neurons (red), and SNr neurons, respectively; color of D1 SPNs, associated with DP is green, while color of BG cells related to IP is red.
As a collective quantity exhibiting population behaviors, we use an IPSR (instantaneous population spike rate) which could be obtained from the raster plot of spikes IPSR1 ; IPSR2 ; IPSR3 ; IPSR4 ; IPSR5 . In this case, each spike in the raster plot is convoluted with a kernel function to obtain a smooth estimate of IPSR in the population ( D1 (SPN), D2 (SPN), STN, GP, and SNr) Kernel :
| (1) |
Here, is the number of the neurons, and and are the total number of spikes and the th spiking time of the th neuron, respectively. As the kernel function, we employ a Gaussian function of band width :
| (2) |
where the band width of is 20 msec. The IPSRs for D1 (SPN), D2 (SPN), STN, GP, and SNr are also shown in Figs. 2(a1)-2(a5), respectively.
As shown in Fig. 2(b), population-averaged mean firing rates (MFRs) of BG neurons, , for the tonic case are 1.03, 0.97, 9.9, 29.9, and 25.5 Hz for D1 (SPN), D2 (SPN), STN, GP, and SNr, respectively Hump1 ; CN6 ; CN14 ; is the MFR of the th neuron in the population and denotes the population average over all neurons. For details, refer to Table 5 in Appendix A. In this case of default BG state, the D1 and D2 SPNs in the input nucleus, Str, are nearly silent. On the other hand, the output SNr neurons fire very actively, and hence the BG gate to the thalamus becomes locked, leading to no movement.
There are two types of synaptic currents into the (output) SNr neurons, and , via DP (green) and IP (red) in Fig. 1, respectively. For details of synaptic currents, refer to Appendix B; refer to Eq. (14) for all the currents into the neuron. Here, the DP current, is just the (inhibitory) synaptic current from the D1 SPNs to the SNr neurons:
| (3) |
The IP current, consists of the excitatory component, and the inhibitory component,
| (4) |
Here, [] is just the synaptic current from the STN (GP) to the SNr:
| (5) |
We note that, firing activity of the (output) SNr neurons is determined via competition between DP current [] and IP current [] into the SNr. The strengths of DP and IP, and , are given by the magnitudes of their respective time-averaged synaptic currents:
| (6) |
where the overline represents the time averaging and denotes the absolute magnitude. Then, we introduce the competition degree between DP and IP, given by the ratio of to :
| (7) |
For , DP and IP are balanced, and the SNr neurons fire actively with the MFR 25.5 Hz. Hence, the thalamic cells become silent, leading to no movement. In the case of , DP is more active than IP, and hence, the firing activities of SNr neurons are suppressed than the balanced state with . Thus, the BG gate to the thalamus becomes open, leading to movement facilitation. On the other hand, for IP is more active than DP, and hence, the firing activity of SNr neurons are enhanced than the balanced state with . Thus, the BG gate to the thalamus becomes locked, resulting in movement suppression.
Hereafter, we employ the above competition degree between DP and IP and make quantitative analysis for all the default, healthy, and pathological states occurring in the BG. Figure 2(c) shows the time-averaged DP (green) and IP (red) currents for the tonic cortical input, and in the case of IP current, time-averaged values (blue) of their excitatory and inhibitory components are also given, and . Thus, the strengths of DP and IP become and respectively, as shown in Fig. 2(d). Consequently, the competition degree between DP and IP is (i.e., DP and IP are nearly balanced). In this way, a default state with appears for the tonic cortical input. In this case, the (output) SNr neurons fire very actively at Hz and make strong inhibitory projections to the thalamic neurons. Thus, the BG gate to the thalamus is locked for the tonic cortical input, resulting in no movement.
We are also concerned about activation and deactivation of neurons in the target population OG1 ; OG2 which could be used for treatment of pathological states. Optogenetics is a technique that combines optics and genetics to control the activity of target neurons in living organisms, typically using light-sensitive proteins called opsins. The target neurons are genetically modified to express these opsins (i.e., fusion of the opsins into the target neurons). When the opsins are activated by specific wavelengths of light, variation in the intrinsic ionic currents of the neurons in the target population , , occurs. When is positive (negative), firing activity of the target neurons is increased (decreased), leading to their activation (deactivation).
The governing equations for evolution of dynamical states of individual Izhikevich neurons in the population are given in Eqs. (8) and (9) in Appendix A. Time evolutions of the dynamical variables are governed by the current of Eq. (14) in Appendix A into the th neuron in the population. Here, to simulate the effect of optogenetics, in addition to the current , we include variation of the intrinsic ionic currents of the target neurons via the light stimulation, in Eq. (8).
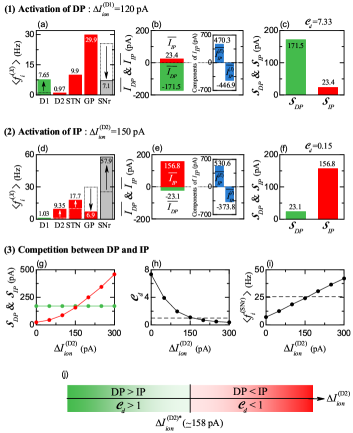
Light stimulation for optogenetics is applied on target neurons in the case of tonic cortical input (3 Hz). As target neurons, we first consider D1 SPNs. With increasing the intensity of light stimulation, magnitude of increases. As an example, Figs. 3(a)-3(c) show the effects of optogenetics for pA. The MFR of D1 SPNs, associated with DP, is much increased to 7.65 Hz from 1.03 Hz (default state); MFRs of other neurons (D2 SPNs, STN, GP), related to IP, remain unchanged (i.e., same as those for the default state) [Fig. 3(a)]. Thus, DP becomes activated via activation of D1 SPNs. Then, firing activities of the output SNr neurons are much suppressed; the MFR of SNr neurons, is much reduced from 25.5 Hz (default state) to 7.1 Hz (down-arrow). In this case, strength of the DP, is much increased to 171.5 from 23.1 (default state) [Figs. 3(b) and 3(c)]. Thus, the competition degree between DP and IP becomes 7.33 which is much larger than that (= 0.99) for the default state. Consequently, through activation of DP, the BG gate to thalamus becomes opened, leading to movement facilitation.
Next, D2 SPNs are considered as target neurons for optogenetics. As an example, Figs. 3(d)-3(f) show the effects of optogenetics for pA. The MFRs of the neurons [ D2 (SPN), GP, STN], associated with IP, are changed, while the MFR of D1 SPNs, related to DP, remains unchanged [Fig. 3(d)]. of D2 SPNs is increased to 9.35 Hz from 0.97 Hz (default state). Due to increased inhibitory projections from D2 SPNs, of GP neurons is decreased to 6.9 Hz from 29.9 Hz (default state). Because of reduced firing activity of GP neurons, of the STN neurons increases to 17.7 Hz from 9.9 Hz (default state). Thus, the strength of IP, , becomes much increased to 156.8 from 23.4 (default state)[Figs. 3(e) and 3(f)]. In this way, IP is activated. Then, the competition degree, , between DP and IP becomes 0.15 which is much smaller than that (= 0.99) for the default state. As a result, via activation of IP, the BG gate to thalamus is locked, resulting in movement suppression.
As a 3rd case, we study competition between DP and IP via light stimulation on both D1 and D2 SPNs. For simplicity, activation of D1 SPNs is fixed for pA; in this case, strength of the DP, is 171.5. By increasing from 0, competition between DP and IP is investigated. Figures 3(g)-3(i) show well the effects of optogenetics on their competition. As is increased from 0, the strength of IP, is found to monotonically increase from 23.4 [Fig. 3(g)]. Due to monotonic increase in , the competition degree between DP and IP decreases monotonically from 7.33 [Fig. 3(h)], and the MFR of the (output) SNr neurons, , increases monotonically from 7.1 Hz [Fig. 3(i)]. We note that, when passing a threshold, 158 pA), becomes the same as . Figure 3(j) shows a diagram for competition between DP and IP. For , of DP is larger than of IP (i.e., ), and then the MFR of SNr neurons, , becomes smaller than that (= 25.5 Hz) for the default state. Consequently, the BG gate to thalamus is opened, leading to movement facilitation. On the other hand, for , of IP is larger than of DP, and then the mean firing rate of SNr neurons, , becomes larger than that (= 25.5 Hz) for the default state. As a result, the BG gate to thalamus is locked, resulting to movement suppression.
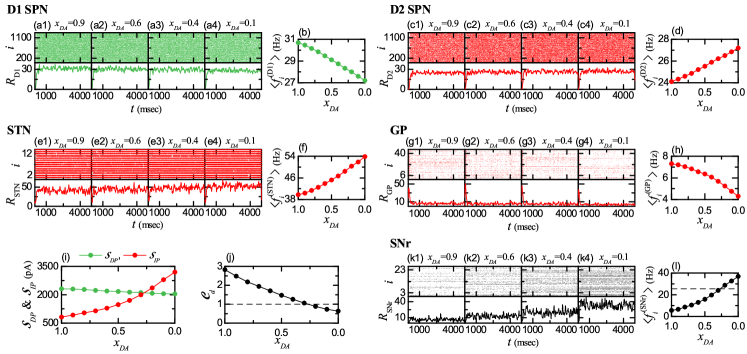
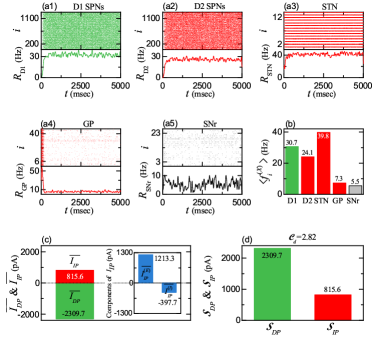
From now on, we consider the case of phasic cortical input with Hz in the phasically-active state, in contrast to the above case of tonic cortical input with 3 Hz in the resting default state CI1 ; CI2 ; CI3 ; CI4 ; CI5 ; Str2 ; CN6 ; CN14 . Population firing behaviors of the BG neurons may be well seen in the raster plots of spikes and they may also be characterized well in terms of their IPSRs. Figures 4(a1)-4(a5) show the raster plots of spikes and the IPSRs for D1 SPN (green), D2 SPN (red), STN (red), GP (red), and SNr, respectively.
As shown in Fig. 4(b), population-averaged MFRs of BG neurons, , for the phasic case are 30.7, 24.1, 39.8, 7.3, and 5.5 Hz for D1 (SPN), D2 (SPN), STN, GP, and SNr, respectively. We note that and of D1 and D2 SPNs are much larger than those for the tonic default case with Hz and Hz. As a result of activation of both D1 SPNs and D2 SPNs, both DP and IP become activated. In the case of IP, of GP neurons is reduced from that (= 29.9 Hz) for the resting default state due to strong inhibition from the D2 SPNs, and of STN neurons is increased from that (= 9.9 Hz) for the default state because of reduced inhibition from the GP neurons. Through competition between DP and IP, the firing activities of the output SNr neurons are suppressed [i.e. their MFR, , is reduced to 5.5 Hz from 25.5 Hz (default state)]. Due to reduced activity of SNr neurons, the thalamus becomes disinhibited. Thus, the BG gate to the thalamus is opened, leading to movement facilitation.
We make quantitative analysis of DP and IP currents, and , into the SNr. The strengths of DP and IP, and , given by the magnitudes of time-averaged DP current () and IP current (), are 2309.7 and 815.6, respectively [Figs. 4(c) and 4(d)]. They are much increased from (= 23.1) and (= 23.4) in the default state. But, we note that, in the case of phasic cortical input (10 Hz), is much more increased than . Hence, the competition degree between DP and IP, given by the ratio of to becomes 2.82 (i.e., DP is 2.82 times stronger than IP), in contrast to the default state with (i.e., DP and IP are nearly balanced). As a result of more activeness of DP, the MFR of the output SNr neurons, , becomes much decreased to 5.5 Hz from 25.5 Hz (default state). Consequently, in this healthy state with , the BG gate to the thalamus becomes opened, leading to facilitation of normal movement, via competitive harmony (i.e., competition and cooperative interplay) between DP and IP.
III.2 Pathological BG States with Disharmony between DP and IP
In this subsection, we consider the case of reduced DA level, (); (=0.3) is the normal DA level PD5 ; PD6 . With decreasing the fraction of DA level, , we make quantitative analysis of strengths of DP () and IP (), their competition degree , and (population-averaged) MFRs, of the BG neurons in the populations [ D1 (SPN), D2 (SPN), STN, GP, and SNr], in the case of phasic cortical input with Hz in the phasically-active state.
For D1 SPNs, raster plots of spikes and IPSRs are shown in Figs. 5(a1)-5(a4) for = 0.9, 0.6, 0.4, and 0.1, respectively. Their (population-averaged) MFR is found to monotonically decrease from 30.7 Hz [Fig. 5(b)]. Thus, D1 SPNs are under-active due to loss of DA, leading to occurrence of under-active DP.
In the case of D2 SPNs, Figs. 5(c1)-5(c4) show raster plots of spikes and IPSRs for = 0.9, 0.6, 0.4, and 0.1, respectively. In contrast to the case of D1 SPNs, their (population-averaged) MFR is found to monotonically increase from 24.1 Hz [Fig. 5(d)]. Thus, D2 SPNs are over-active because of loss of DA, resulting in appearance of over-active IP.
In the case of STN and GP, associated with IP, their population firing behaviors are shown in their raster plots of spikes and IPSRs for 0.9, 0.6, 0.4, and 0.1 [see Figs. 5(e1)-5(e4) for STN and see Figs. 5(g1)-5(g4) for GP]. Due to over-active firing activity of the D2 SPNs, the (population-averaged) MFR of GP neurons is found to monotonically decrease with from 7.3 Hz [Fig. 5(h)]. Also, because of reduced firing activity of the GP neurons, the (population-averaged) MFR of STN neurons is found to monotonically increase with from 39.8 Hz [Fig. 5(f)].
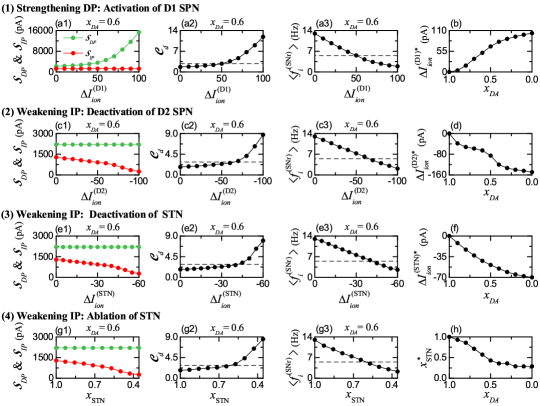
Figure 5(i) shows the plot of strengths of DP (green) and IP (red), and , versus . We note that, with decreasing from 1, increases rapidly (i.e., over-active IP), while decreases very slowly (i.e., under-active DP). Then, the competition degree between DP and IP, given by the ratio of to , is found to monotonically decrease from (=2.82), corresponding to that in the healthy state with harmony between DP and IP). When passing a threshold ), (i.e., DP and IP are balanced); for while for for
Figures 5(k1)-5(k4) and 5(l) show population and individual firing behaviors of the output SNr neurons, respectively. With decreasing from 1, their population-averaged MFR is found to monotonically increase from 5.5 Hz (corresponding to that in the healthy state). When passes its threshold, (), becomes larger than 25.5 Hz [corresponding to that in the default state with , and represented by the horizontal dashed line in Fig. 5(l)].
Due to loss of DA (), IP becomes highly over-active, while DP becomes under-active, in comparison to the healthy state with . For , . In this case, DP is still stronger than IP, and hence the BG gate to the thalamus is opened. But, the (population-averaged) MFR of SNr neurons, , is larger than that (= 5.5 Hz) for the healthy state with . Hence, with decreasing from 1, the “opening” degree (of the BG gate to the thalamus) is gradually reduced (i.e., occurrence of break-up of harmony between DP and IP), resulting in appearance of a pathological state (e.g., PD showing abnormal impaired movement)) with disharmony between DP and IP. For and Hz. In this case, IP is stronger than DP, and hence the BG gate to the thalamus becomes locked, leading to no movement. As is decreased from the “locking” degree of the BG gate (to the thalamus) is increased.
III.3 Treatment of Pathological States via Recovery of Harmony between DP and IP
For the pathological state, IP is over-active, while DP is under-active, in comparison to the healthy state. In this way, harmony between DP and IP is broken up in the case of the pathological state (i.e. occurrence of disharmony between DP and IP). Here, we investigate treatment of the pathological state with reduced competition degree [ (= 2.82 for the healthy state)] via recovery of harmony between DP and IP.
In Fig. 3, activation and deactivation of the target neurons via optogenetics are studied. When the light-sensitive proteins (called the opsins) are activated by specific light stimulation, variation in the intrinsic ionic currents of the neurons in the target population , , occurs. When is positive (negative), firing activity of the target neurons is increased (decreased), resulting in their activation (deactivation) OG1 ; OG2 . As discussed there, we simulate the effects of optogenetics by including in Eq. (8) (in Appendix A), in addition to the current, , into the target population. As the intensity of light stimulation is increased, the magnitude of also increases.
As an example, we consider the pathological state with for where harmony between DP and IP is broken up. In this pathological state, DP is under-active. Hence, we first strengthen the DP via activation of the target D1 SPNs. Figure 6(a1) shows plots of (strength of DP) and (strength of IP) versus . (green) increases rapidly from 2200, while (red) remains unchanged (i.e., 1288.9). Thanks to the strengthened DP, the competition degree between DP and IP is found to increase from 1.71 [Fig. 6(a2)]. Also, the population-averaged MFR of the output SNr neurons, , is found to decrease from 13 Hz [Fig. 6(a3)].
We note that, when passes a threshold (= 51 pA), and (= 5.5 Hz); and are those for the healthy state, and they are represented by the horizontal dashed lines in Figs. 6(a2) and 6(a3). Thus, for , the pathological state with may have (= 2.82) via activation of D1 SPNs for the threshold, (= 51 pA); DP becomes 2.82 times stronger than IP, as in the case of healthy state. In this way, balance between DP and IP is recovered for = 51 pA. Figure 6(b) shows the plot of versus . As is decreased from 1, the threshold is increased; with decreasing , more is necessary for recovery between DP and IP.
In the pathological state for , IP is over-active. Hence, for recovery of harmony between DP and IP, we try to weaken the IP via deactivation of D2 SPNs or STN neurons; in the case of deactivation, [ D2 (SPN) and STN] is negative, in contrast to the case of activation with . Figures 6(c1)- 6(c3) and 6(d) show the case of deactivation of D2 SPNs. As the magnitude of is increased (i.e., more negative), strength of IP, (red), is found to decrease from 1288.9, while (green) remains constant (= 2200). Due to the weakened IP, the competition degree between DP and IP increases from 1.71 [Fig. 6(c2)], and the population-averaged MFR of the output SNr neurons, , decreases from 13 Hz [Fig. 6(c3)]. When passing a threshold (= -65 pA), the competition degree and the population-averaged MFR recover their values for the healthy state, (= 2.82) and (= 5.5 Hz), as in the above case of activation of D1 SPNs. Thus, balance between DP and IP becomes recovered for = -65 pA. Figure 6(d) shows the plot of versus . With decreasing from 1, the threshold is decreased (i.e., its magnitude increases). As is decreased from 1, more negative is required for recovery between DP and IP.
We also study the case of deactivation of STN to weaken the IP. Figures 6(e1)- 6(e3) and 6(f) show the case of deactivation of STN. We note that the process of deactivation for STN is similar to that for D2 SPNs. Thus, when passes a threshold, (= -42 pA), balance between DP and IP becomes recovered (i.e., and have their values for the healthy state) [Figs. 6(e2) and 6(e3)]. As is decreased from 1, the threshold value of is found to decrease, and hence more negative is necessary to get recovery between DP and IP [Fig. 6(f)].
Finally, instead of the above activation/deactivation via optogenetics, we also consider ablation of STN neurons in the pathological state for to reduce the over-activity of STN neurons. In the case of ablation, the number of STN neurons, , is reduced to (, where (= 14) is the normal number of STN neurons and is the fraction of number of STN neurons. We note that, the effect of decreasing via ablation is similar to that of deactivation of STN neurons via optogenetics. Figures 6(g1)- 6(g3) and 6(h) show the case of ablation of STN neurons. With decreasing from 1, strength of IP, (red), is found to decrease from 1288.9 (i.e., IP becomes weakened) [Fig. 6(g1)]. When passing a threshold, , balance between DP and IP becomes recovered; and have their values for the healthy state with the balanced DP and IP [Figs. 6(g2) and 6(g3)]. Figure 6(h) shows the plot of versus . As is decreased, decreases; more ablation (i.e., smaller ) is necessary for balance between DP and IP.
IV Summary and Discussion
The BG exhibit diverse functions for motor and cognition. They control voluntary movement and make a crucial role in cognitive processes (e.g., action selection). Dysfunction in the BG is related to movement disorder (e.g., PD) and cognitive disorder. There are two competing pathways in the BG, “Go” DP (facilitating movement) and “No-Go” IP (suppressing movement) DIP1 ; DIP2 ; DIP3 ; DIP4 ; Frank1 ; Frank2 ; Go1 ; Go2 . A variety of functions of the BG have been known to be done via “balance” between DP and IP. However, so far, no quantitative analysis for such balance was made.
For quantitative analysis, we introduced the competition degree, between DP and IP, given by the ratio of strength of DP ( to strength of IP ( (i.e., ); () is just the magnitude of time-averaged DP (IP) current into the SNr (output nucleus) [i.e., () = () (the overline represents time averaging)]. By employing , we quantitatively analyzed competitive harmony (i.e., competition and cooperative interplay) between DP and IP.
The case of normal DA level of was first considered. A default BG state with (i.e., DP and IP are balanced) was found to appear for the tonic cortical input (3 Hz) in the resting state. In this default case, the firing activities of the output SNr neurons are very active with the firing frequency 25.5 Hz, leading to the locked state of the BG gate to the thalamus. As a result, no voluntary movement occurs. In contrast, for the phasic cortical input (10 Hz) in the phasically-active state, a healthy state with was found to appear. In this healthy case, DP is 2.82 times stronger than IP, in contrast to the default case with balanced DP and IP. Due to more activeness of DP, the firing frequency of the SNr neurons becomes much reduced to 5.5 Hz, resulting in the opened state of the BG gate to the thalamus. Consequently, normal movement occurs via competitive harmony between DP and IP.
However, as the DA level, (), is reduced, the competition degree between DP and IP was found to monotonically decrease from , resulting in appearance of a pathological state. In the case of the pathological state, strength of IP () was found to be much increased than that for the normal healthy state, which leads to disharmony between DP and IP. Due to break-up of harmony between DP and IP, generating from deficiency in DA production in the neurons of the SNc PD5 ; PD6 , a pathological state (e.g., PD with impaired movement) occurs.
In the case of the pathological state such as PD, DP is under-active, while IP is over-active, in comparison to the healthy state. We also investigated treatment of the pathological state via recovery of harmony between DP and IP. We included the effects of optogenetics, activating/deactivating the target neurons, in the governing equations of their states by adding (variation in the intrinsic ionic current of the target caused by the optogenetics). DP was found to be strengthened via activation of D1 SPNs, while IP was found to be weakened through deactivation of D2 SPNs or STN neurons. As a result of this kind of activation/deactivation, the competition degree () and the population-averaged MFR () of the SNr neurons were found to have their ones for the healthy state, [i.e., and 5.5 Hz]. In this way, treatment was done through recovery of harmony between DP and IP.
| Parmeters | D1/D2 SPN | STN | GP | SNr |
|---|---|---|---|---|
| 16.1 | 23.0 | 68.0 | 172.1 | |
| -80.0 | -56.2 | -53.0 | -64.58 | |
| -29.3 | -41.4 | -44.0 | -51.8 | |
| 1 | 0.439 | 0.943 | 0.7836 | |
| 0.01 | 0.021 | 0.0045 | 0.113 | |
| -20 | 4 | 3.895 | 11.057 | |
| -55 | -47.7 | -58.36 | -62.7 | |
| 84.2 | 17.1 | 0.353 | 138.4 | |
| 40 | 15.4 | 25 | 9.8 |
Finally, we discuss limitations of our present work and future works. In addition to motor control, the BG plays an important role in cognitive processes such as action selection GPR1 ; GPR2 ; Hump1 ; Hump2 ; Hump3 ; Man ; CN17 . In this case, a BG network with parallel channels, representing different action requests, arising from the cortex, is usually considered. Saliency of a channel may be given by the firing frequency of its cortical input; the higher frequency denotes the higher saliency. Resolution of competition between the channels may be given by selection of a particular channel with the highest salience. Firing activities of the SNr neurons in the highest salient channel are suppressed below the tonic firing frequency (threshold), and hence action in this channel is selected. On the other hand, in the other neighboring channels, firing activities of the SNr neurons are enhanced above the tonic frequency, and hence actions in these channels are not selected. As a future work, we could apply our present approach, based on the competition degree , to the case of action selection. Saliency of each channel may be given by its . Then, action in the channel with the highest could be selected.
Next, in future, we would like to consider more realistic SNN for the BG. In our present SNN, we consider only the D1/D2 SPNs (95 major population) in the striatum (primary input nucleus in BG). But, the remaining minor population of fast interneurons (FSIs) are known to exert strong effects on firing activities of the D1/D2 SPNs Str2 ; FSI . Hence, it is worth while to include the FSIs in the SNN for the BG. Of course, the effects of DA on the FSIs and their synaptic inputs must also be considered. In this way, to take into consideration the effects of the FSIs would be suitable for more complete SNN for the BG. Moreover, it would be desirable that, our present BG SNN with cortical inputs modelled by Poisson spike trains is extended to the cortico-BG-thalamo-cortical (CBGTC) loop by including the cortical and the thalamic neurons for more complete computational work CN1 ; CBGTC .
We also discuss application of the optogenetic techniques to human patients for treatment of a pathological state OG3 ; OG4 . In a pathological state with movement disorder (e.g., PD), harmony between DP and IP is broken up; DP is under-active, while IP is over-active, in comparison to the healthy case. As shown in Sec. III.3, such harmony between DP and IP could be recovered by strengthening DP or weakening IP. To this end, optogenetics may be used. Activation of D1 SPNs via optogenetics leads to strengthening DP and deactivation of D2 SPNs or STN neurons through optogenetics results in weakening IP. We hope that, in near future, safe clinical applications of optogenetic techniques to human patients could be successfully available through collaboration of researchers and clinicians. Then, it would take a substantial step forward for treatment of PD.
Acknowledgments
This research was supported by the Basic Science Research Program through the National Research Foundation of Korea (NRF) funded by the Ministry of Education (Grant No. 20162007688). SYK thanks Profs. Sengör and Humphries for discussions on the basal ganglia at the initial stage of this work.
Appendix A Izhikevich Spiking Neuron Models and DA Effects
The Izhikevich neuron models are chosen as elements of our BG SNN Izhi1 ; Izhi2 ; Izhi3 ; Izhi4 . Evolution of dynamical states of individual neurons in the population [ D1 (SPN), D2 (SPN), STN, GP, and SNr] is governed by the following equations:
| (8) | |||||
| (9) | |||||
with the auxiliary after-spike resetting:
| (10) |
where and are the total number of neurons and the current into the th neuron in the population, respectively. In Eqs. (8) and (9), the dynamical state of the th neuron in the population at a time (msec) is characterized by its membrane potential (mV) and the slow recovery variable (pA). When the membrane potential reaches its apex (i.e., spike cutoff value), the neuron fires, and then the membrane potential and the recovery variable are reset according to the rules of Eq. (10).
There are 9 intrinsic parameters in each population; (pF): membrane capacitance, (mV): resting membrane potential, (mV): instantaneous threshold potential, (nS/mV): parameter associated with the neuron’s rheobase, (): recovery time constant, (nS): parameter associated with the input resistance, (mV): after-spike reset value of , (pA): after-spike jump value of , and (mV): spike cutoff value. Table 3 shows the 9 intrinsic parameter values of D1 SPN, D2 SPN, STN, GP, and SNr; in addition to the parameter values of the D1/D2 SPNs given in SPN1 ; SPN2 , we get the parameter values of the other neurons (STN, GP, SNr), based on the work in CN6 . In the case of GP and STN, we consider the major subpopulations of high frequency pauser (85 ) and short rebound bursts (60 ), respectively. Also, we use the standard 2-variable Izhikevich neuron model for the STN, instead of the 3-variable Izhikevich neuron model in CN6 ; these two models give nearly the same results for the STN.
| D1 SPN | ||
|---|---|---|
| D2 SPN |
We also consider the effects of DA modulation on the D1 and D2 SPNs SPN1 ; SPN2 ; CN6 . D1 receptors activation has two opposing effects on intrinsic ion channels. It enhances the inward-rectifying potassium current (KIR), leading to hyperpolarization of the D1 SPN. In contrast, it lowers the activation threshold of the L type current, resulting in depolarization of the D1 SPN. These two hyperpolarization and depolarization effects are modelled via changes in intrinsic parameters of the D1 SPN:
| (11) | |||||
| (12) |
Here, Eq. (11) models the hyperpolarizing effect of the increasing KIR by upscaling , while Eq. (12) models enhanced depolarizing effect of the L type current by downscaling . The parameters and denote the amplitudes of their respective effects, and is the DA level (i.e., fraction of active DA receptors) for the D1 SPNs.
Next, D2 receptors activation has small inhibitory effect on the slow A-type potassium current, leading to decrease in the neuron’s rheobase current. This depolarizing effect is well modelled by downscaling the parameter, :
| (13) |
where is the DA level for the D2 SPNs, and the parameter represents the downscaling degree in . Table 4 shows DA modulation on the intrinsic parameters of the D1/D2 SPNs where the parameter values of , , and are given SPN1 ; SPN2 ; CN6 . In this paper, we consider the case of .
Time-evolution of and in Eqs. (8) and (9) is governed by the current into the th neuron in the population, given by:
| (14) |
Here, , , and denote the external current from the external background region (not considered in the modeling), the synaptic current, and the injected stimulation current, respectively. In our BG SNN, we consider the case of no injected stimulation DC current (i.e., ).
| Parmeters | D1/D2 SPN | STN | GP | SNr |
|---|---|---|---|---|
| 0 | 56.5 | 84.0 | 292.0 | |
| 1 | 9.9 | 29.9 | 25.5 | |
| 246 | 11.9 | 274 | 942 |
The external current may be modeled in terms of [spontaneous current for spontaneous firing activity, corresponding to time average of ] and [random background input, corresponding to fluctuation from time average of ]. In the BG population, (independent of ) is just the spontaneous in-vivo current, , to get the spontaneous in-vivo firing rate in the presence of synaptic inputs in the resting state (in-vivo recording in awake resting state with tonic cortical input). The random background current is given by:
| (15) |
Here, is the parameter controlling the noise intensity and is the Gaussian white noise, satisfying the zero mean and the unit variance Kim1 ; Kim2 ; Kim3 :
| (16) |
Table 5 shows in-vivo firing activities of BG neurons in awake resting state with tonic cortical input for the normal DA level of ; spontaneous in-vivo currents , in-vivo firing rates , and random background inputs for Hump1 ; CN6 ; CN14 are given.
| Ctx D1/D2 SPN | AMPA | 0.6 | 6 | 10 | 0 |
| NMDA | 0.3 | 160 | 10 | 0 | |
| Ctx STN | AMPA | 0.388 | 2 | 2.5 | 0 |
| NMDA | 0.233 | 100 | 2.5 | 0 | |
| D1 SPN SNr | GABA | 4.5 | 5.2 | 4 | -80 |
| D2 SPN GP | GABA | 3.0 | 6 | 5 | -65 |
| STN GP | AMPA | 1.29 | 2 | 2 | 0 |
| NMDA | 0.4644 | 100 | 2 | 0 | |
| GP GP | GABA | 0.765 | 5 | 1 | -65 |
| GP STN | GABA | 0.518 | 8 | 4 | -84 |
| STN SNr | AMPA | 12 | 2 | 1.5 | 0 |
| NMDA | 5.04 | 100 | 1.5 | 0 | |
| GP SNr | GABA | 73 | 2.1 | 3 | -80 |
Appendix B Synaptic Currents and DA Effects
We explain the synaptic current in Eq. (14). There are two kinds of excitatory synaptic currents, and , which are are the AMPA (-amino-3-hydroxy-5-methyl-4-isoxazolepropionic acid) receptor-mediated and NMDA (-methyl--aspartate) receptor-mediated currents from the presynaptic source population to the postsynaptic th neuron in the target population, respectively. In addition to these excitatory synaptic currents, there exists another inhibitory synaptic current, , which is the (-aminobutyric acid type A) receptor-mediated current from the presynaptic source population to the postsynaptic th neuron in the target population.
| D1 SPN | ||
|---|---|---|
| D2 SPN | ||
| STN | ||
| GP |
Here, we follow the “canonical” formalism for the synaptic currents, as in our previous works in the cerebellum Cere1 ; Cere2 and the hippocampus Hippo1 ; Hippo2 ; Hippo3 ; Hippo4 . The synaptic current (= AMPA, NMDA, or GABA) from the presynaptic source population to the th postsynaptic neuron in the target population obeys the following equation:
| (17) |
Here, and are synaptic conductance and synaptic reversal potential, respectively.
The synaptic conductance is given by:
| (18) |
where and are the maximum synaptic conductance and the number of neurons in the source population . Here, the connection weight is 1 when the th presynaptic neuron is connected to the th postsynaptic neuron; otherwise (i.e., in the absence of such synaptic connection), .
We note that, in Eq. (18) denote fraction of open postsynaptic ion channels which are opened through binding of neurotransmitted (emitted from the source population ). A sum of exponential-decay functions provides time evolution of of the th cell in the source population:
| (19) |
where and are the total number of spikes and the th spike time of the th neuron, and the synaptic latency time constant, respectively.
Similar to our previous works in the cerebellum Cere1 ; Cere2 , we use the exponential-decay function (for contribution of a presynaptic spike occurring at in the absence of synaptic latency):
| (20) |
Here, is the synaptic decay time constant and the Heaviside step function satisfies for and 0 for .
We also note that, in the case of NMDA-receptor, the positive magnesium ions Mg2+ block some of the postsynaptic NMDA channels. In this case, fraction of non-blocked NMDA channels is given by a sigmoidal function SPN1 ; CN6 ; NMDA ,
| (21) |
where is the membrane potential of a neuron in the target population and is the equilibrium concentration of magnesium ions ( = 1 mM). Thus, the synaptic current into the th neuron in the target population becomes
| (22) |
Table 6 shows the synaptic parameters of the synaptic currents from the source population to the target population : maximum synaptic conductance , synaptic decay time , synaptic delay time , and synaptic reversal potential .
We also consider the effect of DA modulation on the synaptic currents into D1 SPN, D2 SPN, STN, and GP neurons in Fig. 1 SPN1 ; SPN2 ; CN6 . In the case of synaptic currents into the D1 SPNs, DA modulation effect is modelled by upscaling the NMDA receptor-mediated current with the factor :
| (23) |
where is the DA level for the D1 SPNs. (There is no DA effect on for the D1 SPNs.) On the other hand, in the case of synaptic currents into the D2 SPNs, DA modulation effect is modelled by downscaling the AMPA receptor-mediated current with the factor :
| (24) |
where is the DA level for the D2 SPNs. (There is no DA effect on for the D2 SPNs.) The scaling factors and are given in Table 7. Also, effects of DA modulation on synaptic currents into STN neurons and GP neurons are well given in Table 7. In these cases, all excitatory and inhibitory synaptic currents, , , and , are downscaled with their scaling factors, depending on . Here, .
References
- (1) L. Luo, Principles of Neurobiology (Garland Science, New York, 2016).
- (2) E. R. Kandel, J. H. Schwartz, and T. M. Jessell, Principles of Neural Science (McGraw-Hill, New York, 1991).
- (3) L. R. Squire, F. E. Bloom, S. K. McConnell, J. L. Roberts, N. C. Spitzer, and M. J. Zigmond, Fundamental Neuroscience (Academic Press, New York, 2003).
- (4) M. F. Bear, B. M. Connors, and M. A. Paradiso, Neuroscience: Exploring the Brain (Lippincott Williams Wikins, Philadelphia, 2007).
- (5) K. Gurney, T. J. Prescott, and P. Redgrave, Biol. Cybern. 84, 401 (2001).
- (6) K. Gurney, T. J. Prescott, and P. Redgrave, Biol. Cybern. 84, 411 (2001).
- (7) M. D. Humphries, R. D. Stewart, and K. N. Gurney, J. Neurosci. 26, 12921 (2006).
- (8) M. D. Humphries, “Basal ganglia: Mechanisms for action selection,” in Encyclopedia of Computation Neuroscience (Springer, New York, 2014).
- (9) M. D. Humphries and K. Gurney, Biol. Cybern. 115, 323 (2021).
- (10) A. Mandali, M. Rengaswamy, V. S. Chakravarthy, and A. A. Moustafa, Front. Neurosci. 9, 191 (2015).
- (11) M. J. Armstrong and M. S. Okun, JAMA 323. 548 (2020).
- (12) B. L. B. Marino, L. R. de Souza, K. P. A. Sousa, J. V. Ferreira, E. C. Padilha, C. H. T. P. da Silva, C. A. Taft and L. I. S. Hage-Melim, Mini. Rev. Med. Chem. 20, 754 (2020).
- (13) J. Guridi, R. González-Redondo, and J. A. Obeso, Parkinsons Dis., 943159 (2012).
- (14) M. D. Humphries, J. A. Obeso, and J. A. Dreyer, J. Neurol. Neurosurg. Psychiatry 89, 1181 (2018).
- (15) A.R. Sadek, P. J. Magill, and J. P. Bolam, J. Neurosci. 27, 6352 (2007).
- (16) P. Mailly, S. Charpier, A. Menetrey, and J. M. Deniau, J. Neurosci. 23, 5247 (2003).
- (17) D. E. Oorschot, J Comp. Neurol. 366, 580 (1996).
- (18) I. Bar-Gad, G. Morris, and H. Bergman, Prog. Neurobiol. 71, 439 (2003).
- (19) T. S. Gertler, C. S. Chan, and D. J. Surmeier, J. Neurosci, 28, 10814 (2008).
- (20) J. Moyer, J. A. Wolf, and L. H. Finkel, J Neurophysiol. 98, 3731 (2007).
- (21) J. A. Wolf, J. T. Moyer, M. T. Lazarewicz, D. Contreras, M. Benoit-Marand, P. O’Donnell, and L. H. Finkel, J. Neurosci. 25, 9080 (2005).
- (22) N. E. Hallworth, C. J. Wilson, and M. D. Bevan, J. Neurosci. 23, (2003).
- (23) J. Bugaysen, M. Bronfeld, H. Tischler, I. Bar-Gad, and A. Korngreen, PLoS One 5, e12001 (2010).
- (24) C. Richards, T. Shiroyama, and S. Kitai, Neurosci. 80, 545 (1997).
- (25) M. D. Bevan and C. J. Wilson, J. Neurosci. 19, 7617 (1999).
- (26) M. D. Bevan, C. J. Wilson, J. P. Bolam, and P. J. Magill, J. Neurophysiol. 83, 3169 (2000).
- (27) M. D. Bevan, P. J. Magill, N. E. Hallworth, J. P. Bolam, and C. J. Wilson, J. Nuerophysiol. 87, 1348 (2002).
- (28) J. L. Góngora-Alfaro, S. Hernández-López, J. Flores-Hernández, and E. Galarraga, Neurosci. Res. 29, 225 (1997).
- (29) X. Liu, Q. Zhang, Y. Wang, and F. Chen, J. Shanghai Jiaotong Univ. (Sci.) 27, 505 (2022).
- (30) J. Baufreton, J. F. Atherton, D.J. Surmeier, and M. D. Bevan, J. Neurosci. 25, 8505 (2005).
- (31) W. M. Connelly, J. M. Schulz, G. Lees, and J. N. Reynolds, J. Neurosci. 30, 14854 (2010).
- (32) K. Fujimoto and H. Kita, Brain Res. 609, 185 (1993).
- (33) K.-Z. Shen and S. W. Johnson, J. Physiol. 573, 697 (2006).
- (34) R. Ammari, B. Bioulac, L. Garcia, and C. Hammond, Front. Syst. Neurosci. 5, 43 (2011).
- (35) H. Nakanishi, H. Kita, and S. T. Kitai, Brain Res. 527, 81 (1990).
- (36) M. R. Park, W. M. Falls, and S. T. Kitai, J. Comp. Neurol. 211, 284 (1982).
- (37) P. Dayan, L. F. Abbott, Theoretical Neuroscience (MIT, Cambridge, 2001).
- (38) T. Götz, U. Kraushaar, J. Geiger, J. Lübke, T. Berger, P. Jonas, J. Neurosci. 17, 204 (1997).
- (39) J. P. Bolam, H. Bergman, A. M. Graybiel, M. Kimura, D. Plenz, H. S. Seung, D. J. Surmeier, and J. R. Wickens, “Microcircuits in the striatum,” in S. Grillner and A. M. Graybiel (eds.), Microcircuits: The Interface Between Neurons and Global Brain Function (MIT Press, Cambridge, 2006) pp. 165–190.
- (40) M. D. Humphries. R. Wood, and K. Gurney, Neural Netw. 22, 1174 (2009).
- (41) M. D. Humphries. N. Lepora, R. Wood, and K. Gurney, Front. Comput. Neurosci. 3, 26 (2009).
- (42) A. Tomkins, E. Vasilaki, C. Beste, K. Gurney, and M. D. Humphries, Front. Comput. Neurosci. 7, 192 (2014).
- (43) Z. Fountas and M. Shanahan, PLoS ONE 12, e0189109 (2017).
- (44) R. L. Albin, A. B. Young, and J. B. Penne, Trends Neurosci. 12, 366 (1989).
- (45) G. E. Alexander and M. D. Crutcher, Trends Neurosci. 13, 266 (1990).
- (46) M. R. DeLong, Trends Neurosci. 13, 281 (1990).
- (47) A. V. Kravitz, B. S. Freeze, P. R. L. Parker, K. Kay, M. T. Thwin, K. Deisseroth, and A. C. Kreitzer, Nature 466, 622 (2010).
- (48) M. J. Frank, L. C. Seeberger, and R. C. O’Reilly, Science 306, 1940 (2004).
- (49) M. J. Frank, J. Cogn. Neurosci. 17, 51 (2005).
- (50) S. Bariselli, W. C. Fobbs, M. C. Creed, and A. V. Kravitz, Brain Res. 1713, 70 (2019).
- (51) J. Bahuguna, A. Aertsen, and A. Kumar, PLoS Comput. Biol. 11, e1004233 (2015).
- (52) E. M. Navarro-López, U. Celikok, and N. S. Sengör, Cogn. Neurodyn. 15, 693 (2021).
- (53) E. M. Navarro-López, U. Celikok, and N. S. Sengör, “Chapter 9 - Hybrid systems neuroscience,” in A. E. Hady (ed.) Closed Loop Neuroscience (Elsevier, London, 2016) pp. 113-129.
- (54) U. Celikok, E. M. Navarro-López, and N. S. Sengör (2016) arXiv:1601.07740.
- (55) U. Celikok and N. S. Sengör, Conference paper in the International Conference on Artificial Neural Networks (2016).
- (56) Y. Cakir, J. Cogn. Syst. 4, 38 (2019).
- (57) Z. Fountas and M. Shanahan, International Joint Conference on Neural Networks (IJCNN) 1 (2014).
- (58) Z. Fountas and M. Shanahan, (2017) BioRxiv DOI:10.1101/197129.
- (59) Z. Fountas and M. Shanahan, International Joint Conference on Neural Networks (IJCNN), 2407 (2014).
- (60) Z. Fountas, Action Selection in The Rhythmic Brain: The Role of The Basal Ganglia and Tremor (2016) PhD thesis.
- (61) M. D. Mark, R. Wood, and K. Gurney, PLoS Comput. Biol. 6, e1001011 (2010).
- (62) M. D. Humphries, J. A. Obeso, and J. K. Dreyer, J. Neurol. Neurosurg. Psychiatry 89, 1181 (2018).
- (63) M. J. Frank, B. Loughry, and R. C. O’Reilly, Cogn. Affect Behav. Neurosci. 1, 137 (2001).
- (64) M. Lindahl, I. K. Sarvestani, O. Ekeberg, and J. H. Kotaleski, Front. Comput. Neurosci. 7, 76 (2013).
- (65) M. Lindahl and J. H. Kotaleski, eNeuro 3, e0156-16 (2016).
- (66) K. P. Michmizos, K. S. Nikita, “Local field potential driven Izhikevich model predicts a subthalamic nucleus neuron activity,” in: Engineering in Medicine and Biology Society, EMBC, 2011 Annual International Conference of the IEEE (IEEE, 2011). p. 5900-5903.
- (67) B. Sen-Bhattacharya, S. James, O. Rhodes, I. Sugiarto, A. Rowley, A, B. Stokes, K. Gurney, and S. B. Furber, IEEE Trans. Cogn. Develop. Syst. 10, 823 (2018).
- (68) K. Kumaravelu, D. T. Brocker, and W. M. Grill, J. Comput. Neurosci. 40, 207 (2016).
- (69) C. M. Thibeault and N. Srinivasa, Front. Comput. Neurosci. 7, 88 (2013).
- (70) J. E. Rubin, Curr. Opin. Neurobiol. 46, 127 (2017).
- (71) D. S. Andres and O. Darbin, J. Neuropsychiatry Clin. Neurosci. 30, 101 (2018).
- (72) O. Maith, F. V. Escudero, H. Ü. Dinkelbach, J. Baladron, A. Horn, F. Irmen, A. A. Kühn, and F. H. Hamker, Eur. J. Neurosci. 53, 2278 (2021).
- (73) J. A. Obeso, M. Rodriguez-Oroz, C. Marın, P. Alonso, I. Zamarbide, J. L. Lanciego, and M. Rodriguez-Diaz, Neurology 62, S17 (2004).
- (74) J. A. Obeso, C. Marin, C. Rodriguez-Oroz, J. Blesa, B. Benitez-Temiño, J. Mena-Segovia, M. Rodríguez, and C. W. Olanow, Ann. Neurol. 64, S30 (008).
- (75) R. S. Turner and M. R. DeLong, J. Neurosci. 20, 7096 (2000).
- (76) E. Bauswein, C. Fromm, and A. Preuss, Brain Res. 493, 198 (1989).
- (77) J. E. Belforte, V. Zsiros, E. R. Sklar, Z. Jiang, G. Yu, Y. Li, E. M. Quinlan, and K. Nakazawa, Nat. Neurosci. 13, 76 (2010).
- (78) J. L. Reed, H. Z. Qi, Z. Zhou, M. R. Bernard, M. J. Burish, A. Bonds, and J. H. Kaas, J. Neurophysiol. 103, 2139 (2010).
- (79) T. Zheng and C. J. Wilson, J. Neurophysiol. 87, 1007 (2002).
- (80) E. M. Izhikevich, IEEE Trans. Neural. Netw. 14, 1569 (2003).
- (81) E. M. Izhikevich, IEEE Trans. Neural Netw. 15, 1063 (2004).
- (82) E. M. Izhikevich, Dynamical Systems in Neuroscience: The Geometry of Excitability and Bursting (MIT Press, Cambridge, 2007).
- (83) E. M. Izhikevich, Cereb. Cortex 17, 2443 (2007).
- (84) S.-Y. Kim and W. Lim, Cogn. Neurodyn. 14, 535 (2020).
- (85) S.-Y. Kim and W. Lim, Neural Netw. 106, 50 (2018).
- (86) S.-Y. Kim and W. Lim, Neural Netw. 97, 92 (2018).
- (87) S.-Y. Kim and W. Lim, Neural Netw. 134, 173 (2021).
- (88) S.-Y. Kim and W. Lim, Cogn. Neurodyn. 15, 1067 (2021).
- (89) S.-Y. Kim and W. Lim, Phys. Rev. E 105, 014418 (2022)
- (90) S.-Y. Kim and W. Lim, Cogn. Neurodyn. 16, 643 (2022).
- (91) S.-Y. Kim and W. Lim, Cogn. Heurodyn. 16, 1427 (2022).
- (92) S.-Y. Kim and W. Lim, Cogn. Neurodyn. DOI: 10.1007/s11571-023-09985-5 (2023).
- (93) X. J. Wang, Physiol. Rev. 90, 1195 (2010).
- (94) N. Brunel and X. J. Wang, J Neurophysiol. 90, 415 (2003).
- (95) C. Geisler, N. Brunel, and X. J. Wang, J. Neurophysiol. 94, 4344 (2005).
- (96) N. Brunel and V. Hakim, Chaos 18, 015113 (2008).
- (97) S.-Y. Kim and W. Lim W, J. Neurosci. Meth. 226, 161 (2014).
- (98) H. Shimazaki and S. Shinomoto, J. Comput. Neurosci. 29, 171 (2010).
- (99) A. V. Kravitz, B. S. Freeze, P. R. L. Parker, K. Kay, M. T. Thwin, K. Deisseroth, and A. C. Kreitzer, Nature 466, 622 (2010).
- (100) F. Tecuapetla, S. Matias, G. P. Dugue, Z. F. Mainen, and R. M. Costa, Nat. Commun. 5, 4315 (2014).
- (101) T. Koos and J. M. Tepper, Nature Neurosci. 2, 467 (1999).
- (102) Y. Shen, R. E. Campbell, D. C. Côté and M.-E. Paquet, Front. Neural Circuits 14, article 41 (2020).
- (103) A. H. Gittis and E. A. Yttri, Curr. Opin. Biomed. Eng. 8, 14 (2018).
- (104) S. Narayanan, Neurocomput. 52–54, 605 (2003).
- (105) C. E. Jahr and C. F. Stevens, J. Neurosci. 10, 3178 (1990).