Gaia DR3: Apsis III - Non-stellar content and source classification
Abstract
Context. As part of the third Gaia data release, we present the contributions of the non-stellar and classification modules from the eighth coordination unit (CU8) of the Data Processing and Analysis Consortium, which is responsible for the determination of source astrophysical parameters using Gaia data. This is the third in a series of three papers describing the work done within CU8 for this release.
Aims. For each of the five relevant modules from CU8, we summarise their objectives, the methods they employ, their performance, and the results they produce for Gaia DR3. We further advise how to use these data products and highlight some limitations.
Methods. The Discrete Source Classifier (DSC) module provides classification probabilities associated with five types of sources: quasars, galaxies, stars, white dwarfs, and physical binary stars. A subset of these sources are processed by the Outlier Analysis (OA) module, which performs an unsupervised clustering analysis, and then associates labels with the clusters to complement the DSC classification. The Quasi Stellar Object Classifier (QSOC) and the Unresolved Galaxy Classifier (UGC) determine the redshifts of the sources classified as quasar and galaxy by the DSC module. Finally, the Total Galactic Extinction (TGE) module uses the extinctions of individual stars determined by another CU8 module to determine the asymptotic extinction along all lines of sight for Galactic latitudes .
Results. Gaia DR3 includes 1591 million sources with DSC classifications; 56 million sources to which the OA clustering is applied; 1.4 million sources with redshift estimates from UGC; 6.4 million sources with QSOC redshift; and 3.1 million level 9 HEALPixes of size 2 where the extinction is evaluated by TGE.
Conclusions. Validation shows that results are in good agreement with values from external catalogues; for example of the QSOC redshifts have absolute error lower than for sources with empty warning flags, while UGC redshifts have a mean error of if evaluated on a clean set of spectra. An internal validation of the OA results further shows that million sources are located in high confidence regions of the clustering map.
Key Words.:
methods: data analysis; methods: statistical; galaxies: fundamental parameters; dust, extinction; quasars: general; catalogs;1 Introduction
The ESA Gaia mission was designed to create the most precise three dimensional map of the Milky way, along with its kinematics, through the repeated observation of about two billion stars. Gaia observes all objects in the sky down to an apparent magnitude of about mag, which includes millions of galaxies and quasars. (Gaia Collaboration, Prusti et al., 2016). The data collected between 25 July 2014 and 28 May 2017 (34 months) have been processed by the Gaia Data Processing and Analysis Consortium (DPAC) to provide the third data release of the Gaia catalogue, Gaia DR3.
For sources with mag, typical positional uncertainties are on the order of as; parallax uncertainties on the order of as; proper motion uncertainties on the order of as yr-1; and magnitude uncertainties on the order of mmag. In addition to this exquisite astrometric and photometric performance, Gaia provides high-resolution spectroscopy () centred around the calcium triplet (– nm), hence its name radial velocity spectrometer (RVS), as well as low-resolution spectrophotometry from two instruments: the blue photometer (BP) covering the wavelength range – nm with , and the red photometer (RP) covering the wavelength range – nm with (Carrasco et al., 2021).
Eight coordination units (CUs) were set up within the DPAC, each focusing on a particular aspect of the Gaia processing: CU1 for managing the computer architecture; CU2 for the data simulations; CU3 for the core astrometric processing; CU4 for the analysis of non-single stars, Solar System objects, and extended objects; CU5 for the photometric BP/RP processing; CU6 for the spectroscopic RVS processing; CU7 for the variability analysis; and CU8 for the determination of the astrophysical parameters (APs) of the observed sources. Finally, a ninth CU is responsible for the catalogue validation, access, and publication.
This paper is the third in a series of three papers describing the processing done within CU8. The first of these, Creevey et al. (2022), summarises the work done in CU8 and the various APs it produces. The second, Fouesneau et al. (2022), describes stellar APs. The present paper discusses the object classification and the non-stellar APs produced by CU8, namely the redshifts of extragalactic sources and total Galactic extinction map. We describe the results and methods of the relevant modules, as they have evolved since their description given prior to launch (Bailer-Jones, C. A. L. et al., 2013), while focusing on technical details. A thorough scientific analysis of these results, seen from a cross-CU perspective, can be found in performance verification papers like in Gaia Collaboration, Bailer-Jones et al. (2022), where the classification and characterisation of the extragalactic sources are discussed in more details.
We provide an overview of the data products from the classification and non-stellar modules in Section 2. The Discrete Source Classifier (DSC), which classifies sources probabilistically into five classes that are known a priori from its training set (quasar, galaxy, star, white dwarf, and physical binary star), is described in Section 3. The Outlier Analysis (OA), which complements the DSC classification through a clustering algorithm applied to BP/RP spectra of sources with low DSC probability, is described in Section 4. The quasar classifier (QSOC) and Unresolved Galaxy Classifier (UGC), both based on BP/RP spectra, make use of the DSC probabilities in order to identify quasars and galaxies and subsequently determine their redshifts; these are described in Sections 5 and 6, respectively. Finally, the global stellar parameters of giant stars, as inferred from BP/RP spectra, allow the Total Galactic Extinction (TGE) module to derive the Galactic extinction seen along a given line-of-sight as described in Section 7. Finally, we summarise the improvements that are currently foreseen for Gaia DR4 in Section 8. Additional information on the design and performance of the modules can be found in the Gaia online documentation111https://gea.esac.esa.int/archive/documentation/GDR3/index.html.
2 Overview of the non-stellar astrophysical parameters from CU8 in Gaia DR3
The five non-stellar modules together contribute to unique fields in the Gaia DR3. Table 1 provides an overview of the tables and fields that each of the modules contributes to, including the resulting number of entries in each table. These fields are spread over eight different tables and concern about billion unique sources. Figure 1 sketches the inter-dependency between these modules, the selection they apply on the DSC probabilities, their input, output, and the number of sources for which they produce results in Gaia DR3. The different selection policies from each module are clearly seen in this plot; each leads to a different associated completeness and purity. The filtering applied by each module on the results they produced is not mentioned here, although we should generally not expect the number of sources satisfying the provided DSC selection criteria to be equal to the number of sources for which there are results in Gaia DR3 for each module.

3 Source classification (DSC)
3.1 Objectives
DSC classifies Gaia sources probabilistically into five classes: quasar, galaxy, star, white dwarf, and physical binary star. These classes are defined by the training data, which are Gaia data, with labels provided by external catalogues. DSC comprises three classifiers: Specmod uses BP/RP spectra to classify into all five classes; Allosmod uses various other features to classify into just the first three classes; Combmod takes the output class probabilities of the other two classifiers and combines them to give combined probabilities in all five classes.
3.2 Method
3.2.1 Algorithms and I/O
Specmod uses an ExtraTrees classifier, which is an ensemble of classification trees. Each tree maps the 100-dimensional input space of the BP/RP spectrum —60 samples each, minus 5 samples that are rejected at the edges of each spectrum— into regions that are then identified with each of the five classes. By using an ensemble of hundreds of trees, these individual discrete classifications are turned into class probabilities.
Allosmod uses a Gaussian Mixture Model (GMM). For each class, the distribution of the training data in an eight-dimensional feature space is modelled by a mixture of 25 Gaussians. This is done independently for all three classes (quasar, galaxy, star). Once appropriately normalised and a suitable prior applied, each GMM gives the probability that a feature vector (i.e. a new source) is of that class. The eight features are as follows; they are fields in the Gaia source table or are computed from these fields:
-
•
sine of the Galactic latitude, ,
-
•
parallax, parallax,
-
•
total proper motion, pm,
-
•
unit weight error (uwe),
, -
•
band magnitude, phot_g_mean_mag,
-
•
colour , bp_g,
-
•
colour , g_rp,
-
•
The relative variability in the band (relvarg),
.
All eight features must exist for a given source for Allosmod to provide a probability. As explained below, we exploit some of the ‘failures’ of these features to help identify objects. For example, galaxies should have true proper motions (and parallaxes) very close to zero. Yet they sometimes have larger measured proper motions in Gaia DR3 on account of their physical extent combined with the variability in the calculation of the centroid during each scan made by Gaia (obtained at different position angles). This can give rise to spuriously large proper motions (although the uncertainties are also larger). In many cases, these solutions are rejected by the astrometric solutions (to give the so-called 2p solutions; see Lindegren et al. 2021 for the definitions), meaning that many galaxies lack parallaxes and proper motions and are therefore not processed by Allosmod.
Allosmod models the distribution of the data, and so it provides likelihoods. When combined with the class prior, this gives posterior class probabilities, which are the output from Allosmod. Specmod, in contrast, is a tree-based model that does not strictly provide posterior probabilities. Moreover, its output is influenced by the distribution in the training data (see below). However, by using the simple method described in the online documentation we can adjust the outputs from Specmod so that they are analogous to posterior probabilities that incorporate our desired class prior. Allosmod is described in more detail in Bailer-Jones et al. (2019), where it is applied to Gaia DR2 data.
The third DSC classifier, Combmod, takes the probabilities from Specmod and Allosmod for a source and combines them into a new posterior probability over all five classes. This is not entirely trivial, because it has to ensure that the global prior is not counted twice, and it has to allow for the fact that Specmod has more classes than Allosmod. The combination algorithm is described in Appendix B.
3.2.2 Class prior
| quasar | galaxy | star | white dwarf | physical binary star | |
|---|---|---|---|---|---|
| 1/1000 | 1/5000 | 1 | 1/5000 | 1/100 | |
| 0.000989 | 0.000198 | 0.988728 | 0.000198 | 0.009887 |
Single stars hugely outnumber extragalactic sources in Gaia, and failing to take this into account would give erroneous probabilities and classifications. Specifically, if we were to assume equal priors for all classes, then when the attributes of a given source do not provide a strong discrimination between the classes, the source would be classified as any class with near equal probabilities. However, in reality, the source is far more likely to be a star, because extragalactic sources are so rare. We must therefore set appropriate priors for the classes. Failing to do so corresponds to the well-known base rate fallacy. We choose here to adopt a global prior that reflects the expected fraction of each class (as we define them) in the entire Gaia DR3 data set. This prior is given in Table 2. As the relative fraction of extragalactic to Galactic objects that Gaia observes varies with quantities such as magnitude and Galactic latitude, we could make the prior a function of these (and potentially other) quantities; but we have not introduced this in Gaia DR3.
Using the correct prior is important. A classifier with equal priors would perform worse on the rare objects than a classifier with appropriate priors, because the former would tend to misclassify many stars as being extragalactic. However, we would not notice this if we erroneously validated the classifier on a balanced set (equal numbers in each class), because such a validation set has an artificially low fraction of stars, and hence far too few potential contaminants. The classifier would perform worse but would appear to be performing better. This is demonstrated in Table 1 of Bailer-Jones et al. (2019). We address this issue in the context of our validation data in section 3.3.
3.2.3 Training data
DSC is trained empirically, meaning it is trained on a labelled subset of the actual Gaia data it will be applied to (except for binary stars). The classes were defined by selecting sources of each class from an external database and cross-matching them to Gaia DR3. The sources used to construct the training sets —and which therefore define the classes— are as follows ( see the online documentation and Bailer-Jones (2021) for more details):
-
•
Quasars: 300 000 spectroscopically confirmed quasars from the fourteenth release of the Sloan Digital Sky Survey (SDSS) catalogue, SDSS-DR14 (Pâris et al., 2018).
-
•
Galaxies: 50 000 spectroscopically confirmed galaxies from SDSS-DR15 (Aguado et al., 2019).
-
•
Stars: 720 000 objects drawn at random from Gaia DR3 that are not in the quasar or galaxy training sets. Strictly speaking, this is therefore an ‘anonymous’ class. But as the vast majority of sources in Gaia are stars, and the majority of those will appear in (spectro)photometry and astrometry as single stars, we call this class ‘stars’.
-
•
White dwarfs: 40 000 white dwarfs from the Montreal White Dwarf Database222http://www.montrealwhitedwarfdatabase.org that have coordinates and that are not known to be binaries using the flag provided in that table. This class is not in Allosmod.
-
•
Physical binary stars: 280 000 BP/RP spectra formed by summing the two separate components in spatially-resolved binaries in Gaia DR3 (see the online documentation). This is only done for the BP/RP spectra, not for astrometry or photometry, so physical binaries are not a class in Allosmod.
The quasar, galaxy, and star class definitions are more or less the same as in Bailer-Jones et al. (2019).
The selected sources were filtered in order to remove obvious contaminants or problematic measurements (as described in the online documentation). The numbers above refer to what remains after this filtering. The remaining set was then split into roughly equally sized training and validation sets (per class). Generally speaking, the relative number of objects of each class —the class fraction— in the training data affects the output probabilities of a classifier, because it acts as an implicit prior in the classifier. However, for both Specmod and Allosmod, we remove this influence to ensure that their priors correspond to our class prior. We are therefore free to choose as many training examples in each class as we need, or can obtain, in order to learn the data distributions.
We note that for the common classes between Specmod and Allosmod, that is, quasars, galaxies, and stars, a common sample with complete input data was used to train both modules. In particular, this means that even though Specmod does not require parallaxes and proper motions as inputs, its training sample is restricted to those sources that do have parallaxes and proper motions. This is important because Specmod is also applied to sources that lack parallaxes and proper motions, meaning that some of its results are on types of objects that are not represented in its training set. This is particularly important for galaxies.


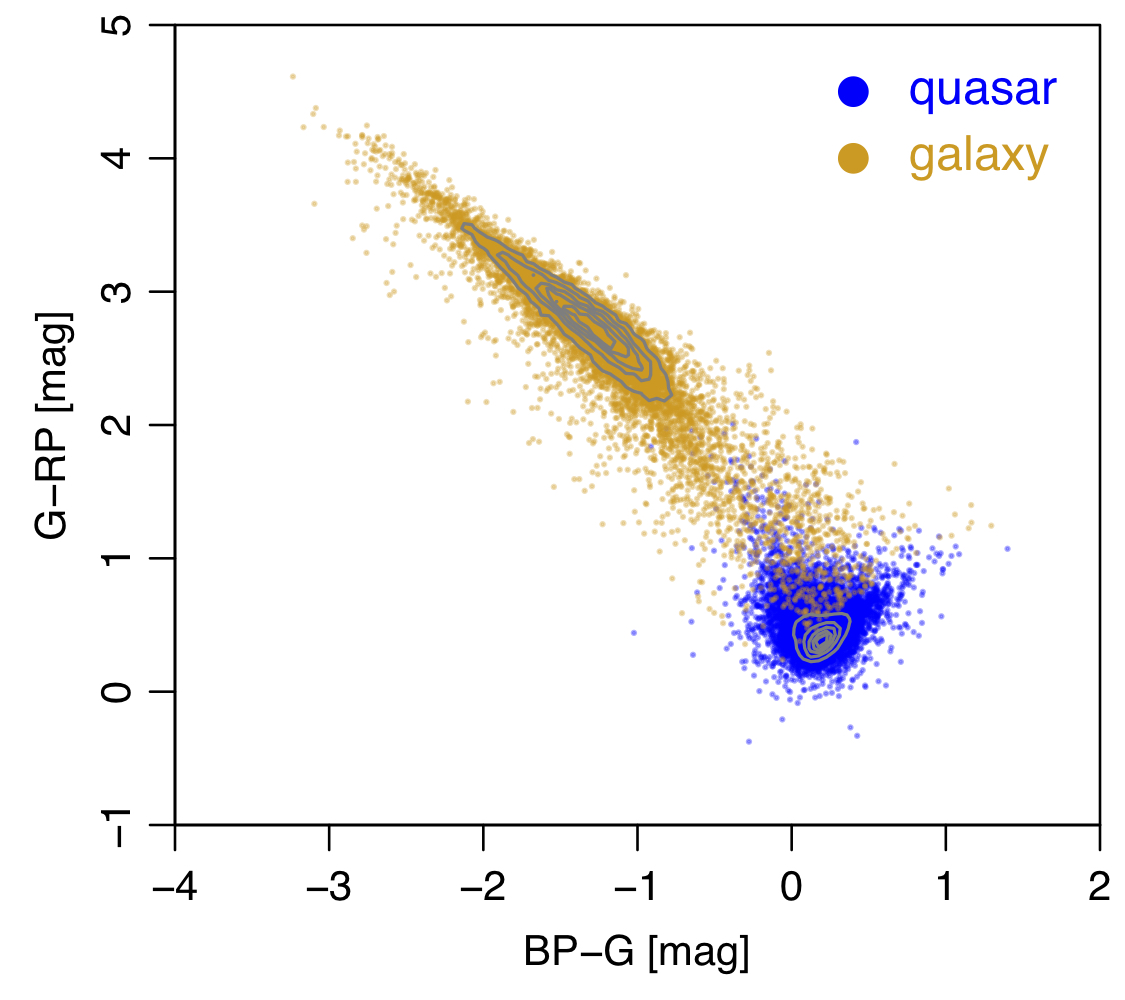
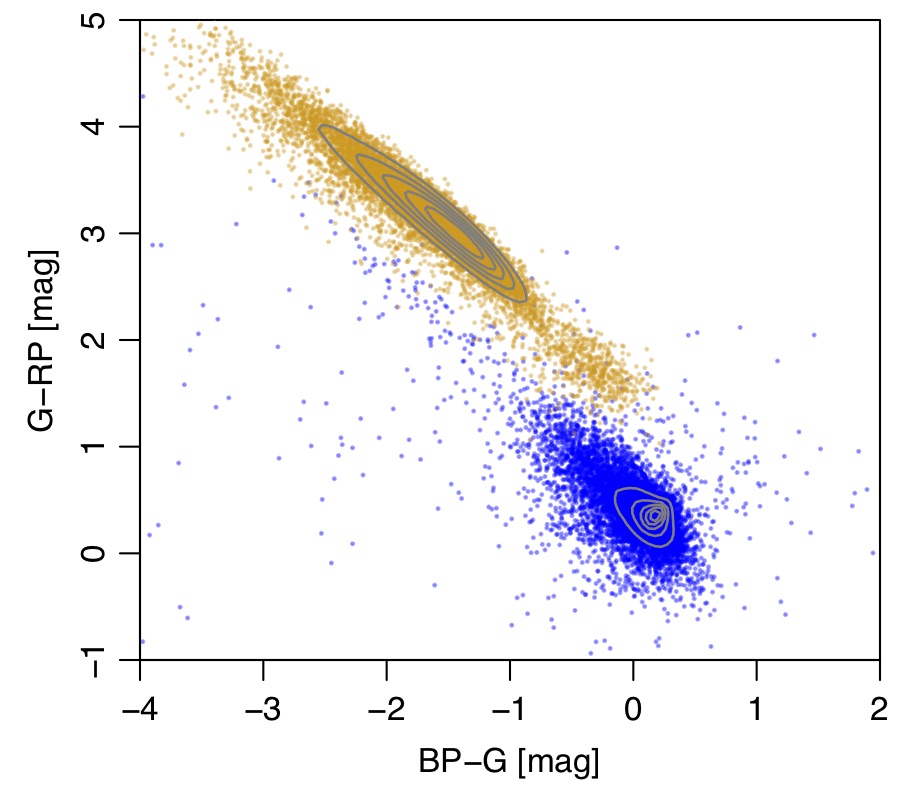
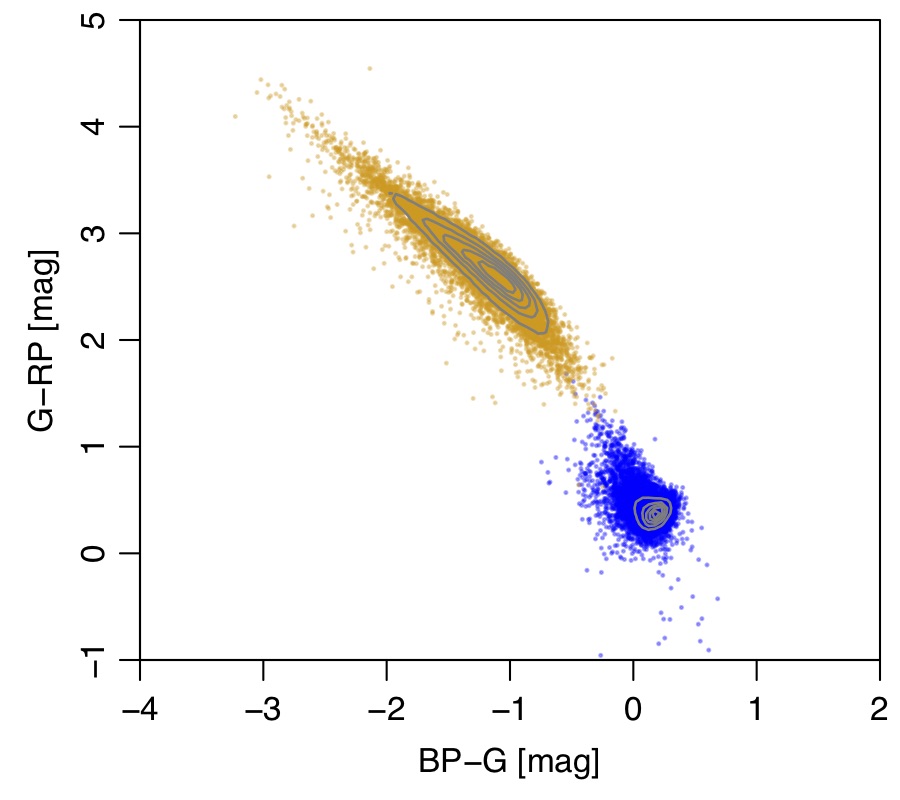
Figure 2 (top) shows the distribution of the eight Allosmod features in the training data for the quasar and galaxy classes. As we do not want the model to learn the distribution of extragalactic objects, which is just the SDSS footprint (shown in the plot), we replace this with a random value drawn from a uniform distribution in (i.e. uniform sky density) when training Allosmod. This plot also shows, for comparison, the distribution of the features for the star class in the training data. Figure 3 (top) shows the distribution of the two colours of the quasars and galaxies in a colour–colour diagram.
3.2.4 Class labels
The main output from DSC is the class probabilities from all three classifiers. For convenience, we also compute two class labels from the probabilities, which appear only for sources in the qso_candidates and galaxy_candidates tables in the data release. The first label, classlabel_dsc, is set to the class that gets the highest posterior probability in Combmod that is greater than 0.5. If none of the output probabilities are above 0.5, this class label is unclassified. This gives a sample that is fairly complete for quasars and galaxies, but not very pure.
The second class label, classlabel_dsc_joint, identifies a purer set of quasars and galaxies. It is set to the class that achieves a probability above 0.5 in both Specmod and Allosmod. This produces purer samples because the Specmod and Allosmod probabilities are not perfectly correlated. This lack of correlation may be unexpected, but is what we want, because it means the classifiers are providing non-redundant information.
Because DSC is not the only contributor to the qso_candidates and galaxy_candidates tables, sources in the qso_candidates table can have either classlabel set to galaxy, and vice versa.
3.3 Performance: Purity and completeness
By assigning each source to the class with the largest probability, it is uniquely classified. An alternative is to additionally adopt a minimum probability threshold, in which case we can get multiple classifications if the threshold is low enough, or no classification if it is high enough. Doing this on sources with known classes (assumed to be correct), we can then compute the confusion matrix, which tells us how many sources of each true class are assigned to each DSC class. From this, we then compute, for each class, the completeness –the fraction of true positives among all trues— and the purity —the fraction of true positives among all positives.
Here we use the largest probabilities to compute the completenesses and purities on the validation sets.333The validation data for the binaries is not the one mentioned in section 3.2.3, namely synthetically-combined single stars, but instead a set of unresolved binaries directly from Gaia. See the online documentation for more details. As the class fractions in this validation set are not representative of what they are in Gaia, the raw purities are meaningless. Specifically, stars are far less common in the validation data than they are in a random sample of Gaia data, and so there are too few potential contaminants of the other classes in the validation data, resulting in significantly overestimated purities. This fact is sometimes overlooked in the validation of classification results in the literature. Fortunately, we can easily correct for this. As explained in section 3.4 (especially equation 4) of Bailer-Jones et al. (2019), we can modify the confusion matrix to correspond to a validation set that has class fractions equal to the class prior. The purity computed from this modified confusion matrix is then appropriate for any randomly selected sample of Gaia sources. (This modification does not affect the completeness.) We note that this modification is independent of the fact that DSC probabilities are already posterior probabilities that take into account this class prior (i.e. both modifications must be done). This should also serve as a warning when assessing any classifier: if the validation data set does not have a representative fraction of contamination, or if this is not adjusted, the predicted purities will be erroneous.
| Specmod | Allosmod | Combmod | Spec&Allos | |||||
| compl. | purity | compl. | purity | compl. | purity | compl. | purity | |
| quasar | 0.409 | 0.248 | 0.838 | 0.408 | 0.916 | 0.240 | 0.384 | 0.621 |
| galaxy | 0.831 | 0.402 | 0.924 | 0.298 | 0.936 | 0.219 | 0.826 | 0.638 |
| star | 0.998 | 0.989 | 0.998 | 1.000 | 0.996 | 0.990 | – | – |
| white dwarf | 0.491 | 0.158 | – | – | 0.432 | 0.250 | – | – |
| physical binary star | 0.002 | 0.096 | – | – | 0.002 | 0.075 | – | – |
| quasar, | 0.409 | 0.442 | 0.881 | 0.603 | 0.935 | 0.412 | 0.393 | 0.786 |
| galaxy, | 0.830 | 0.648 | 0.928 | 0.461 | 0.938 | 0.409 | 0.827 | 0.817 |
Table 3 shows the completenesses and purities for the DSC classes and classifiers. This is the performance we expect for a sample selected at random from the entire Gaia dataset that has complete input data for both Specmod and Allosmod. It accommodates the rareness of all these classes, as specified by the global class prior (Table 2), both in the probabilities and the application data set. It is important to bear in mind that these purity and completeness measures only refer to the types of objects in the validation set. For extragalactic objects, this means objects classified as such by SDSS using the SDSS spectra. The overall population of extragalactic objects classified by DSC is of course broader than this, and so the completeness and purity evaluated on other subsets of extragalactic objects could differ.
Due to the dominance of single stars in Gaia, we are not really interested in the performance on this class. Indeed, it is trivial to get an excellent single-star classifier: simply call everything a single star and your classifier has 99.9% completeness and 99.9% purity.
The performance is modest overall, for reasons that are further discussed in section 3.5. Results on binaries are very poor, partly because the validation set we used to compute the confusion matrix is not representative of the training set. This is because the validation set comprises only real Gaia objects, and so known unresolved binaries, whereas the training set was made by combining single star spectra. However, the internal performance on binaries was also poor. This suggests an intrinsic difficulty in separating binaries (as we define them) from single stars.
The performance in Table 3 refers to objects covering the full Gaia parameter space, in particular all magnitudes and Galactic latitudes. The purities tend to increase for brighter magnitudes, as can be seen from the plots in the online documentation and in Bailer-Jones (2021). There we see, for example, that for mag, the purities for quasars and galaxies when using Allosmod alone is 80% or higher. However, when looking at the performance in a specific part of the parameter space, one should adopt a new prior that is appropriate for that part of the parameter space, for example fewer extragalactic objects visible at low latitudes. We then recompute the posterior probabilities (Appendix C) and the completenesses and purities (remembering that the adjustment of the confusion matrix must use the class fractions in this subset of the validation set). This we have done for sources outside of the Galactic plane, with results reported in the bottom two lines of Table 3. For , we adopt a prior probability for quasars of ( globally), and a prior probability for galaxies of ( globally). The purities of the quasar and galaxy samples are significantly higher, as expected because there are fewer contaminating stars per square degree. Using a probability threshold increases the purities even further, albeit at the expense of completeness (see online documentation for more plots). Clearly, if we were willing and able to push the prior for extragalactic objects higher, we would obtain higher purities.
3.4 Results
DSC was applied to all Gaia sources that have the required input data. Its results were not filtered in any way. In particular, we did not remove sources with lower quality input data, or that have input data lying outside the range of the training data. By including all results, we allow the user to apply their own filters according to their own goals and needs.
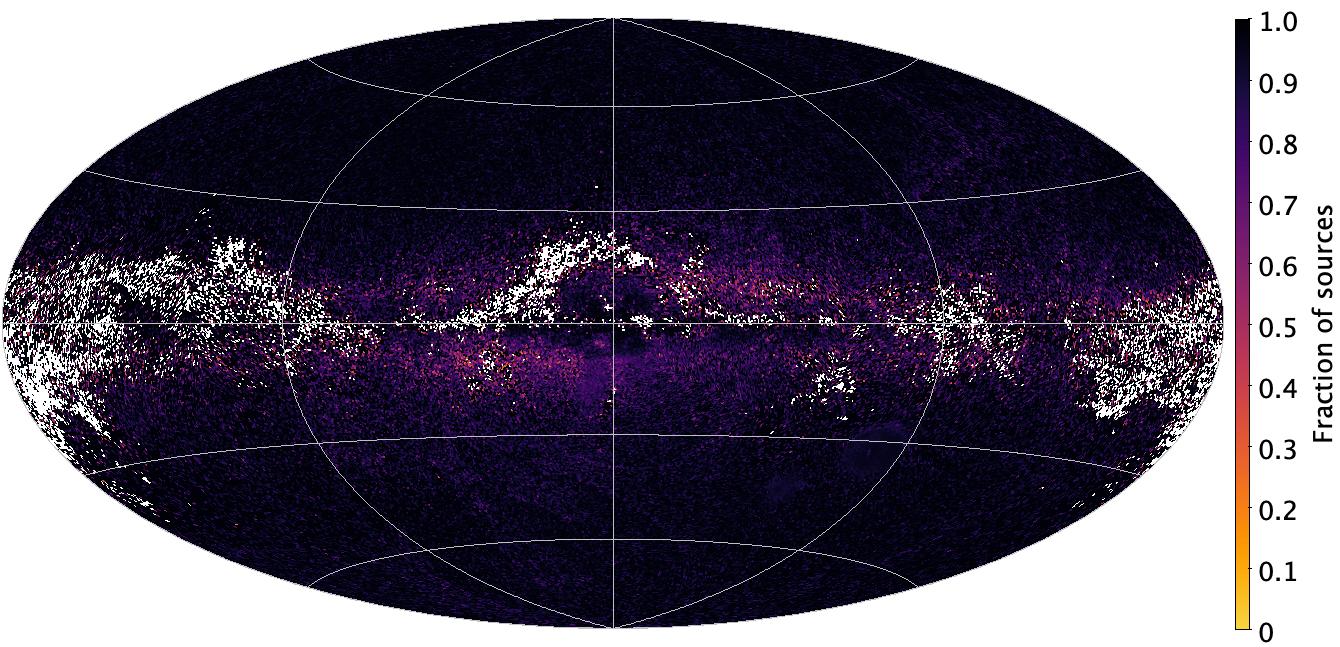
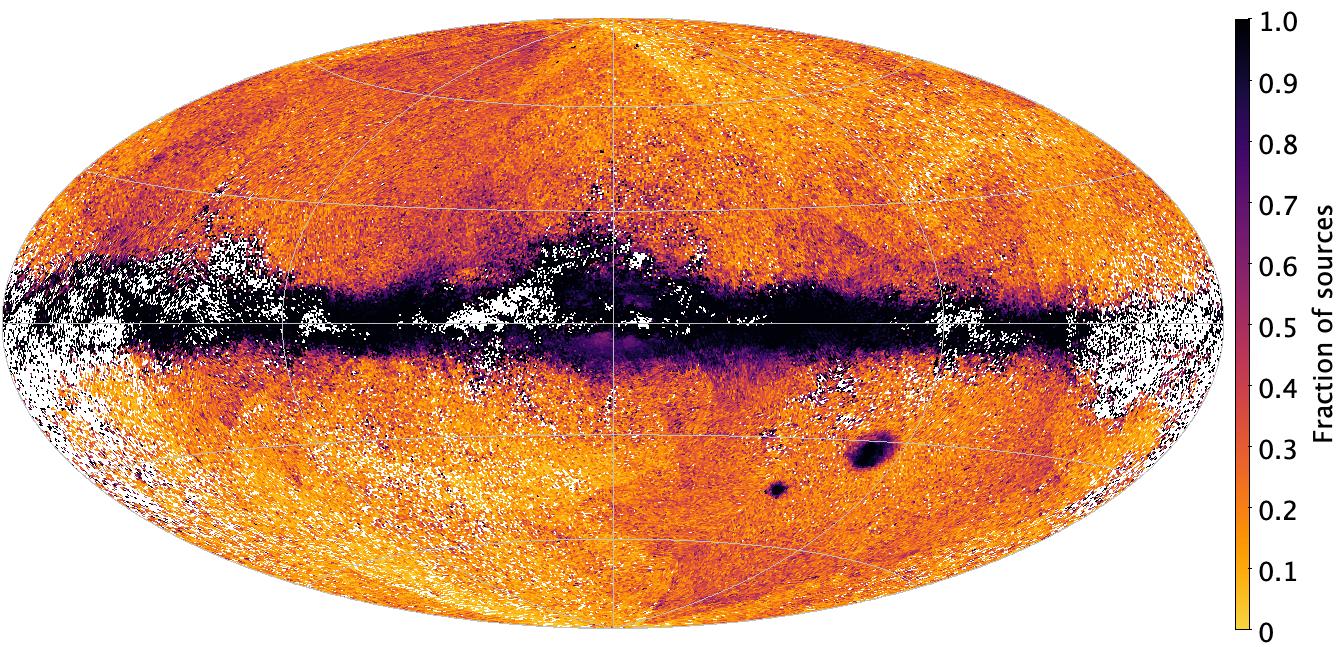
DSC produces outputs for 1 590 760 469 sources. All of these have probabilities from Combmod and Specmod, whereas 1 370 759 105 (86.2%) have probabilities from Allosmod.444It so happens that all sources which have Allosmod results also have Specmod results, but not vice versa. This lower number from Allosmod is due to missing input data, usually missing parallaxes and proper motions (or missing colours in a few cases). That is, sources must have 5p or 6p astrometric solutions from the Gaia Astrometric Global Iterative Solution (AGIS) in order to have Allosmod results. This can be seen in Figure 4, which shows the fraction of sources (per HEALPix) that have 5p/6p solutions, for those with dsc_classlabel=’quasar’ (left) and dsc_classlabel=’galaxy’ (right). While most objects classified as quasars have measured parallaxes (i.e. 5p or 6p solutions), most sources outside of the Galactic plane classified as galaxies do not. Those objects that lack parallaxes and proper motions (the 2p solutions) also lack Allosmod results, and so their Combmod results (and hence dsc_classlabel) are determined only by Specmod. We explore the differences between the 5p/6p and 2p solutions at the end of this section.
The vast majority of sources have high probabilities of being stars, and because the purities of the white dwarf and physical binary classes are low (see the online documentation), we focus here on the results for the quasar and galaxy classes.

The label classlabel_dsc (defined in section 3.2.4) classifies 5 243 012 sources as quasars and 3 566 085 as galaxies. Their sky distributions are shown in the top two panels of Figure 5. The analysis in section 3.3 suggests that these samples are not very pure (see Table 3). In these sky plots, we see large overdensities of supposed quasars in several regions, in particular the LMC and SMC, suggesting that this sample is not very pure. However, such overdensities are expected when we have a constant misclassification rate over the whole sky, because any high-density region will have a high density of both correctly and incorrectly classified objects. However, it turns out that the fraction of sources classified as quasars is also higher than average in these regions (see below). The LMC and SMC are so dense that 38% of all the quasar identifications using classlabel_dsc are in the LMC, and 6.4% are in the SMC.555For this purpose, the LMC is defined as a circle of 9∘ radius centred on RA=81.3∘, Dec.=-68.7∘, and the SMC as a circle of 6∘ radius centred on RA=16.0∘, Dec.=-72.8∘. These percentages are much smaller for galaxies: just 3% for the LMC and 1% for the SMC.
The bottom row of Figure 5 shows the distribution of the 547 201 sources classified as quasars and the 251 063 sources classified as galaxies by the purer class label classlabel_dsc_joint. The overdensities of quasars in the LMC and SMC regions are now greatly reduced, to 4% and 1% of all sources respectively.

Figure 6 shows the same sky distribution as before, but now expressing the numbers as a fraction of the total number of sources in that HEALPix666For details on the HEALPix scheme used by Gaia, see Bastian & Portell (2020) (classified by DSC as anything). As most of the sources are stars, these plots essentially show the ratio of extragalactic to Galactic objects per HEALPix, albeit with varying degrees of contamination. The four rows of the plot correspond to four possible ways of classifying extragalactic sources: the top three rows are for probabilities above 0.5 for Specmod, Allosmod, and Combmod, respectively, whereby the latter is identical to classlabel_dsc. The bottom row is classlabel_dsc_joint. Looking at the third row —for classlabel_dsc— we see a higher fraction of extragalactic sources (plus contamination) has been discovered outside of the Galactic plane than at lower latitudes. This we expect, as high extinction from Galactic dust obscures extragalactic objects, and also there are far more stars in the Galactic plane. However, we also see a higher fraction of supposed quasars (left) in the LMC and SMC —clear misclassifications— indicating a higher contamination in these regions. Looking at the top two left panels in Figure 6 for Specmod and Allosmod, respectively, we see that this contamination comes from Specmod, that is, misclassification of the BP/RP spectra, but not from Allosmod, which uses photometry and astrometry. It is probably not due to crowding in the LMC/SMC corrupting the BP/RP spectra, because we do not see such high contamination in the crowded Galactic plane; it is more likely due to faint blue sources in the LMC/SMC being confused with quasars, something which does not occur as much in the Galactic plane due to the higher reddening there.
The top three rows of the right column of Figure 6 show the corresponding plots for galaxies. The stripes are artefacts of the Gaia scanning law. They are much more prominent in Allosmod than in Specmod, and we see in Table 3 that Allosmod is expected to have a lower purity for galaxies than Specmod (the opposite is true for quasars).
When we use classlabel_dsc_joint for classification, we get smaller but purer samples (see Gaia Collaboration, Bailer-Jones et al. (2022)). The sky distributions for these samples (bottom row of Fig. 6) show that low-latitude regions are excluded. In other words, only sources at higher latitudes were classified with probabilities above 0.5 by both Specmod and Allosmod. We also note that the overdensities in the LMC and SMC are greatly reduced with classlabel_dsc_joint.
The middle panels of Figure 2 show the distributions of various Gaia features for the sources classified as quasar (in blue) and galaxy (in orange) by classlabel_dsc. The middle panel of Figure 3 shows the two colours as a colour–colour diagram. These may be compared to the distributions of the training data in the upper panels in both cases. There are some noticeable differences. The most obvious is the spike in the latitude distribution for (apparent) quasars at the LMC. Recall that, when training Allosmod, we used a flat distribution (see section 3.2). We also see that the objects classified —galaxies in particular— extend to fainter magnitudes than the training data. This is not surprising given that the training sample had to have SDSS spectroscopic classifications, whereas we apply DSC to all Gaia sources, which extend to fainter magnitudes, where misclassifications are more frequent. The observed galaxies also show larger (anomalous) proper motions, plus more (anomalous) photometric variability according to the relative variability, relvarg, parameter. Finally, we also see differences in the colour distributions compared to the training data for both classes (Figure 3). Some of this is due to the different populations being sampled (the training objects are brighter), as well as contamination.
The bottom panels of Figures 2 and 3 show the features and colour–colour diagrams for objects classified using the purer classlabel_dsc_joint label. These show tighter distributions that are more similar to the training data. We note in particular the reduction of faint galaxies.
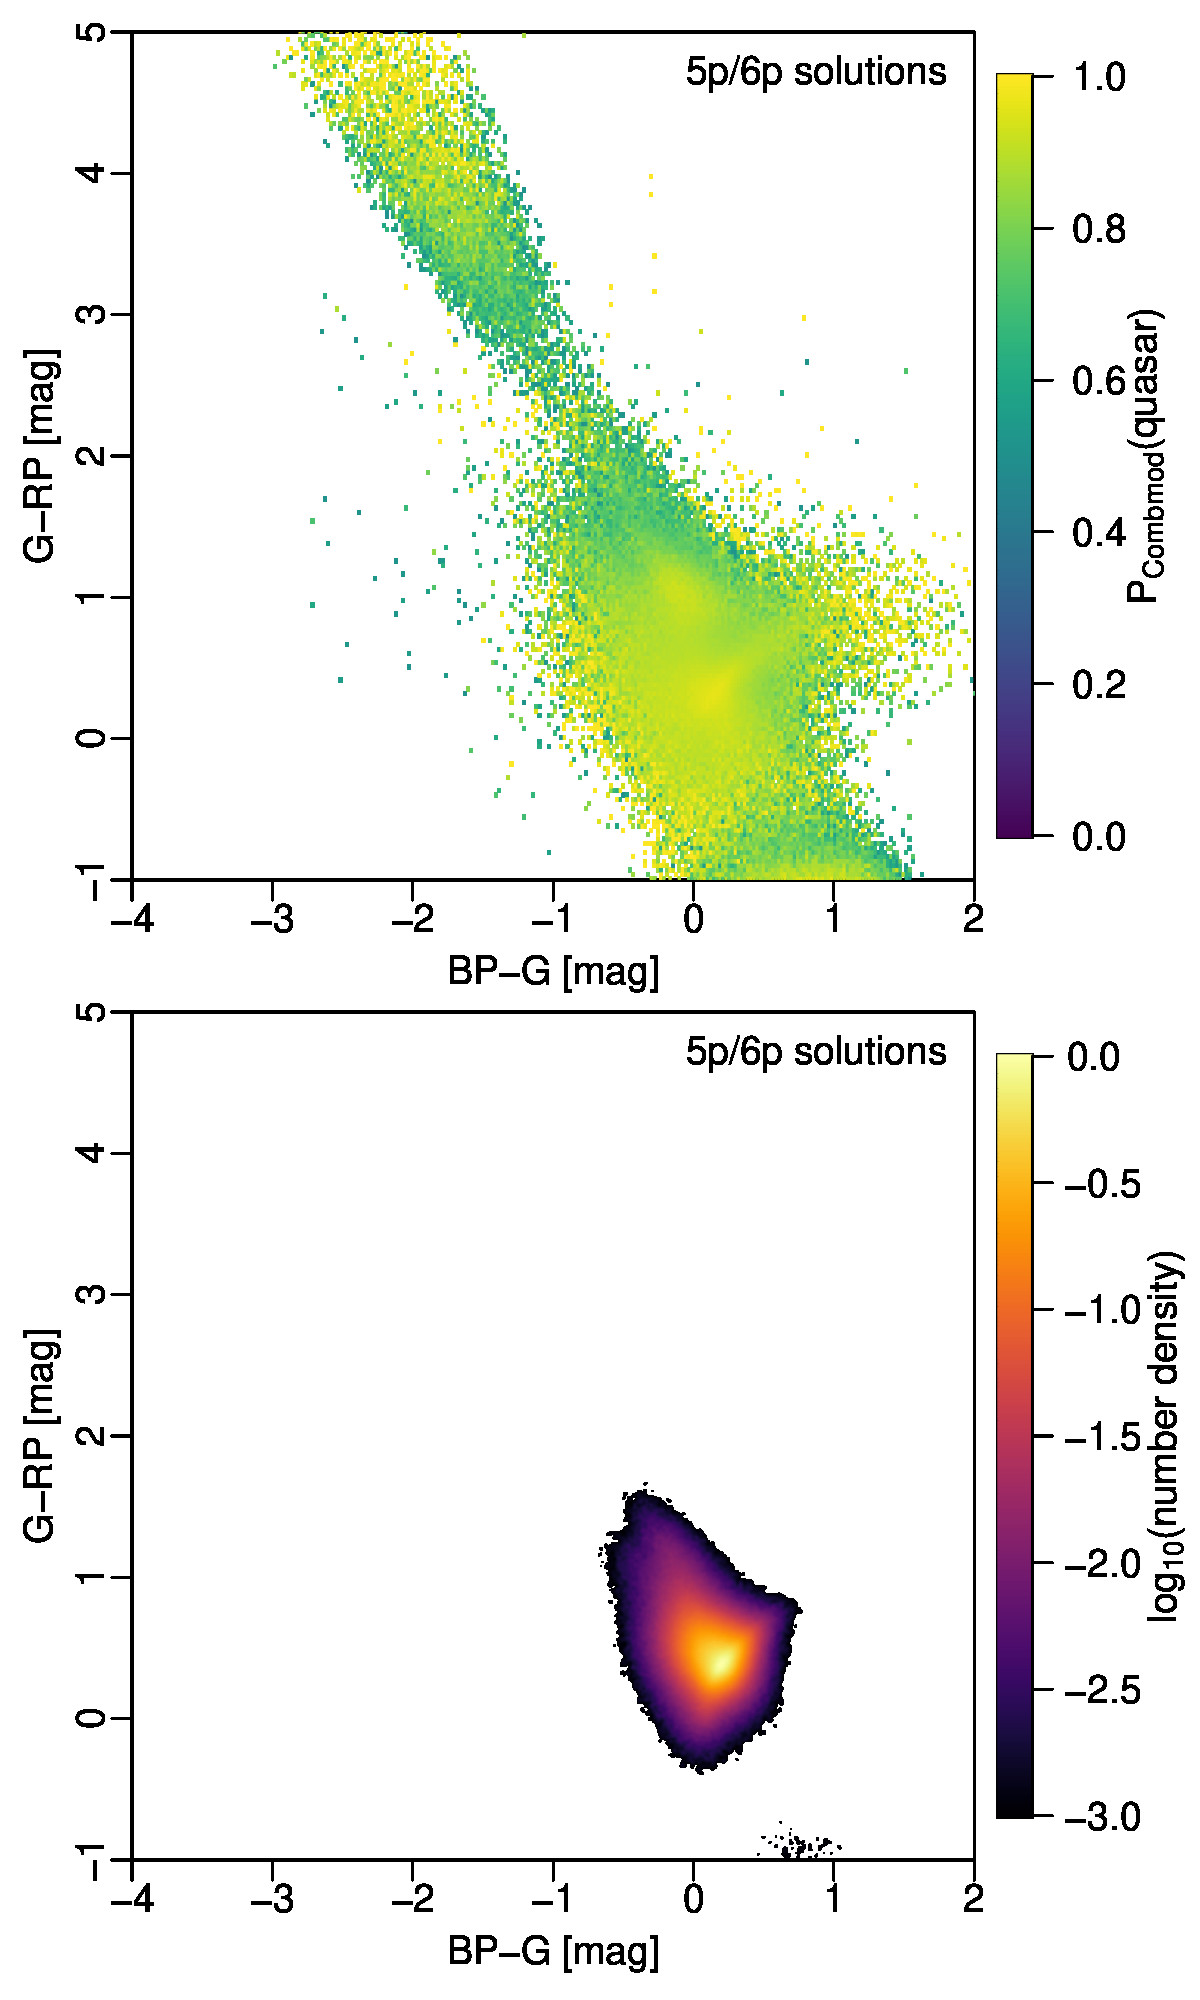
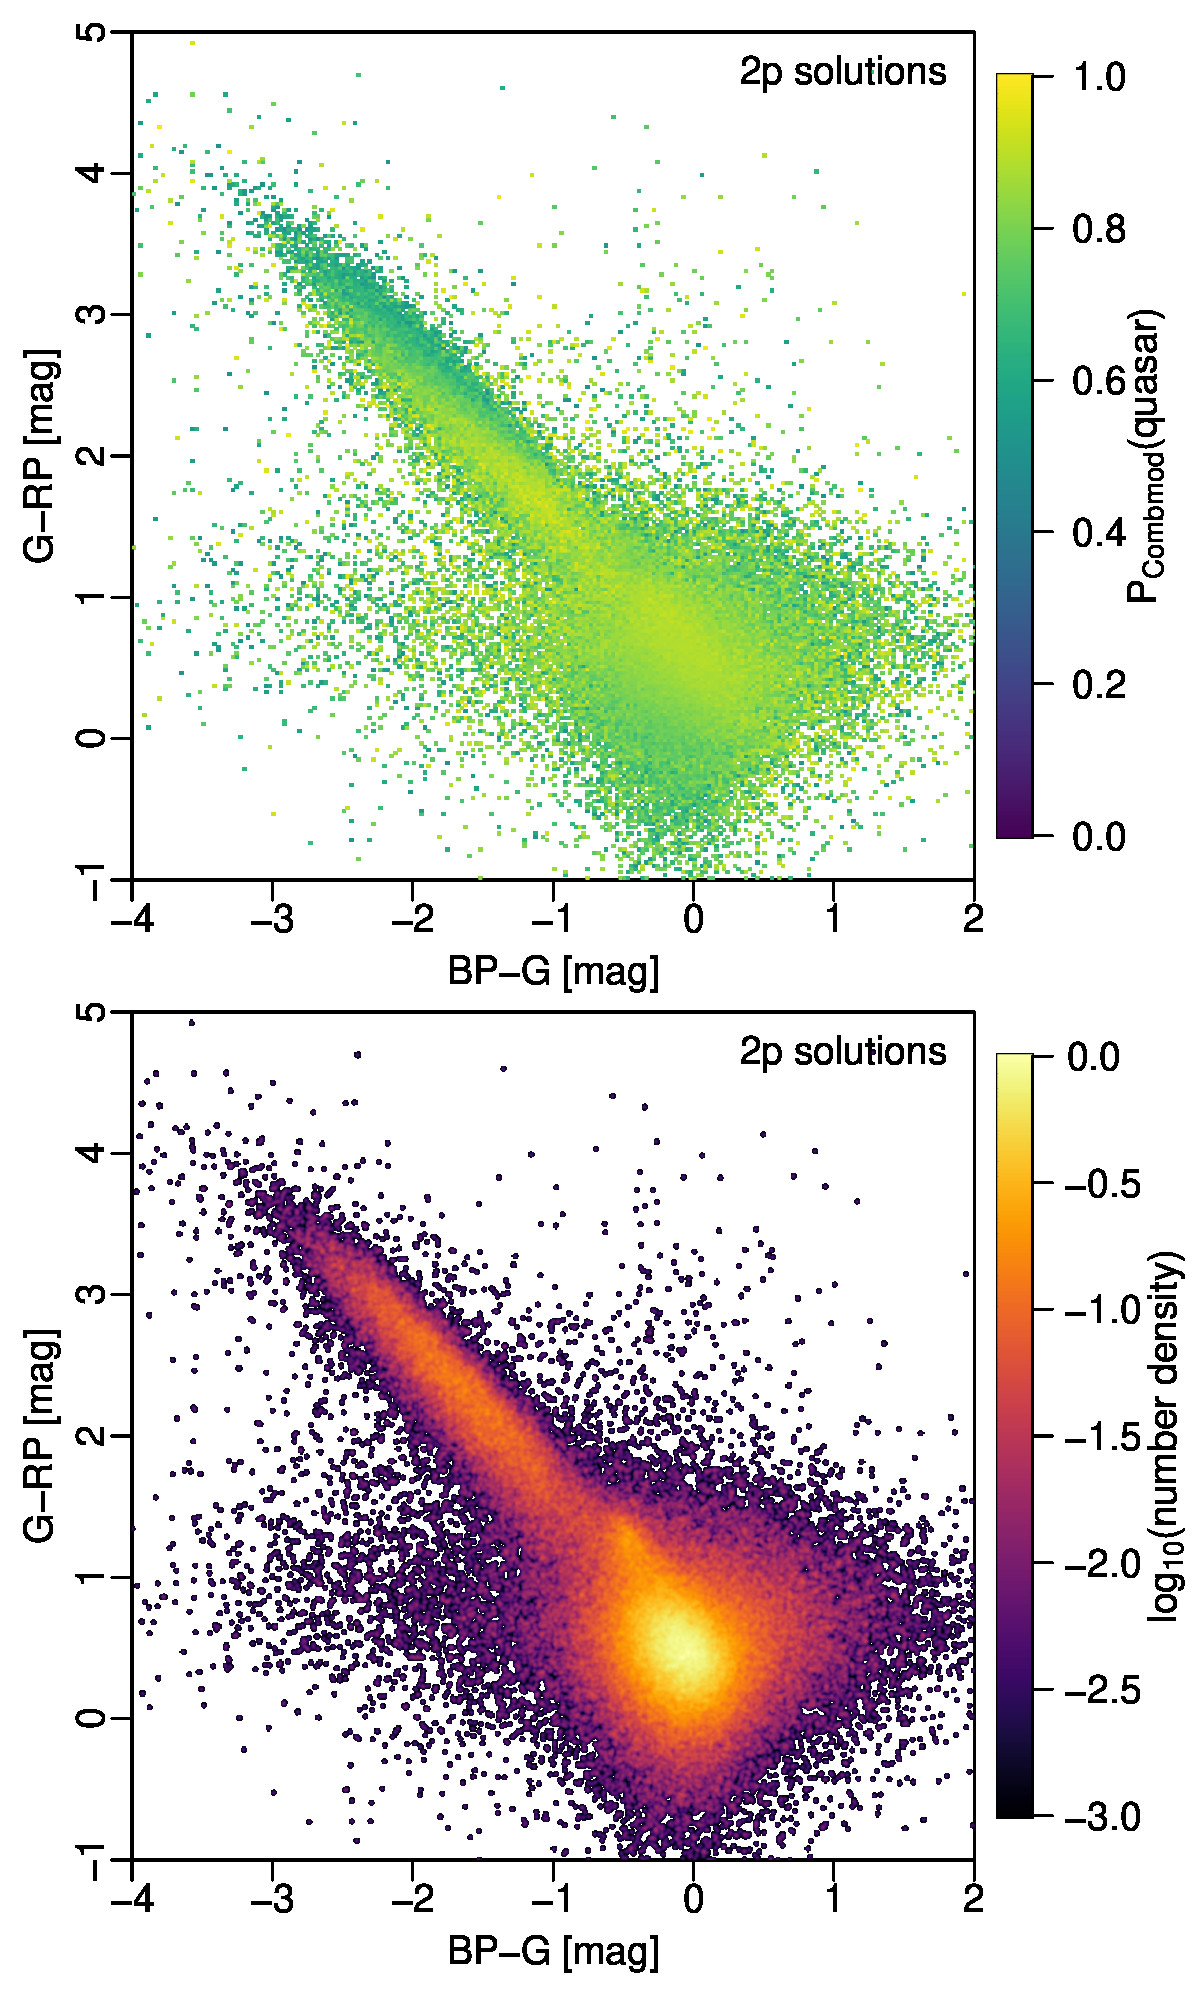
We now return to the issue of the 5p/6p and 2p solutions. Figure 7 shows the colour–colour diagram for all sources with classlabel_dsc=’quasar’, excluding those in the regions around the LMC and SMC, for sources with (5p/6p) and without (2p) parallaxes and proper motions. The DSC-Comdmod probabilities for 5p/6p solutions come from both Specmod and Allosmod, whereas for the 2p solutions they only come from Specmod. Of the objects classified here as quasars, 95% have 5p/6p solutions. We see that the 5p/6p solutions are confined to a smaller range of colours than are the 2p solutions. That is, demanding the existence of parallaxes and proper motions yields a slightly different population of objects in colour space. We reiterate the fact that there is significant stellar contamination in the classlabel_dsc=’quasar’ sample as a whole. The (purer) subset defined by classlabel_dsc_joint=’quasar’ has a distribution (not shown) similar to that of the 5p/6p solutions in the bottom left panel of Figure 7.
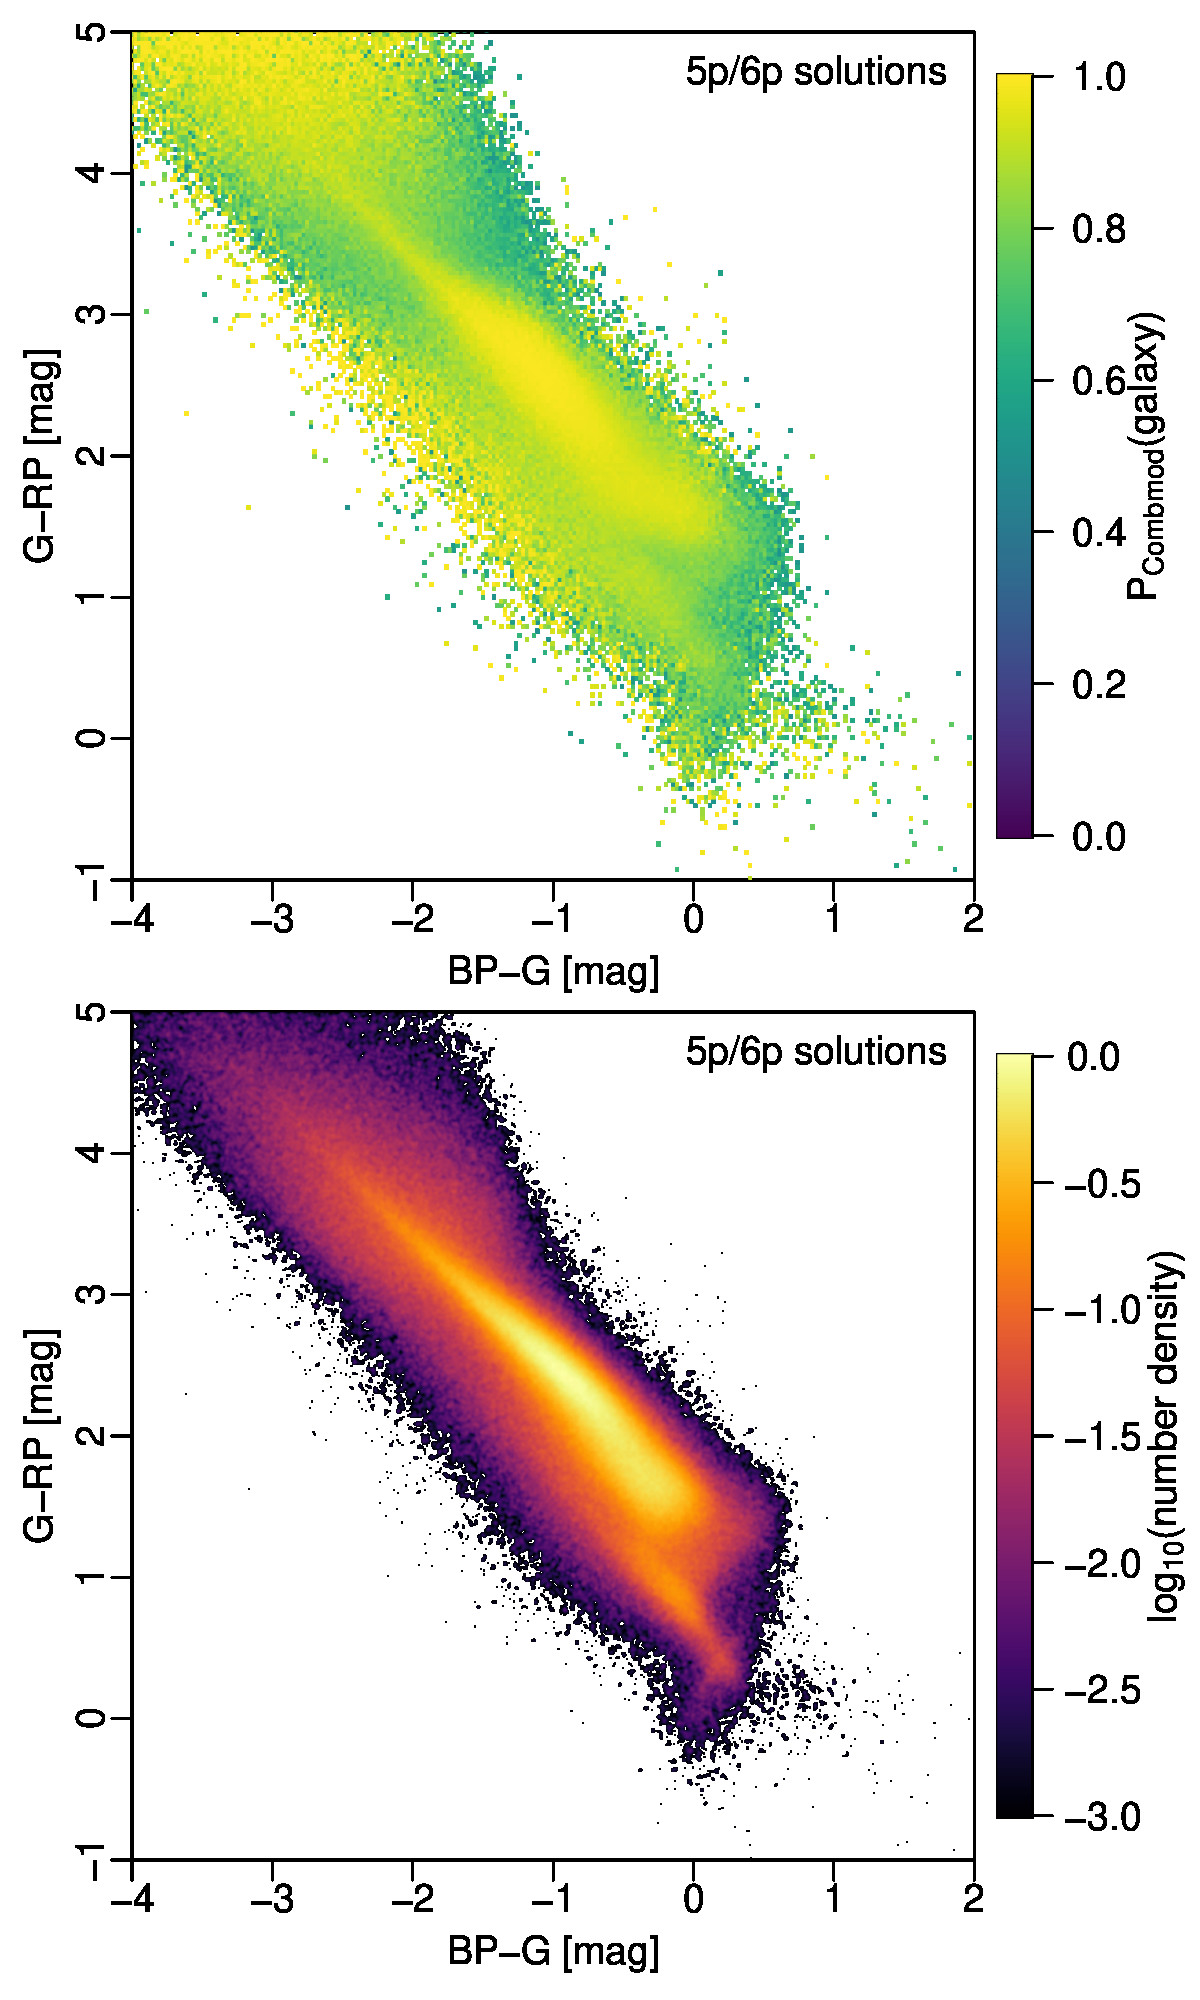
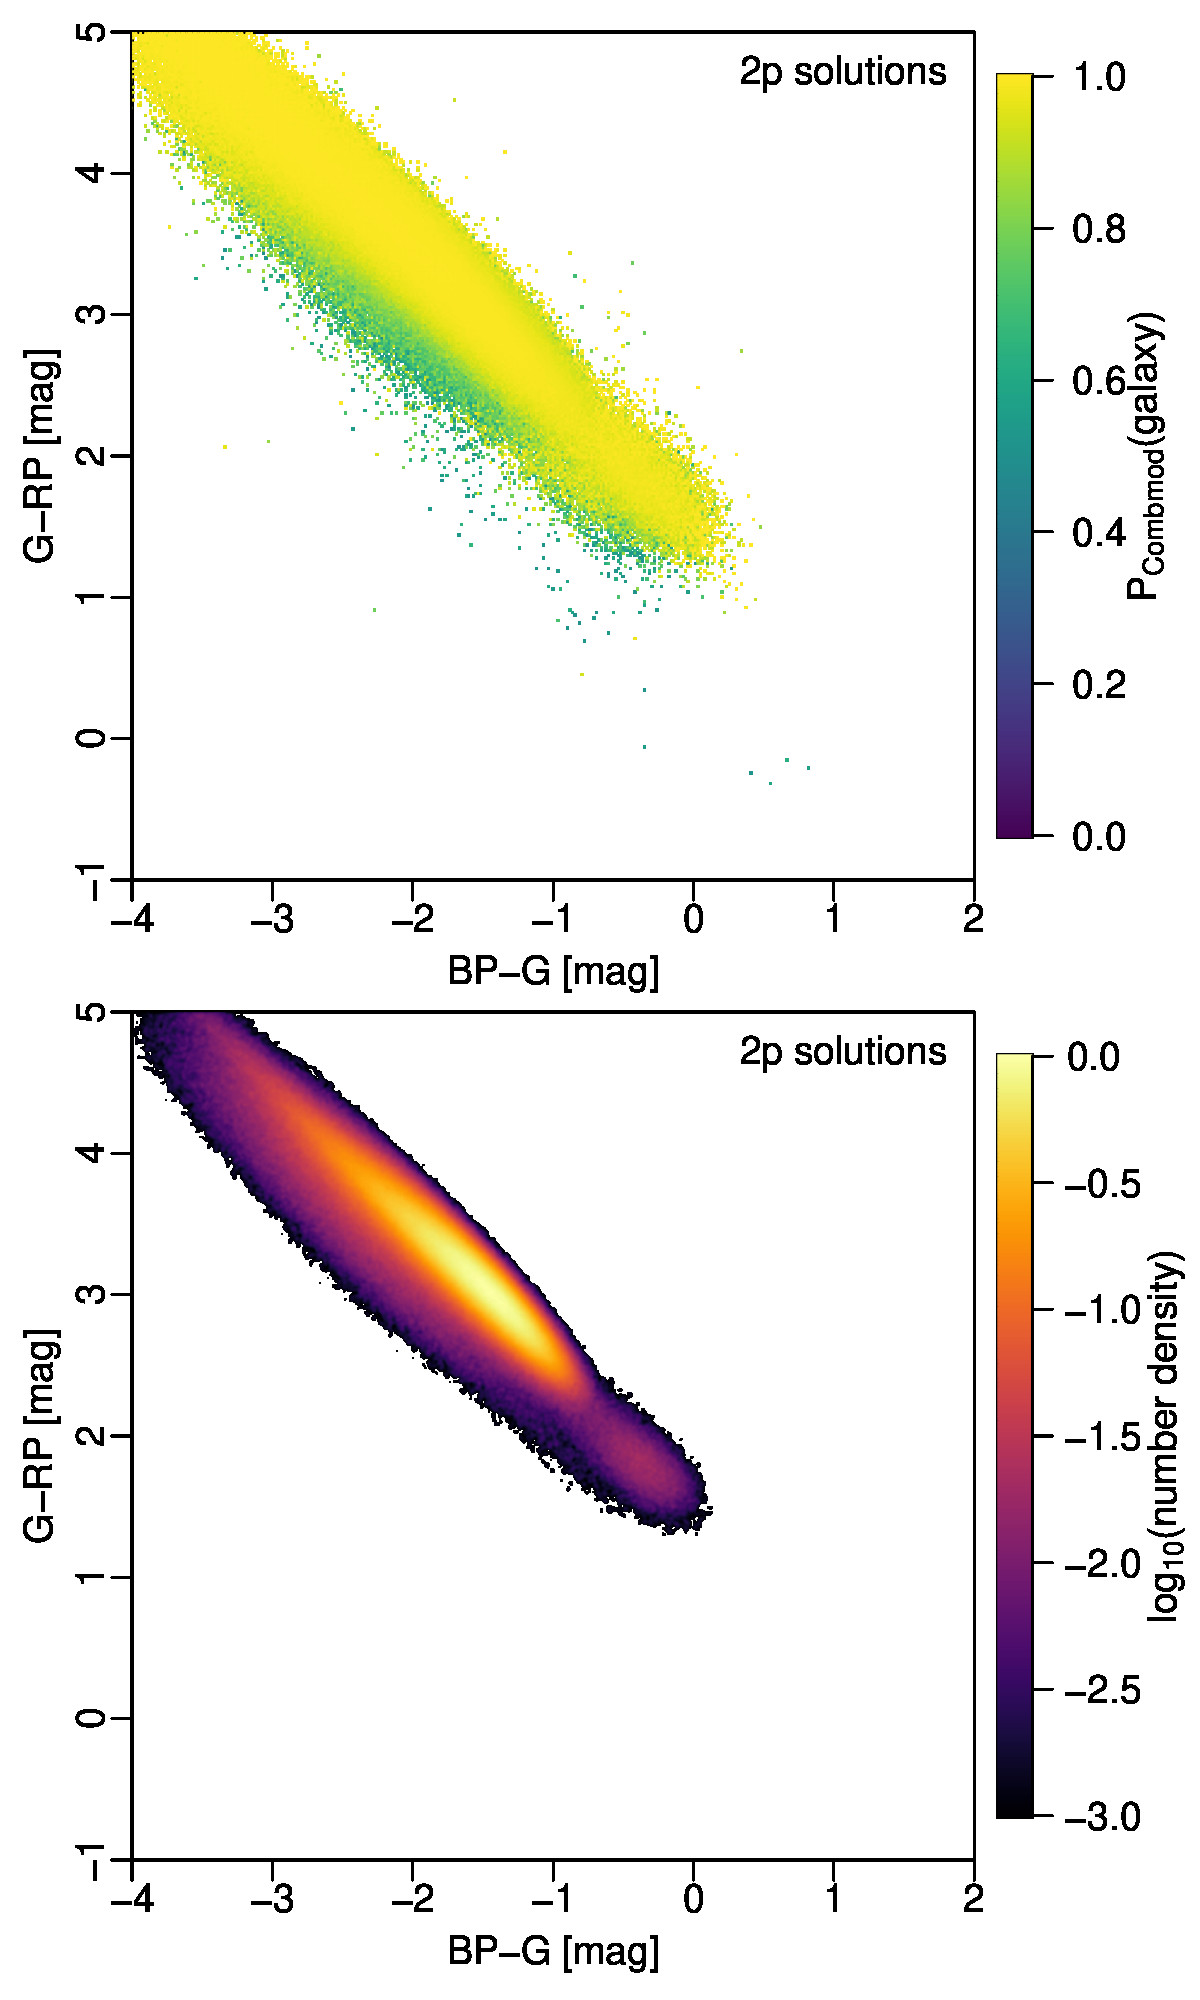
Figure 8 shows the colour–colour diagram for the galaxies. Again we see a difference in the colour distribution of the two types of astrometric solution, but now it is the 2p solutions that cover a narrower range of colours. Galaxies are partially resolved by Gaia, and their structure can induce a spurious parallax and proper motion in AGIS (which DSC-Allosmod tries to exploit). Many of these astrometric solutions are rejected by AGIS, turning them into 2p solutions, and these sources can only be classified by Specmod. Of the objects classified here as galaxies, 72% have 2p solutions, compared to 5% for the quasars. Thus, the Specmod and Allosmod results reported in Gaia DR3 are not for identical populations of objects, because of the different input data requirements of these classifiers.
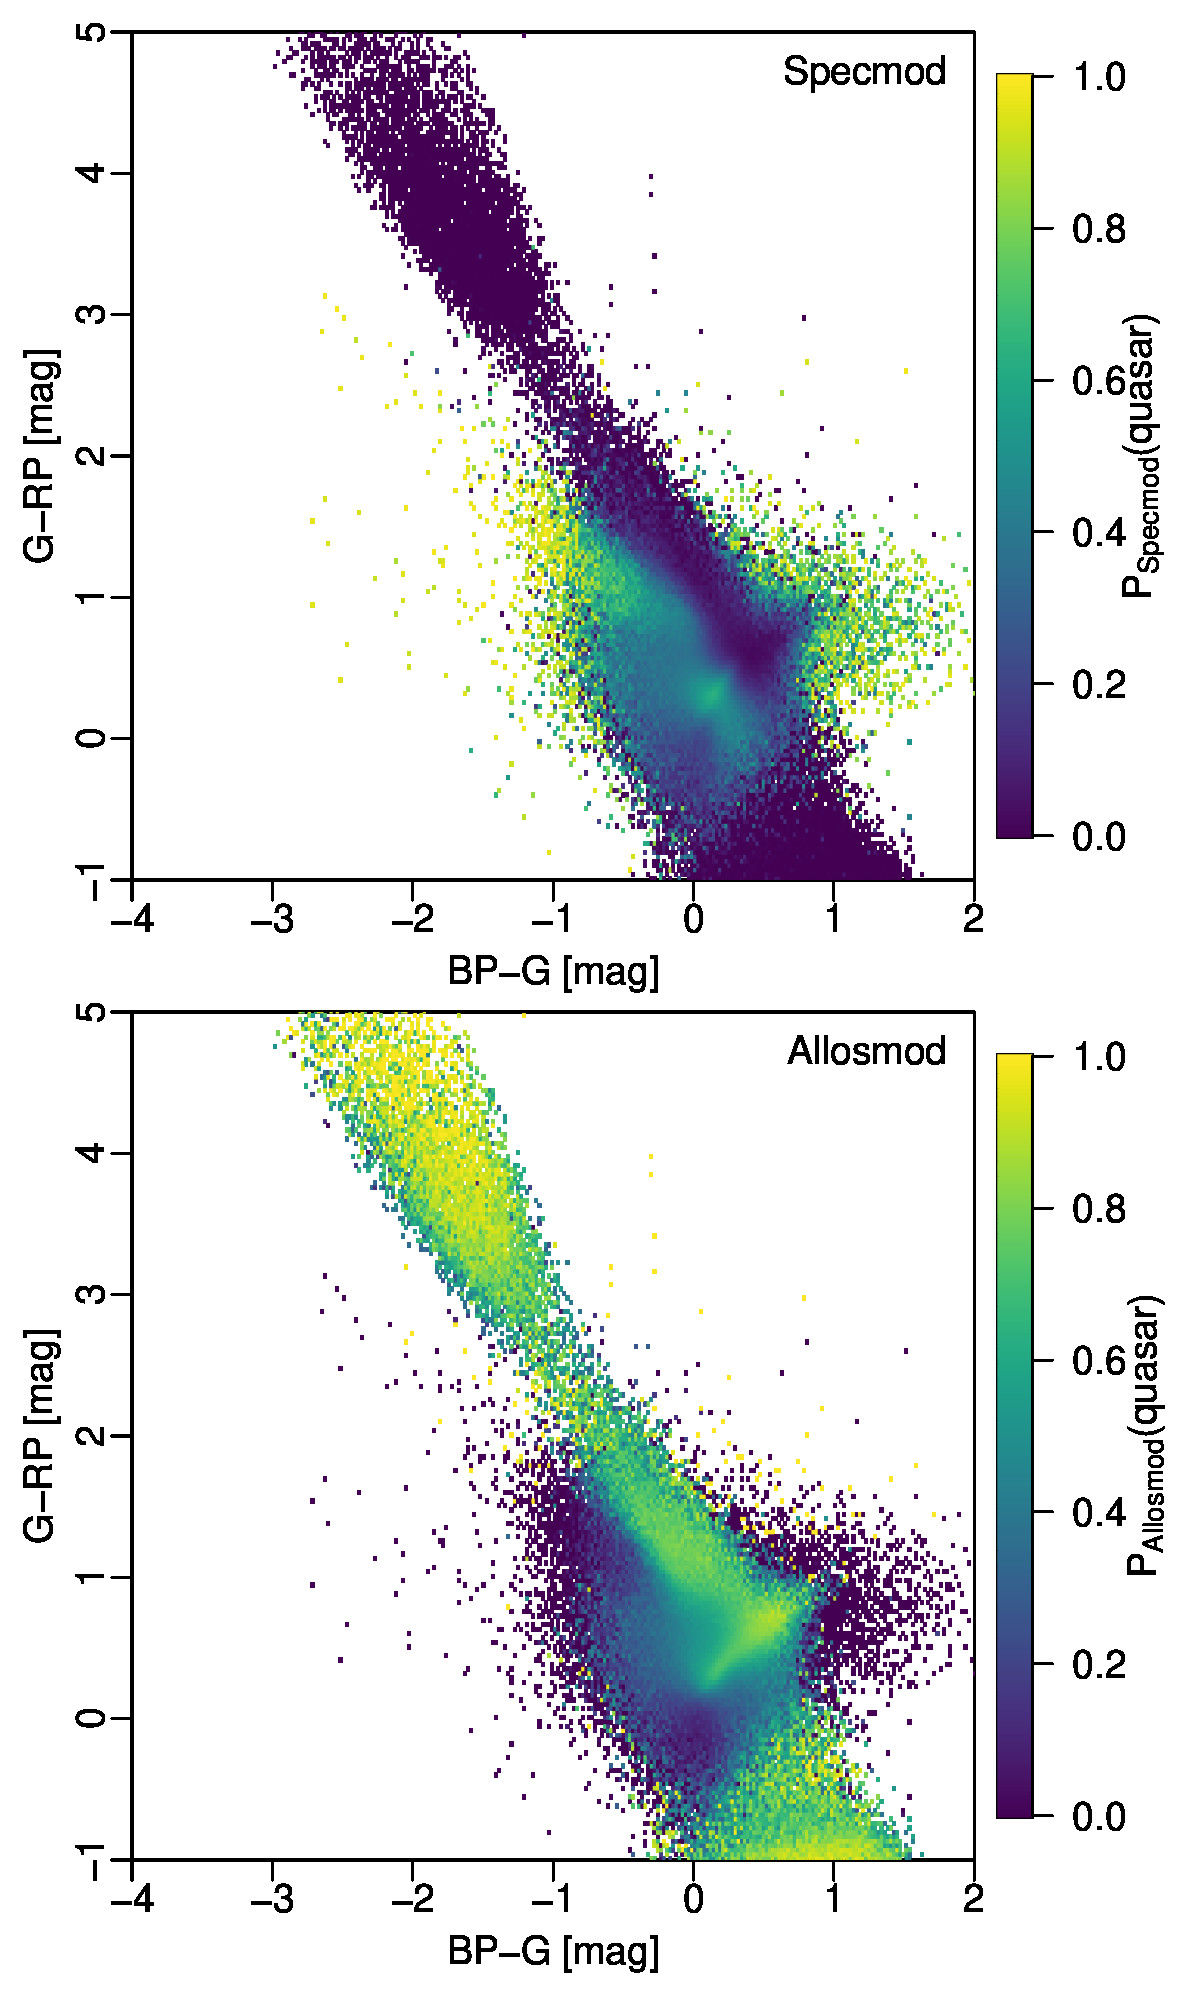
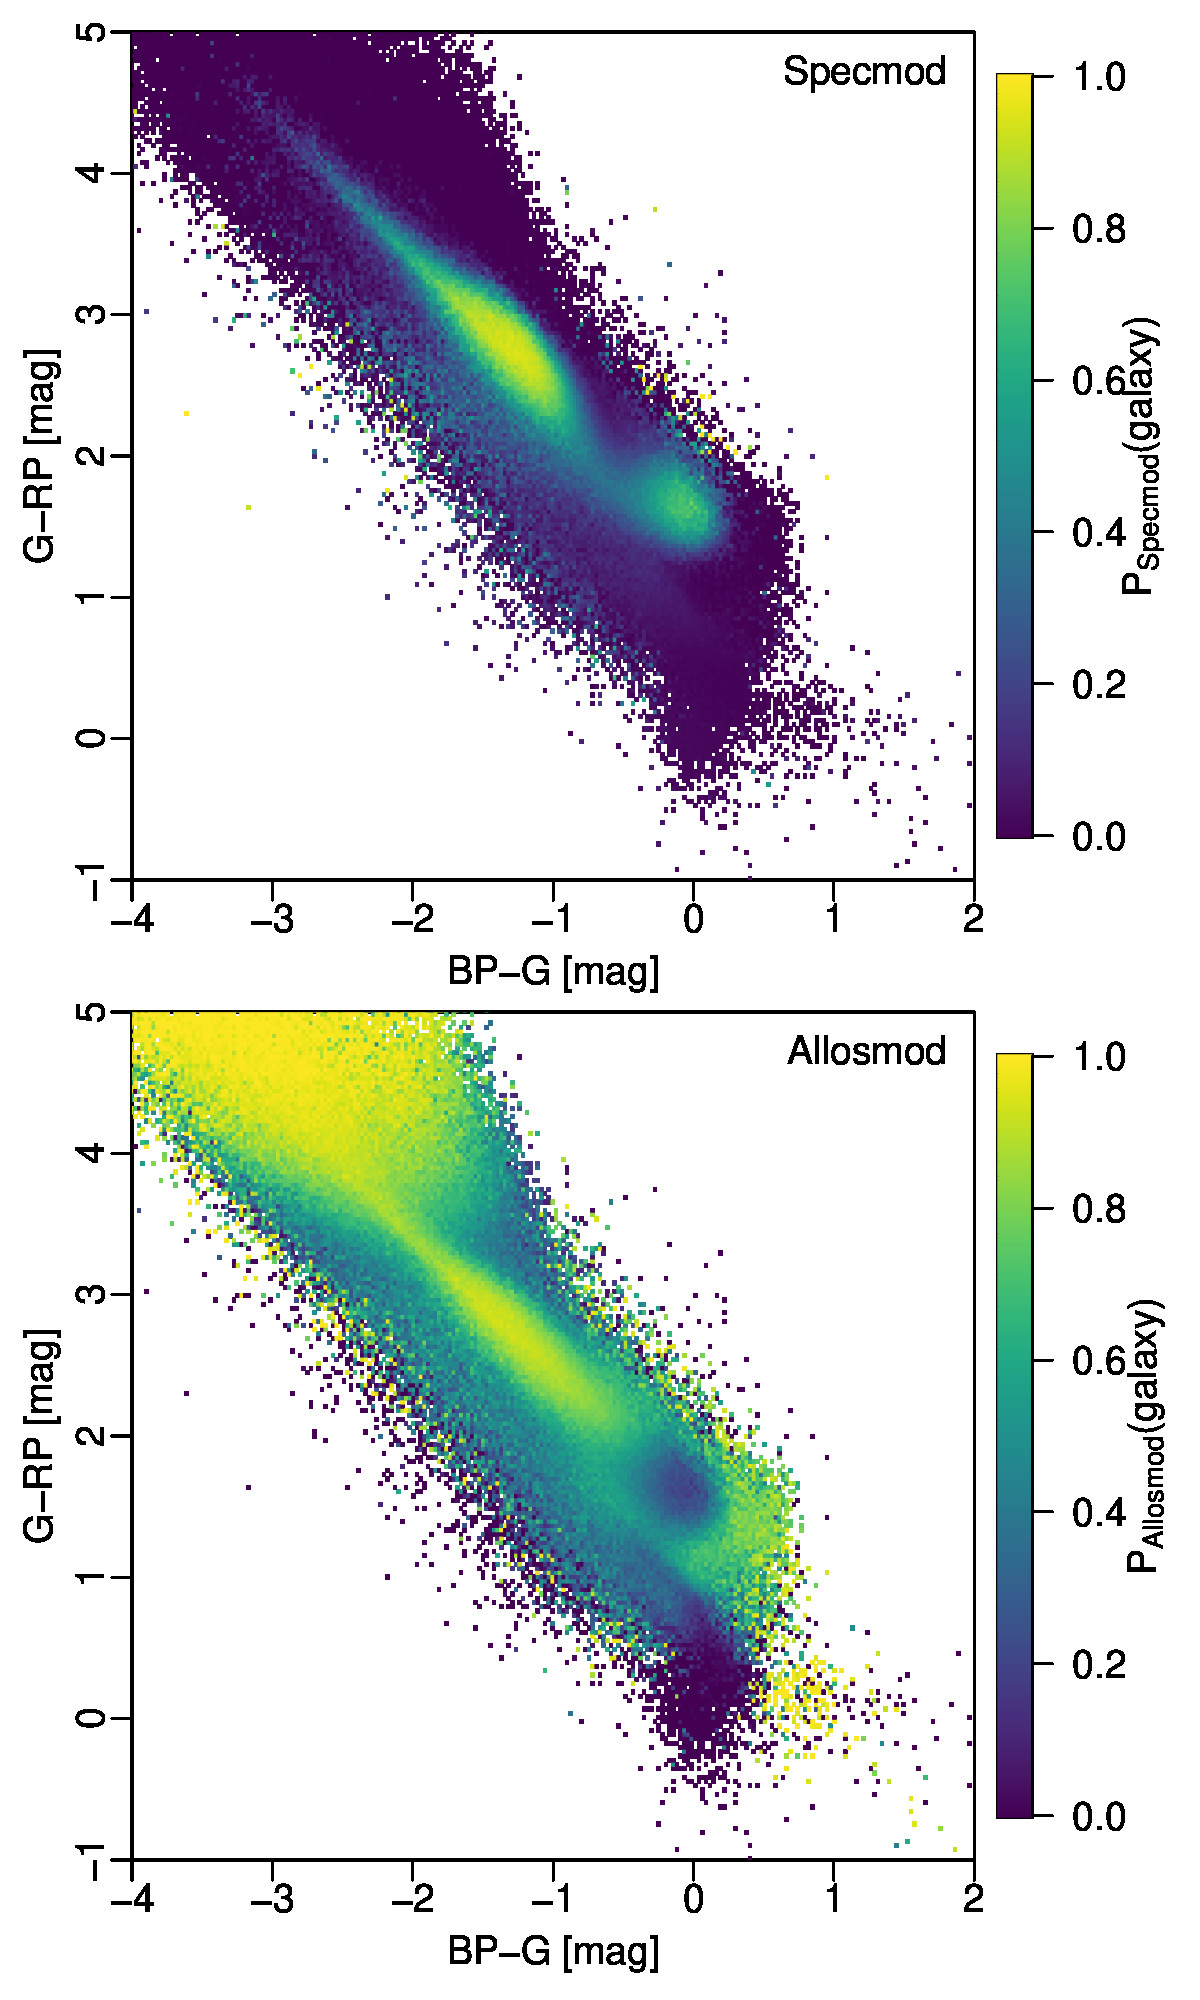
As Specmod and Allosmod use different data, it is interesting to see how their classification probabilities differ for a common set of sources. We investigate this by selecting sources that have results from both Specmod and Allosmod, and have classlabel_dsc set. This is shown for the quasar candidates in the left column of Fig. 9. These plots do not convey the number of sources in each part of the diagram, and should therefore be interpreted with that in mind. Nonetheless, although we see regions where Specmod and Allosmod have similar probabilities, there are also regions where their probabilities are quite different. Because classlabel_dsc_joint is only set to ‘quasar’ when both Specmod and Allosmod probabilities are above 0.5, these figures explain why that set is comparatively small. The right column of Figure 9 shows the same for the galaxy candidates, and again we see a significant lack of correlation between Specmod and Allosmod. This shows that the different data used by these two classifiers convey rather different information.
3.5 Use of DSC results
The DSC class probabilities exist primarily to help users identify quasars and galaxies. The performance on white dwarfs and binaries is rather poor. These probabilities will be of limited use to the general user and we do not recommend their use to build samples. One could add these probabilities to the star probability for each source, and thereby end up with a three-class classifier.
Classification can be done by selecting sources with class probabilities above a given threshold. A threshold of 0.5 gives a selection (and performance) very similar to what would be obtained when taking the maximum probability. A threshold of 0.5 applied to the Combmod outputs is identical to the classlabel_dsc label (section 3.2.4). With this choice of threshold, the purities for galaxies and quasars are rather modest, as we can see from Table 3. This is unsurprising, because with a threshold of 0.5 we expect up to half of the objects to be incorrectly classified even with a perfect classifier. Increasing the threshold does increase the purity at the cost of decreased completeness, but because the DSC probabilities tend to be rather extreme (see plots in Bailer-Jones 2021), this does not help as much as one might hope. The fact that the purities are often lower than the limit expected from the threshold may be due not only to an imperfect classifier, but also to an imperfect calibration of the probabilities in Specmod and Combmod (although not Allosmod).777The issue of expected sample purity is discussed in section 5.2 of Bailer-Jones et al. (2008). Even with an imperfect classifier, it is possible to infer the expected number of true sources from the inferred numbers by inverting the confusion matrix, as shown by Bailer-Jones et al. (2019).
The DSC completenesses, especially with Combmod, are quite good, but the purities are rather modest, as discussed earlier. This is a consequence of primarily two factors.
The first factor is the intrinsic rareness of the quasars and galaxies. If only one in every thousand sources were extragalactic, then even if our classifier had 99.9% accuracy, the resulting sample would only be around 50% pure. This is the situation we have: the intrinsic ability of DSC to separate the classes is actually very good, with purities of the order of 99% on balanced test sets. However, when it is then applied to a randomly selected set of Gaia data there are so many stars that even though a small fraction of these are misclassified, this is still a large number. We cannot overcome this problem by adopting a different prior. If we used uniform priors, for example, this would classify many more sources —both true and false—- as extragalactic. This would increase the completeness of this class. It is not immediately obvious what happens to the purity, but Bailer-Jones et al. (2019) found that for Allosmod in Gaia DR2, the purities for quasars and galaxies were actually significantly reduced.
The extreme rareness of the extragalactic objects places high demands on the classifiers, and the performance may be limited by the second factor, namely the ability of the data to distinguish between the classes. We experimented with using different or additional Gaia features (e.g. colour excess factor) as inputs to Allosmod, but this did not help. Performance might improve if we define synthetic filters from the BP/RP spectra instead of using the entire spectrum, or by generating other features from the Gaia data, but this has not been explored888One obvious example is to compute the absolute magnitude, because this together with colour – i.e. the HRD – clearly separates out white dwarfs when the parallax uncertainties are not too large.. The inclusion of non-Gaia data, such as infrared photometry, should help but was beyond the scope of the activities for Gaia DR3.
A third potential limiting factor is the set of training examples we use. Although the SDSS spectroscopic classifications are believed to be very good, they may have errors, and they may also not provide the clearest distinction between galaxies and quasars.
The fact remains that the classification performance depends unavoidably on the intrinsic rareness, that is, on the prior. Users may want to adopt a different prior from ours (Table 2), which would be particularly appropriate if they focus on a subset of parameter space. To recompute the DSC probabilities with a new prior we do not need to re-train or re-apply DSC. The fact that DSC provides posterior probabilities as outputs makes it simple to strip off our prior and apply a new one, as shown in appendix C.
It is important to realise that the performances in Table 3 are (a) only for the classes as defined by the training data and (b) an average over the entire Gaia sample, and are therefore dominated by faint sources with lower quality data. Our galaxy class in particular is a peculiar subset of all galaxies, because Gaia tends not to observe extended objects, and even then may not measure them correctly (see section 3.2).
DSC misclassifies some very bright sources that are obviously not extragalactic, for example. As these are easily removed by the user, we chose not to filter the DSC results in any way. One may likewise wonder why there are some objects classified as quasars with statistically significant proper motions . We do use proper motion as a classification feature, but in a continuous fashion, not as a hard cut. A more conservative approach to classification is to apply a series of necessary conditions, that is, a simple decision tree. This could increase the purity —and could be tuned to guarantee that certain known objects come out correctly— but at the expense of completeness. We do nevertheless provide the class label classlabel_dsc_joint as a means to select a purer subsample of extragalactic sources (section 3.2.4), as can be seen from the last two columns of Table 3.
4 Outlier analysis (OA)
4.1 Objectives
The Outlier Analysis (OA) module aims to complement the overall classification performed by the DSC module, by processing those objects with lower classification probability from DSC (see Section 3). OA is intended to analyse abnormal or infrequent objects, or artefacts, and was applied to all sources that received DSC Combmod probabilities below 0.999 in all of its five classes. This threshold was chosen so as to process a limited number of 134 million sources, corresponding to about of the total number of sources for which DSC produced probabilities. Subsequently, a selection of the sources to be processed is carried out based on several quality criteria, the most restrictive being that the mean spectra correspond to at least five transits (see details in the online documentation). The resulting filtering leads us to process a total of 56 416 360 sources. Such sources tend to be fainter and/or have noisier data. For these objects, OA provides an unsupervised classification —where the true object types are not known— that complements the one produced by DSC, which follows a supervised approach based on a set of fixed classes.
4.2 Method
The method used by OA to analyse the physical nature of classification outliers is based on a self-organising map (SOM, T. Kohonen, 1982), which groups objects with similar BP/RP spectra (see Section 4.2.1) according to a Euclidean distance measure. The SOM performs a projection of the multidimensional input space of BP/RP into a two-dimensional grid of size , which facilitates the visual interpretation of clustering results. Such a projection is characterised by its preservation of the topological order, in the sense that, for a given distance metric, similar data in the input space will belong to the same or to neighbouring neurons in the output space. Each one of these neurons has a prototype, which is adjusted during the training phase and that best represents the input spectra that are closest to this neuron. In Gaia DR3, each prototype is the average spectrum of the pre-processed999The OA pre-processing of BP/RP spectra is later described in Section 4.2.1. BP/RP spectra of the sources assigned to that particular neuron, which correspond to those closest to the neuron according to the Euclidean distance between the neuron prototype and the pre-processed BP/RP spectrum of the source. Neuron prototypes are reported in the oa_neuron_xp_spectra table. A centroid is also identified for each neuron, which is the source whose pre-processed BP/RP spectrum is the closest to the prototype of the neuron, according to the Euclidean distance. Centroids can be found in the centroid_id field of the oa_neuron_information table along with statistics of the main Gaia observables for the sources belonging to this neuron: , , and magnitudes, proper motions, Galactic latitude, parallax, number of BP/RP transits, renormalised unit weight error (ruwe), BP/RP flux excess factor, and colour.
4.2.1 BP/RP spectra preprocessing
The sampled mean BP/RP spectra produced by SMSgen are transformed in order to remove artefacts, and to improve the clustering produced by the SOMs: (a) Pixels with negative or zero flux values are linearly interpolated, provided that they do not affect more than 10% of the effective wavelength in a consecutive manner or more than 25% of the entire effective wavelength. Such a filtering was imposed because most of the spectra that did not meet such criteria were usually of low quality and had a low number of transits. These filtered spectra are not analysed; (b) BP and RP spectra are downsampled to 60 pixels each; (c) both spectra are trimmed to avoid the low transmission regions of the CCD, so that OA uses the effective wavelength ranges –nm for BP and –nm for RP; (d) spectra are concatenated to obtain a single spectrum; and, (e) the joint spectrum is normalised so that the sum of its flux is equal to one.
4.2.2 Quality assessment
The performance of OA cannot be measured through metrics such as completeness and purity because of the unsupervised nature of the technique. Therefore, a descriptive approach based on the intra-neuron and inter-neuron distances (Álvarez et al., 2021) was followed in order to analyse the quality of the clustering. We decided to use the squared Euclidean distance as a proxy for distance because the SOM algorithm uses it as a measurement of mean quantisation error for processing elements. The intra-neuron distance of each source is then computed as the squared value of the Euclidean distance between the source and the prototype of the neuron it belongs to, whereas the inter-neuron distance is computed as the squared Euclidean distance between two different neuron prototypes. In order to assess the quality of the clustering, we selected the three parameters that we thought best describe the distribution of the intra-neuron distances: (a) the width of the distribution according to the value of the full width at half maximum (); (b) the skewness (), which measures its asymmetry; and, (c) the kurtosis excess (), which measures the level of concentration of distances. A high-quality clustering will result from neurons with low values of the parameter, and large positive values of both skewness and kurtosis. Finally, in order to facilitate the interpretation of such quality measurements, a categorical index named was derived based on the values obtained for , , and a normalised version of (which is reversed in order for the higher quality neurons to take larger values). To this purpose, seven quality categories were established, according to the values taken by such parameters with respect to six arbitrarily chosen percentiles (, , , , , and ), which are computed independently for each one of the parameters listed above over the entire map. For each neuron, we determine the lowest percentile in which the three parameters are above their respective percentile values. Thus, if a value is above the percentile, then will take the value of zero; if it is in the percentile, then will correspond to category one, and so on up to category six, which will correspond to those neurons whose poorest quality indicator is outside the lowest percentile that has been considered, . Accordingly, the best-quality neurons will have and the worst ones . It should be emphasised here that only assesses the quality of the clustering (i.e. how closely the pre-processed BP/RP spectra in a neuron match their prototype) compared to the overall intra-neuron distances, such that no assumption should be made on the quality of the spectra they contain, nor on the labelling of the individual neurons described below.
4.2.3 Neuron labelling
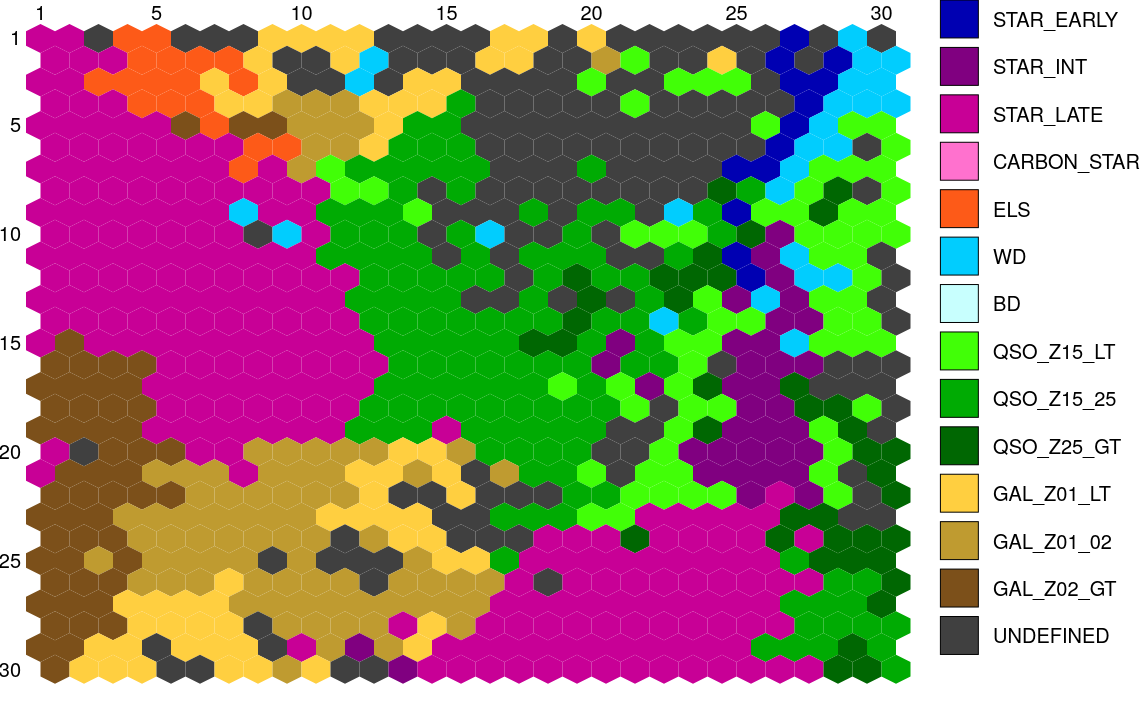
Unsupervised methods do not directly provide any label to the samples that are being analysed. For this reason, a set of reference BP/RP spectra templates for prototypical astronomical objects was built by taking into account validation sources from the various Apsis modules (see the online documentation). These reference templates are used to label the neurons in Gaia DR3 by identifying the closest template to the neuron prototype according to the Euclidean distance. In addition, to guarantee the suitability of the assigned templates (and class labels), two conditions were imposed: (a) the squared Euclidean distance between a template and the neuron prototype must not exceed a threshold of ; and, (b) the neuron must have . Figure 10 shows the SOM built by OA for Gaia DR3, where around 80% of the neurons were assigned a template, and hence a class label. The limit of on the squared distance was set during the template-building process and is detailed in the online documentation.
4.2.4 GUASOM visualisation tool
To help the user to analyse and visualise the clustering results, we designed an application called Gaia Utility for the Analysis of Self-Organising Maps (GUASOM) (Álvarez et al., 2021). It can be run over the internet, and contains several visualisation utilities that allow an interactive analysis of the information present on the map. The tool provides both classical and specific domain representations such as U-matrix, hits, parameter distributions, template labels, colour distribution, and category distribution.
4.3 Performance and results
OA processed objects in Gaia DR3. Figure 11 displays their magnitude distribution, demonstrating that OA covers a wide range of magnitudes with a significant fraction of faint objects.
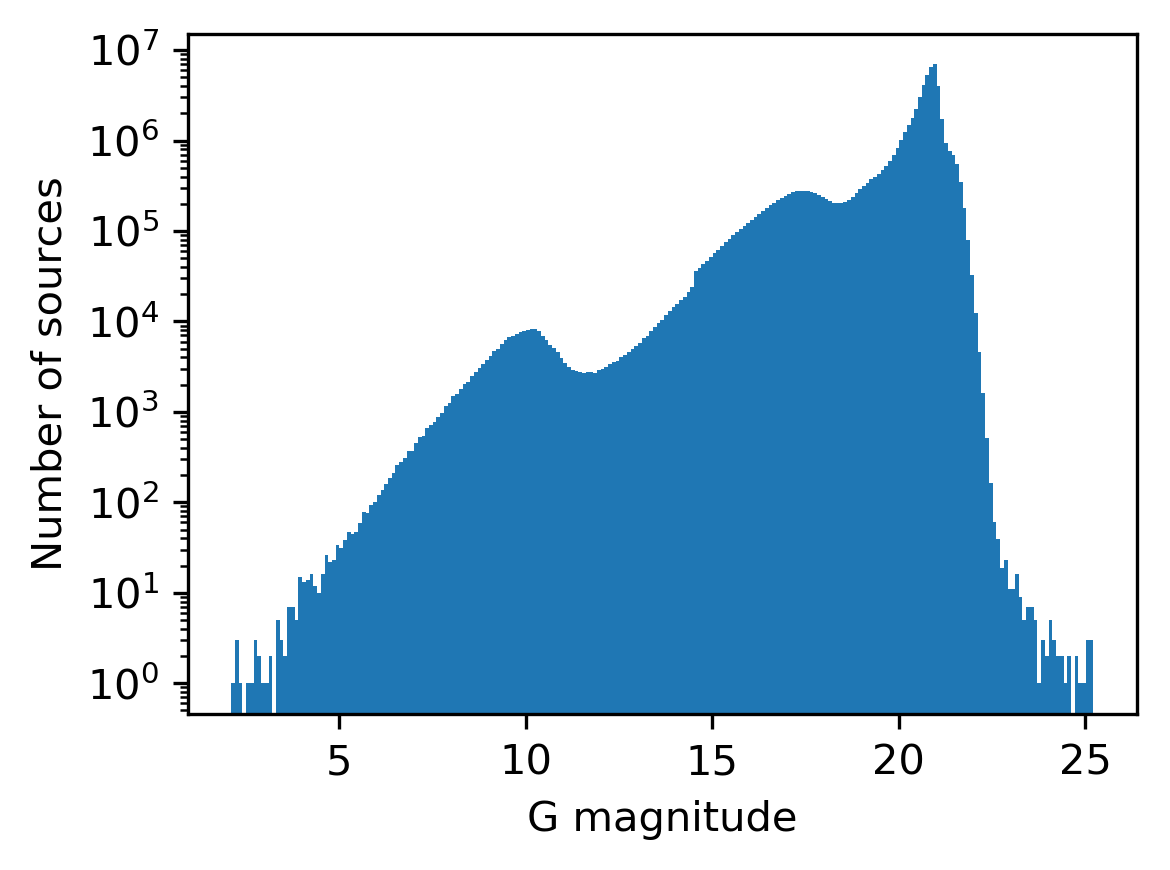
Figure 12 shows the histogram of neuron quality categories, , where the total number of sources belonging to such neurons is superimposed. Approximately 35% of the neurons have and are hence referred to as ‘high-quality neuron’: these comprise around 55% of the sources processed. The rest of the neurons can be considered as low-quality neurons. Figure 13 shows how the quality categories are distributed over the SOM.
It is worth mentioning that the SOM does not directly label neurons, nor does it provide quality measurements on the clustering they produce, which means that we have to apply the procedures described in Sections 4.2.2 and 4.2.3 after we build the map. As a result, Figure 13 shows the quality category associated with each neuron in our grid of neurons. These quality categories assess how well the sources fit to the prototype of the neuron they belong to: neurons with the lowest quality category are composed of sources whose spectra are the most homogeneous (i.e. neurons of highest quality). Similarly, in Figure 10, the label assigned to each neuron provides a hint as to the astronomical type of the sources they contain. Comparing Figures 10 and 13, we can see that high-quality neurons mostly correspond to stars and galaxies, while quasars are usually associated with low-quality neurons. The reason for this mostly stands in the wide range of cosmological redshifts that is observed amongst those objects, in their different continuum shapes and emission-line equivalent widths.
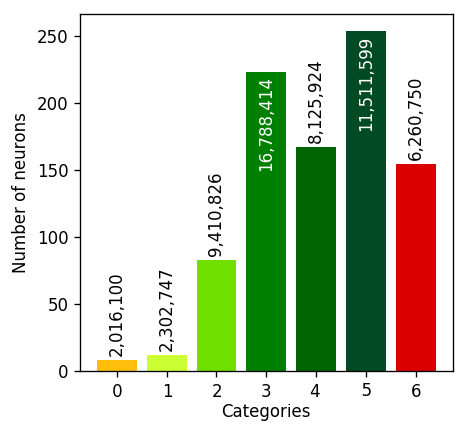
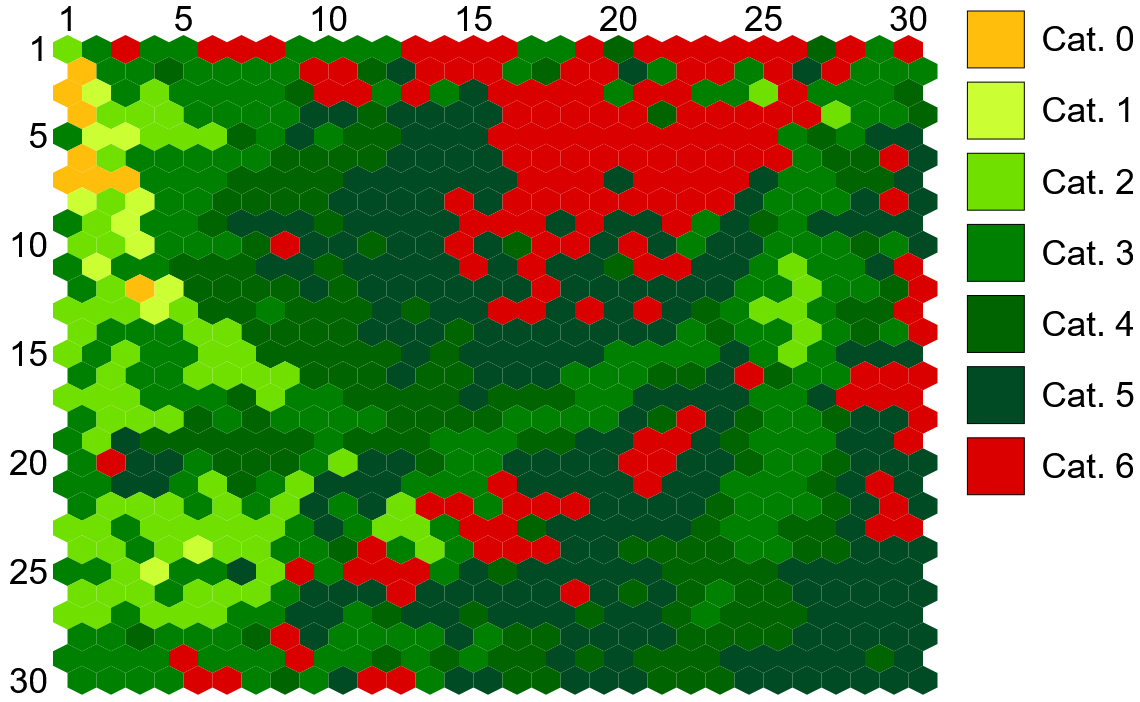
Table 4 represents the contingency table between DSC Combmod and OA class labels. DSC labels are determined according to the class with the highest DSC Combmod probability, except for those that take a probability below , which are labelled as ‘unknown’. Sources with DSC ‘binary star’ class are considered as ‘star’ as the former class is not present in OA. Similarly, OA class labels are aggregated into more generic ones in order to enable comparison with the DSC class labels. Recalling that OA only processes sources with all DSC Combmod probabilities below , the OA results can be summarised as follows.
-
•
Galaxies: There is close agreement for galaxies, as around 80% of the galaxies identified by DSC are also confirmed by OA.
-
•
Quasars: The agreement with DSC decreases to 35%. A large fraction of those quasars identified by DSC are considered as stars or white dwarfs by OA.
-
•
Stars: Around 40% of those identified by DSC were also confirmed by OA. However, a large fraction of them were considered as extragalactic objects by OA.
-
•
White dwarfs: In this case, the agreement between both modules is around 50%. Most of the remaining objects are considered as stars by OA.
Around 11% of the sources are assigned to a neuron that was not labelled by OA because of their poor quality (category six). In particular, approximately 2 510 sources could not be classified by OA and have classlabel_dsc = ’unclassified’, meaning that studying their nature may require a deeper analysis.
| OA class label | |||||||
| STAR | WD | QSO | GAL | UNDEFINED | Total | ||
| DSC | STAR | % | % | % | % | % | |
| WD | % | % | % | % | % | ||
| QSO | % | % | % | % | % | ||
| GAL | % | % | % | % | % | ||
| UNKNOWN | % | % | % | % | % | ||
| Total | |||||||
4.4 Use of OA clustering
The analysis performed by the OA module can be useful for different purposes. For instance, high-quality neurons can help to assess the physical nature of some sources with DSC combmod probabilities below the chosen threshold () in all classes or to identify objects that were potentially misclassified. As OA provides an unsupervised classification based on a normalised SED comparison, for a given neuron there are sources with different degrees of similarity to the prototype. For that reason, we encourage the user to isolate clean samples for each neuron through the quality measurements provided in the online documentation. In particular, we suggest combining both the categorical quality index () and the classification distance in order to retrieve the best classified sources from OA. Table 5 shows the number of sources per class that are assigned to a high-quality neuron (from category zero to three), and whose classification distance between the pre-processed BP/RP spectrum of the source and the neuron prototype is below (i.e. what we consider here as reliable predicted classes). As can be seen, around 13 million stars, 9 million galaxies, 2 million quasars, and million white dwarfs meet these criteria.
| Class label | Number of sources |
|---|---|
| STAR_LATE | |
| GAL_Z01_02 | |
| STAR_INT | |
| GAL_Z02_GT | |
| GAL_Z01_LT | |
| WD | |
| QSO_Z15_LT | |
| QSO_Z15_25 | |
| STAR_EARLY | |
| ELS | |
| QSO_Z25_GT |
5 Quasar classifier (QSOC)
5.1 Objectives
The quasar classifier (QSOC) module is designed to determine the redshift, , of the sources that are classified as quasars by the DSC module (see Section 3 for more details). In order to produce redshift estimates for the most complete set of sources, we considered a very low threshold on the DSC quasar probability of classprob_dsc_combmod_quasar , meaning that we expect a significant fraction of the processed sources to be stars or galaxies. Users interested in purer sub-samples may then require that classlabel_dsc_joint = ’quasar’, as explained in Section 3.2.4, or may use more sophisticated filtering, as explained in (Gaia Collaboration, Bailer-Jones et al., 2022, Section 8).
5.2 Method
5.2.1 Overview
QSOC is based on a approach that compares the observed BP/RP spectra sampled by SMSgen (see Creevey et al., 2022, and the online documentation) to quasar rest-frame templates in order to infer their redshift. The predicted redshifts take values in the range . As the effective redshift is not necessarily the one associated with the minimal (see Section 5.2.3), it is complemented by an indicator of the presence of quasar emission lines ( from Equation 6) and these are converted into a redshift score, , from Equation 7. For a given source, the redshift with the highest score is then the one that is selected by the algorithm. Quasar templates are described in Section 5.2.2 while the redshift determination algorithm is described in Section 5.2.3.
5.2.2 Quasar templates
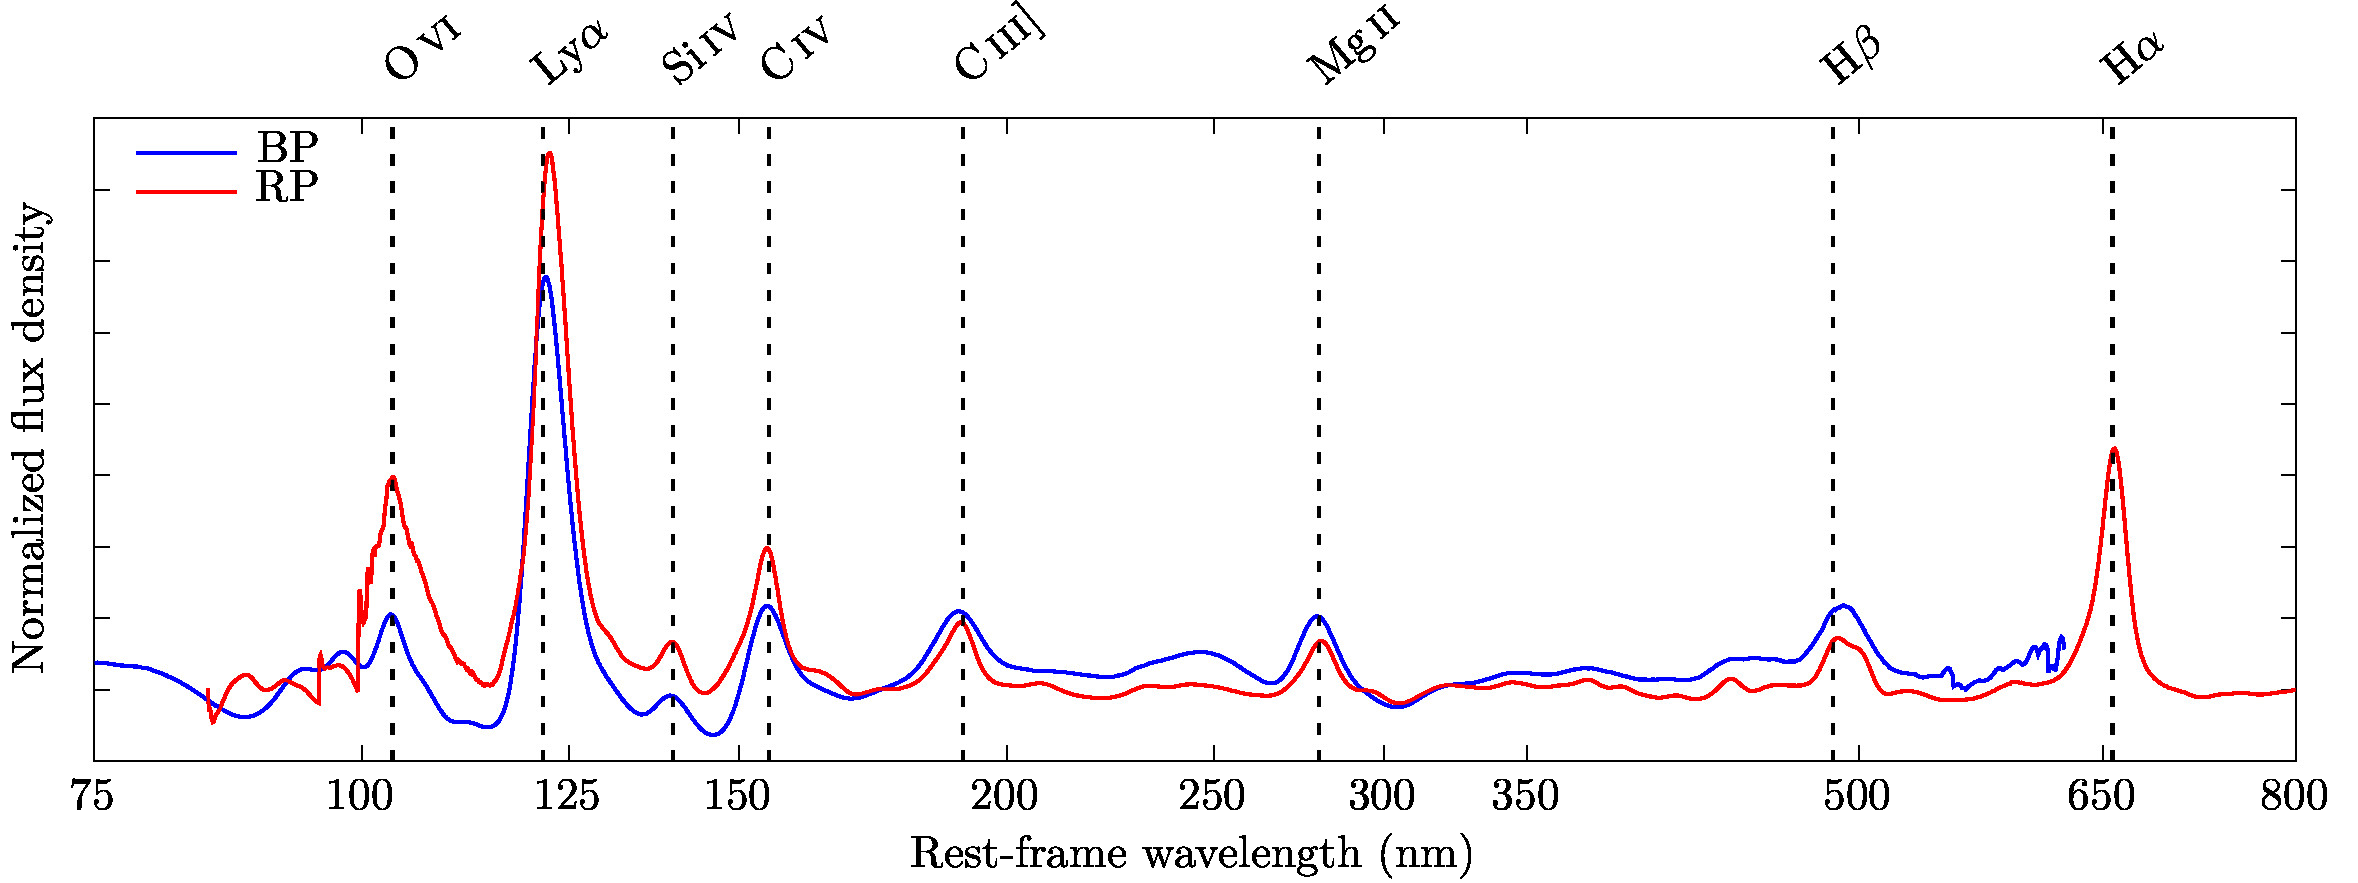
The quasar templates used by QSOC were built based on the method described in Delchambre (2015) and applied to 297 264 quasars101010We note that for 37 of the 297 301 quasars originally contained in the DR12Q catalogue, the -1 norm fit of the continuum to the observed spectrum (later described) did not converge and these were accordingly not included in the final sample we used. from the twelfth release of the Sloan Digital Sky Survey Quasar catalogue of (Pâris et al., 2017, DR12Q). These spectra are first extrapolated to the wavelength range of the Gaia BP/RP spectro-photometer (i.e. – nm) with a linear wavelength sampling of nm using a procedure similar to the one used by Delchambre (2018). They are subsequently converted into BP/RP spectra through the use of the BP/RP spectrum simulator provided by CU5 and described in Montegriffo et al. (2022). An artificial spectrum with a uniform SED (i.e. of constant flux density per wavelength) was also converted through the BP/RP spectrum simulator in order to produce the so-called ‘flat BP/RP spectrum’. We then divided each simulated BP/RP spectrum by its flat counterpart before subtracting a quadratic polynomial that is fitted to the observations in a least absolute deviation sense (i.e. -1 norm minimisation), leaving pure emission line spectra. We note that, in order to avoid fitting emission lines, a second-order derivative of the flux density was estimated around each sampled point, , and later used to scale the associated uncertainties by a factor of where is a normalisation factor equal to the maximal absolute value of the second-order derivatives evaluated over all the sampled points. As the continuum regions often have very low curvatures compared to the emission lines, they are usually overweighted by a factor of up to 100 in the -1 norm minimisation. A logarithmic wavelength sampling of was then used for both the BP and RP templates, ensuring that the resolution of the BP/RP spectra, as sampled by SMSgen, is preserved. We extracted 32 BP/RP templates based on these 297 264 simulated spectra using the weighted principal component analysis method described in Delchambre (2015); nevertheless, only the dominant BP/RP templates —corresponding to the mean of the weighted principal component analysis method— were used because cross-validation tests performed on the simulated spectra show that a larger number of templates significantly increases the degeneracy between redshift predictions.
The resulting templates, illustrated in Figure 14, closely match the typical composite spectra of quasar emission lines (see e.g. Gaia Collaboration, Bailer-Jones et al., 2022, Section 7), although they are convolved by the Gaia line spread function which is averaged over the entire set of rest-frame wavelengths. The templates cover the rest-frame wavelength range from nm to nm in BP and from nm to nm in RP. These limits, along with the observed wavelength coverage imposed by SMSgen of – nm in BP and – nm in RP allow QSOC to predict redshifts in the range 111111As the cross correlation function computed by QSOC is extrapolated by at its border, the range of the QSOC redshift predictions is slightly wider than one would expect from a straight comparison of the observed and rest-frame wavelengths..
5.2.3 Algorithm
The determination of the redshift of quasars by QSOC is based on the fact that the redshift, , turns into a simple offset once considered on a logarithmic wavelength scale:
| (1) |
where we assume that a given spectral feature located at rest-frame wavelength is observed at wavelength . Consider such a logarithmic sampling , where is a reference wavelength and is the logarithmic wavelength sampling we use, here (or ). Then for a given set of rest-frame templates, , and an observation vector, , which are both logarithmically sampled with , the derivation of the optimal shift, , between and can be formulated as a minimisation problem through
| (2) |
where is the uncertainty on and are the coefficients that enable the fit of to in a weighted least squares sense while considering a shift that is applied to the templates. The redshift that is associated with the shift is then given by . A continuous estimation of the redshift is then obtained by fitting a quadratic polynomial to in the vicinity of the most probable shift.
Despite its appealing simplicity, Equation 2 is known to have a cubic time complexity on , as shown in Delchambre (2016), where is the number of samples contained in each template. In the same manuscript, it is shown that the computation of the cross-correlation function (CCF), defined as
| (3) |
requires only floating point operations. Furthermore, given that is independent of the explored shift, , maximising is equivalent to minimising .
However, some features of the BP/RP spectra complicate the computation of the CCF. First, the BP and RP spectra are distinct such that the effective CCF is actually composed of the sum of two CCFs associated with the BP and RP spectra and templates, and , respectively:
| (4) |
Secondly, the BP/RP spectra have bell shapes (i.e. their flux smoothly goes to zero at the borders of the spectra), and have spectral flux densities that are integrated over wavelength bins of different sizes, as explained in Creevey et al. (2022). Equation 3 is therefore not directly applicable to these spectra. In order to overcome these difficulties, we divided each BP/RP spectrum by the previously mentioned flat BP/RP spectrum (i.e. BP/RP spectrum coming from a constant flux density and converted through the BP/RP spectrum simulator) and updated their uncertainties accordingly. This solution enables us to solve both the bell shape issue and the varying wavelength size of each pixel, passing from units of flux to units of flux density. Finally, most of the quasar flux resides in its continuum, which we model here as a second-order polynomial, concatenated to the set of templates, , and subsequently fitted to the observations in Equation 3.
| Parameters of the redshift score | |||||||||
|---|---|---|---|---|---|---|---|---|---|
| Parameters of the for BP spectra | |||||||||
| O iv | Ly | Si iv | C iv | C iii] | Mg ii | H | H | ||
| [nm] | 103.202 | 121.896 | 139.349 | 154.658 | 189.957 | 279.259 | 437.904 | 491.899 | |
| 0.017 | 1.0039 | 0.01 | 0.13202 | 0.31359 | 0.94396 | 0.23848 | 0.93124 | ||
| Parameters of the for RP spectra | |||||||||
| O iv | Ly | Si iv | C iv | C iii] | Mg ii | H | H | H | |
| [nm] | 103.353 | 122.388 | 139.563 | 154.588 | 190.398 | 280.470 | 435.600 | 488.952 | 657.736 |
| 0.062484 | 0.10984 | 0.18982 | 0.07023 | 0.1409 | 0.22011 | 0.4101 | 0.25137 | 0.59948 | |
| Warning flag | Bit | Value | Condition(s) for rising |
|---|---|---|---|
Z_AMBIGUOUS
|
1 | 1 | The CCF has more than one maximum with , meaning that at least two redshifts lead to a similar and the solution is ambiguous. |
Z_LOWCHI2R
|
2 | 2 | |
Z_LOWZSCORE
|
3 | 4 | |
Z_NOTOPTIMAL
|
4 | 8 | The selected solution did not correspond to the global maximum (i.e. ) |
Z_BADSPEC
|
5 | 16 | The BP/RP spectra upon which this prediction is based are considered as unreliable. An unreliable spectrum has a number of spectral transits in BP, or RP, that is lower than or equal to ten transits or mag or mag or mag (see the online documentation for more information on the derivation of these limits). |
As highlighted in Delchambre (2018), the global maximum of the CCF may not always lead to a physical solution as, for example, some characteristic emission lines of quasars (e.g. Ly, Mg ii, or H) may be omitted from the fit while some emission lines can be falsely fitted to absorption features. This global maximum may also result from the fit of noise in the case of very low signal-to-noise-ratio (S/N) spectra. In order to identify these sources of error, we define a score, , that is associated with each shift; the shift associated with the highest score is the one that is selected by the algorithm. This score is computed as a weighted -norm of the chi-square ratio defined as the value of the CCF evaluated at over the maximum of the CCF,
| (5) |
and of an indicator of the presence of quasar emission lines,
| (6) |
where is the value of the BP/RP flux of the continuum-subtracted emission line at rest-frame wavelength if we consider the observed spectrum to be at redshift ; is the associated uncertainty and is the theoretical intensity121212Theoretical emission line intensities should be regarded as weights. They do not refer to a particular theoretical model of the emission lines of quasars but to the values inferred in Table 6. of the emission line located at , which is normalised so that the total intensity of all emission lines in the observed wavelength range is equal to one. Equation 6 can then be viewed as a weighted geometric mean of a set of normal cumulative distribution functions of mean zero and standard deviations evaluated at . A close to one indicates that all the emission lines that we expect at redshift are found in the spectra while missing a single emission line often leads to a very low . The final formulation of the score is then given by
| (7) |
where , , and are parameters of the weighted -norm, as listed in Table 6.
Table 6 summarises the various parameters used in the computation of the redshift score, . Also, in order to facilitate the filtering of these potentially erroneous redshifts by the final user, we define binary processing flags, flags_qsoc, which are listed in Table 7. As later highlighted in Section 5.4, most secure predictions often have bits 1–4 unset (i.e. flags_qsoc = 0 or flags_qsoc = 16).
Finally, the uncertainty on the selected redshift, , is derived from the uncertainty on the associated shift, , using the asymptotic normality property of the estimator, which states that is asymptotically normally distributed with a variance that is inversely proportional to the curvature of the CCF around the optimum. In particular, the variance on is asymptotically given by and as , the logarithmic redshift, , is also normally distributed with a variance of
| (8) |
Furthermore, as , the redshift that is reported by QSOC is distributed as a log-normal distribution of mean and variance , although this distribution is shifted by . Accordingly, the squared uncertainty on the computed redshift is given by
| (9) |
while its lower and upper confidence intervals, taken as its and quantiles, respectively, are given by
| (10) |
5.3 Performance and results
The QSOC contributions to Gaia DR3 can be found in the qso_candidates table and consist of: redshift_qsoc, the quasar redshift, ; redshift_qsoc_lower/redshift_qsoc_upper, the lower and upper confidence intervals, and , corresponding to the 16% and 84% quantiles of , respectively, as given by Equation 10; ccfratio_qsoc, the chi-square ratio, , from Equation 5; zscore_qsoc, the from Equation 6, and flags_qsoc, the QSOC processing flags, , from Table 7.
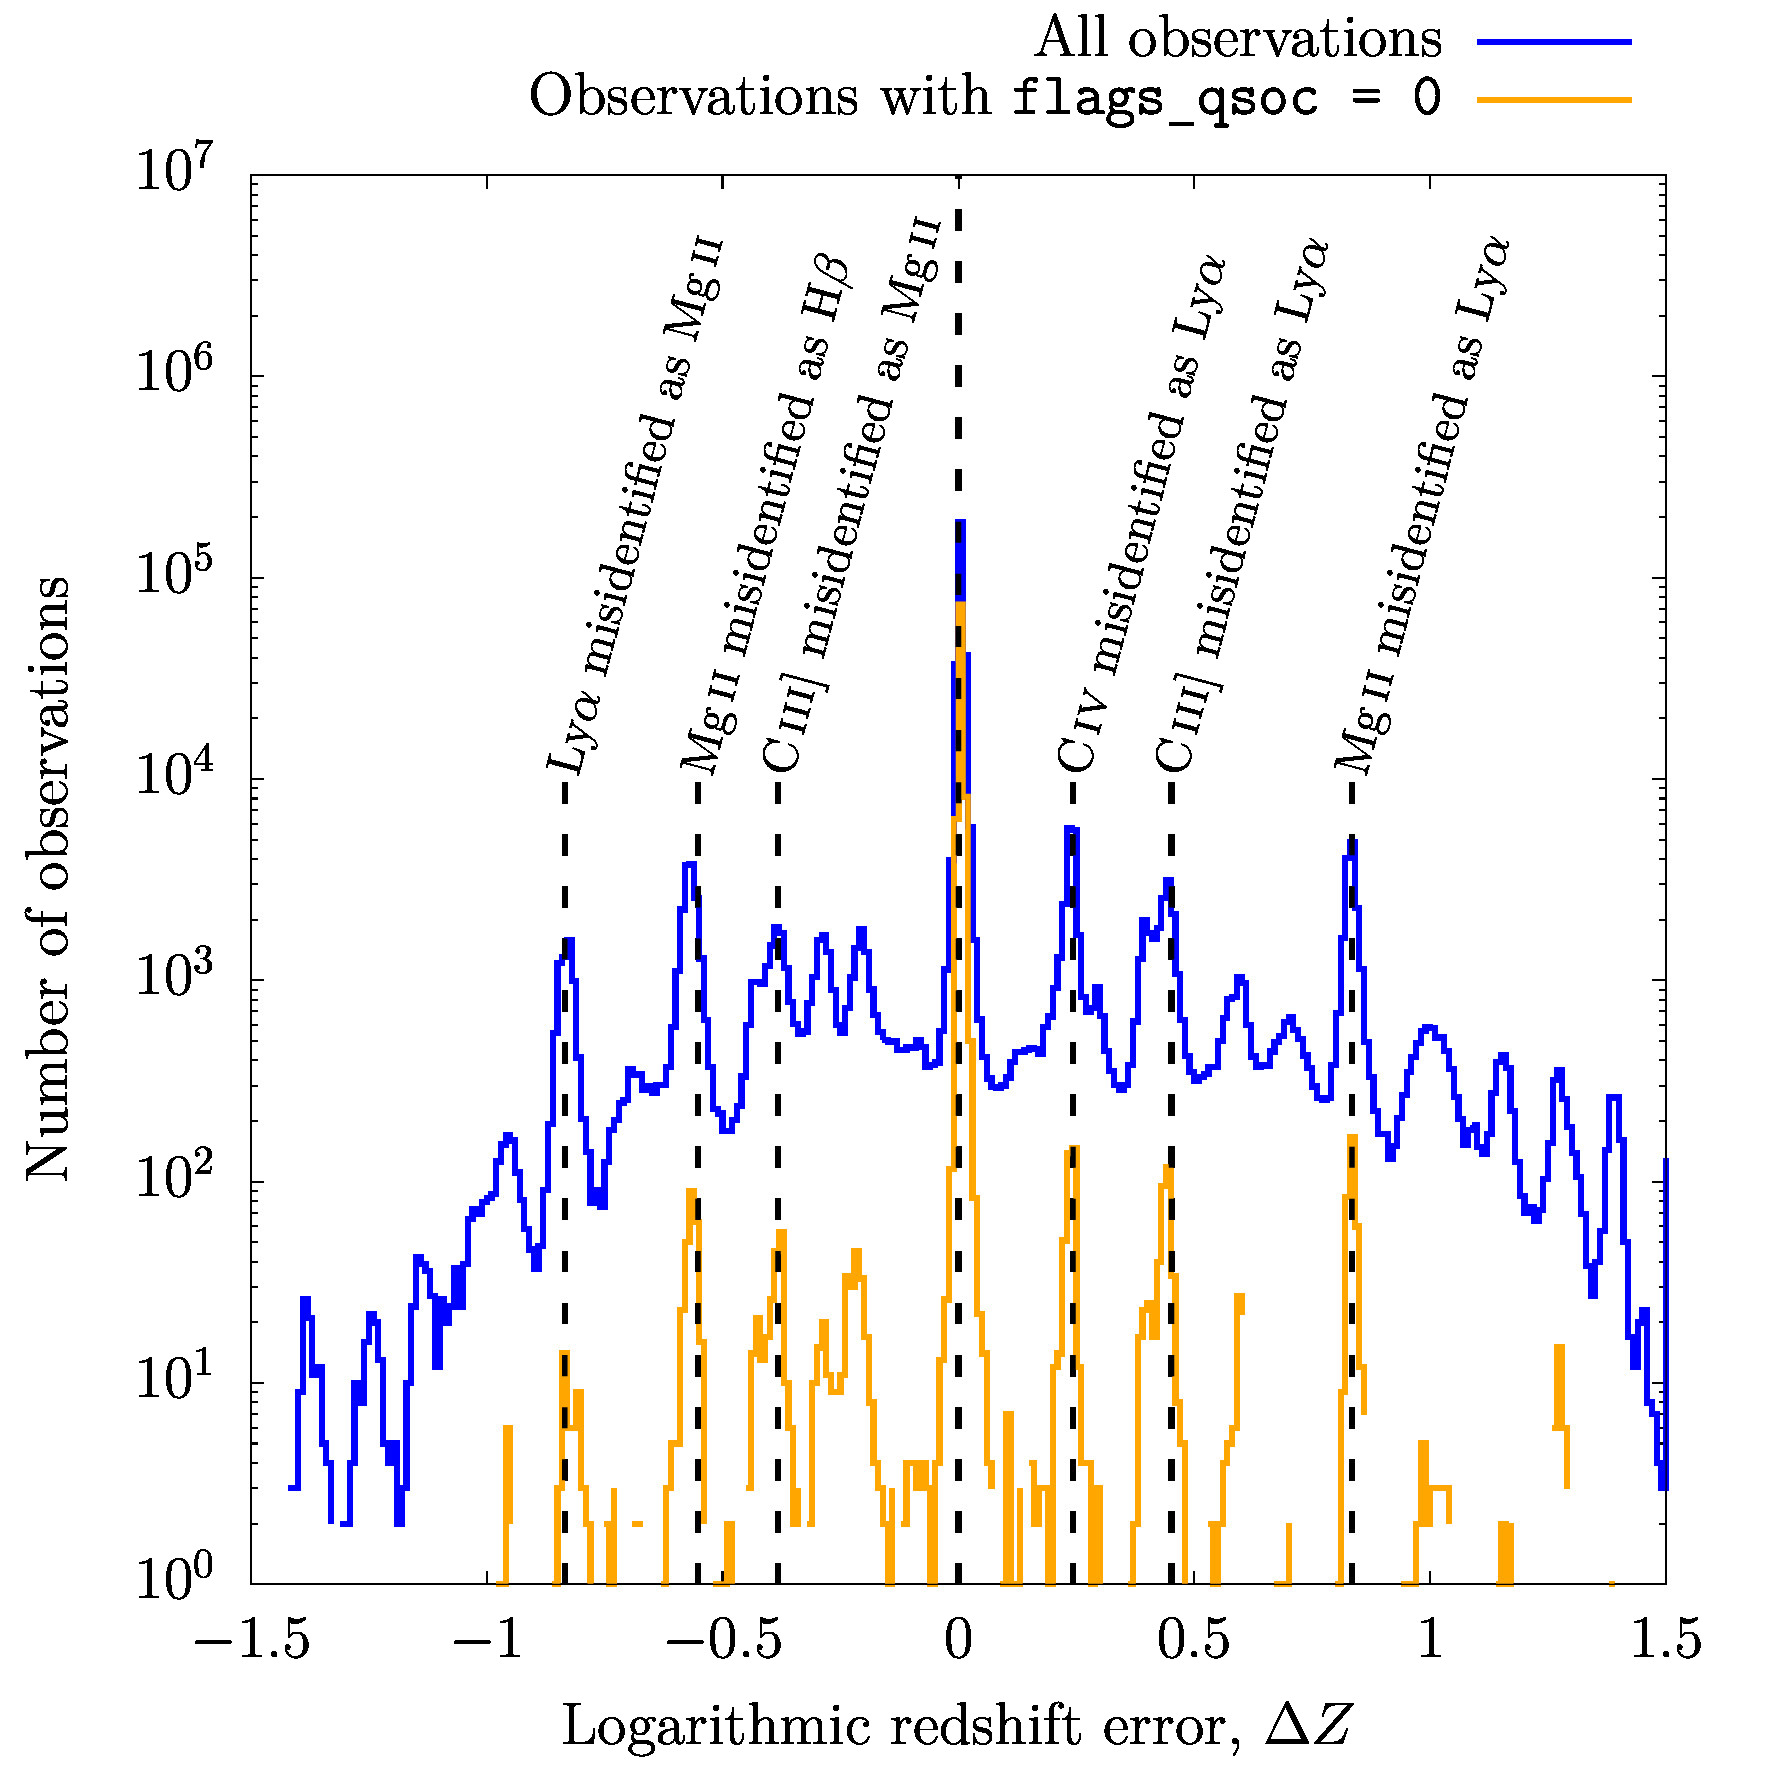
We quantitatively assess the quality of the QSOC outputs by comparing the predicted reshifts against values from the literature. For this purpose, we cross-matched 6 375 063 sources with redshift estimates from QSOC with 790 776 quasars that have spectroscopically confirmed redshifts in the Milliquas 7.2 catalogue of Flesch (2021) (i.e. type = ’Q’ in Milliquas). Using a 1′′ search radius, we found 439 127 sources in common between the two catalogues. It should be emphasised here that the distributions of the redshifts and magnitudes of the cross-matched sources are not representative of the intrinsic quasar population as they inherit the selection and observational biases that are present in both the Milliquas catalogue and in Gaia. The numbers reported here should therefore be interpreted with that in mind. A straight comparison between the QSOC prediction and the Milliquas spectroscopic redshifts, illustrated in Figure 15 on a logarithmic scale, shows that of the sources have an absolute error on the predicted redshift, , that is lower than 0.1. This ratio increases to if only flags_qsoc = 0 sources are considered.
As most of the DR12Q quasars we use for building our templates are also contained in the Milliquas catalogue (161 278 QSOC predictions are contained in both the DR12Q and Milliquas catalogue), one may wonder whether these induce a positive bias on the fraction of sources with . In order to answer this question, we note that the QSOC templates were built based on a statistically significant number of 297 264 sources, and so we expect the computed templates to be representative of the whole quasar population under study while not being too specific to the particular set of spectra we used (i.e. any other set of spectra of the same size would have provided us with very similar templates). Nevertheless, of the sources in the DR12Q catalogue have . This compares to of the sources with that are not in the DR12Q catalogue. If we consider only sources with flags_qsoc, then these numbers are and , respectively. The observed differences can be explained primarily by the fact that, due to the selection made in the SDSS-III/BOSS survey, of the DR12Q sources that are found among the QSOC predictions have where the presence of the Ly+Si iv+C iv+C iii emission lines allows secure determination of the redshift ( of the sources in this range have ). In contrast, the redshift distribution of the sources that are found only in Milliquas peaks in the range where only of the sources have , owing to the sole presence of the Mg ii emission line in this redshift range (see Section 5.4 for more information on these specific redshift ranges). However, both subsets have a comparable fraction of predictions with once these are computed over narrower redshift ranges, as expected.
We further investigate the distribution of the logarithmic redshift error, defined as
| (11) |
between QSOC redshift, , and the literature redshift, , in Figure 15. If we assume that a spectral feature at rest-frame wavelength is falsely identified by QSOC as another spectral feature at , then the resulting logarithmic redshift error will be equal to , such that , besides its ability to identify good predictions, can also be used to highlight common mismatches between emission lines. In Figure 15, we can see that most of the predicted (logarithmic) redshifts are in good agreement with their literature values while emission line mismatches mainly occur with respect to two specific emission lines: C iii] and Mg ii. In the most frequent case, the C iv emission line is misidentified as Ly, because the separation between these two lines is comparable to the separation between C iv and C iii] when considered on a logarithmic wavelength scale. The Ly and C iii] lines are subsequently fitted to noise or wiggles in the very blue part of BP and in RP, respectively. By requiring that flags_qsoc = 0, we can mitigate the effect of these emission-line mismatches without affecting the central peak of correct predictions too much.
Finally, we note that the distribution of , where is defined in Equation 8, effectively follows an approximately Gaussian distribution of median 0.007 and standard deviation (extrapolated from the inter-quartile range) of if observations with are considered. If only observations for which flags_qsoc = 0 are considered, have a median of and standard deviation of .
5.4 Use of QSOC results
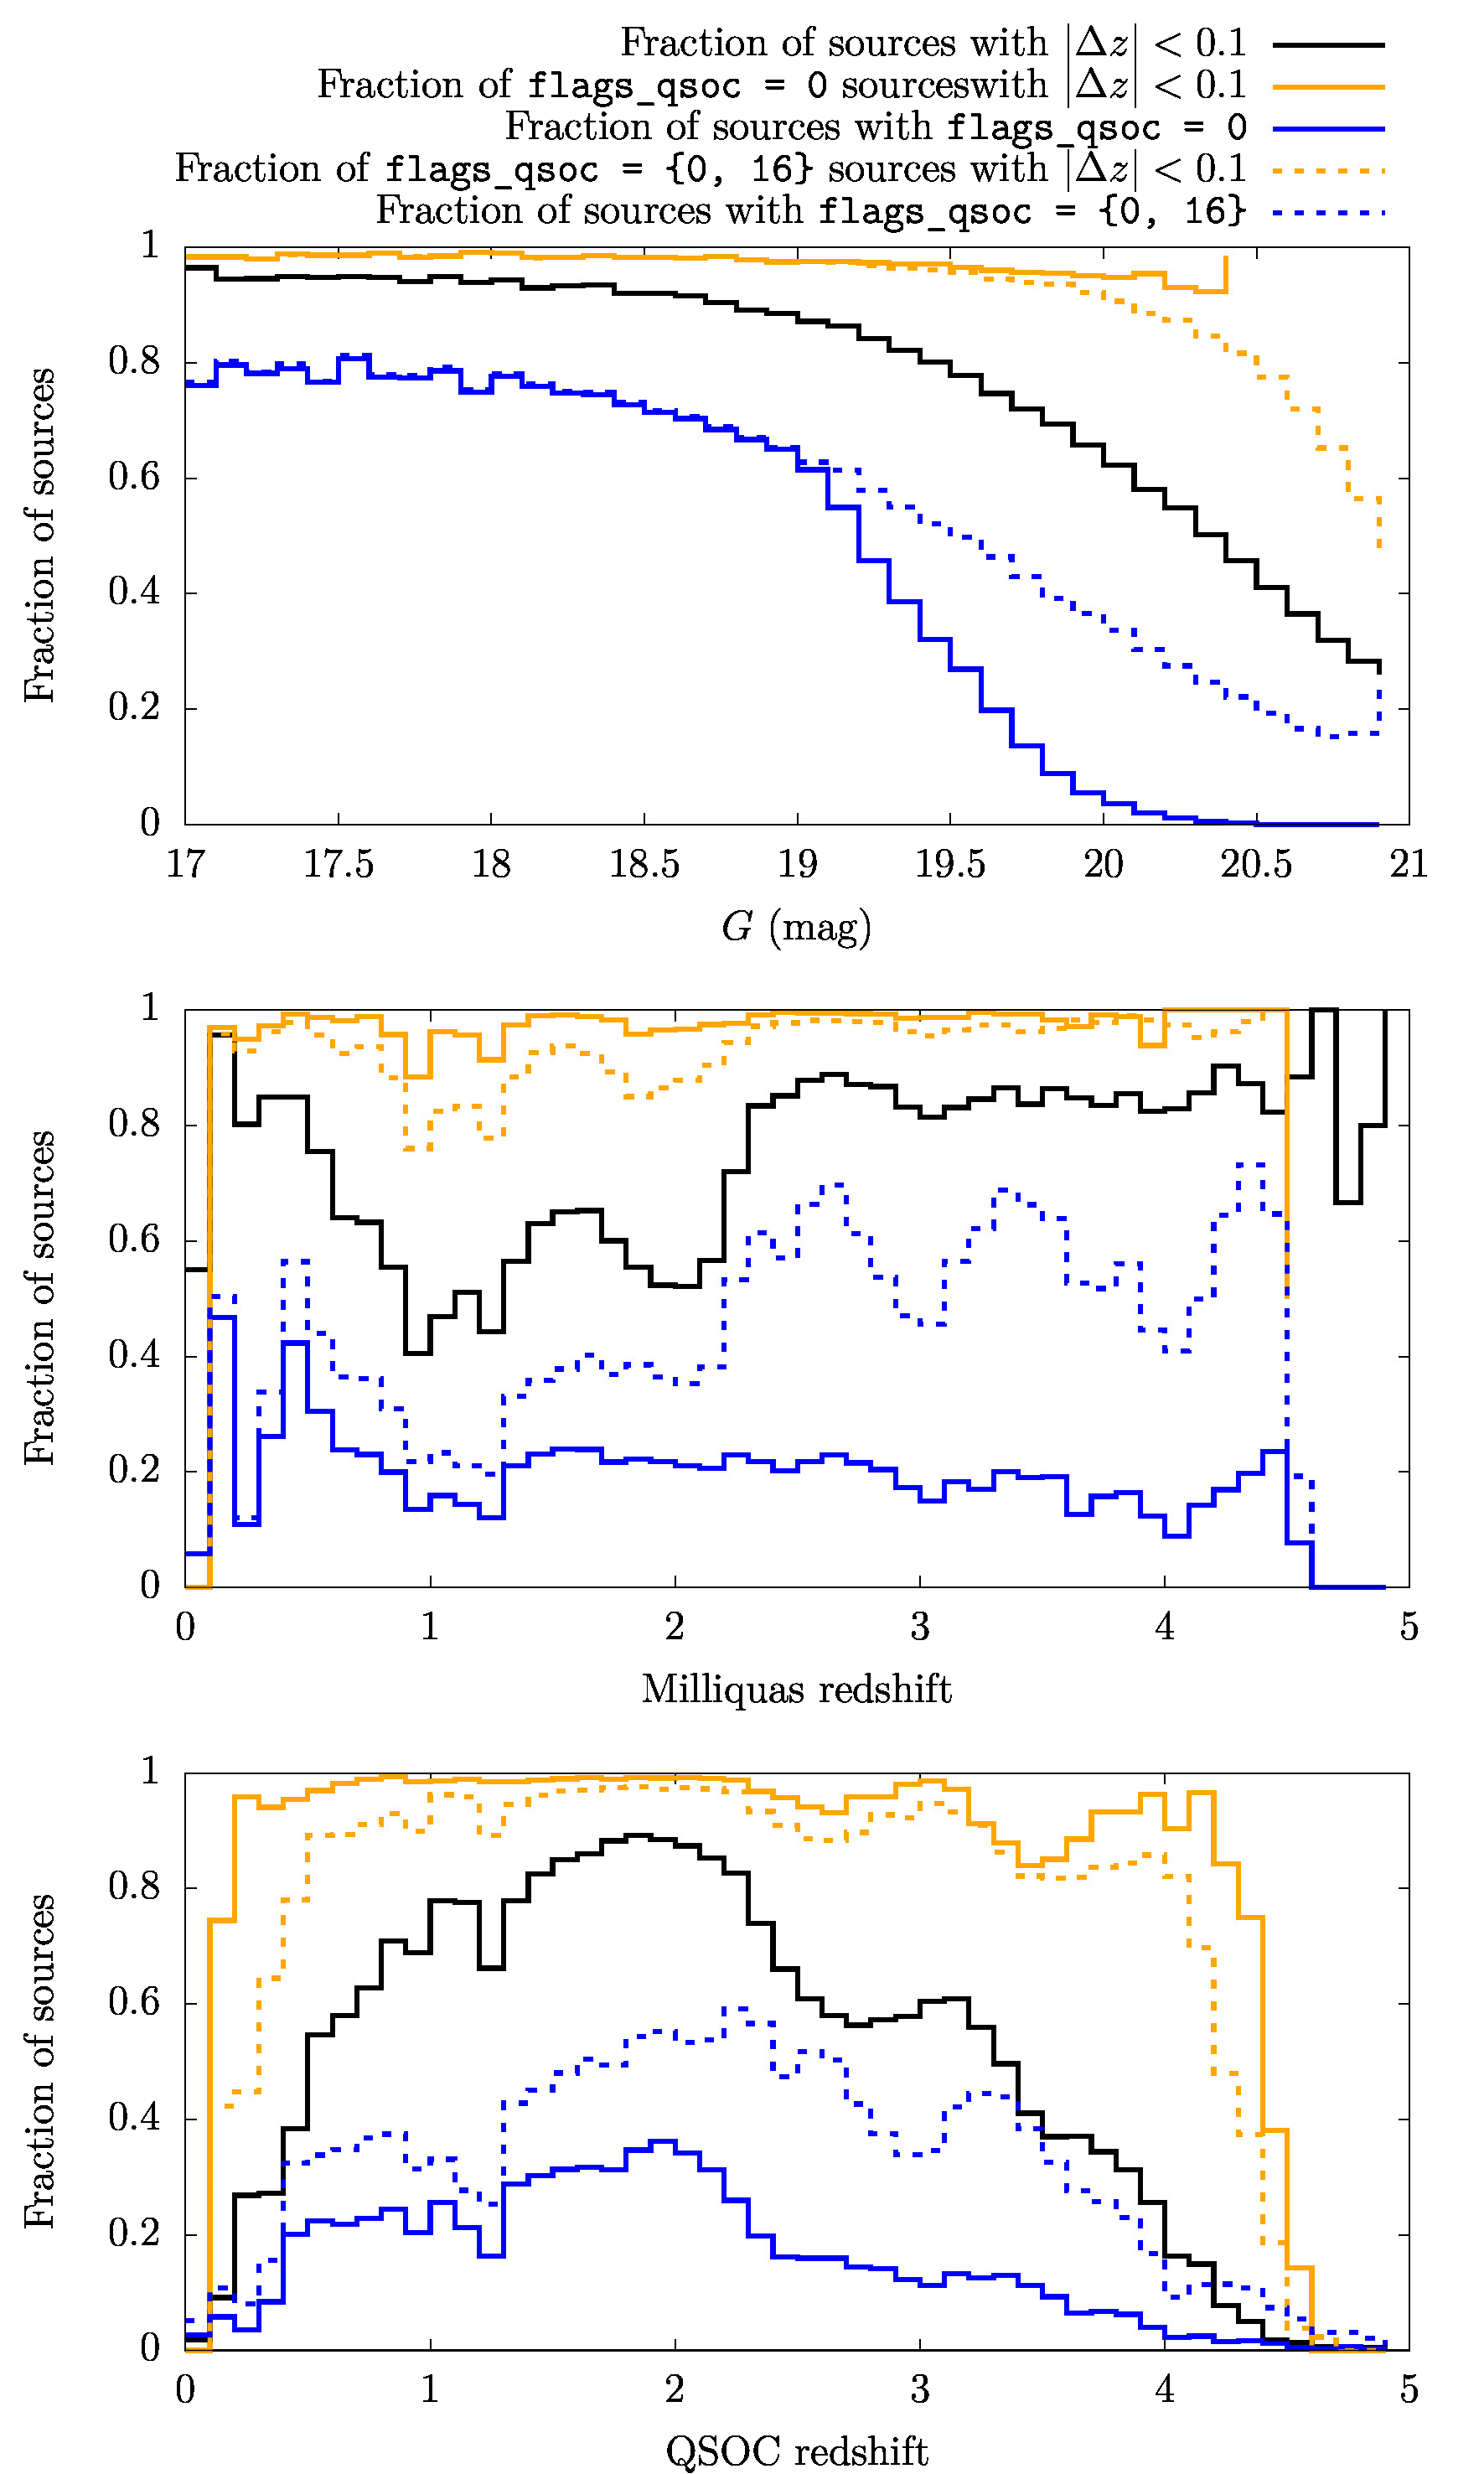
In Gaia DR3, QSOC systematically publish redshift predictions for which classprob_dsc_combmod_quasar and flags_qsoc , leading to 1 834 118 sources that are published according to these criteria (see source_selection_flags for more information on the selection procedure). Nevertheless, for the sake of completeness, we also publish redshift estimates for all sources with classprob_dsc_combmod_quasar that are contained in the qso_candidates table, yielding additional sources for which flags_qsoc . However, these last predictions are of lower quality as, for example, a comparison with the Milliquas spectroscopic redshift shows that of the flags_qsoc sources have , compared to for sources with flags_qsoc .
Of the source parameters published in the Gaia DR3, the -band magnitude, phot_g_mean_mag, has a particularly strong impact on the quality of the QSOC predictions; it shows a clear correlation with the S/N of the BP/RP spectra, as does the number of BP/RP spectral transits to a lesser extent. From the top panel of Figure 16, we see that more than of the sources with mag have (black line) while the same fraction is obtained for spectra with mag only for sources with flags_qsoc (orange solid line). However, these correspond to a very small fraction () of the sources in this magnitude range (blue solid line). A less stringent cut, flags_qsoc = 0 or flags_qsoc = 16, where we encounter no processing issue (i.e. flag bits – are not set) even when the BP/RP spectra are unreliable (i.e. flag bit can be set), still leads to of the sources with (orange dotted line) while retaining of the sources in this magnitude range (blue dotted line). The same cut concurrently retains of the mag observations where of the predictions have and is accordingly recommended for users dealing with sources at mag.
Besides the aforementioned recommendations on the flags_qsoc and magnitude, we should point out an important limitation of the Gaia BP/RP spectro-photometers regarding the identification and characterisation of quasars, namely the fact that the Mg ii emission line is often the sole detectable emission line in the BP/RP spectra of quasars in the moderate-S/N regime of mag spectra. Indeed, despite the broad – nm coverage of the BP/RP spectrophotometers, quasar emission lines are often significantly damped in the observed wavelength regions nm and nm, owing to the low instrumental response in these ranges (see for example Gaia Collaboration, Bailer-Jones et al., 2022, Figure 10). As a result, the H and C iii] emission lines surrounding the Mg ii line131313The H emission line being intrinsically weak, it is often not seen in the BP/RP spectra of quasars and is accordingly not considered here. only enter the BP/RP spectra at and , respectively. Nevertheless, we consider a range of in order to take into account low-S/N spectra where these lines, although present, are often lost in the noise. The sole presence of the Mg ii emission line has the deleterious effect of increasing the rate of mismatches between this line and mainly the Ly and H emission lines, as seen in Figure 15. Another issue also arises for quasars, where the C iii] emission line enters the BP spectrum while the Mg ii line now lies on the peak of the BP spectrum, which complicates its detection by the algorithm leading to mismatches between C iii] and the Ly or Mg ii emission lines. These effects are clearly visible in the middle panel of Figure 16 at , along with the previously discussed misidentification of the C iv line as Ly at . Appropriate cuts on flags_qsoc allow both of these shortcomings to be alleviated, as seen in Figure 16.
In the bottom panel of Figure 16, we see that the fraction of sources with amongst very low- and high-redshift sources, as predicted by QSOC, is low ( for sources and for sources). The explanation is that these very low- and high- quasars are rare in our sample, such that any erroneous prediction towards these loosely populated regions is largely reflected in the final fraction of predictions (i.e. the ‘purity’ in these regions becomes very low). Again, cuts on the flags_qsoc allow us to recover about 90% of sources with in the range . Concentrating on the drop at , we note that only 69 sources have a Milliquas redshift in this range, while only 31 have (i.e. in the predictable QSOC redshift range). Amongst these 69 sources, 38 have while 4 have flags_qsoc but these are unfortunately erroneously predicted. These low numbers, along with the fact that QSOC predicts 2 154 sources in this redshift range (i.e. 0.5% of the total predictions) explains the drop at in the middle and bottom panels of Figures 16, even when flags_qsoc. Regarding the quasars, only 76 of them have redshifts in both Gaia and Milliquas, while only 10 have flags_qsoc = 0 and 9 of these also have . There are 18 959 sources with QSOC redshift predictions in this range, although only 101 (i.e. ) of them have flags_qsoc. This leads to a rather poor fraction of of the sources with and flags_qsoc = 0 in this redshift range.
In conclusion, we should insist first on the fact that QSOC is designed to process Type-I/core-dominated quasars with broad emission lines in the optical and accordingly yields only poor predictions on galaxies, type-II AGN, and BL Lacertae/blazar objects. Secondly, SMSgen does not provide covariance matrices on the integrated flux (Creevey et al., 2022), meaning that the computed from Equation 2 is systematically underestimated and is consequently not published in Gaia DR3. The computed redshift and associated confidence intervals, and from Equation 10, though appropriately re-scaled, might also sporadically suffer from this limitation.
6 Unresolved galaxy classifier (UGC)
6.1 Objectives
The Unresolved Galaxy Classifier (UGC) module estimates the redshift, , of the sources with mag that are classified as galaxies by DSC-Combmod with a probability of 0.25 or more (see Section 3 for details). UGC infers redshifts in the range by using a combination of three support vector machines (SVMs, Cortes & Vapnik, 1995), all taking as input the BP/RP spectra of the sources as sampled by SMSgen (Creevey et al., 2022, Section 2.3.2). The SVMs are trained on a set of BP/RP spectra of galaxies that are spectroscopically confirmed in the SDSS DR16 archive (Ahumada et al., 2020). UGC further applies filtering criteria for selecting redshifts to be published in Gaia DR3, as described in Section 6.2.
6.2 Method
UGC is based on the LIBSVM library of Chang & Lin (2011), from which three SVM models are built: (i) t-SVM, the total-redshift range SVM model, which computes the published redshift, redshift_ugc, and associated SVM prediction intervals, redshift_ugc_lower and redshift_ugc_upper, (ii) r-SVM, and (iii) c-SVM, which are respectively regression and classification SVM models applied to discretised versions of the redshift and used exclusively for the internal validation of the redshift produced by the t-SVM model. All SVM models use common training and test sets, which we describe below.
6.2.1 Training and test sets
The sources in the training and test sets were selected from the SDSS DR16 archive (Ahumada et al., 2020), which provide position, redshift, magnitudes in the -, -, -, -, -bands, photometric sizes (we used here the Petrosian radius), and interstellar extinction for each spectroscopically confirmed galaxy. There are 2 787 883 objects in SDSS DR16 that are spectroscopically classified as galaxies, but we rejected sources with poor or missing photometry, size, or redshift, thus reducing the number of galaxies to 2 714 637. Despite the known lack of uniformity of the SDSS DR16 redshift distribution due to the BOSS target selection141414https://www.sdss.org/dr16/algorithms/boss_target_selection/, this survey still provides the largest existing database of accurate spectroscopic redshifts of galaxies that can be used as target values in the SVM training and test sets.
The selected galaxies were cross-matched to the Gaia DR3 sources prior to their filtering by CU9 using a search radius of 0.54′′, which resulted in 1 189 812 cross-matched sources. Amongst these, 711 600 have BP/RP spectra, though not all of them are published in Gaia DR3. Because the inclusion of high-redshift galaxies would lead to a very unbalanced training set (i.e. very few high-redshift galaxies), we further imposed an upper limit on the SDSS DR16 redshift of , leaving 709 449 sources that constitute our base set.
For the preparation of the training set, a number of conditions were further imposed on the sources in the base set: (i) mag; (ii) BP/RP spectra must be composed of a minimum of six epochs of observations; (iii) the mean flux in the blue and red parts of the BP/RP spectra, as computed by UGC, must lie in the ranges e-s-1 and e-s-1, respectively, in order to exclude potentially poor-quality spectra; (iv) the image size, as characterised by the Petrosian radius, must be in the range in order to exclude suspiciously compact or significantly extended galaxies; (v) the interstellar extinction in the -band must be below the upper limit of mag to avoid highly reddened sources; and (vi) the redshift must be larger than in order to exclude nearby extended galaxies. After applying all these cuts, 377 875 sources remained, which we refer to as the clean set. Of these, 6 000 sources were randomly selected in order to construct the training set, the redshift distribution of which is given in Table 8. The imbalance of this training set is clearly visible in this table, and is caused by the small number of high-redshift galaxies present in the clean set.
| Redshift ranges | |||||||
| Data set name | – | – | – | – | – | – | Total |
| Base set | 224 264 | 292 968 | 118 248 | 65 912 | 7 055 | 1 002 | 709 449 |
| Clean set | 152 564 | 192 675 | 29 145 | 2 490 | 724 | 327 | 377 875 |
| Clean test seta | 150 964 | 191 025 | 28 045 | 1 590 | 224 | 27 | 371 875 |
| Training set | 1 600 | 1 600 | 1 100 | 900 | 500 | 300 | 6 000 |
| Base test seta | 222 664 | 291 368 | 117 148 | 65 012 | 6 555 | 702 | 703 449 |
| a The base test set and clean test set are respectively composed of sources in the base set and clean set that are not contained in the training set. | |||||||
| Area | Galactic coordinates range | Colour-colour box A | Colour-colour box B | |
|---|---|---|---|---|
| longitude [∘] | latitude [∘] | [mag] | [mag] | |
| CNT | ||||
| LMC | ||||
| SMC | ||||
The conditions described in the previous paragraph were not imposed for the test set. Instead, all 703 449 spectra in the base set that were not used for training were included in the base test set, whose redshift distribution is shown in Table 8. Additionally, a purest test sample, the clean test set, was derived from the clean set by removing the training data it contains.
6.2.2 Support vector machine models
The input of all SVM models are BP/RP spectra. The spectra are first truncated by removing the first 34 and the last 6 samples in BP, and the first 4 and the last 10 samples in RP, in order to avoid regions of low S/N. These cuts result in the definition of the usable wavelength ranges for the BP and the RP parts of the spectrum, namely 366–627 nm and 620–996 nm, respectively. Each pair of truncated spectra is then concatenated to form the SVM input vector of 186 fluxes.
A common setup was implemented for the SVM model preparation (see LIBSVM151515https://www.csie.ntu.edu.tw/ cjlin/libsvm for details): The Standardization Unbiased method was selected to scale the target data and the vector elements to the range ; the radial basis function (RBF) was chosen as the kernel function, and the tolerance of the termination criterion is set to ; shrinking heuristics are used to speed up the training process; a four-folded tuning (cross-validation) is applied to determine the optimal kernel parameter and the penalty parameter of the error term in the optimisation problem.
The UGC redshifts are estimated by t-SVM, which implements a -SVR regression model trained for redshifts in the range . The two other SVM models, c-SVM and r-SVM, use the BP/RP spectra as input but are trained to predict a discretised version of the redshifts and are used solely for the purpose of redshift validation (Section 6.2.3). The c-SVM model is a C-SVC classification model trained on six different classes corresponding to the redshift ranges , , , , and . The output of the c-SVM model is a class-probability vector. The element of the vector with the highest value above 0.5 is taken as the selected class. If there is no element with probability larger than 0.5, then the source is marked as unclassified. The r-SVM model implements the -SVR regression model of LIBSVM —similarly to the t-SVM model— but it is trained on six discrete target values . As only the first decimal is retained for the predictions, the output of the r-SVM model is directly comparable to the classes used by the c-SVM model.
6.2.3 Source filtering
Two sets of criteria are used to select the UGC outputs to be published in Gaia DR3. The first set applies to specific properties of the processed sources, while the second concerns the redshift validity. An output is included in Gaia DR3 only if all the criteria of the two sets are satisfied.
Although UGC processes all mag sources for which the DSC Combmod galaxy probability is higher than or equal to , additional criteria were imposed for selecting the purest sample of results. First, we require that the number of spectral transits in both BP and RP is higher than or equal to ten. Second, we require that the mean flux in the blue and red parts of the BP/RP spectra lies in the ranges set in Section 6.2.1. Third, we decided to only publish redshifts for sources with mag, so as to exclude bright and possibly extended sources, for which it is likely that only part of the galaxy has been recorded. Fourth, we require mag in order to reduce the number of sources with true (which lie outside the range of the training data) by as much as possible. The fifth and final condition is related to the location of blended sources that are erroneously classified as galaxies in high-density regions in the sky (see also Section 3.4). Indeed, the positional distribution of the sources processed by UGC shows a high concentration of galaxies in three small areas where extragalactic objects are not expected in large numbers: a region below the Galactic centre, and two areas centred on the Magellanic Clouds (see Table 9). Almost 9% of the total number of processed sources originate in these three areas. Sources in these areas also occupy a specific region of the colour–colour diagram that is distinct from the locus of the remaining sources. This distinction has been used to define colour cuts (shown in Table 9) which, in combination with the coordinates of the three areas, allowed us to clean the suspicious clumps of galaxies and to remove a large number of potentially misclassified sources in these three areas. Nonetheless, conditions listed in Table 9 are not applied if the DSC Combmod probability for the source to be a galaxy is equal to one.
The comparison of the redshifts produced by the t-SVM model to those of the r-SVM and c-SVM models allows us to internally validate the UGC redshifts. The implementation of the filtering involves first the rejection of sources for which at least one of the SVM models has not produced an output (either because there is no prediction or because the source is marked as unclassified). Second, the three computed redshifts are required to span at most two adjacent bins of redshift, similar to those defined for the c-SVM and r-SVM models. The largest absolute difference between the t-SVM redshift and the central value of the c-SVM and r-SVM redshift bins is . The redshifts of sources not satisfying one of these criteria are not published in Gaia DR3.
6.3 Performance
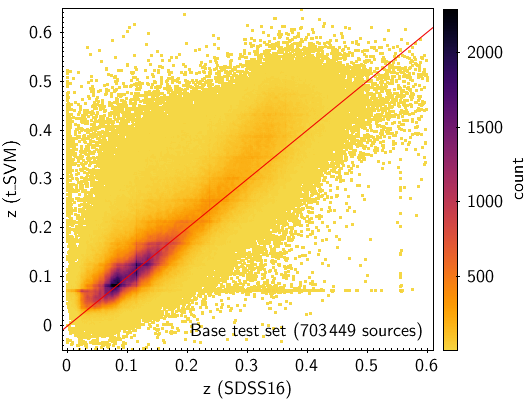
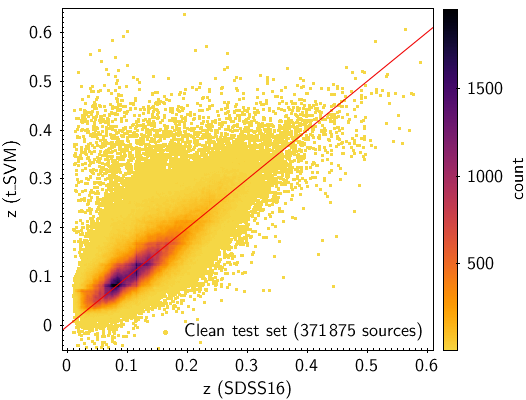
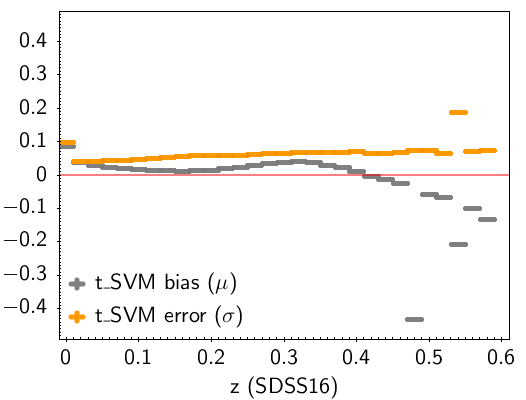
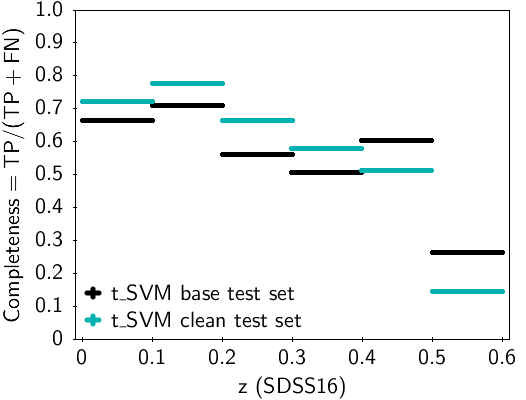
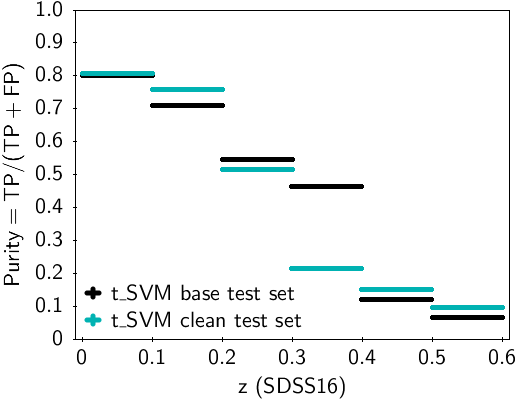
The overall performance of the t-SVM model is given by the mean () and the standard deviation () of the difference between the estimated and the real (target) redshifts. The internal test, applied to the training set itself, yields and . The external test, which is performed on all 703 449 spectra in the base test set, yields and (Figure 17, left panel). These values indicate that the performance is worse for the base test set, as expected. If the clean test set of 371 875 spectra is used the performance is improved significantly, with and (Figure 17, right panel).
The performance varies with redshift. To quantify this, the base test set was divided into SDSS redshift bins of size . The mean, , and the standard deviation, , of the differences between the redshift predicted by t-SVM and the real (SDSS) redshifts were determined for each one of these bins, as shown in Figure 18 (left panel). Generally, there are three regions with different performance. For the error and the bias are relatively large indicating that the t-SVM is ineffective for redshifts close to zero. The performance is good in the range of ; however, for larger redshifts, the bias changes significantly from almost zero to positive and then to negative values, while the error progressively increases. For both and show large scatter, probably due to the fact that large redshifts are under-represented in the t-SVM training set.
In addition, the performance of the t-SVM model as a function of redshift was investigated by constructing a confusion matrix, as in classification problems. To this effect, a different class has been assigned to each redshift bin, , both for the real (SDSS) and the predicted (t-SVM) redshifts. In this case, the bin size was . The confusion matrix presents the total number of cases for each real and each predicted class (see for details the online documentation).
For a given redshift bin, , the numbers of true-positive , false-negative , and false-positive predictions are used to evaluate the sensitivity, or completeness, and the precision, or purity, . Figure 18 (middle and right panels) show the t-SVM completeness and purity for the redshift bins of the base and clean test sets in bins of redshift. Both completeness and purity for the base and clean test sets are very good up to a redshift of . The purity is moderate ( 0.5) for the two test sets for the redshift bin 0.2–0.3 and fails at larger redshifts. The completeness is moderate in the 0.3–0.5 bin and fails for the last bin. Generally, good performance can be expected for redshifts .
6.4 Results
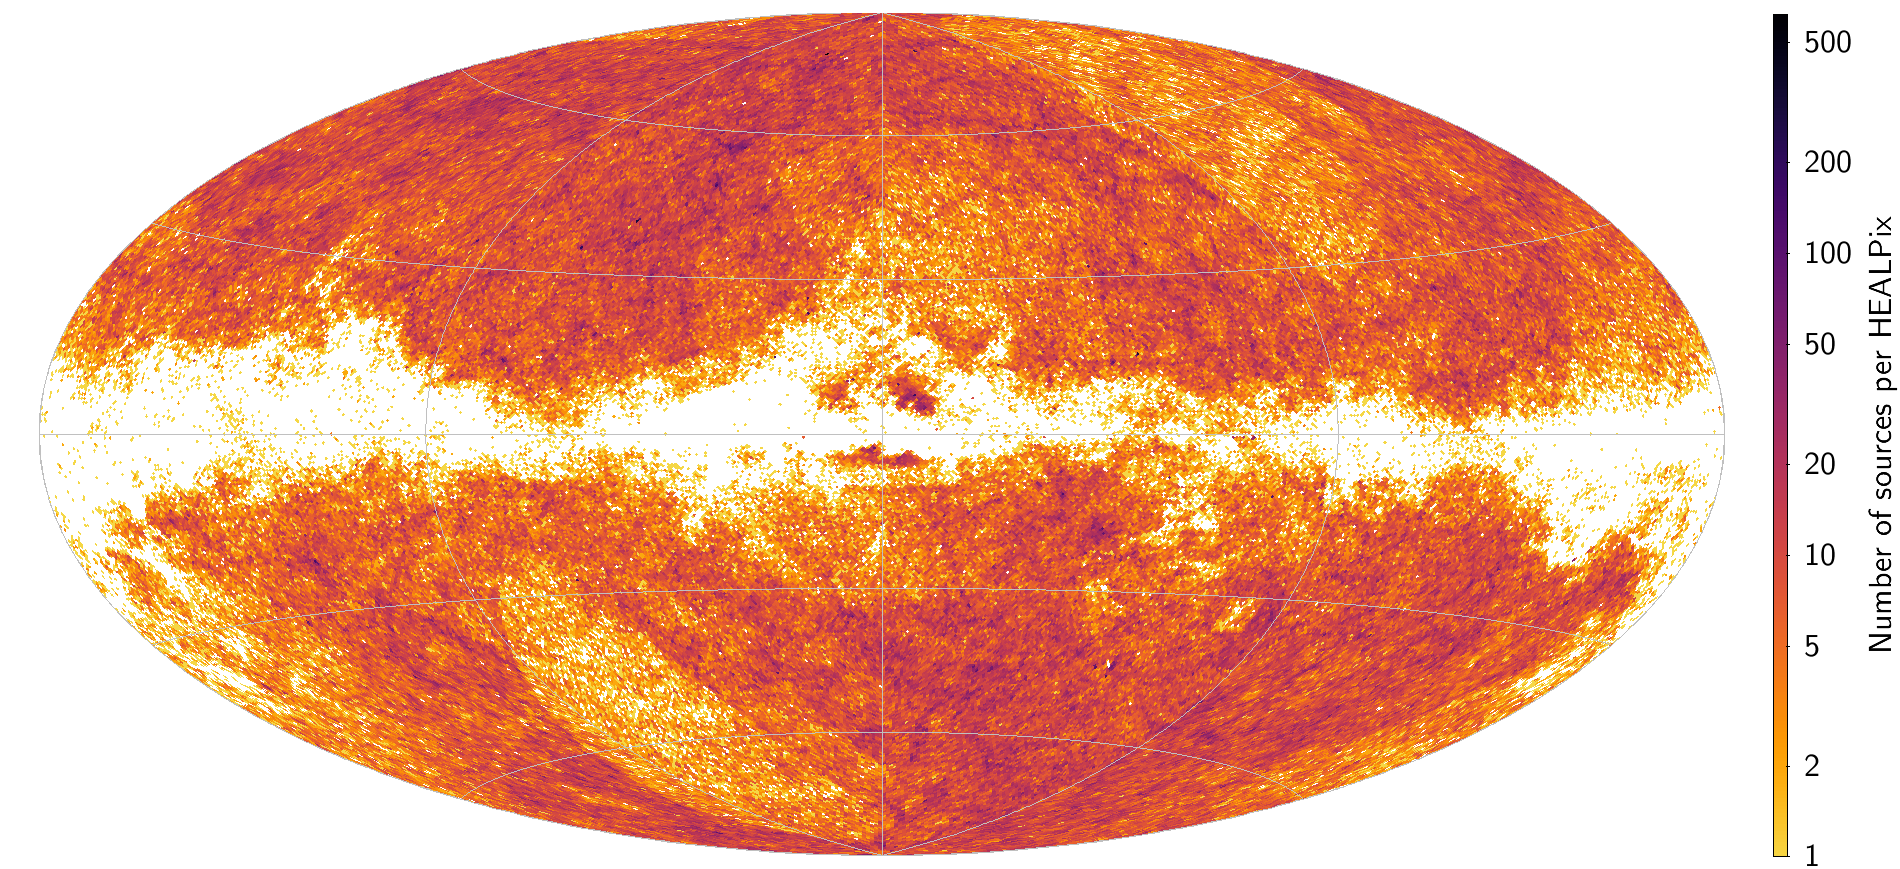
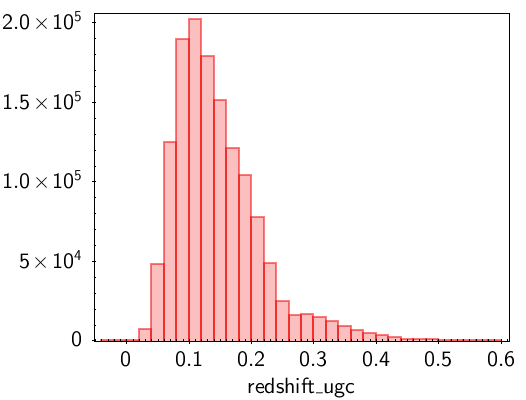
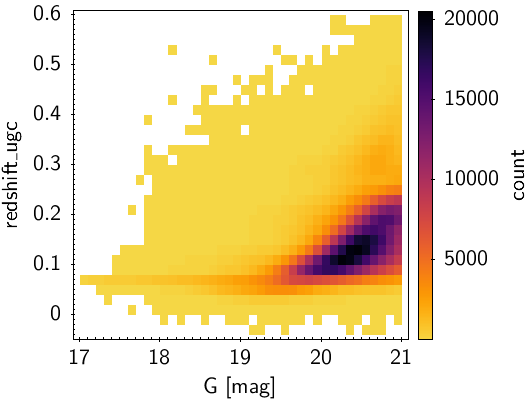
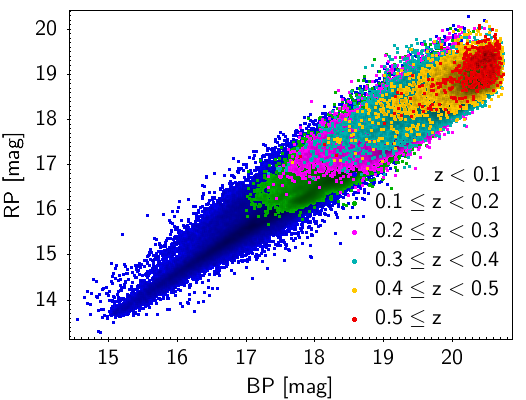
The UGC output is included in the galaxy_candidates table. There are 1 367 153 sources for which UGC provides a redshift value as estimated by t-SVM (Section 6.2.2), redshift_ugc, along with the corresponding lower and upper limits of the SVM prediction interval, redshift_ugc_lower and redshift_ugc_upper, respectively. The parameter redshift_ugc_lower is defined as redshift_ugc, where corresponds to the th redshift range identified in the previous section, and and are the associated bias and standard deviation computed on the base test set. Similarly, the parameter redshift_ugc_upper is defined as redshift_ugc. The value of redshift_ugc_upperredshift_ugc_lower can therefore be used as an estimate of the 1- uncertainty on redshift_ugc.
Apart from the Galactic plane, the sources with UGC redshifts are almost uniformly distributed on the sky, as seen in Figure 19, although there are two strips (lower-left and upper-right) of relatively lower density displaying residual patterns. These are regions that have been observed fewer times by Gaia and thus many of the sources in them do not appear in the UGC output because of the filters applied on the number of transits (see Figure 5).
The distribution of the estimated redshift_ugc values shown in the left panel of Figure 20 has a maximum at 0.1, while almost 91% of the redshifts are within . About 7% of the sources have redshifts larger than 0.25. The lowest and the highest redshifts reported are and , respectively. There are 33 sources with negative redshifts, although most of these values are very close to zero (with median value of -0.0054).
The dependence of the redshift_ugc values on magnitude is shown in the middle panel of Figure 20. As expected, sources with higher redshift are fainter (e.g. sources are mostly found at mag, while sources are found at mag). The dependence of the estimated redshift on the source magnitude is also evident in the BP/RP magnitude–magnitude diagram shown in the right panel of Figure 20, where different redshift ranges are represented with different colours.
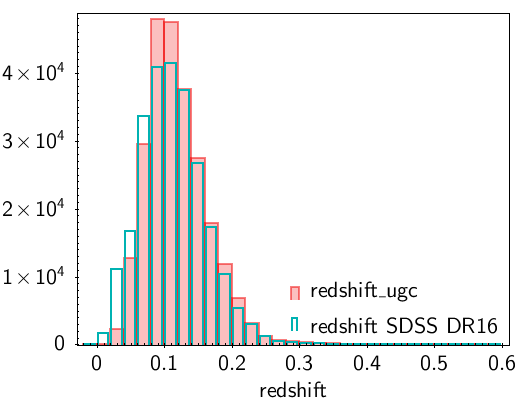
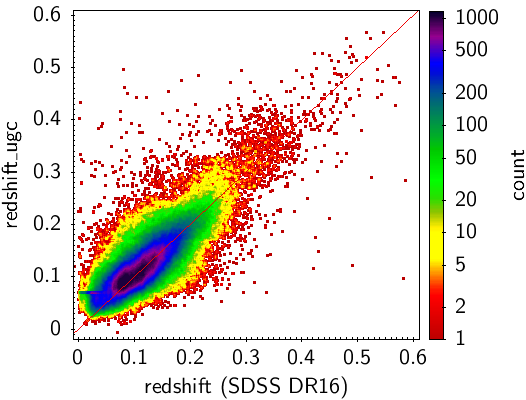
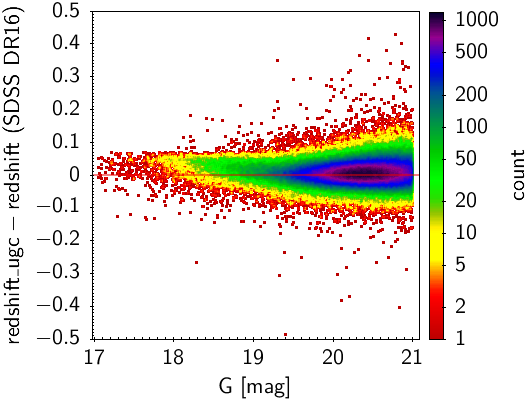
There are 248 356 sources with published redshift_ugc in common with those spectroscopically classified as ’GALAXY’ or ’QSO’ in the SDSS DR16 (using a radius of ′′, as before). The differences between the redshift_ugc and the SDSS redshifts have a mean and standard deviation of and , respectively. If the 67 sources with SDSS redshifts greater than 0.6 are excluded, the standard deviation is reduced to . Figure 21 (left panel) compares the distributions of the two redshift estimates. There is a clear excess in the number of sources with UGC redshifts around 0.1 compared to the SDSS redshifts. At the same time, there is a deficit in the lower redshift bins for UGC. The observed differences are probably due to an overestimation by UGC of lower SDSS redshifts. These effects are better demonstrated in Figure 21 (middle panel). Most of the sources follow the unit line, albeit with significant scatter. However, there is a small bias which tends to be positive for .
We also see in Figure 21 (middle panel) a short dense horizontal feature of sources with redshift_ugc around 0.07, while the corresponding SDSS redshifts span a range of values from 0 to 0.07. We see that the majority of these problematic values occur at redshift_ugc, with 5178 sources with redshift values in the range 0.070822–0.070823. Detailed analysis (see the online documentation) indicates that this peak contains a relatively large fraction of very bright sources (with , and mag), suggesting that the SVM models, which are not trained at all for bright, nearby galaxies, tend to make constant redshift predictions for such objects.
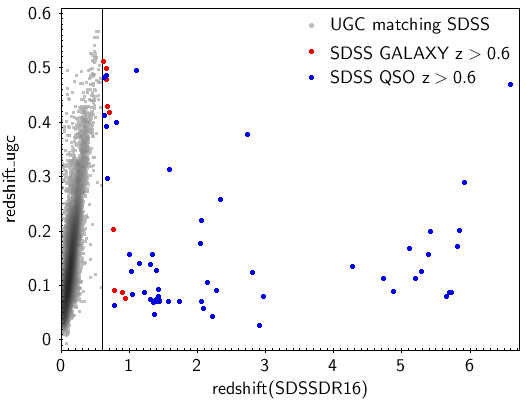
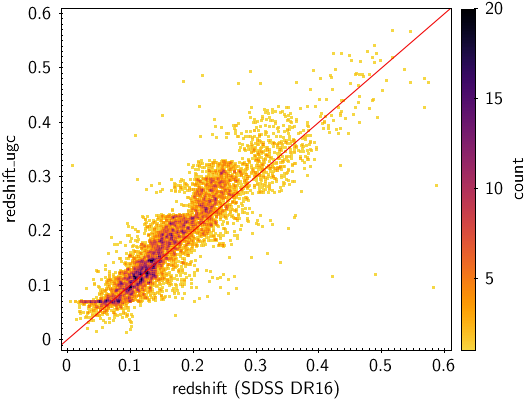
Figure 21 (right panel) shows the difference between redshift_ugc and the actual SDSS redshift, as a function of magnitude. As expected, the performance of the UGC redshift estimator is poorer for fainter sources as indicated by the larger dispersion seen at faint magnitudes. The positive bias of the very bright and nearby galaxies is also clearly seen.
6.5 Use of UGC results
UGC selects sources that have a DSC probability of being a galaxy of classprob_dsc_combmod_galaxy . This is a relatively low threshold, and so the final UGC galaxy catalogue is expected to include some misclassified quasars. Indeed, 5170 sources, or of the sources in common with the SDSS DR16, have a SDSS spectroscopic class ‘QSO’ while 58 of them also have SDSS redshifts , i.e. higher than the UGC limit. There are also 9 high-redshift sources spectroscopically classified as ‘GALAXY’ by the SDSS. Figure 22 shows a comparison between redshift_ugc and SDSS redshifts for high-redshift sources. As expected, the UGC predictions are unreliable for these sources. However, as seen in Figure 23, the agreement between redshift_ugc and SDSS redshifts of QSOs with redshifts below 0.6 is good, despite the fact that the SVM was not trained for quasars.
The UGC performance varies with redshift. As a consequence, redshifts larger than and lower than are less reliable. A suspiciously large peak of sources also appears in the redshift bin redshift_ugc, where about sources are found. It is estimated that most of the sources in this peak are some of the brightest in the UGC output and have SDSS redshifts below 0.04. About 40% of these can be discarded by applying the previously mentioned cuts to sources with redshift_ugc: , and mag (see the online documentation for details).
7 Total Galactic extinction (TGE) map
7.1 Objectives
To support extragalactic studies, it was decided to use the extinction determinations obtained for single stars based on their astrometry and spectrophotometry (Andrae et al., 2022) to estimate the total extinction from the Milky Way as a function of sky position, that is, the full cumulative foreground extinction by the Milky Way on distant extragalactic sources. Taking advantage of the HEALPix encoded in the source_id, a series of HEALPix maps of the total Galactic extinction are provided using a selected subset of sources in each HEALPix, which are referred to as extinction tracers.
All-sky HEALPix maps of the total Galactic extinction are delivered in two tables at various resolutions (i.e. HEALPix levels). These are the tables total_galactic_extinction_map and total_galactic_extinction_map_opt, described below. The first of these tables contains HEALPix maps at levels 6 through 9 (corresponding to pixel sizes of 0.839 to 0.013 2), with extinction estimates for all HEALPixes that have at least three extinction tracers, while the second map is a reduced version of this first map where a subset of the pixels is used to construct a map at variable resolution, using the smallest HEALPix available with at least ten tracers for HEALPix levels 7 through 9.
This extinction map is the first of its kind, as reported values are based on sources beyond the interstellar medium (ISM) in the disc of the Milky Way. This differs from previous 2D extinction maps where it is not clear to what distance the extinction is integrated to, while for extant 3D maps, not every line of sight contains tracers beyond the ISM layer of the Galactic disc. As such, it is well suited for extra-galactic studies and comparisons with line-of-sight-integrated observations such as dust emission or diffuse gamma-ray emission.
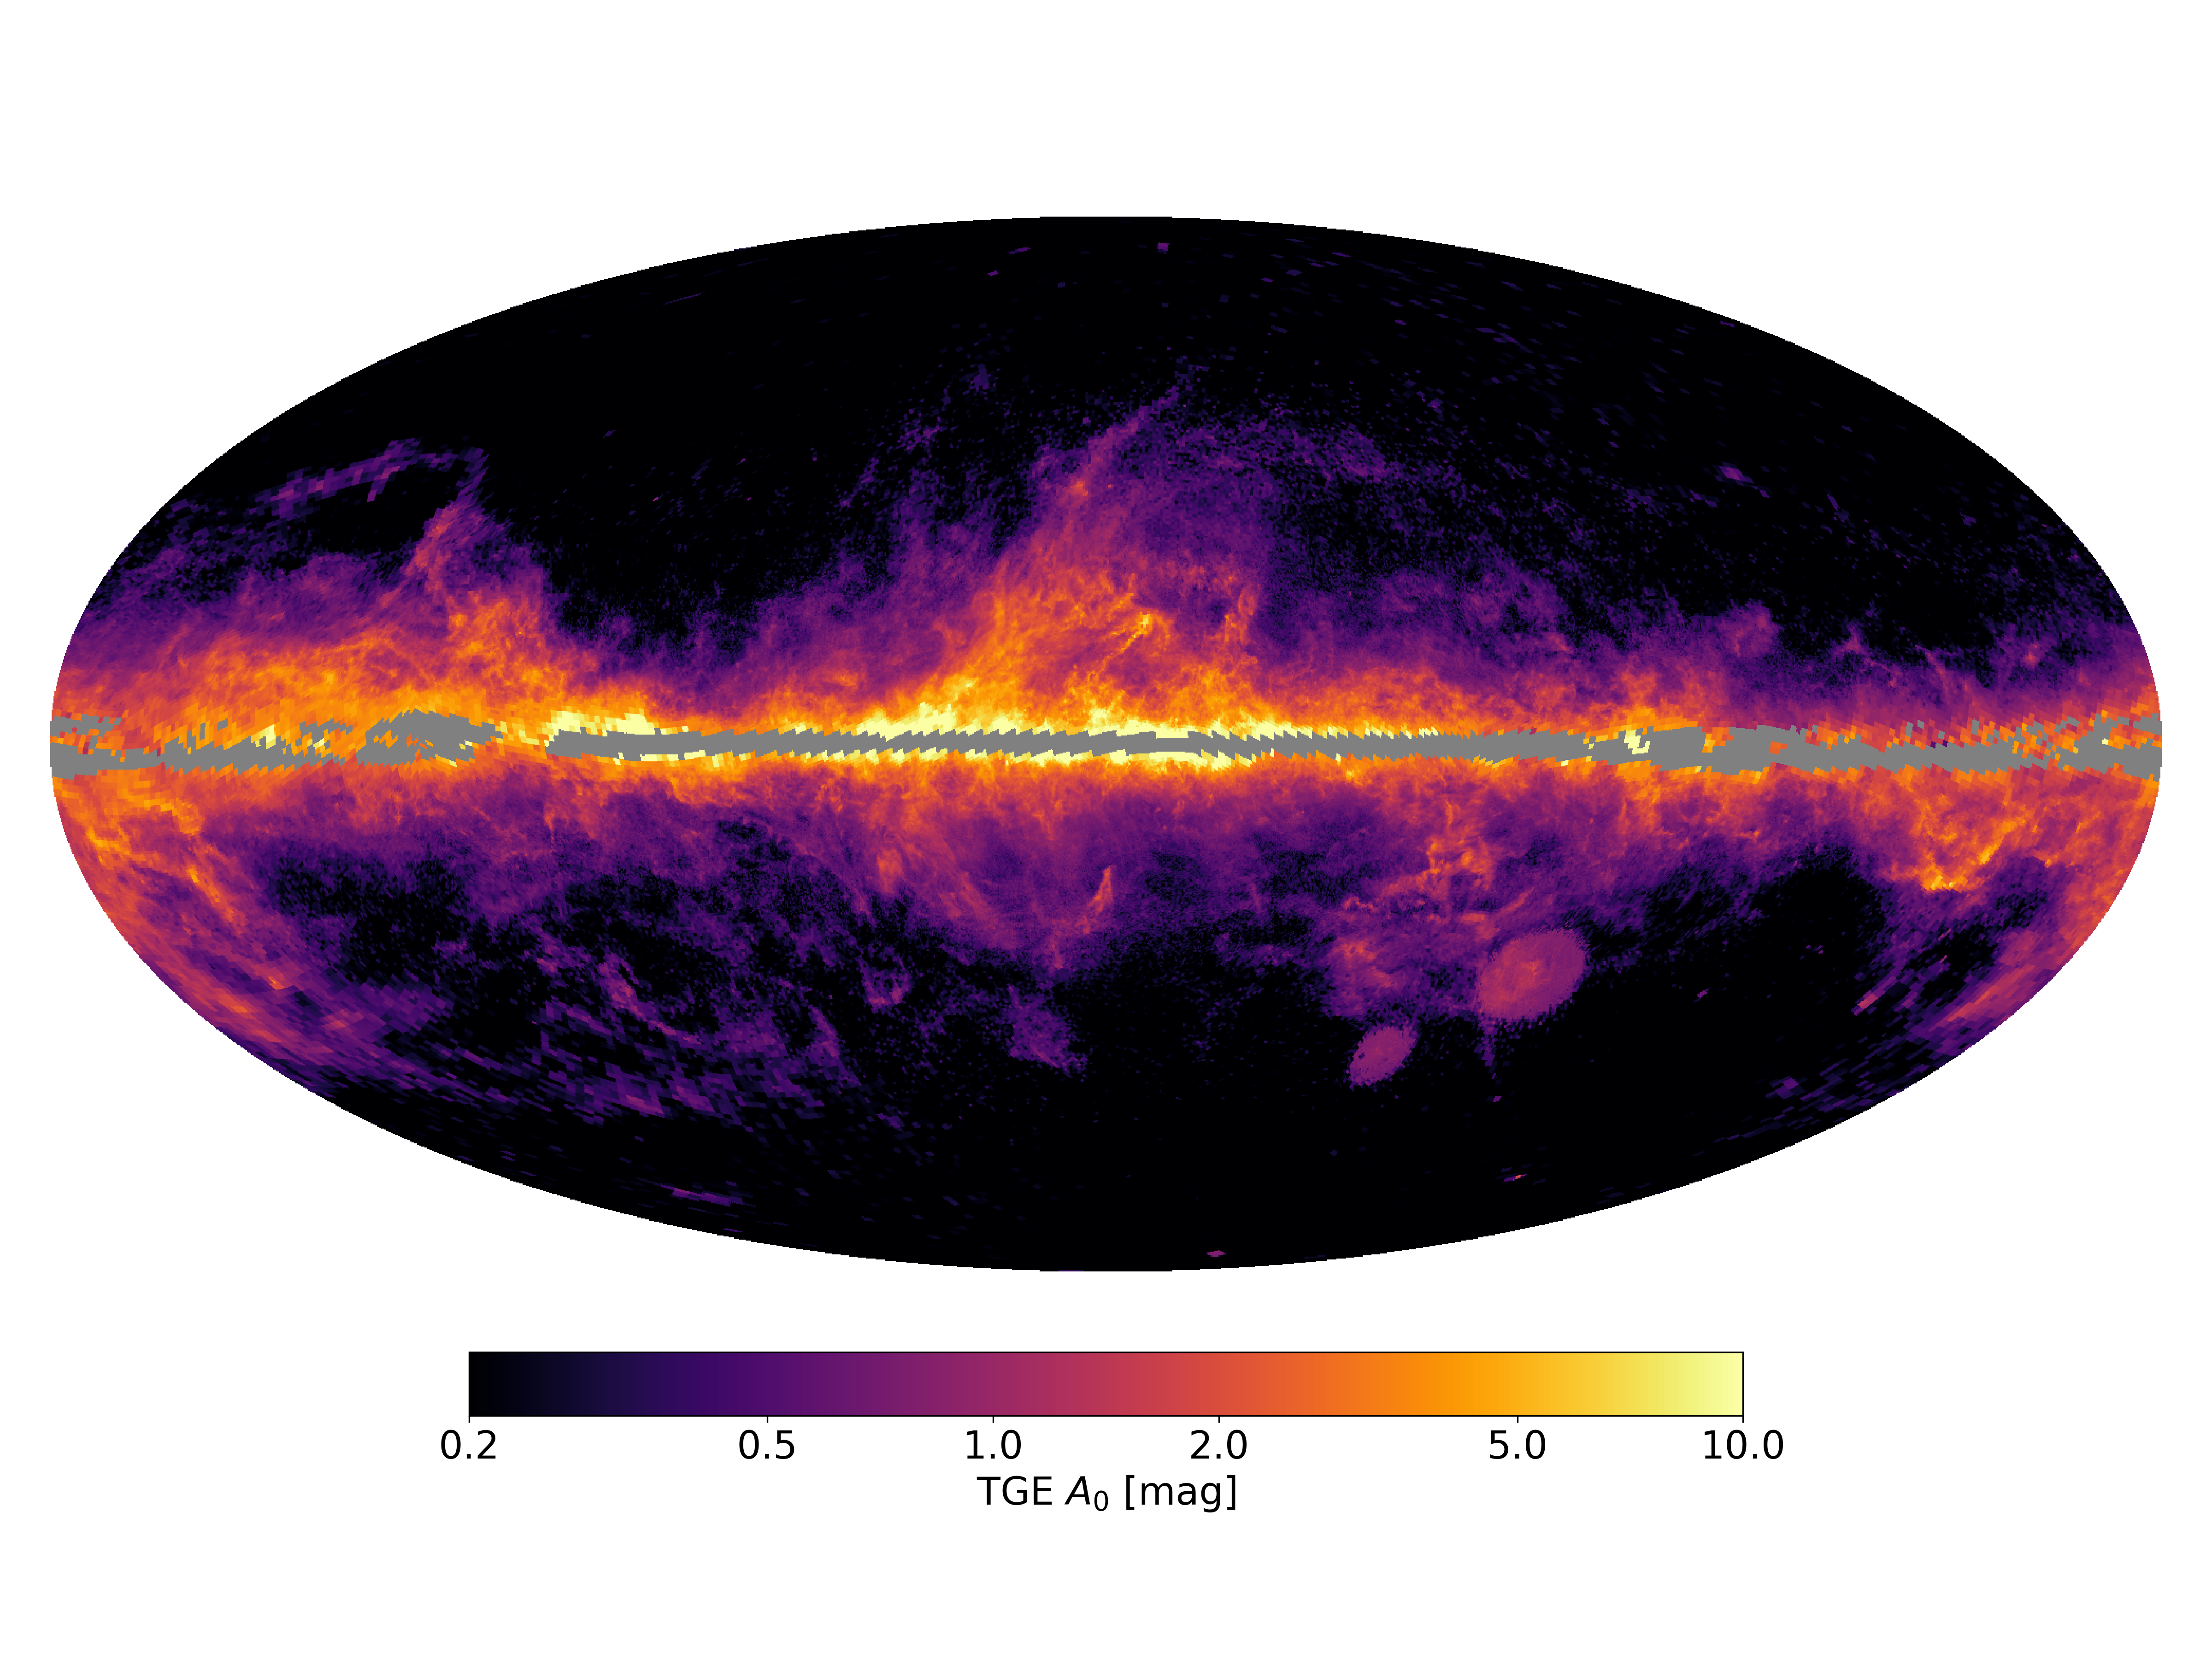
7.2 Method
To estimate the extinction in each HEALPix, sources that are classified as stars by DSC (i.e. sources with classprob_dsc_combmod_star ; see Section 3) and with stellar parameters consistent with being giants (as provided by the set of GSP-Phot APs from the ‘best’ library from Andrae et al. (2022) and provided in the main gaia_source table) are used as extinction tracers. Giant stars are used as they are intrinsically bright and numerous outside the ISM layer of the Galactic disc. The selection of these tracers is done based on GSP-Phot effective temperatures (teff_gspphot) K, and absolute magnitudes (mg_gspphot) . Given these criteria, the extinction parameters from the GSP-Phot best library come from those based on either the MARCS or Phoenix spectral libraries. From an analysis of extinction estimates from two different libraries, no significant systematic trends are found when comparing the extinctions from the two libraries on a per HEALPix basis (Fouesneau et al., 2022).
In addition, extinction tracers are required to be at least 300 pc above or below the Galactic plane (), or with a Galactocentric radius of kpc. To establish these criteria, the distance to the source provided by GSP-Phot (distance_gspphot) is used.
Once the extinction tracers for a given HEALPix are selected, if three or more tracers are available, the median of the tracers161616 is the extinction parameter from the adopted Fitzpatrick extinction law (Fitzpatrick, 1999), defined as the monochromatic extinction at 541.4nm. See the online documentation for details. —as given by the GSP-Phot parameter azero_gspphot— is taken as the estimate of the total Galactic extinction (a0) for the HEALPix, while the uncertainty of the total Galactic extinction (a0_uncertainty) is taken as the standard error of the sample mean of of the tracers. This latter is a choice of convenience, as the small number of tracers in most of the HEALPixes prevents a meaningful estimate of quantiles. Both the median and uncertainty are estimated after a 3- cut about the median of the unclipped sample in order to remove outliers; this was done principally to remove outliers that were otherwise strongly impacting our estimate of the uncertainty. HEALPixes with fewer than three tracers have no extinction value assigned to them. A diagnostic flag status is provided which is set to zero if the number of tracers is three or greater, while a non-zero value gives an indication as to why an insufficient number of tracers were found.
The uncertainty of the TGE extinction is generally much smaller than the dispersion of the individual extinction measures of the tracers in the HEALPix, which can be dominated by intrinsic variation of extinction in the field defined by the HEALPix, especially at lower Galactic latitudes with significant extinction. To recover the standard deviation of the distribution of measures of the tracers in a HEALPix, one should multiply the given uncertainty by the square root of the number of tracers used (num_tracers_used). The full range of extinction measures of the tracers (a0_min, a0_max) is also provided.
The first table, total_galactic_extinction_map, contains HEALPix maps at four different HEALPix levels, from level 6 (49 152 HEALPixes with an area of 0.84 2) to level 9 (3 145 728 HEALPixes with an area of 0.013 2), with the HEALPix level indicated with the parameter healpix_level. This range of HEALPix levels ensures that a minimum number of tracers per HEALPix will be found at high Galactic latitudes, where the sky density of tracers is low, while allowing a higher resolution in areas of the sky where the density of tracers is high. (At level 9 only 1% of the sky has more than 40 tracers per HEALPix.)
For any given direction we determine the optimum HEALPix level, that is, the set of the smallest HEALPixes with at least ten tracers to ensure a reliable estimate of the extinction and its uncertainties. However, as the base resolution is HEALPix level 6, all HEALPixes with fewer than ten tracers at this level are tagged as ‘optimum’. As in the level 6 map, the optimum map has full sky coverage at (i.e. all HEALPixes at have at least three tracers, so an value is reported for each of them). In the HEALPix scheme, each HEALPix at level contains four sub-HEALPixes at level , meaning that each of the four sub-HEALPixes must have at least ten tracers to allow all four to be tagged as optimum. This algorithm is repeated iteratively over each level, starting at the base level 6, until the lack of tracers in a sub-HEALPix prevents further subdivision, or until level 9 is reached. In the table total_galactic_extinction_map, the optimum HEALPixes are flagged as such with the boolean flag optimum_hpx_flag. This algorithm ensures that the subset of optimum HEALPixes do not overlap with one another, yet cover the entire sky.
The second table, total_galactic_extinction_map_opt, is a single optimum HEALPix map at level 9 provided for convenience, where each HEALPix adopts the extinction value of the optimum HEALPix total_galactic_extinction_map coincident with or containing the HEALPix. That is, if a HEALPix at level 6 is tagged as optimum in total_galactic_extinction_map, then all 64 of its level-9 sub-HEALPixes in the total_galactic_extinction_map_opt map will be assigned the a0 value of the level 6 HEALPix. The parameter optimum_hpx_level in this table indicates, for each HEALPix, the HEALPix level of the optimum HEALPix from which its a0 value is based.
7.3 Performance
At the base level 6, only 2.8% of the sky (1379 out of 49152 HEALPixes) close to the Galactic plane (with ) has no a0 values because of an insufficient number of tracers. The fraction of HEALPixes with an insufficient number of tracers increases at the higher HEALPix levels as the HEALPixes become smaller: 5.2% at level 7, 30.4% at level 8, and 66.3% at level 9. The average number of tracers for the HEALPixes with estimates is 268.3 at level 6, but only 10.7 at level 9, while the average number of tracers for the optimum HEALPix map is 30.3. The optimum HEALPix map, total_galactic_extinction_map_opt, shown in Figure 24, has the same sky coverage as the level 6 map, but is of higher resolution when a sufficient number of tracers are available. To better demonstrate this, we show a zoom into the Rho Ophiuchi region in Figure 25. Over the whole sky, only about 1% of the HEALPixes at level 9 have more than 40 tracers, and thus the potential to be mapped at higher resolution. Figures showing the individual all-sky maps at levels 6 through 9 can be found in the online documentation, along with maps of the a0_uncertainty. We note that the a0_uncertainty is smallest in HEALPix level 6 with a mean value of 0.03 mag; this is due to the larger number of tracers contained in the HEALPixes at this level, whereas the mean a0_uncertainty of the HEALPixes in total_galactic_extinction_map tagged as optimum (optimum_hpx_flag ) is of 0.06 mag, as they cover various HEALPix levels.
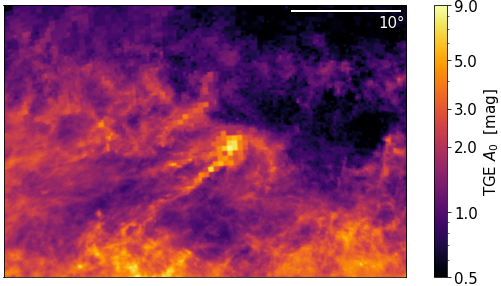
In Fig. 26, the TGE estimate at the optimum HEALPix level 9 is plotted against the dust optical depth expressed as from Planck Collaboration et al. (2016b)171717The Planck collaboration reports that we convert to via and . See the Planck Legacy Archive (http://pla.esac.esa.int) for details., once re-binned at the same HEALPix level. We see good agreement, as a linear fit using the median points with results in a slope of , albeit with an offset of 0.09 . It should be noted that the ratio of for giants (stars with effective temperature K) is (see the online documentation), meaning that the slope of TGE (converted to ) over Planck() is . Also worth bearing in mind is that there are a number of Planck maps of the dust distribution available on the Planck Legacy Archive; for example, using the map described in Planck Collaboration et al. (2016a) we find a slope of 0.90 and an offset of 0.05.
Performing a linear fit in the same extinction range between TGE and Schlegel et al. (1998) results in a slope of (offset: 0.10, in agreement with the obtained using Planck. However, the same linear fit performed between TGE and the Bayestar’s map (Green et al., 2019) results in a slope of (offset: 0.01), suggesting that the Bayestar map is systematically underestimating the extinction with respect to other extinction maps; see discussion in Andrae et al. (2022).
Towards the limit where the extinction measured by Planck tends to zero, the TGE tends to a non-zero value. This offset is found empirically by fitting a third-order polynomial to the median points for and obtaining the TGE value at Planck . The resulting offset is mag and starts to become evident at mag. The existence of this offset is likely due to the fact that the GSP-Phot extinction prior forces its extinction estimate to be non-negative, which creates a statistical bias at very low extinction values. Indeed, this offset is of the order expected if the true uncertainty of the estimates per source were 0.1 magnitude. See Andrae et al. (2022) for further discussion.
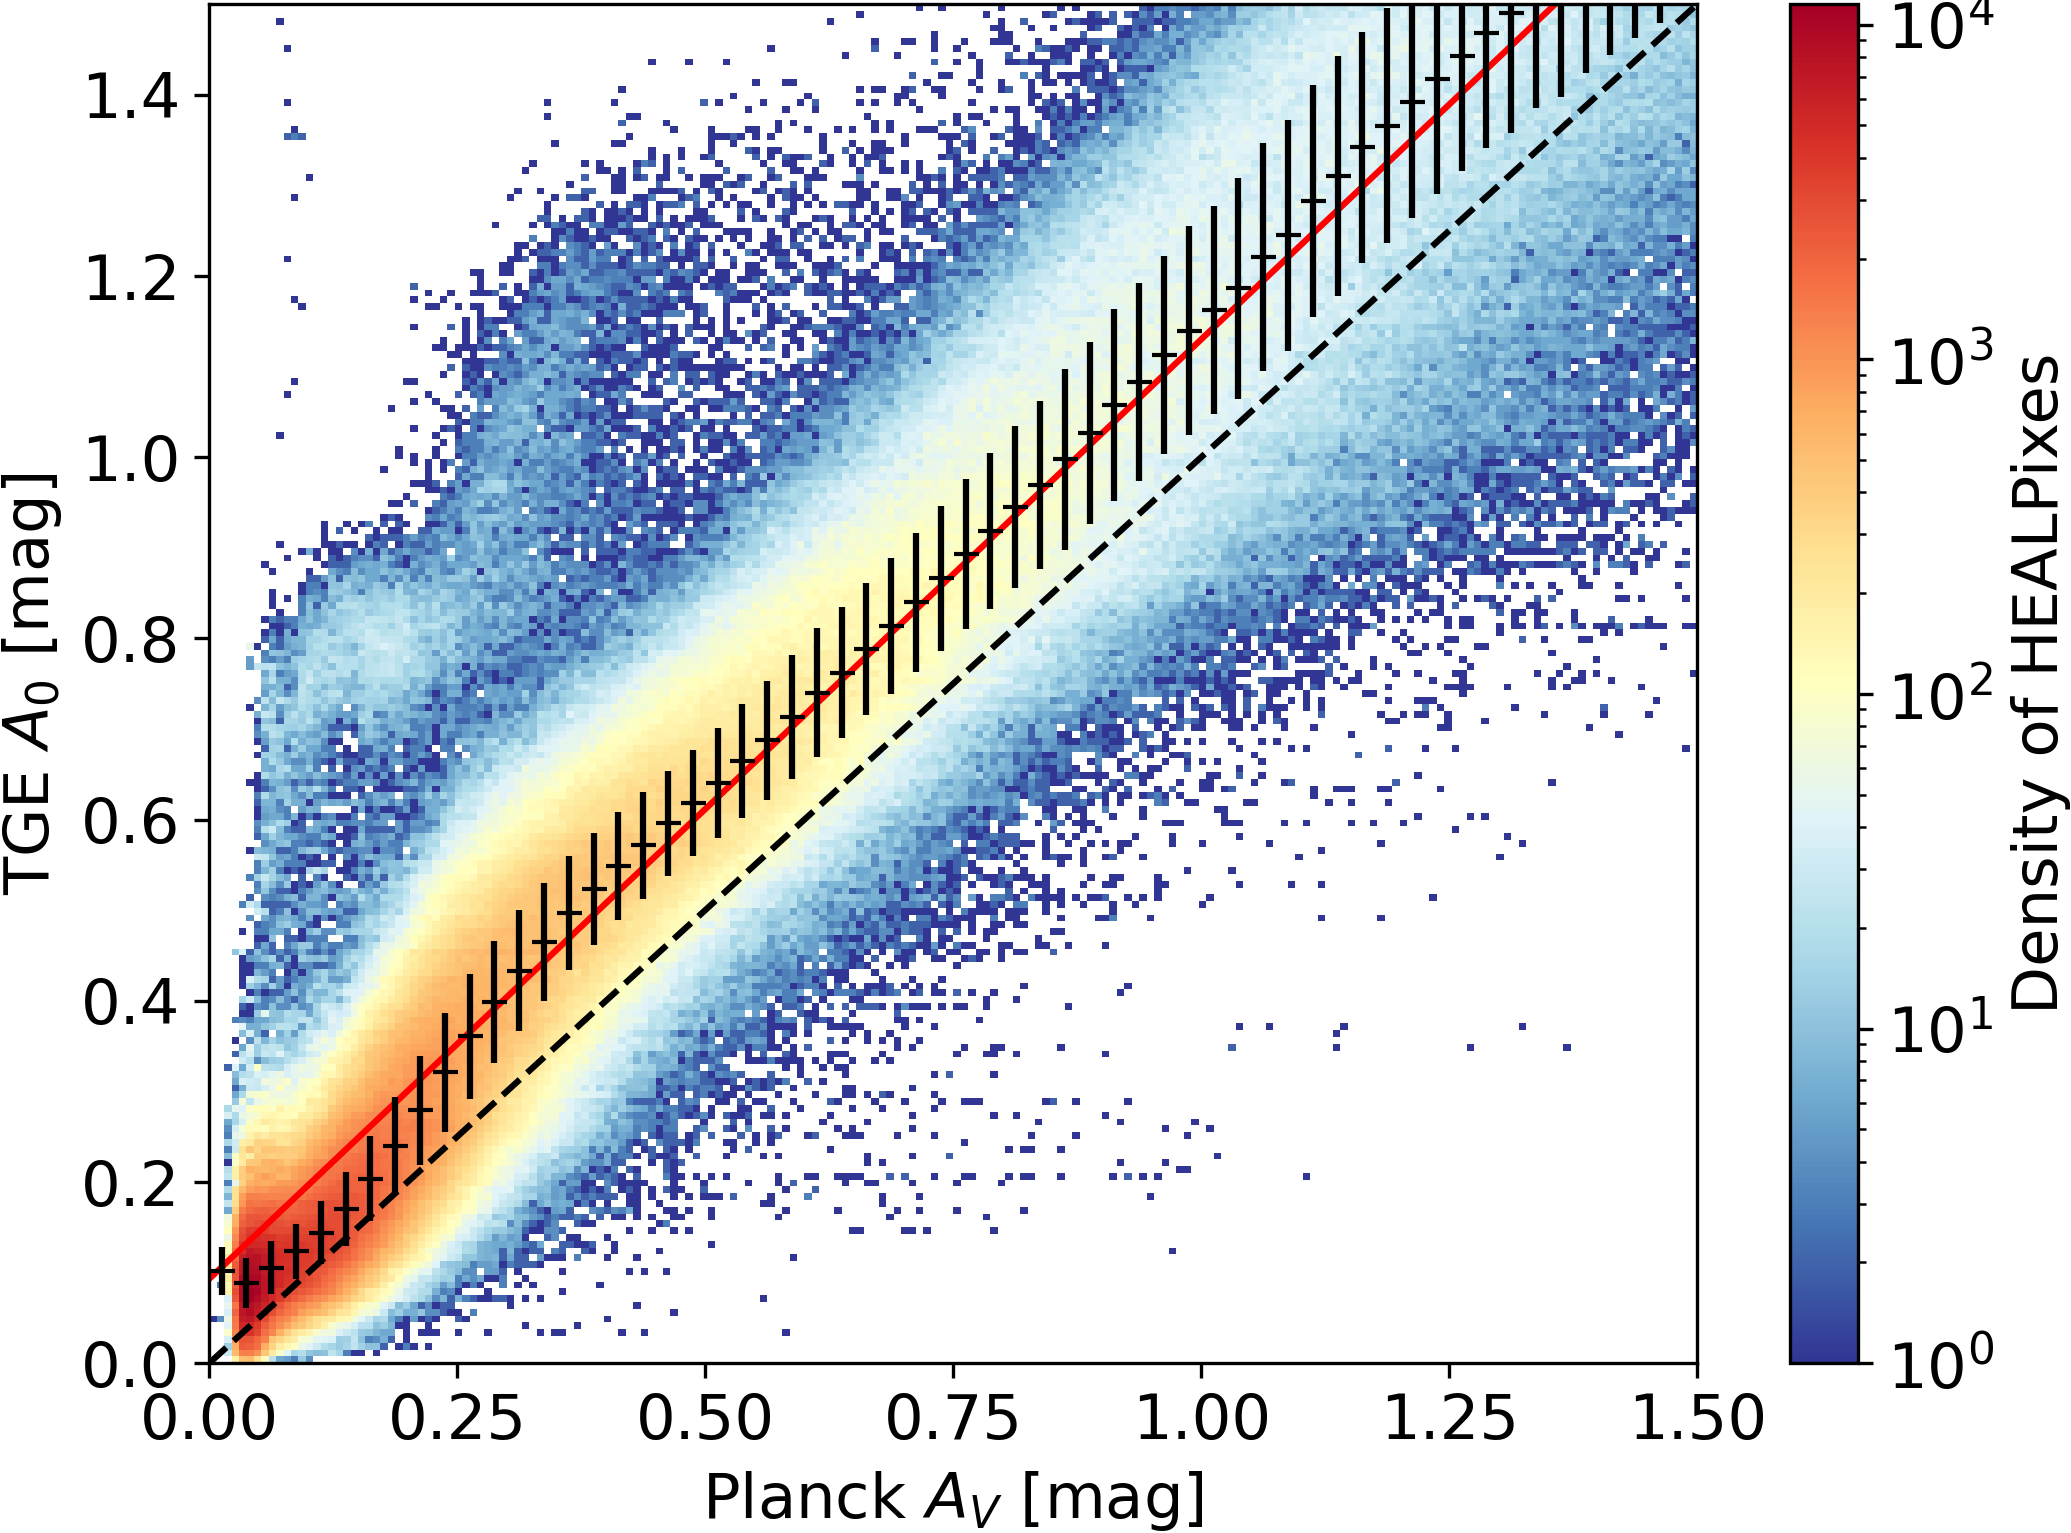
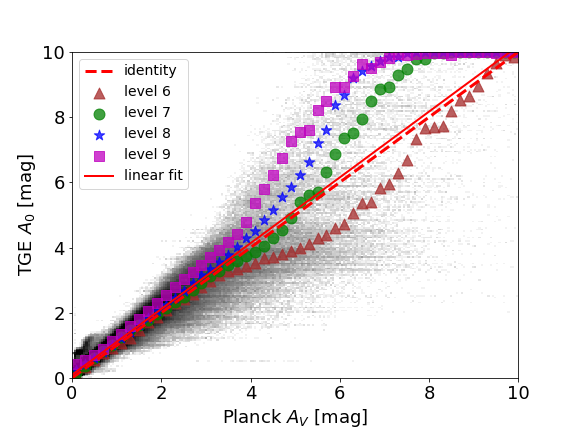
Comparing TGE to Planck over a larger interval highlights a possible bias at extinctions mag. In Fig.27, TGE is plotted versus Planck over an interval of ten magnitudes. A large dispersion in is observed for the optimal map for mag, and it can be seen that the different HEALPix levels do not behave in the same way. The coarser resolutions (levels 6 and 7) initially predict less extinction than Planck (for mag) whereas the finer resolutions either agree or predict higher extinction. Above an of 5 mag, only level 6 predicts less extinction than Planck, while the others predict more. Even for mag, where TGE and Planck are in very good agreement, a difference can be seen where the lower resolutions predict lower extinction. This is likely due to a selection effect where in a given HEALPix with variable extinction, more stars will be observed where the extinction is smaller. This will bias the extinction estimate for the HEALPix to lower values, and will be more obvious for larger HEALPixes.
Finally in Fig. 28 the residual map of TGE minus Planck is shown. TGE underestimates extinction with respect to Planck toward molecular clouds, where dust emission remains optically thin but where TGE estimates may be biased toward smaller values as unresolved areas with below average extinction are oversampled, as mentioned above; see further discussion regarding high-extinction regions in the following section. Meanwhile, within about 30∘towards the Galactic centre, TGE shows more extinction than Planck, apart from the foreground molecular complexes we just mentioned.
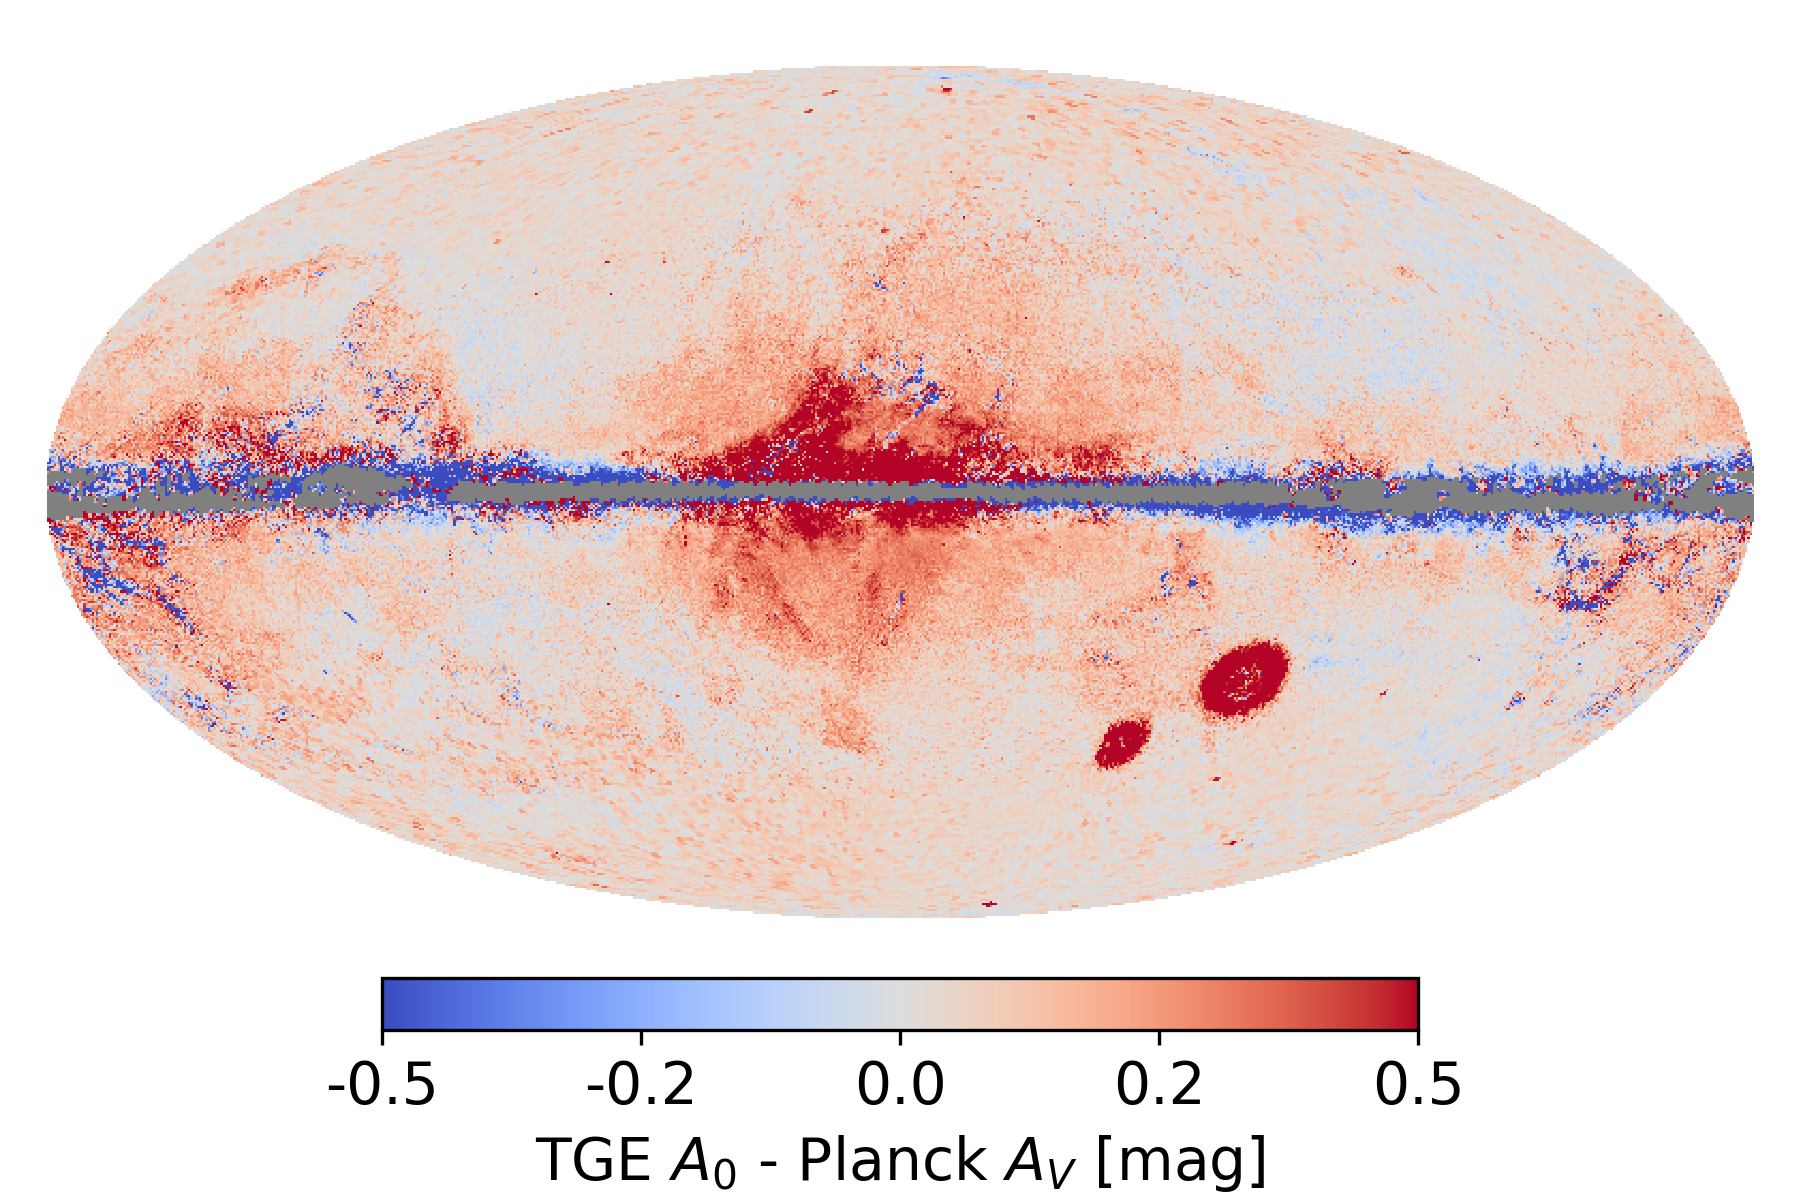
7.4 Use of TGE results
The TGE extinction maps estimate the total Galactic extinction from the Milky Way ISM toward extragalactic sources, where is the monochromatic extinction at 541.4nm. As mentioned above, is approximately equal to 0.98 for cool stars at mag. However, in general, the effective extinction in a passband depends on the SED of the source; see the online documentation for a discussion on how to derive the extinction from for any passband.
As the selected extinction tracers were required to be beyond a certain minimum distance to ensure that they were outside the ISM layer of the Milky Way’s disc, sources in nearby galaxies may also be selected as tracers. This means that the extinction towards the LMC and SMC will be a combination of Galactic extinction, inter-galactic extinction, and extinction in the Magellanic clouds (although the latter will be the dominant contribution). Another factor that will influence the amount of reported extinction in these directions stems from the distance prior used in GSP-Phot, which assumes that the sources are Galactic. As such, the extinction will be overestimated. An evaluation of this overestimation can be obtained via a comparison with an external data set. Indeed, in Fig. 26, there is a cloud of points with a locus stretching from around =0.2, =0.8 to =0.4, =1.2 that consists entirely of lines of sight towards the Magellanic clouds. Comparing the median TGE (1.0 mag) to the median Planck (0.4 mag) towards the LMC reveals a difference of 0.6 mag. These values are both higher than the extinction found using near-infrared observations ( = 0.3 mag; Imara & Blitz, 2007) and in the visible ( = 0.24 mag; Wagner-Kaiser & Sarajedini, 2013). This difference is likely not only due to the GSP-Phot distance prior, but also to variations in dust properties in the LMC/SMC. Although the absolute level of extinction in these Galactic satellites needs to be interpreted with caution, the relative variations evidencing structured patterns are most certainly real (see Fig. 29).
Because extinction tracers are required to be outside the dust layer of the Milky Way, they must be at greater distances at lower Galactic latitudes. This, together with the effect of increasing extinction and Gaia’s magnitude limit, means that at very low latitudes it is not possible to find a sufficient number of tracers outside the ISM layer of the Milky Way with which to make a reliable estimate of the total Galactic extinction. This explains the band of HEALPixes at with no extinction values. Indeed we recommend that the map should not be used for latitudes . Also, GSP-Phot sets an upper limit of ten magnitudes on its estimate of per source, and so any HEALPixes with an extinction near this value should be interpreted as a lower bound. However, as suggested by figure 27, our maps may instead be over-estimating extinction toward these lines of sight with respect to Planck, though we point out that HEALPixes with mag are at low Galactic latitude and make up only 2% of the sky. Furthermore, Planck estimates towards the Galactic plane may be underestimated as a consequence of assuming a single mean dust temperature for the whole line of sight. Further details of the TGE data products are documented in the online documentation.
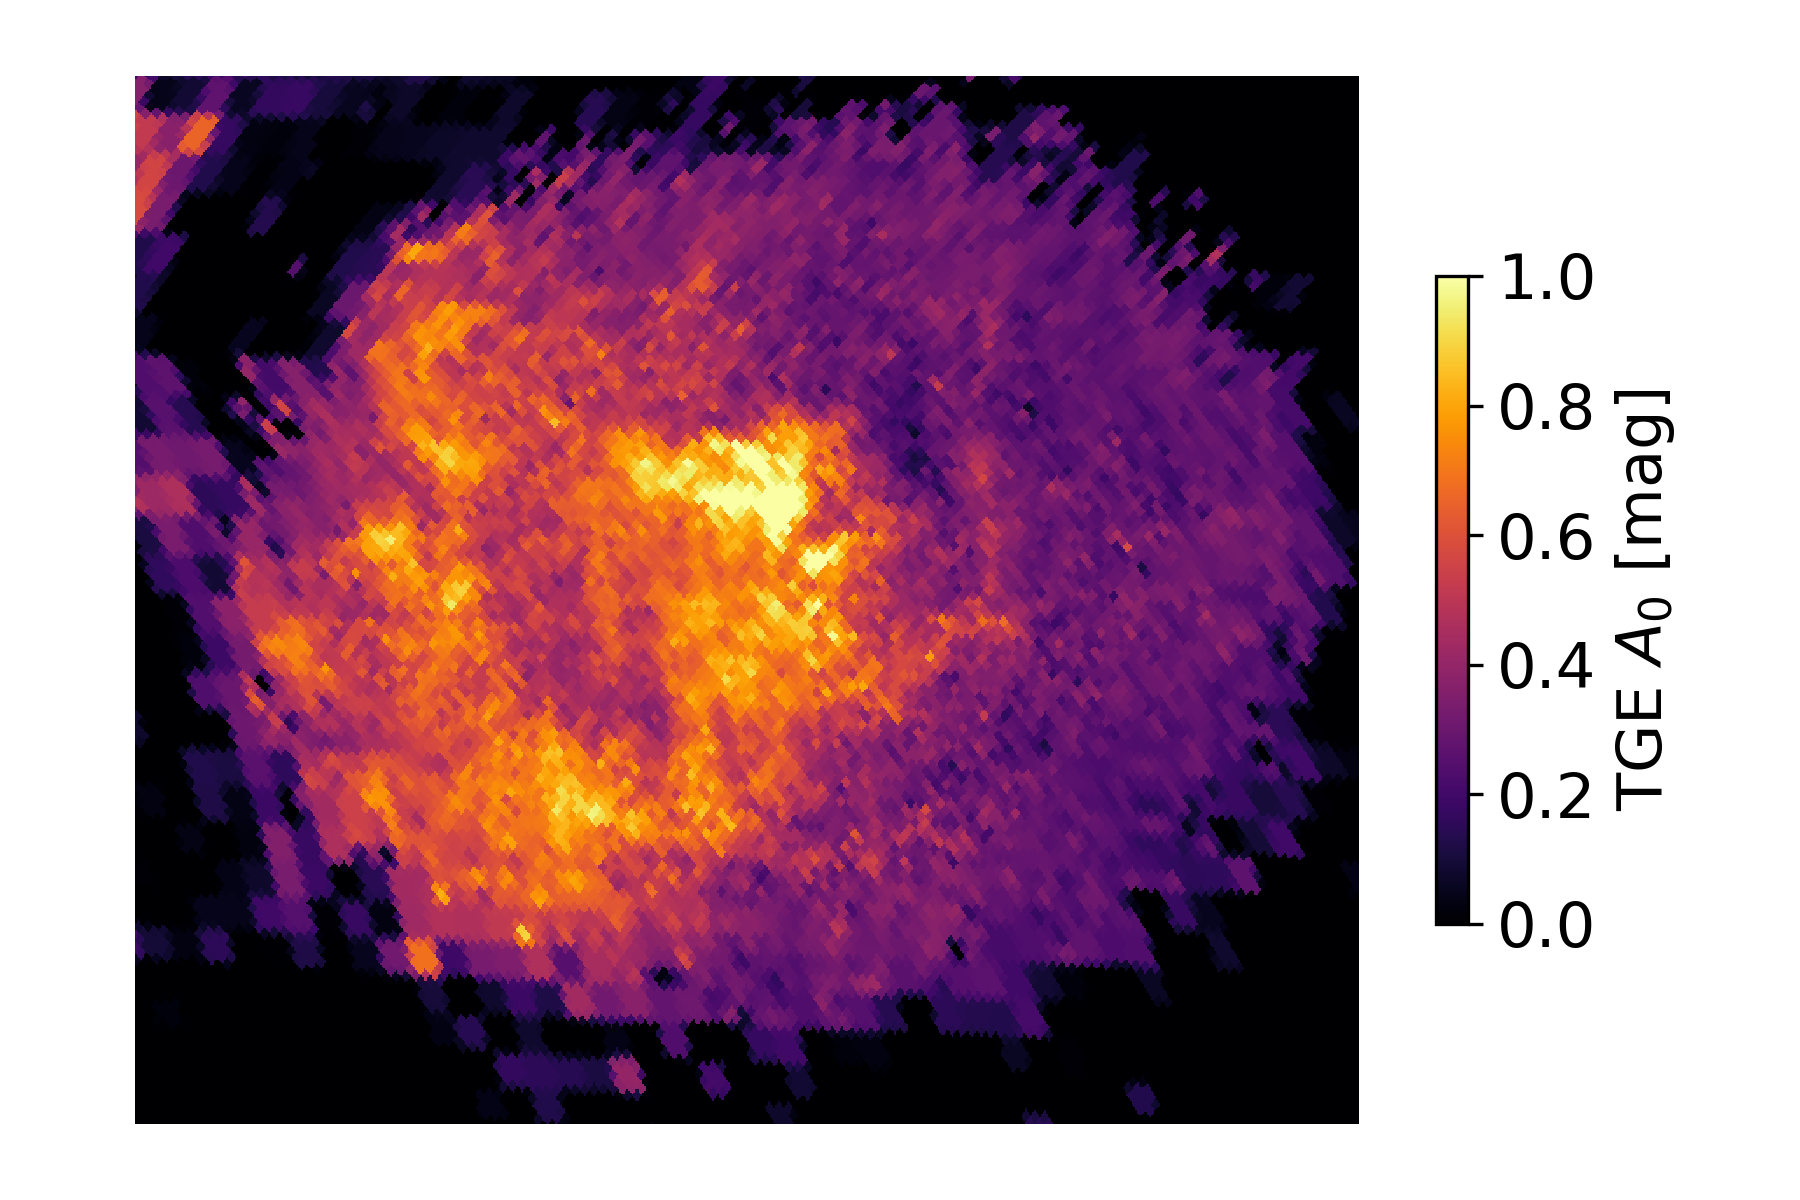
8 Beyond Gaia DR3
We present the non-stellar and classification modules from CU8 in their present status, as for Gaia DR3. However, they are in constant evolution and changes are already planned for Gaia DR4 and later, which we summarise for each module in this section.
Although the intrinsic performance of DSC is very good, once we take into account class prior —as we do for all results shown in this paper— the purities of the classified samples are modest. In preparation for Gaia DR4, we will aim to improve this, for example by optimising the feature set in Allosmod and how this is used. We will also reconsider the class definitions and the training data, in particular for white dwarfs and physical binaries. As Specmod uses the entire BP/RP spectrum, we expected better performance (compared to Allosmod), and so we will investigate improving the classifier. We may also introduce filters to remove the classifications of the lowest quality data (which are the main determinant of the low purities).
OA will be upgraded by implementing its own outlier detector, which will be mostly based on unsupervised clustering algorithms. Additionally, we will improve the statistical description and the templates that were used for Gaia DR3. The functionality offered by the GUASOM visualisation tool will be extended in order to allow the user to perform and explore their own clustering analysis.
QSOC will use epoch BP/RP spectra re-sampled into logarithmic wavelength bins in order to overcome the issues we encountered while using the Hermite spline polynomials associated with the internal representation of the BP/RP spectra. This internal representation effectively tends to produce wiggles whose strength can be comparable to those of quasar emission lines in faint mag spectra (Creevey et al., 2022). This solution will concurrently allow us to use sampled BP/RP spectra with uncorrelated noise on their flux, as the algorithm described in Delchambre (2016) is not optimised to deal with full covariance matrices.
The performance of the UGC redshift estimator strongly depends on the training set used. As more epochs are incorporated in the BP/RP spectra, we expect to have more (and generally fainter) sources with redshifts above 0.4 available for inclusion in the training set, thus improving the performance especially for higher redshifts. We will also investigate optimisation of the SVM model parameters in order to reduce the large variability in the performance with redshift and to minimise the positive bias for bright, low-redshift objects.
In future data releases, we can expect the TGE maps to improve with future improvements of GSP-Phot (Andrae et al., 2022). In particular, we expect that the number of sources with stellar parameters will increase, which will improve the reliability of the TGE maps, and possibly allow for maps at a resolution higher than HEALPix level 9.
Acknowledgements
This work presents results from the European Space Agency (ESA) space mission Gaia. Gaia data are being processed by the Gaia Data Processing and Analysis Consortium (DPAC). Funding for the DPAC is provided by national institutions, in particular the institutions participating in the Gaia MultiLateral Agreement (MLA). The Gaia mission website is https://www.cosmos.esa.int/gaia. The Gaia archive website is https://archives.esac.esa.int/gaia. Acknowledgements are given in Appendix A.
References
- Aguado et al. (2019) Aguado, D. S., Ahumada, R., Almeida, A., et al. 2019, ApJS, 240, 23
- Ahn et al. (2012) Ahn, C. P., Alexandroff, R., Allende Prieto, C., et al. 2012, ApJS, 203, 21
- Ahumada et al. (2020) Ahumada, R., Prieto, C. A., Almeida, A., et al. 2020, ApJS, 249, 3
- Albareti et al. (2017) Albareti, F. D., Allende Prieto, C., Almeida, A., et al. 2017, ApJS, 233, 25
- Álvarez et al. (2021) Álvarez, M. A., Dafonte, C., Manteiga, M., Garabato, D., & Santoveña, R. 2021, Neural Computing and Applications
- Andrae et al. (2022) Andrae, R., Fouesneau, M., Sordo, R., Bailer-Jones, C., & et al. 2022, A&A, submitted
- Astropy Collaboration et al. (2018) Astropy Collaboration, Price-Whelan, A., Sipőcz, B. M., et al. 2018, AJ, 156, 123
- Bailer-Jones (2021) Bailer-Jones, C. A. L. 2021, Gaia Data Processing and Analysis Consortium (DPAC) technical note GAIA-C8-TN-MPIA-CBJ-094, http://www.cosmos.esa.int/web/gaia/public-dpac-documents
- Bailer-Jones et al. (2019) Bailer-Jones, C. A. L., Fouesneau, M., & Andrae, R. 2019, MNRAS, 490, 5615
- Bailer-Jones et al. (2008) Bailer-Jones, C. A. L., Smith, K. W., Tiede, C., Sordo, R., & Vallenari, A. 2008, MNRAS, 391, 1838
- Bailer-Jones, C. A. L. et al. (2013) Bailer-Jones, C. A. L., Andrae, R., Arcay, B., et al. 2013, A&A, 559, A74
- Bastian & Portell (2020) Bastian, U. & Portell, J. 2020, Gaia Data Processing and Analysis Consortium (DPAC) technical note GAIA-C3-TN-ARI-BAS-020, http://www.cosmos.esa.int/web/gaia/public-dpac-documents
- Boch & Fernique (2014) Boch, T. & Fernique, P. 2014, in Astronomical Society of the Pacific Conference Series, Vol. 485, Astronomical Data Analysis Software and Systems XXIII, ed. N. Manset & P. Forshay, 277
- Bonnarel et al. (2000) Bonnarel, F., Fernique, P., Bienaymé, O., et al. 2000, A&AS, 143, 33
- Breddels & Veljanoski (2018) Breddels, M. A. & Veljanoski, J. 2018, A&A, 618, A13
- Carrasco et al. (2021) Carrasco, J. M., Weiler, M., Jordi, C., et al. 2021, A&A, 652, A86
- Chambers et al. (2016) Chambers, K. C., Magnier, E. A., Metcalfe, N., et al. 2016, ArXiv e-prints [arXiv:1612.05560]
- Chang & Lin (2011) Chang, C.-C. & Lin, C.-J. 2011, ACM Transactions on Intelligent Systems and Technology, 2, 27:1, software available at http://www.csie.ntu.edu.tw/~cjlin/libsvm
- Cortes & Vapnik (1995) Cortes, C. & Vapnik, V. 1995, Machine Learning, 20, 273
- Creevey et al. (2022) Creevey, O., Sordo, R., Pailler, F., et al. 2022, A&A, submitted
- Delchambre (2015) Delchambre, L. 2015, MNRAS, 446, 3545
- Delchambre (2016) Delchambre, L. 2016, MNRAS, 460, 2811
- Delchambre (2018) Delchambre, L. 2018, MNRAS, 473, 1785
- Fabricius et al. (2002) Fabricius, C., Høg, E., Makarov, V. V., et al. 2002, A&A, 384, 180
- Fitzpatrick (1999) Fitzpatrick, E. L. 1999, PASP, 111, 63
- Flesch (2021) Flesch, E. W. 2021, arXiv e-prints, arXiv:2105.12985
- Flewelling et al. (2020) Flewelling, H. A., Magnier, E. A., Chambers, K. C., et al. 2020, ApJS, 251, 7
- Fouesneau et al. (2022) Fouesneau, M., Frémat, Y., Andrae, R., Korn, A., & et al. 2022, A&A, in prep.
- Gaia Collaboration, Bailer-Jones et al. (2022) Gaia Collaboration, Bailer-Jones, C., Teyssier, D., Delchambre, L., & et al. 2022, A&A, accepted
- Gaia Collaboration, Prusti et al. (2016) Gaia Collaboration, Prusti, T., de Bruijne, J., Brown, A., et al. 2016, A&A, 595, A1
- Gilmore et al. (2022) Gilmore, G., Randich, S., Worley, C. C., et al. 2022, A&A in press
- Górski et al. (2005) Górski, K. M., Hivon, E., Banday, A. J., et al. 2005, ApJ, 622, 759
- Green et al. (2019) Green, G. M., Schlafly, E., Zucker, C., Speagle, J. S., & Finkbeiner, D. 2019, ApJ, 887, 93
- Henden et al. (2016) Henden, A. A., Templeton, M., Terrell, D., et al. 2016, VizieR Online Data Catalogue, 2336
- Høg et al. (2000) Høg, E., Fabricius, C., Makarov, V. V., et al. 2000, A&A, 355, L27
- Huber et al. (2016) Huber, D., Bryson, S. T., Haas, M. R., et al. 2016, ApJS, 224, 2
- Hunter (2007) Hunter, J. D. 2007, Computing In Science & Engineering, 9, 90
- Imara & Blitz (2007) Imara, N. & Blitz, L. 2007, ApJ, 662, 969
- Lasker et al. (2008) Lasker, B. M., Lattanzi, M. G., McLean, B. J., et al. 2008, AJ, 136, 735
- Lindegren et al. (2021) Lindegren, L., Klioner, S. A., Hernández, J., et al. 2021, A&A, 649, A2
- Luo et al. (2015) Luo, A. L., Zhao, Y.-H., Zhao, G., et al. 2015, Research in Astronomy and Astrophysics, 15, 1095
- Magnier et al. (2020a) Magnier, E. A., Chambers, K. C., Flewelling, H. A., et al. 2020a, ApJS, 251, 3
- Magnier et al. (2020b) Magnier, E. A., Schlafly, E. F., Finkbeiner, D. P., et al. 2020b, ApJS, 251, 6
- Magnier et al. (2020c) Magnier, E. A., Sweeney, W. E., Chambers, K. C., et al. 2020c, ApJS, 251, 5
- Montegriffo et al. (2022) Montegriffo, P., De Angeli, F., Andrae, R., Riello, M., & et al. 2022, A&A, submitted
- Ochsenbein et al. (2000) Ochsenbein, F., Bauer, P., & Marcout, J. 2000, A&AS, 143, 23
- Onken et al. (2019) Onken, C. A., Wolf, C., Bessell, M. S., et al. 2019, PASA, 36, e033
- Pâris et al. (2018) Pâris, I., Petitjean, P., Aubourg, É., et al. 2018, A&A, 613, A51
- Pâris et al. (2017) Pâris, I., Petitjean, P., Ross, N. P., et al. 2017, A&A, 597, A79
- Pérez & Granger (2007) Pérez, F. & Granger, B. E. 2007, Computing in Science and Engineering, 9, 21
- Planck Collaboration et al. (2016a) Planck Collaboration, Ade, P. A. R., Aghanim, N., et al. 2016a, A&A, 586, A132
- Planck Collaboration et al. (2016b) Planck Collaboration, Aghanim, N., Ashdown, M., et al. 2016b, A&A, 596, A109
- R Core Team (2013) R Core Team. 2013, R: A Language and Environment for Statistical Computing, R Foundation for Statistical Computing, Vienna, Austria
- Randich et al. (2022) Randich, S., Gilmore, G., Magrini, L., et al. 2022, A&A in press
- Roeser et al. (2010) Roeser, S., Demleitner, M., & Schilbach, E. 2010, AJ, 139, 2440
- Schlegel et al. (1998) Schlegel, D. J., Finkbeiner, D. P., & Davis, M. 1998, ApJ, 500, 525
- Skrutskie et al. (2006) Skrutskie, M. F., Cutri, R. M., Stiening, R., et al. 2006, AJ, 131, 1163
- Steinmetz et al. (2020a) Steinmetz, M., Guiglion, G., McMillan, P. J., et al. 2020a, AJ, 160, 83
- Steinmetz et al. (2020b) Steinmetz, M., Matijevič, G., Enke, H., et al. 2020b, AJ, 160, 82
- T. Kohonen (1982) T. Kohonen. 1982, Biological Cybernetics, 43, 59
- Taylor (2005) Taylor, M. B. 2005, in Astronomical Society of the Pacific Conference Series, Vol. 347, Astronomical Data Analysis Software and Systems XIV, ed. P. Shopbell, M. Britton, & R. Ebert, 29
- Taylor (2006) Taylor, M. B. 2006, in Astronomical Society of the Pacific Conference Series, Vol. 351, Astronomical Data Analysis Software and Systems XV, ed. C. Gabriel, C. Arviset, D. Ponz, & S. Enrique, 666
- van Leeuwen (2007) van Leeuwen, F. 2007, A&A, 474, 653
- Wagner-Kaiser & Sarajedini (2013) Wagner-Kaiser, R. & Sarajedini, A. 2013, MNRAS, 431, 1565
- Waters et al. (2020) Waters, C. Z., Magnier, E. A., Price, P. A., et al. 2020, ApJS, 251, 4
- Wenger et al. (2000) Wenger, M., Ochsenbein, F., Egret, D., et al. 2000, A&AS, 143, 9
- Zacharias et al. (2015) Zacharias, N., Finch, C., Subasavage, J., et al. 2015, AJ, 150, 101
- Zacharias et al. (2013) Zacharias, N., Finch, C. T., Girard, T. M., et al. 2013, AJ, 145, 44
Appendix A
This work presents results from the European Space Agency (ESA) space mission Gaia. Gaia data are being processed by the Gaia Data Processing and Analysis Consortium (DPAC). Funding for the DPAC is provided by national institutions, in particular the institutions participating in the Gaia MultiLateral Agreement (MLA). The Gaia mission website is https://www.cosmos.esa.int/gaia. The Gaia archive website is https://archives.esac.esa.int/gaia.
The Gaia mission and data processing have financially been supported by, in alphabetical order by country:
-
•
the Algerian Centre de Recherche en Astronomie, Astrophysique et Géophysique of Bouzareah Observatory;
-
•
the Austrian Fonds zur Förderung der wissenschaftlichen Forschung (FWF) Hertha Firnberg Programme through grants T359, P20046, and P23737;
-
•
the BELgian federal Science Policy Office (BELSPO) through various PROgramme de Développement d’Expériences scientifiques (PRODEX) grants, the Research Foundation Flanders (Fonds Wetenschappelijk Onderzoek) through grant VS.091.16N, the Fonds de la Recherche Scientifique (FNRS), and the Research Council of Katholieke Universiteit (KU) Leuven through grant C16/18/005 (Pushing AsteRoseismology to the next level with TESS, GaiA, and the Sloan DIgital Sky SurvEy – PARADISE);
-
•
the Brazil-France exchange programmes Fundação de Amparo à Pesquisa do Estado de São Paulo (FAPESP) and Coordenação de Aperfeicoamento de Pessoal de Nível Superior (CAPES) - Comité Français d’Evaluation de la Coopération Universitaire et Scientifique avec le Brésil (COFECUB);
-
•
the Chilean Agencia Nacional de Investigación y Desarrollo (ANID) through Fondo Nacional de Desarrollo Científico y Tecnológico (FONDECYT) Regular Project 1210992 (L. Chemin);
-
•
the National Natural Science Foundation of China (NSFC) through grants 11573054, 11703065, and 12173069, the China Scholarship Council through grant 201806040200, and the Natural Science Foundation of Shanghai through grant 21ZR1474100;
-
•
the Tenure Track Pilot Programme of the Croatian Science Foundation and the École Polytechnique Fédérale de Lausanne and the project TTP-2018-07-1171 ‘Mining the Variable Sky’, with the funds of the Croatian-Swiss Research Programme;
-
•
the Czech-Republic Ministry of Education, Youth, and Sports through grant LG 15010 and INTER-EXCELLENCE grant LTAUSA18093, and the Czech Space Office through ESA PECS contract 98058;
-
•
the Danish Ministry of Science;
-
•
the Estonian Ministry of Education and Research through grant IUT40-1;
-
•
the European Commission’s Sixth Framework Programme through the European Leadership in Space Astrometry (ELSA) Marie Curie Research Training Network (MRTN-CT-2006-033481), through Marie Curie project PIOF-GA-2009-255267 (Space AsteroSeismology & RR Lyrae stars, SAS-RRL), and through a Marie Curie Transfer-of-Knowledge (ToK) fellowship (MTKD-CT-2004-014188); the European Commission’s Seventh Framework Programme through grant FP7-606740 (FP7-SPACE-2013-1) for the Gaia European Network for Improved data User Services (GENIUS) and through grant 264895 for the Gaia Research for European Astronomy Training (GREAT-ITN) network;
-
•
the European Cooperation in Science and Technology (COST) through COST Action CA18104 ‘Revealing the Milky Way with Gaia (MW-Gaia)’;
-
•
the European Research Council (ERC) through grants 320360, 647208, and 834148 and through the European Union’s Horizon 2020 research and innovation and excellent science programmes through Marie Skłodowska-Curie grant 745617 (Our Galaxy at full HD – Gal-HD) and 895174 (The build-up and fate of self-gravitating systems in the Universe) as well as grants 687378 (Small Bodies: Near and Far), 682115 (Using the Magellanic Clouds to Understand the Interaction of Galaxies), 695099 (A sub-percent distance scale from binaries and Cepheids – CepBin), 716155 (Structured ACCREtion Disks – SACCRED), 951549 (Sub-percent calibration of the extragalactic distance scale in the era of big surveys – UniverScale), and 101004214 (Innovative Scientific Data Exploration and Exploitation Applications for Space Sciences – EXPLORE);
-
•
the European Science Foundation (ESF), in the framework of the Gaia Research for European Astronomy Training Research Network Programme (GREAT-ESF);
-
•
the European Space Agency (ESA) in the framework of the Gaia project, through the Plan for European Cooperating States (PECS) programme through contracts C98090 and 4000106398/12/NL/KML for Hungary, through contract 4000115263/15/NL/IB for Germany, and through PROgramme de Développement d’Expériences scientifiques (PRODEX) grant 4000127986 for Slovenia;
-
•
the Academy of Finland through grants 299543, 307157, 325805, 328654, 336546, and 345115 and the Magnus Ehrnrooth Foundation;
-
•
the French Centre National d’Études Spatiales (CNES), the Agence Nationale de la Recherche (ANR) through grant ANR-10-IDEX-0001-02 for the ‘Investissements d’avenir’ programme, through grant ANR-15-CE31-0007 for project ‘Modelling the Milky Way in the Gaia era’ (MOD4Gaia), through grant ANR-14-CE33-0014-01 for project ‘The Milky Way disc formation in the Gaia era’ (ARCHEOGAL), through grant ANR-15-CE31-0012-01 for project ‘Unlocking the potential of Cepheids as primary distance calibrators’ (UnlockCepheids), through grant ANR-19-CE31-0017 for project ‘Secular evolution of galaxies’ (SEGAL), and through grant ANR-18-CE31-0006 for project ‘Galactic Dark Matter’ (GaDaMa), the Centre National de la Recherche Scientifique (CNRS) and its SNO Gaia of the Institut des Sciences de l’Univers (INSU), its Programmes Nationaux: Cosmologie et Galaxies (PNCG), Gravitation Références Astronomie Métrologie (PNGRAM), Planétologie (PNP), Physique et Chimie du Milieu Interstellaire (PCMI), and Physique Stellaire (PNPS), the ‘Action Fédératrice Gaia’ of the Observatoire de Paris, the Région de Franche-Comté, the Institut National Polytechnique (INP) and the Institut National de Physique nucléaire et de Physique des Particules (IN2P3) co-funded by CNES;
-
•
the German Aerospace Agency (Deutsches Zentrum für Luft- und Raumfahrt e.V., DLR) through grants 50QG0501, 50QG0601, 50QG0602, 50QG0701, 50QG0901, 50QG1001, 50QG1101, 50QG1401, 50QG1402, 50QG1403, 50QG1404, 50QG1904, 50QG2101, 50QG2102, and 50QG2202, and the Centre for Information Services and High Performance Computing (ZIH) at the Technische Universität Dresden for generous allocations of computer time;
-
•
the Hungarian Academy of Sciences through the Lendület Programme grants LP2014-17 and LP2018-7 and the Hungarian National Research, Development, and Innovation Office (NKFIH) through grant KKP-137523 (‘SeismoLab’);
-
•
the Science Foundation Ireland (SFI) through a Royal Society - SFI University Research Fellowship (M. Fraser);
-
•
the Israel Ministry of Science and Technology through grant 3-18143 and the Tel Aviv University Center for Artificial Intelligence and Data Science (TAD) through a grant;
-
•
the Agenzia Spaziale Italiana (ASI) through contracts I/037/08/0, I/058/10/0, 2014-025-R.0, 2014-025-R.1.2015, and 2018-24-HH.0 to the Italian Istituto Nazionale di Astrofisica (INAF), contract 2014-049-R.0/1/2 to INAF for the Space Science Data Centre (SSDC, formerly known as the ASI Science Data Center, ASDC), contracts I/008/10/0, 2013/030/I.0, 2013-030-I.0.1-2015, and 2016-17-I.0 to the Aerospace Logistics Technology Engineering Company (ALTEC S.p.A.), INAF, and the Italian Ministry of Education, University, and Research (Ministero dell’Istruzione, dell’Università e della Ricerca) through the Premiale project ‘MIning The Cosmos Big Data and Innovative Italian Technology for Frontier Astrophysics and Cosmology’ (MITiC);
-
•
the Netherlands Organisation for Scientific Research (NWO) through grant NWO-M-614.061.414, through a VICI grant (A. Helmi), and through a Spinoza prize (A. Helmi), and the Netherlands Research School for Astronomy (NOVA);
-
•
the Polish National Science Centre through HARMONIA grant 2018/30/M/ST9/00311 and DAINA grant 2017/27/L/ST9/03221 and the Ministry of Science and Higher Education (MNiSW) through grant DIR/WK/2018/12;
-
•
the Portuguese Fundação para a Ciência e a Tecnologia (FCT) through national funds, grants SFRH/BD/128840/2017 and PTDC/FIS-AST/30389/2017, and work contract DL 57/2016/CP1364/CT0006, the Fundo Europeu de Desenvolvimento Regional (FEDER) through grant POCI-01-0145-FEDER-030389 and its Programa Operacional Competitividade e Internacionalização (COMPETE2020) through grants UIDB/04434/2020 and UIDP/04434/2020, and the Strategic Programme UIDB/00099/2020 for the Centro de Astrofísica e Gravitação (CENTRA);
-
•
the Slovenian Research Agency through grant P1-0188;
-
•
the Spanish Ministry of Economy (MINECO/FEDER, UE), the Spanish Ministry of Science and Innovation (MICIN), the Spanish Ministry of Education, Culture, and Sports, and the Spanish Government through grants BES-2016-078499, BES-2017-083126, BES-C-2017-0085, ESP2016-80079-C2-1-R, ESP2016-80079-C2-2-R, FPU16/03827, PDC2021-121059-C22, RTI2018-095076-B-C22, and TIN2015-65316-P (‘Computación de Altas Prestaciones VII’), the Juan de la Cierva Incorporación Programme (FJCI-2015-2671 and IJC2019-04862-I for F. Anders), the Severo Ochoa Centre of Excellence Programme (SEV2015-0493), and MICIN/AEI/10.13039/501100011033 (and the European Union through European Regional Development Fund ‘A way of making Europe’) through grant RTI2018-095076-B-C21, the Institute of Cosmos Sciences University of Barcelona (ICCUB, Unidad de Excelencia ‘María de Maeztu’) through grant CEX2019-000918-M, the University of Barcelona’s official doctoral programme for the development of an R+D+i project through an Ajuts de Personal Investigador en Formació (APIF) grant, the Spanish Virtual Observatory through project AyA2017-84089, the Galician Regional Government, Xunta de Galicia, through grants ED431B-2021/36, ED481A-2019/155, and ED481A-2021/296, the Centro de Investigación en Tecnologías de la Información y las Comunicaciones (CITIC), funded by the Xunta de Galicia and the European Union (European Regional Development Fund – Galicia 2014-2020 Programme), through grant ED431G-2019/01, the Red Española de Supercomputación (RES) computer resources at MareNostrum, the Barcelona Supercomputing Centre - Centro Nacional de Supercomputación (BSC-CNS) through activities AECT-2017-2-0002, AECT-2017-3-0006, AECT-2018-1-0017, AECT-2018-2-0013, AECT-2018-3-0011, AECT-2019-1-0010, AECT-2019-2-0014, AECT-2019-3-0003, AECT-2020-1-0004, and DATA-2020-1-0010, the Departament d’Innovació, Universitats i Empresa de la Generalitat de Catalunya through grant 2014-SGR-1051 for project ‘Models de Programació i Entorns d’Execució Parallels’ (MPEXPAR), and Ramon y Cajal Fellowship RYC2018-025968-I funded by MICIN/AEI/10.13039/501100011033 and the European Science Foundation (‘Investing in your future’);
-
•
the Swedish National Space Agency (SNSA/Rymdstyrelsen);
-
•
the Swiss State Secretariat for Education, Research, and Innovation through the Swiss Activités Nationales Complémentaires and the Swiss National Science Foundation through an Eccellenza Professorial Fellowship (award PCEFP2_194638 for R. Anderson);
-
•
the United Kingdom Particle Physics and Astronomy Research Council (PPARC), the United Kingdom Science and Technology Facilities Council (STFC), and the United Kingdom Space Agency (UKSA) through the following grants to the University of Bristol, the University of Cambridge, the University of Edinburgh, the University of Leicester, the Mullard Space Sciences Laboratory of University College London, and the United Kingdom Rutherford Appleton Laboratory (RAL): PP/D006511/1, PP/D006546/1, PP/D006570/1, ST/I000852/1, ST/J005045/1, ST/K00056X/1, ST/K000209/1, ST/K000756/1, ST/L006561/1, ST/N000595/1, ST/N000641/1, ST/N000978/1, ST/N001117/1, ST/S000089/1, ST/S000976/1, ST/S000984/1, ST/S001123/1, ST/S001948/1, ST/S001980/1, ST/S002103/1, ST/V000969/1, ST/W002469/1, ST/W002493/1, ST/W002671/1, ST/W002809/1, and EP/V520342/1.
The Gaia project and data processing have made use of:
-
•
the Set of Identifications, Measurements, and Bibliography for Astronomical Data (SIMBAD, Wenger et al. 2000), the ‘Aladin sky atlas’ (Bonnarel et al. 2000; Boch & Fernique 2014), and the VizieR catalogue access tool (Ochsenbein et al. 2000), all operated at the Centre de Données astronomiques de Strasbourg (CDS);
-
•
the National Aeronautics and Space Administration (NASA) Astrophysics Data System (ADS);
-
•
the SPace ENVironment Information System (SPENVIS), initiated by the Space Environment and Effects Section (TEC-EES) of ESA and developed by the Belgian Institute for Space Aeronomy (BIRA-IASB) under ESA contract through ESA’s General Support Technologies Programme (GSTP), administered by the BELgian federal Science Policy Office (BELSPO);
- •
-
•
Matplotlib (Hunter 2007);
-
•
IPython (Pérez & Granger 2007);
-
•
Astropy, a community-developed core Python package for Astronomy (Astropy Collaboration et al. 2018);
-
•
R (R Core Team 2013);
-
•
the HEALPix package (Górski et al. 2005, http://healpix.sourceforge.net/);
-
•
Vaex (Breddels & Veljanoski 2018);
-
•
the Hipparcos-2 catalogue (van Leeuwen 2007). The Hipparcos and Tycho catalogues were constructed under the responsibility of large scientific teams collaborating with ESA. The Consortia Leaders were Lennart Lindegren (Lund, Sweden: NDAC) and Jean Kovalevsky (Grasse, France: FAST), together responsible for the Hipparcos Catalogue; Erik Høg (Copenhagen, Denmark: TDAC) responsible for the Tycho Catalogue; and Catherine Turon (Meudon, France: INCA) responsible for the Hipparcos Input Catalogue (HIC);
-
•
the Tycho-2 catalogue (Høg et al. 2000), the construction of which was supported by the Velux Foundation of 1981 and the Danish Space Board;
-
•
The Tycho double star catalogue (TDSC, Fabricius et al. 2002), based on observations made with the ESA Hipparcos astrometry satellite, as supported by the Danish Space Board and the United States Naval Observatory through their double-star programme;
-
•
data products from the Two Micron All Sky Survey (2MASS, Skrutskie et al. 2006), which is a joint project of the University of Massachusetts and the Infrared Processing and Analysis Center (IPAC) / California Institute of Technology, funded by the National Aeronautics and Space Administration (NASA) and the National Science Foundation (NSF) of the USA;
- •
-
•
the first data release of the Pan-STARRS survey (Chambers et al. 2016; Magnier et al. 2020a; Waters et al. 2020; Magnier et al. 2020c, b; Flewelling et al. 2020). The Pan-STARRS1 Surveys (PS1) and the PS1 public science archive have been made possible through contributions by the Institute for Astronomy, the University of Hawaii, the Pan-STARRS Project Office, the Max-Planck Society and its participating institutes, the Max Planck Institute for Astronomy, Heidelberg and the Max Planck Institute for Extraterrestrial Physics, Garching, The Johns Hopkins University, Durham University, the University of Edinburgh, the Queen’s University Belfast, the Harvard-Smithsonian Center for Astrophysics, the Las Cumbres Observatory Global Telescope Network Incorporated, the National Central University of Taiwan, the Space Telescope Science Institute, the National Aeronautics and Space Administration (NASA) through grant NNX08AR22G issued through the Planetary Science Division of the NASA Science Mission Directorate, the National Science Foundation through grant AST-1238877, the University of Maryland, Eotvos Lorand University (ELTE), the Los Alamos National Laboratory, and the Gordon and Betty Moore Foundation;
-
•
the second release of the Guide Star Catalogue (GSC2.3, Lasker et al. 2008). The Guide Star Catalogue II is a joint project of the Space Telescope Science Institute (STScI) and the Osservatorio Astrofisico di Torino (OATo). STScI is operated by the Association of Universities for Research in Astronomy (AURA), for the National Aeronautics and Space Administration (NASA) under contract NAS5-26555. OATo is operated by the Italian National Institute for Astrophysics (INAF). Additional support was provided by the European Southern Observatory (ESO), the Space Telescope European Coordinating Facility (STECF), the International GEMINI project, and the European Space Agency (ESA) Astrophysics Division (nowadays SCI-S);
-
•
the eXtended, Large (XL) version of the catalogue of Positions and Proper Motions (PPM-XL, Roeser et al. 2010);
-
•
data products from the Wide-field Infrared Survey Explorer (WISE), which is a joint project of the University of California, Los Angeles, and the Jet Propulsion Laboratory/California Institute of Technology, and NEOWISE, which is a project of the Jet Propulsion Laboratory/California Institute of Technology. WISE and NEOWISE are funded by the National Aeronautics and Space Administration (NASA);
-
•
the first data release of the United States Naval Observatory (USNO) Robotic Astrometric Telescope (URAT-1, Zacharias et al. 2015);
-
•
the fourth data release of the United States Naval Observatory (USNO) CCD Astrograph Catalogue (UCAC-4, Zacharias et al. 2013);
-
•
the sixth and final data release of the Radial Velocity Experiment (RAVE DR6, Steinmetz et al. 2020a, b). Funding for RAVE has been provided by the Leibniz Institute for Astrophysics Potsdam (AIP), the Australian Astronomical Observatory, the Australian National University, the Australian Research Council, the French National Research Agency, the German Research Foundation (SPP 1177 and SFB 881), the European Research Council (ERC-StG 240271 Galactica), the Istituto Nazionale di Astrofisica at Padova, the Johns Hopkins University, the National Science Foundation of the USA (AST-0908326), the W.M. Keck foundation, the Macquarie University, the Netherlands Research School for Astronomy, the Natural Sciences and Engineering Research Council of Canada, the Slovenian Research Agency, the Swiss National Science Foundation, the Science & Technology Facilities Council of the UK, Opticon, Strasbourg Observatory, and the Universities of Basel, Groningen, Heidelberg, and Sydney. The RAVE website is at https://www.rave-survey.org/;
-
•
the first data release of the Large sky Area Multi-Object Fibre Spectroscopic Telescope (LAMOST DR1, Luo et al. 2015);
-
•
the K2 Ecliptic Plane Input Catalogue (EPIC, Huber et al. 2016);
-
•
the ninth data release of the Sloan Digitial Sky Survey (SDSS DR9, Ahn et al. 2012). Funding for SDSS-III has been provided by the Alfred P. Sloan Foundation, the Participating Institutions, the National Science Foundation, and the United States Department of Energy Office of Science. The SDSS-III website is http://www.sdss3.org/. SDSS-III is managed by the Astrophysical Research Consortium for the Participating Institutions of the SDSS-III Collaboration including the University of Arizona, the Brazilian Participation Group, Brookhaven National Laboratory, Carnegie Mellon University, University of Florida, the French Participation Group, the German Participation Group, Harvard University, the Instituto de Astrofísica de Canarias, the Michigan State/Notre Dame/JINA Participation Group, Johns Hopkins University, Lawrence Berkeley National Laboratory, Max Planck Institute for Astrophysics, Max Planck Institute for Extraterrestrial Physics, New Mexico State University, New York University, Ohio State University, Pennsylvania State University, University of Portsmouth, Princeton University, the Spanish Participation Group, University of Tokyo, University of Utah, Vanderbilt University, University of Virginia, University of Washington, and Yale University;
-
•
the thirteenth release of the Sloan Digital Sky Survey (SDSS DR13, Albareti et al. 2017). Funding for SDSS-IV has been provided by the Alfred P. Sloan Foundation, the United States Department of Energy Office of Science, and the Participating Institutions. SDSS-IV acknowledges support and resources from the Center for High-Performance Computing at the University of Utah. The SDSS web site is https://www.sdss.org/. SDSS-IV is managed by the Astrophysical Research Consortium for the Participating Institutions of the SDSS Collaboration including the Brazilian Participation Group, the Carnegie Institution for Science, Carnegie Mellon University, the Chilean Participation Group, the French Participation Group, Harvard-Smithsonian Center for Astrophysics, Instituto de Astrofísica de Canarias, The Johns Hopkins University, Kavli Institute for the Physics and Mathematics of the Universe (IPMU) / University of Tokyo, the Korean Participation Group, Lawrence Berkeley National Laboratory, Leibniz Institut für Astrophysik Potsdam (AIP), Max-Planck-Institut für Astronomie (MPIA Heidelberg), Max-Planck-Institut für Astrophysik (MPA Garching), Max-Planck-Institut für Extraterrestrische Physik (MPE), National Astronomical Observatories of China, New Mexico State University, New York University, University of Notre Dame, Observatário Nacional / MCTI, The Ohio State University, Pennsylvania State University, Shanghai Astronomical Observatory, United Kingdom Participation Group, Universidad Nacional Autónoma de México, University of Arizona, University of Colorado Boulder, University of Oxford, University of Portsmouth, University of Utah, University of Virginia, University of Washington, University of Wisconsin, Vanderbilt University, and Yale University;
-
•
the second release of the SkyMapper catalogue (SkyMapper DR2, Onken et al. 2019, Digital Object Identifier 10.25914/5ce60d31ce759). The national facility capability for SkyMapper has been funded through grant LE130100104 from the Australian Research Council (ARC) Linkage Infrastructure, Equipment, and Facilities (LIEF) programme, awarded to the University of Sydney, the Australian National University, Swinburne University of Technology, the University of Queensland, the University of Western Australia, the University of Melbourne, Curtin University of Technology, Monash University, and the Australian Astronomical Observatory. SkyMapper is owned and operated by The Australian National University’s Research School of Astronomy and Astrophysics. The survey data were processed and provided by the SkyMapper Team at the Australian National University. The SkyMapper node of the All-Sky Virtual Observatory (ASVO) is hosted at the National Computational Infrastructure (NCI). Development and support the SkyMapper node of the ASVO has been funded in part by Astronomy Australia Limited (AAL) and the Australian Government through the Commonwealth’s Education Investment Fund (EIF) and National Collaborative Research Infrastructure Strategy (NCRIS), particularly the National eResearch Collaboration Tools and Resources (NeCTAR) and the Australian National Data Service Projects (ANDS);
-
•
the Gaia-ESO Public Spectroscopic Survey (GES, Gilmore et al. 2022; Randich et al. 2022). The Gaia-ESO Survey is based on data products from observations made with ESO Telescopes at the La Silla Paranal Observatory under programme ID 188.B-3002. Public data releases are available through the ESO Science Portal. The project has received funding from the Leverhulme Trust (project RPG-2012-541), the European Research Council (project ERC-2012-AdG 320360-Gaia-ESO-MW), and the Istituto Nazionale di Astrofisica, INAF (2012: CRA 1.05.01.09.16; 2013: CRA 1.05.06.02.07).
The GBOT programme uses observations collected at (i) the European Organisation for Astronomical Research in the Southern Hemisphere (ESO) with the VLT Survey Telescope (VST), under ESO programmes 092.B-0165, 093.B-0236, 094.B-0181, 095.B-0046, 096.B-0162, 097.B-0304, 098.B-0030, 099.B-0034, 0100.B-0131, 0101.B-0156, 0102.B-0174, and 0103.B-0165; and (ii) the Liverpool Telescope, which is operated on the island of La Palma by Liverpool John Moores University in the Spanish Observatorio del Roque de los Muchachos of the Instituto de Astrofísica de Canarias with financial support from the United Kingdom Science and Technology Facilities Council, and (iii) telescopes of the Las Cumbres Observatory Global Telescope Network.
In case of errors or omissions, please contact the Gaia Helpdesk.
Appendix B Combining probabilities for DSC-Combmod
Combmod in DSC combines the posterior probabilities from Specmod and Allosmod into a new posterior probability, taking care to ensure that the global prior is only counted once. If Specmod and Allosmod used the same classes, and operated on independent data, then combining their probabilities would be simple. However, Specmod has three classes (star, white dwarf, physical binary star) that correspond to the single star class in Allosmod. It is also possible that Specmod or Allosmod provides no result. The combination method is therefore a bit more complicated. The basic idea is that a fraction of the Allosmod probability for the single ‘superclass’ is taken to correspond to each subclass in Specmod, with that fraction equal to the prior. We assume that Specmod and Allosmod are independent, which is not quite true as the colours in Allosmod are derived from the BP/RP spectra used by Specmod.
-
•
Let be the posterior probability from classifier for class .
-
•
Let be the prior probability used in classifier for class .
-
•
For Specmod, and corresponding to quasar, galaxy, star, white dwarf, physical binary star respectively.
-
•
For Allosmod, and corresponding to quasar, galaxy, star, respectively.
-
•
For each classifier, classes are disjoint and exhaustive, so the probabilities sum to one.
-
•
The priors for the two classifiers are consistent, so , , and .
For the classes that correspond one-to-one, the combined posterior probability is obtained by multiplying the likelihoods (the posterior divided by the prior, to within a normalisation factor) and then multiplying by the prior. This is
| (12) |
where is a data-dependent but class-independent normalisation factor. For each of the three stellar classes in Specmod, we assume that a fraction for of the posterior probability is the Allosmod posterior probability for that class. Thus the combined probability for each of these three classes is
| (13) |
If Specmod probabilities are not available (missing), the combined posterior probability for the classes that correspond one-to-one is equal to the Allosmod probabilities:
| (14) |
For the three stellar classes, we distribute the corresponding Allosmod probability to these classes in proportion to the priors, i.e.
| (15) |
If Allosmod probabilities are not available, we simply copy the Specmod probabilities:
| (16) |
If neither the Specmod nor the Allosmod probabilities are available, the Combmod probabilities will be empty.
The above equations run the risk of divide by zero if probabilities are exactly zero. To avoid this we ‘soften’ the Specmod and Allosmod probabilities prior to combination by adding . This is only done in the combination: the Specmod and Allosmod probabilities written to the catalogue are not modified.
The above probability combination is not complicated conceptually, but it can lead to counter-intuitive results. Bailer-Jones (2021) works through various examples to demonstrate and explain this.
Appendix C Adjusting the DSC probabilities to accommodate a new prior
All DSC probabilities are posterior probabilities that have taken into account the class priors listed in Table 2. Posteriors are equal to the product of a likelihood and a prior that has then been normalized. It is therefore simple to adjust the DSC probabilities to reflect a different prior probability: we simply divide each output by the prior used (to strip this off), multiply by the new prior, and then normalise the resulting probability vector. That is, if is the DSC probability in the catalogue (for any of its classifiers) for class , and if is the corresponding catalogue prior (Table 2), then the new posterior probabilities corresponding to a new prior are
| (17) |