Constraining Dwarf Spheroidal Dark Matter Halos With The Galactic Center Excess
Abstract
If the gamma-ray excess from the galactic center reported by Fermi-LAT is a signal from annihilating dark matter, one must question why a similar excess has not been observed in dwarf spheroidal galaxies. We use this observation to place constraints on the density profile of dwarf spheroidal galaxies under the assumption that the galactic center excess is in fact a signal from annihilating dark matter. We place constraints on the generalized NFW parameter and the Einasto profile parameter which control the logarithmic slope of the inner regions of the halo’s density profile. We determine that under these assumptions the galactic center excess is inconsistent with the standard NFW profile (and other ‘cuspy’ profiles) for dwarf spheroidal galaxies , but is consistent with observations of cored dwarf galaxy profiles. Specifically, we find that dwarf spheroidal profiles must be less cuspy than that of the Milky Way. Models of dark matter which self-interacts through a light mediator can achieve this.
I Introduction
Observations by Fermi-LAT have indicated an excess of gamma-rays in the center of the Milky Way galaxy in the range of a few GeV Goodenough:2009gk ; Hooper:2010mq ; Hooper:2011ti ; Abazajian:2012pn ; Zhou:2014lva ; Calore:2014xka ; Daylan:2014rsa ; FermiData ; TheFermi-LAT:2015kwa . Interpretations of the galactic center excess (GCE) differ, with likely candidates including dark matter annihilations and known astrophysical phenomena. On the astrophysical side, the spectrum and morphology of the signal from millisecond pulsars provides a good fit to the observed excess Lee:2015fea ; Bartels:2015aea ; O'Leary:2015gfa , but this would require a much greater number of millisecond pulsars than are observed or expected Linden:2015qha ; Cholis:2014lta . The Fermi-LAT collaboration has more recently completed an analysis of the purported signal and has concluded that the morphology of the signal is more consistent with millisecond pulsars than with the dark matter interpretation TheFermi-LAT:2017vmf ; Fermi-LAT:2017yoi . It is concluded that the dark matter interpretation is strongly disfavoured relative to other interpretations of the excess. In a recent paper, however, Haggard et al. argue that a sufficiently large population of millisecond pulsars would also imply a large population of observable low-mass X-ray binaries, limiting the contribution of millisecond pulsars to the galactic center excess to Haggard:2017lyq , leaving annihilating dark matter as a contender.
It is also well known that there is tension between dark matter explanations of the galactic center excess and observations of dwarf spheroidal galaxies. Dwarf spheroidal galaxies show no corresponding signal, with the constraints seeming to exclude dark matter annihilation as a viable explanation for the galactic center excessAckermann:2015lka ; Abazajian:2015raa . The analysis of Ackermann:2015lka (upon which Abazajian:2015raa is based), however, assumes a Navarro-Frenk-White (NFW) profile for the dwarf spheroidals. The NFW profile has a sharp cusp at the center, leading to an enhanced signal relative to more ‘cored’ dark matter distributions. We consider two profiles here: the generalized NFW profile and the Einasto profile, defined in equations (3) and (5) respectively.
The exact distribution of dark matter in dwarf galaxies is not well known, but there is a large body of evidence pointing to cored profiles (see section IV), or profiles with inner radii with slope smaller than the predicted by cold dark matter simulations and exemplified by the NFW profile.
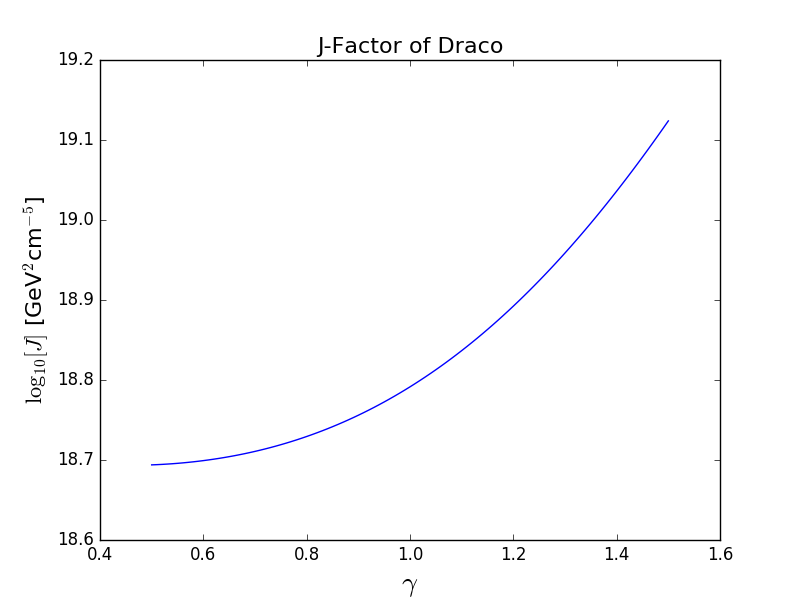
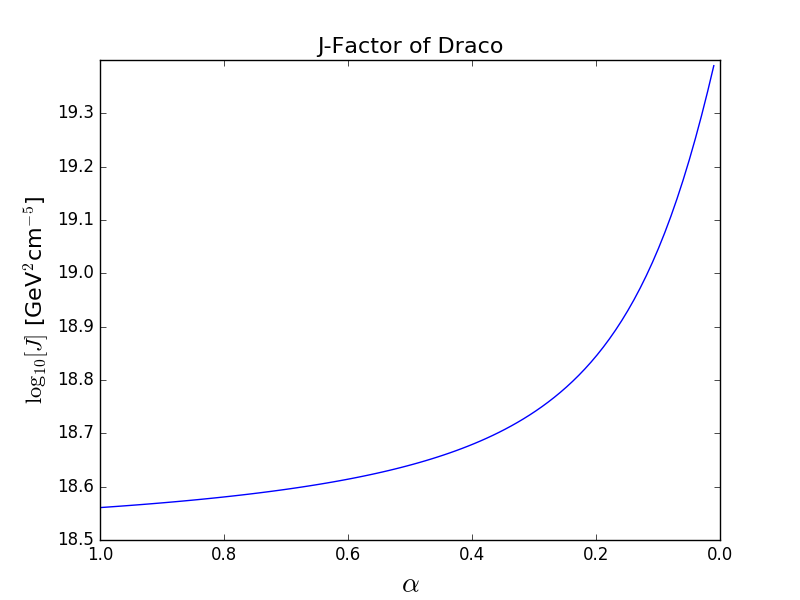
The logarithmic slope of the inner dark matter halo can have a significant impact on its -factor, a measure of the rate of dark matter annihilations within the halo. We can see how the parameters and (the parameters controlling the cuspiness for the NFW and Einasto profiles respectively, as explained below) alter the -factor of Draco, for example, in figure 1. Although these differences may not seem tremendously large, the tension between the dwarf galaxy observations and the GCE is moderate, and these differences can be enough erase it entirely.
It also follows, therefore, that if the GCE signal were assumed to indeed originate from dark matter annihilations, constraints could be placed on the central slope of the dark matter profiles of the dwarf spheroidals. In section II we simulate the GCE signal from dark matter to find best fit values for the dark matter mass and annihilation cross section. In section III we use these adopted values to place limits on the parameters and which control how cuspy the dwarf spheroidals are. In section IV we compare these values to those found through observation of dwarf spheroidals and simulations of cold dark matter (CDM) halos. In section V we discuss the implications for the CDM paradigm, should the GCE prove to indeed be a signal from annihilating dark matter.
II Simulation of Signal
It has been shown that the observed gamma ray excess is well fit by models of annihilating dark matter in which the dark matter predominantly annihilates to . The signal, however, consists of multiple components: the prompt gamma rays (from the decay products), inverse Compton scattering (ICS, caused by the upscattering of starlight and CMB photons by the produced as decay products) and a small amount of bremsstrahlung radiation (also from the decay products). These three sources combine to produce the total signal.
The prompt signal is easiest to compute numerically, as it depends only on the -factor and average spectrum from a single annihilation, taken from PPPC 4 Cirelli:2010xx ; Ciafaloni:2010ti :
| (1) | ||||
| (2) |
with the integral along the line of sight and angular extent of the observed system. The -factor can then be computed numerically by assuming a density profile for the dark matter halo.
One way to parametrize the cuspiness of a galaxy is through the inner slope of the profile. If we assume a generalized NFW profile:
| (3) |
then the parameter corresponds to the negative slope at . Larger values of correspond to a more cuspy profile, whereas smaller values correspond to a more cored profile. Following Calore:2014xka we choose a generalized NFW profile with kpc and (the local dark matter density, which for corresponds to a scale density of ). is typically taken to be somewhere on the order of , with corresponding to the classic NFW profile, but in our analysis we allow it to vary from .
Another popular profile that is easily parametrized in terms of the inner slope is the Einasto profile:
| (4) | ||||
| (5) |
The parameter and the proportionality constant are chosen maintain the same slope and density at as the NFW profile. Although the parameter does not exactly correspond to the inner log slope, it does control the extent to which the profile is concentrated toward the center, with greater concentrations at smaller . We therefore consider both Einasto and NFW profiles in our analysis, using and to control how cuspy the profile is.
For the ICS and bremsstrahlung predictions, we use simulations to account for the propagation of decay products through the Milky Way and the distribution of gas and photons. We use the DRAGON code Evoli:2008dv to simulate the injection and propagation of high energy electrons from DM annihilation, and the GammaSky program to compute the ICS and bremsstrahlung contributions resulting from these cosmic rays. GammaSky is as yet unreleased, though some results have been given DiBernardo:2012zu . GammaSky implements GALPROP in the calculation of photon production and upscattering along the line of sight.
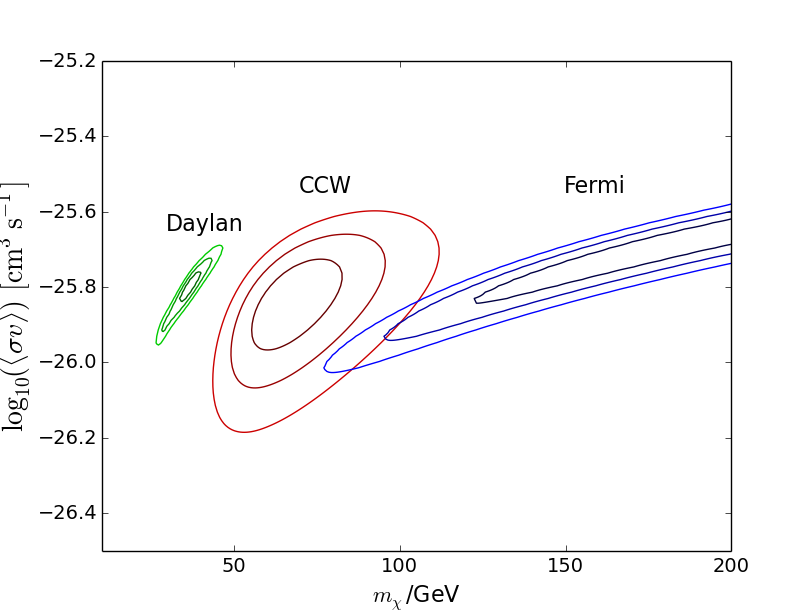
We use the model parameters — describing the galactic magnetic field strength and shape and the galactic diffusion model used to compute the resulting inverse Compton scattering rates — adopted in Calore:2014xka , labelled Model F, which is found to perform particularly well in explaining the GCE signal. We compare the results for a range of dark matter masses (20 GeV 200 GeV) to the GCE signals estimated in Calore:2014xka ; Daylan:2014rsa ; FermiData , as shown in 2.

Figure 3 shows the best fit regions for , showing the , , and confidence intervals generated by minimizing the and creating contours at and . This gives us our best fit values which we will adopt when placing limits on the dwarf galaxy profiles. An example, for , is shown in table 1.
| Dataset | ||
|---|---|---|
| CCW | ||
| Fermi | ||
| Daylan |
III The Dwarf Spheroidal J Factors
Given the assumption that the GCE signal is indeed the result of annihilating dark matter, our adopted values can be used to place constraints on the density profiles of dwarf spheroidal galaxies. We once again assume an NFW or Einasto profile, allowing the parameters and to range from and respectively.
The exact halo parameters and of the dwarf spheroidals are not well known for either profile. Given the difficulty of measuring a large enough population of stars in the galaxies combined with the fact that they are very dark-matter dominated, stellar kinematic surveys tend to give us a view of the profiles of only the innermost regions of many dwarf spheroidals. Furthermore, these parameters themselves depend on the shape of the profile assumed; a given dwarf spheroidal will have different values for its characteristic radius and density depending on what value of or is chosen. We therefore derive best fit parameters for individual values of and using the maximum likelihood method described in appendix A, using stellar kinematic data.
With our adopted value for the annihilation cross section from the fit to the GCE data, we can find the expected signal from any individual dwarf galaxy as a function of the dark matter mass using equation (2). Note that we only consider the prompt signal for dwarf spheroidal galaxies as they are much cleaner environments and therefore have negligible contributions from inverse Compton scattering or bremsstrahlung radiation.
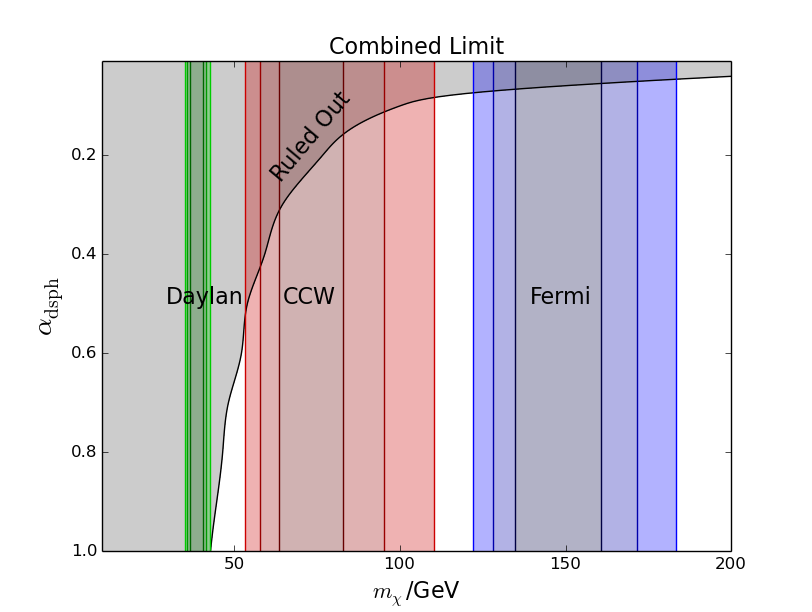
The Fermi-LAT collaboration has released the upper limits on the observed flux from a large number Milky Way dwarf spheroidal galaxies based on 6 years of observation Ackermann:2015zua . We compare our simulated observed flux to these reported limits, assuming an observed flux of 0 and taking their C.L. limit as twice the deviation. Computing the of our simulations versus their observations, we obtain a C.L. constraint on the halo parameters as a function of mass by finding the contour along which . The resulting constraints are shown in figure 4.
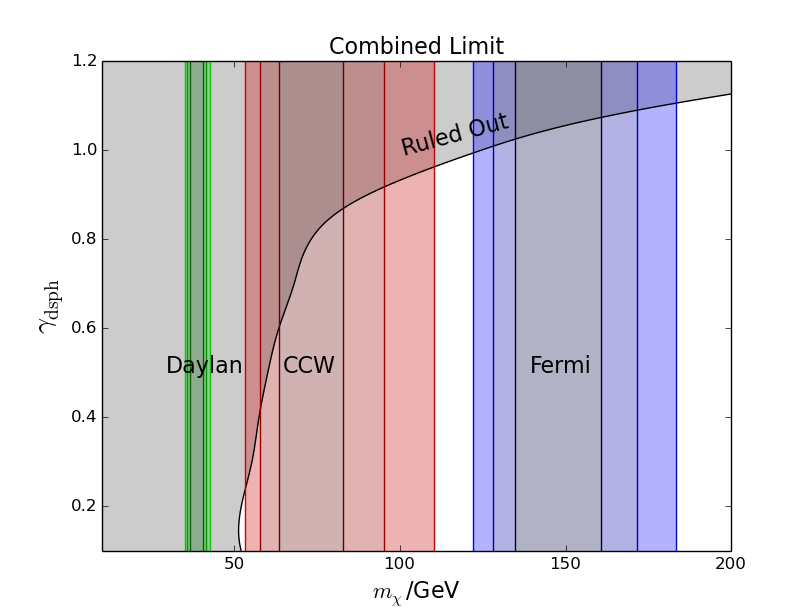
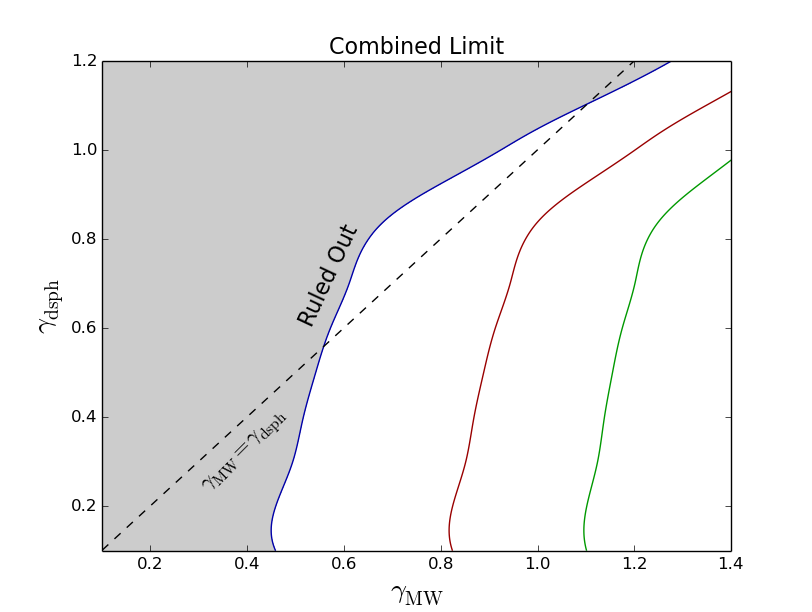
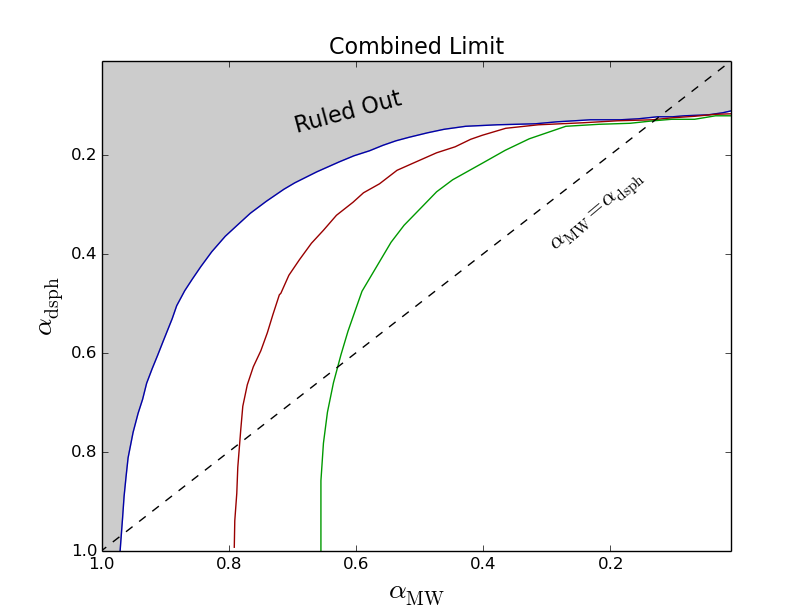
In the analysis described so far, we have assumed . If a smaller inner slope were chosen, we would expect an increase in the best-fit annihilation cross-section for the signal. This would lead to correspondingly more stringent constraints on the dwarf spheroidals. We therefore repeat the calculation for several values of , as well as for Einasto profiles with parameter to produce constraints in the plane and plane, shown in figure 5.
IV Comparison To Simulations and Observation
It has long been suspected that there is a discrepancy between the observed and simulated profiles of dwarf galaxies. For a review of observational evidence and evidence from numerical simulations, see deBlok:2009sp . Early attempts to fit the observational data to an analytic profile Moore:1994yx ; Flores:1994gz showed that dwarf galaxies are well characterized as having a constant density core () following an isothermal profile:
| (6) |
where is the central density and is the core radius. A variation on the isothermal profile, the Burkert profile Burkert:1995yz was later introduced to account for observations indicating that the density falls off as at large radii:
| (7) |
Numerous other groups have found evidence for cored, rather than cuspy, halos in dwarf galaxies Burkert:1997td ; vandenBosch:2000rza ; Salucci:2002nc ; Gentile:2006hv
Few studies present a numerical best fit value for the inner slope, instead typically comparing the NFW () model to an isothermal or Burkert profile (). Those that do (several examples of which are listed below) tend to find values of . In their measurement of the dwarf irregular galaxy NGC 6822, ref. Weldrake:2002ri finds an inner slope between to depending on the resolution chosen. Spekkens et al. Spekkens:2005ik have derived density profiles for 165 low-mass galaxies including dwarf galaxies based on their rotation curves to find median inner slopes of to depending on the subsample considered.
Numerical simulations of cold dark matter (CDM) halos, on the other hand, have typically found values of the inner slope greater than . Early numerical simulations of CDM halos were well characterized by the NFW profile of equation (3) with Dubinski:1991bm ; Navarro:1996gj ; Colin:2003jd for halos of all sizes. Others pointed towards an even steeper slope of Moore:1999gc ; Klypin:2000hk or an intermediate value of Diemand:2005wv . Despite this variation, there is general agreement that pure CDM simulations result in inner slopes of .
Some simulations instead found that the slope continues to become more shallow at smaller radii but does not convergeNavarro:2003ew ; Hayashi:2003sj . The Einasto profile, eq. (5)Merritt:2005xc ; Graham:2006ae , parameterizes this kind of behaviour. It describes a cored profile at large values of and becomes cuspier for small values of order . Ref. Navarro:2008kc found CDM simulations are well described by , which even at provide a slope of , and therefore for our purposes represents a cuspy profile.
It is clear that our results for the inner slopes of dwarf spheroidal halos, while compatible with observation, are not compatible with traditional CDM simulations. Our results favour values of . They also favour , which would suggest that the inner slope of the Milky Way’s profile is steeper than that of dwarf spheroidals.
V Beyond CDM
The core/cusp controversy is by no means new, and Weinberg:2013aya reviews it in great detail. Many mechanisms have been proposed through which baryonic matter can have a feedback effect on the dark matter halo in the hopes of giving a more cored halo, but the results have been mixed. These mechanisms include rotating barsWeinberg:2001gm (however later studies argue that this might actually have the opposite effectDubinski:2008rn ) and the heating of cusps by dynamical frictionElZant:2001re ; Tonini:2006gwz ; RomanoDiaz:2008wz (however again, others find that this process is insufficient to explain cored profilesJardel:2008bi ). Another possibility is feedback from supernovaePontzen:2011ty ; Governato:2012fa ; in these simulations repeated feedback from supernovae can turn a cusp into a core. Although viable baryonic mechanisms have been proposed to explain the discrepancy, its ultimate source remains an open question.
Although the standard CDM paradigm is difficult to render consistent with cored profiles, some dark matter models address this issue. Models of warm dark matter (WDM) such as sterile neutrinos rely on the particles having large velocities during structure formation, giving them a free-streaming length with a similar scale to galaxies. This smooths out density fluctuations on scales less than the free streaming length, and is borne out in simulations of WDM halos, giving dwarf sized halos a more cored profileAvilaReese:2000hg ; Colin:2007bk ; Dunstan:2011bq ; Maccio:2012qf ; Schneider:2013wwa ; Angulo:2013sza , though WDM still faces some challenges, including conflict with the small scale power spectrum Polisensky:2010rw , tension with strong-lens system observations which show evidence for a larger subhalo population than would be produced by WDM Dalal:2001fq , and challenges from observations of the Lyman- forest which sets a lower limit on the dark matter mass of a few keV Seljak:2006qw ; Viel:2007mv . Regarding the specific values of , ref. Gonzalez-Samaniego:2015sfp compares CDM and WDM simulations and find - for CDM and - for WDM.
Another solution to the cusp-core problem is self-interacting dark matter (SIDM), in which cold dark matter has weak-scale interactions or no interactions at all with baryonic matter but a large self-interaction cross section. When the scattering cross section is of the order -, dark matter halos naturally form coresSpergel:1999mh ; Rocha:2012jg ; Peter:2012jh .
An interesting possibility is that of dark matter self-interacting through a light mediator. This results in a scattering cross section inversely proportional to velocity, causing greater self-interactions in dwarf galaxies than in galaxies or clustersLoeb:2010gj . For some choices of parameters, the cross section can be up to 100 times greater at velocities typically found in dwarf galaxies than for larger galaxies, which allows cored profiles to form for dwarfs but not for larger halos. These results correspond well to those presented here: the dwarf spheroidal halos are constrained to be more cored than that of the Milky Way. This ‘dark force’ scattering can be further enhanced at dwarf-scale velocities by resonances, and the coupling can even be chosen such that the correct relic density is reproduced Tulin:2012wi ; Tulin:2013teo ; Kaplinghat:2015aga .
As WDM and SIDM are able to create cored halos, our results are consistent with these models which depart from the traditional CDM model. This implies that the GCE, if it does prove to originate from annihilating dark matter, would provide evidence in favour of these non-CDM cosmologies.
Acknowledgments
I would like to thank James Cline and Jonathan Cornell for their ideas and assistance in preparing and reviewing this work. I also thank Matthew Walker for helpful correspondence and Marla Geha for providing us with the stellar kinematic data for several dwarf galaxies through private correspondence. This work was done with the support of the McGill Space Institute and the Natural Sciences and Engineering Research Council of Canada.
Appendix A Maximum Likelihood Method
We adopt the method of Geringer-Sameth et. al Geringer-Sameth:2014yza to calculate the halo parameters using the maximum likelihood method. They argue that the velocity data sample a Gaussian distribution, and therefore adopt the likelihood Geringer-Sameth:2014yza :
| (8) |
where and are the observed line of sight velocity and uncertainty, is the mean velocity of the dwarf, and is the velocity dispersion at the projected position of the observed star.
The velocity dispersion is the model dependent quantity, and has the form Mamon:2004xk
| (9) |
for an isotropic halo. is the mass contained within the given radius, and and are the stellar density and luminosity profiles respectively.
For a halo in which stars are distributed according to a Plummer profile Geringer-Sameth:2014yza , the ratio of these profiles is given by
| (11) |
where is the half-light radius.
| Dwarf Galaxy | b | Ref. | |||||||||
| [kpc] | [GeV/cm3] | ||||||||||
| Carina | Walker:2008ax | ||||||||||
| Draco | Walker:2015 | ||||||||||
| Fornax | Walker:2008ax | ||||||||||
| Leo I | Mateo:2007xh | ||||||||||
| Leo II | Koch:2007ye | ||||||||||
| Sculptor | Walker:2008ax | ||||||||||
| Sextans | Walker:2008ax | ||||||||||
| Bootes I | Koposov:2011zi | ||||||||||
| Hercules | Simon:2007dq a | ||||||||||
| Leo V | Walker:2009iq | ||||||||||
| Segue 1 | Simon:2010ek | ||||||||||
| Segue 2 | Kirby:2013isa | ||||||||||
| Canes Venatici I | Simon:2007dq a | ||||||||||
| Canes Venatici II | Simon:2007dq a | ||||||||||
| Coma Berenices | Simon:2007dq a | ||||||||||
| Leo Tc | Simon:2007dq a | ||||||||||
| UrsaMajor I | Simon:2007dq a | ||||||||||
| UrsaMajor II | Simon:2007dq a | ||||||||||
| a Unpublished, provided by private correspondence. | |||||||||||
| b For missing data, see explanation in text. | |||||||||||
| c Due to lack of FERMI-LAT data, this dwarf is excluded from constraints on . | |||||||||||
| Dwarf Galaxy | Ref. | ||||||||||
| [kpc] | [GeV/cm3] | ||||||||||
| Carina | Walker:2008ax | ||||||||||
| Draco | Walker:2015 | ||||||||||
| Fornax | Walker:2008ax | ||||||||||
| Leo I | Mateo:2007xh | ||||||||||
| Leo II | Koch:2007ye | ||||||||||
| Sculptor | Walker:2008ax | ||||||||||
| Sextans | Walker:2008ax | ||||||||||
| Bootes I | Koposov:2011zi | ||||||||||
| Hercules | Simon:2007dq a | ||||||||||
| Leo V | Walker:2009iq | ||||||||||
| Segue 1 | Simon:2010ek | ||||||||||
| Segue 2 | Kirby:2013isa | ||||||||||
| Canes Venatici I | Simon:2007dq a | ||||||||||
| Canes Venatici II | Simon:2007dq a | ||||||||||
| Coma Berenices | Simon:2007dq a | ||||||||||
| Leo Tc | Simon:2007dq a | ||||||||||
| UrsaMajor I | Simon:2007dq a | ||||||||||
| UrsaMajor II | Simon:2007dq a | ||||||||||
| a Unpublished, provided by private correspondence. | |||||||||||
| c Due to lack of FERMI-LAT data, this dwarf is excluded from constraints on . | |||||||||||
The mass contained within a given radius is attained by integrating the chosen density profile:
| (13) |
For each dwarf spheroidal we minimize the negative log likelihood for and again for (for the NFW and Einasto profiles respectively) over the parameters and . This is accomplished using the downhill simplex method over the two parameters. The best fit values of and are shown in table 2 for several values of and in table 3 for , the Einasto profile parameter.
Best fit values are not available for some dwarf galaxies for (or greater). The likelihood in these cases approaches its maximum value only as and . This is due to the nature of the NFW profile, which has its shallowest log slope at , with the slope becoming steeper at greater distances. In these cases, therefore, the slope is inconsistent with the stellar kinematic data. In these cases the fit can always be made better by increasing to grant a smaller log slope (approaching a uniform log slope of ) and reducing the density to compensate.
References
- (1) L. Goodenough and D. Hooper, (2009), 0910.2998.
- (2) D. Hooper and L. Goodenough, Phys. Lett. B697, 412 (2011), 1010.2752.
- (3) D. Hooper and T. Linden, Phys. Rev. D84, 123005 (2011), 1110.0006.
- (4) K. N. Abazajian and M. Kaplinghat, Phys. Rev. D86, 083511 (2012), 1207.6047, [Erratum: Phys. Rev.D87,129902(2013)].
- (5) B. Zhou et al., Phys. Rev. D91, 123010 (2015), 1406.6948.
- (6) F. Calore, I. Cholis, and C. Weniger, JCAP 1503, 038 (2015), 1409.0042.
- (7) T. Daylan et al., Phys. Dark Univ. 12, 1 (2016), 1402.6703.
- (8) S. Murgia, presented at Fifth Fermi Symposium, 20- 24 Oct. 2014, http://fermi.gsfc.nasa.gov/science/mtgs/ symposia/2014/program/08 Murgia.pdf .
- (9) Fermi-LAT, M. Ajello et al., (2015), 1511.02938.
- (10) S. K. Lee, M. Lisanti, B. R. Safdi, T. R. Slatyer, and W. Xue, (2015), 1506.05124.
- (11) R. Bartels, S. Krishnamurthy, and C. Weniger, (2015), 1506.05104.
- (12) R. M. O’Leary, M. D. Kistler, M. Kerr, and J. Dexter, (2015), 1504.02477.
- (13) T. Linden, Phys. Rev. D93, 063003 (2016), 1509.02928.
- (14) I. Cholis, D. Hooper, and T. Linden, JCAP 1506, 043 (2015), 1407.5625.
- (15) Fermi-LAT, M. Ackermann et al., Astrophys. J. 840, 43 (2017), 1704.03910.
- (16) Fermi-LAT, M. Ajello et al., Submitted to: Astrophys. J. (2017), 1705.00009.
- (17) D. Haggard, C. Heinke, D. Hooper, and T. Linden, (2017), 1701.02726.
- (18) Fermi-LAT, M. Ackermann et al., Phys. Rev. D91, 122002 (2015), 1506.00013.
- (19) K. N. Abazajian and R. E. Keeley, (2015), 1510.06424.
- (20) M. Cirelli et al., JCAP 1103, 051 (2011), 1012.4515, [Erratum: JCAP1210,E01(2012)].
- (21) P. Ciafaloni et al., JCAP 1103, 019 (2011), 1009.0224.
- (22) C. Evoli, D. Gaggero, D. Grasso, and L. Maccione, JCAP 0810, 018 (2008), 0807.4730.
- (23) G. Di Bernardo, C. Evoli, D. Gaggero, D. Grasso, and L. Maccione, JCAP 1303, 036 (2013), 1210.4546.
- (24) Fermi-LAT, M. Ackermann et al., Phys. Rev. Lett. 115, 231301 (2015), 1503.02641.
- (25) W. J. G. de Blok, Adv. Astron. 2010, 789293 (2010), 0910.3538.
- (26) B. Moore, Nature 370, 629 (1994).
- (27) R. A. Flores and J. R. Primack, Astrophys. J. 427, L1 (1994), astro-ph/9402004.
- (28) A. Burkert, IAU Symp. 171, 175 (1996), astro-ph/9504041, [Astrophys. J.447,L25(1995)].
- (29) A. Burkert and J. Silk, Astrophys. J. 488, L55 (1997), astro-ph/9707343.
- (30) F. C. van den Bosch and R. A. Swaters, Mon. Not. Roy. Astron. Soc. 325, 1017 (2001), astro-ph/0006048.
- (31) P. Salucci, F. Walter, and A. Borriello, Astron. Astrophys. 409, 53 (2003), astro-ph/0206304.
- (32) G. Gentile, P. Salucci, U. Klein, and G. L. Granato, Mon. Not. Roy. Astron. Soc. 375, 199 (2007), astro-ph/0611355.
- (33) D. Weldrake, E. de Blok, and F. Walter, Mon. Not. Roy. Astron. Soc. 340, 12 (2003), astro-ph/0210568.
- (34) K. Spekkens and R. Giovanelli, Astron. J. 129, 2119 (2005), astro-ph/0502166.
- (35) J. Dubinski and R. G. Carlberg, Astrophys. J. 378, 496 (1991).
- (36) J. F. Navarro, C. S. Frenk, and S. D. M. White, Astrophys. J. 490, 493 (1997), astro-ph/9611107.
- (37) P. Colin, A. Klypin, O. Valenzuela, and S. Gottlober, Astrophys. J. 612, 50 (2004), astro-ph/0308348.
- (38) B. Moore, T. R. Quinn, F. Governato, J. Stadel, and G. Lake, Mon. Not. Roy. Astron. Soc. 310, 1147 (1999), astro-ph/9903164.
- (39) A. Klypin, A. V. Kravtsov, J. Bullock, and J. Primack, Astrophys. J. 554, 903 (2001), astro-ph/0006343.
- (40) J. Diemand, M. Zemp, B. Moore, J. Stadel, and M. Carollo, Mon. Not. Roy. Astron. Soc. 364, 665 (2005), astro-ph/0504215.
- (41) J. F. Navarro et al., Mon. Not. Roy. Astron. Soc. 349, 1039 (2004), astro-ph/0311231.
- (42) E. Hayashi et al., Mon. Not. Roy. Astron. Soc. 355, 794 (2004), astro-ph/0310576.
- (43) D. Merritt, J. F. Navarro, A. Ludlow, and A. Jenkins, Astrophys. J. 624, L85 (2005), astro-ph/0502515.
- (44) A. W. Graham, D. Merritt, B. Moore, J. Diemand, and B. Terzic, Astron. J. 132, 2701 (2006), astro-ph/0608613.
- (45) J. F. Navarro et al., Mon. Not. Roy. Astron. Soc. 402, 21 (2010), 0810.1522.
- (46) D. H. Weinberg, J. S. Bullock, F. Governato, R. Kuzio de Naray, and A. H. G. Peter, Proc. Nat. Acad. Sci. 112, 12249 (2014), 1306.0913.
- (47) M. D. Weinberg and N. Katz, Astrophys. J. 580, 627 (2002), astro-ph/0110632.
- (48) J. Dubinski, I. Berentzen, and I. Shlosman, IAU Symp. 254, 165 (2009), 0807.4197.
- (49) A. El-Zant, I. Shlosman, and Y. Hoffman, Astrophys. J. 560, 636 (2001), astro-ph/0103386.
- (50) C. Tonini and A. Lapi, Astrophys. J. 649, 591 (2006), astro-ph/0603051.
- (51) E. Romano-Diaz, I. Shlosman, Y. Hoffman, and C. Heller, Astrophys. J. 685, L105 (2008), 0808.0195.
- (52) J. R. Jardel and J. A. Sellwood, Astrophys. J. 691, 1300 (2009), 0808.3449.
- (53) A. Pontzen and F. Governato, Mon. Not. Roy. Astron. Soc. 421, 3464 (2012), 1106.0499.
- (54) F. Governato et al., Mon. Not. Roy. Astron. Soc. 422, 1231 (2012), 1202.0554.
- (55) V. Avila-Reese, P. Colin, O. Valenzuela, E. D’Onghia, and C. Firmani, Astrophys. J. 559, 516 (2001), astro-ph/0010525.
- (56) P. Colin, O. Valenzuela, and V. Avila-Reese, Astrophys. J. 673, 203 (2008), 0709.4027.
- (57) R. M. Dunstan, K. N. Abazajian, E. Polisensky, and M. Ricotti, (2011), 1109.6291.
- (58) A. V. Maccio, S. Paduroiu, D. Anderhalden, A. Schneider, and B. Moore, Mon. Not. Roy. Astron. Soc. 424, 1105 (2012), 1202.1282.
- (59) A. Schneider, D. Anderhalden, A. Maccio, and J. Diemand, Mon. Not. Roy. Astron. Soc. 441, 6 (2014), 1309.5960.
- (60) R. E. Angulo, O. Hahn, and T. Abel, Mon. Not. Roy. Astron. Soc. 434, 3337 (2013), 1304.2406.
- (61) E. Polisensky and M. Ricotti, Phys. Rev. D83, 043506 (2011), 1004.1459.
- (62) N. Dalal and C. S. Kochanek, Astrophys. J. 572, 25 (2002), astro-ph/0111456.
- (63) U. Seljak, A. Makarov, P. McDonald, and H. Trac, Phys. Rev. Lett. 97, 191303 (2006), astro-ph/0602430.
- (64) M. Viel et al., Phys. Rev. Lett. 100, 041304 (2008), 0709.0131.
- (65) A. Gonzalez-Samaniego, V. Avila-Reese, and P. Colin, Astrophys. J. 819, 101 (2016), 1512.03538.
- (66) D. N. Spergel and P. J. Steinhardt, Phys. Rev. Lett. 84, 3760 (2000), astro-ph/9909386.
- (67) M. Rocha et al., Mon. Not. Roy. Astron. Soc. 430, 81 (2013), 1208.3025.
- (68) A. H. G. Peter, M. Rocha, J. S. Bullock, and M. Kaplinghat, Mon. Not. Roy. Astron. Soc. 430, 105 (2013), 1208.3026.
- (69) A. Loeb and N. Weiner, Phys. Rev. Lett. 106, 171302 (2011), 1011.6374.
- (70) S. Tulin, H.-B. Yu, and K. M. Zurek, Phys. Rev. Lett. 110, 111301 (2013), 1210.0900.
- (71) S. Tulin, H.-B. Yu, and K. M. Zurek, Phys. Rev. D87, 115007 (2013), 1302.3898.
- (72) M. Kaplinghat, S. Tulin, and H.-B. Yu, Phys. Rev. Lett. 116, 041302 (2016), 1508.03339.
- (73) A. Geringer-Sameth, S. M. Koushiappas, and M. Walker, Astrophys. J. 801, 74 (2015), 1408.0002.
- (74) G. A. Mamon and E. L. Lokas, Mon. Not. Roy. Astron. Soc. 363, 705 (2005), astro-ph/0405491, [Addendum: Mon. Not. Roy. Astron. Soc.370,1582(2006)].
- (75) M. G. Walker, M. Mateo, and E. Olszewski, Astron. J. 137, 3100 (2009), 0811.0118.
- (76) M. G. Walker, E. W. Olszewski, and M. Mateo, Mon. Not. Roy. Astron. Soc. 448, 2717 (2015), 1503.02589.
- (77) M. Mateo, E. W. Olszewski, and M. G. Walker, Astrophys. J. 675, 201 (2008), 0708.1327.
- (78) A. Koch et al., Astron. J. 134, 566 (2007), 0704.3437.
- (79) S. E. Koposov et al., Astrophys. J. 736, 146 (2011), 1105.4102.
- (80) J. D. Simon and M. Geha, Astrophys. J. 670, 313 (2007), 0706.0516.
- (81) M. G. Walker et al., Astrophys. J. 694, L144 (2009), 0902.3003.
- (82) J. D. Simon et al., Astrophys. J. 733, 46 (2011), 1007.4198.
- (83) E. N. Kirby et al., Astrophys. J. 770, 16 (2013), 1304.6080.