Chaotic delocalization of two interacting particles
in the classical Harper model
Abstract
We study the problem of two interacting particles in the classical Harper model in the regime when one-particle motion is absolutely bounded inside one cell of periodic potential. The interaction between particles breaks integrability of classical motion leading to emergence of Hamiltonian dynamical chaos. At moderate interactions and certain energies above the mobility edge this chaos leads to a chaotic propulsion of two particles with their diffusive spreading over the whole space both in one and two dimensions. At the same time the distance between particles remains bounded by one or two periodic cells demonstrating appearance of new composite quasi-particles called chaons. The effect of chaotic delocalization of chaons is shown to be rather general being present for Coulomb and short range interactions. It is argued that such delocalized chaons can be observed in experiments with cold atoms and ions in optical lattices.
pacs:
05.45.Mt Quantum chaos; semiclassical methods and 72.15.Rn Localization effects (Anderson or weak localization) and 67.85.-d Ultracold gases1 Introduction
The Harper model describes a quantum dynamics of an electron in a two-dimensional periodic potential (2D) and a perpendicular magnetic field harper . Due to periodicity of potential the problem can be reduced to the Schrödinger equation on a discrete quasiperiodic one-dimensional (1D) lattice. This equation is characterized by a dimensionless Planck constant determined by a magnetic flux through the lattice cell. The fractal spectral properties of this system have been discussed in azbel and the fractal structure of its spectrum was directly demonstrated in hofstadter .
For typical irrational flux values the system has a Metal-Insulator Transition (MIT) established by Aubry and André aubry . The MIT takes place when the amplitude of the quasiperiodic potential (with hopping being unity) is changed from (metallic or delocalized phase) to (insulator or localized phase). A review of the properties of the Aubry-André model can be found in sokoloff and the mathematical prove of MIT is given in lana1 . The stationary Schrödinger equation of the system has the form
| (1) |
or in the operator representation
| (2) |
where are momentum and coordinate operators with the usual commutator sokoloff .


From the view point of classical dynamics the critical value is very natural. Indeed, the dynamics is described by the classical Hamiltonian
| (3) |
with commuting conjugated variables in (2). For the maximal value of kinetic term is smaller than the potential barrier and a particle cannot overcome the barrier being localized in coordinate space (all equipotential curves are vertical on the phase plane ). In the opposite case the maximal value of potential barrier is smaller than the kinetic term and at certain energies a particle can propagate ballistically along . Examples of phase space curves for the classical localized phase at are shown in Figure 1. The energy of the system is restricted to the interval . At and the separatrix lines , go to infinity covering the whole phase space ( are integers).
Of course, the behavior of quantum system is much more subtle due to presence of quantum tunneling so that highly skillful mathematical methods are required to prove quantum localization of eigenstates at typical irrational flux value and to extend analysis to more general hopping terms (see lana1 ; lana2 ; lana3 ). The numerical studies of the quantum model can be found at geisel ; austin .
The investigation of interaction effects between particles in the 1D quantum Harper model was started in dlsharper with the Hubbard interaction of Two Interacting Particles (TIP). It was found that the interaction creates TIP localized states in the regime when all eigenstates of noninteracting particles are delocalized in the 1D Harper model (metallic phase at ). Further studies also found enhancement of localization effects in presence of interactions barelli ; orso . This localization enhancement is opposite to the TIP effect in disordered systems where the interactions increase the TIP localization length in 1D dlstip ; imry ; pichard ; frahm1995 ; vonoppen ; frahm1999 ; frahm2016 or even lead to delocalization of TIP pairs for dimensions borgonovi ; dlscoulomb ; lagesring . Thus interactions between two particles in systems with disorder can even destroy the Anderson localization existing for noninteracting particles. The tendency in the 1D Harper model seemed to be an opposite one.
Thus the results obtained in flach on the appearance of delocalized TIP pairs in the 1D quantum Harper model, for certain particular values of interaction strength and energy, in the regime, when all one-particle states are exponentially localized, is really surprising. The recent advanced studies confirmed the existence of so called Freed by Interaction Kinetic States (FIKS) with delocalized quasiballistic FIKS pairs, existing at various irrational flux values, propagating over the whole large system sizes fiks1d . The studies of TIP on the 2D Harper model showed the presence of subdiffusive delocalization of TIP but found no signs of quasiballistic states fiks2d .
At present the skillful experiments with cold atoms in optical lattices allowed to realize the 1D Harper model, to observe there the MIT transition for noninteracting particles and to perform studies of interactions roati ; modugno ; bloch . The first steps in experimental study of the 2D Harper model are reported recently bloch2d .
The Harper Hamiltonian (2) appears also in such solid-state systems like incommensurate crystals where a free electron propagation in a finite energy band ( ) is affected by atomic charges creating an effective periodic potential ( ) pokrovsky ; gruner ; brazovski . Indeed, the energy band spectrum like naturally appears in semiconductor heterostructures and superlattices (see e.g. alper ). Hence, the investigation of interaction effects in the Harper model can be relevant also for incommensurate crystals.
In view of this theoretical and experimental progress it is important to obtain a better understanding of the physical origins of FIKS pairs and TIP delocalization in the Harper model. With this aim we study the properties of TIP in the classical Harper model considering the Hamiltonian dynamics in the classical conservative systems with two (and four) degrees of freedom in the 1D (and 2D) Harper model. We show that at rather generic conditions the interactions destroy classical integrability of motion and localization, leading to chaos and chaotic propulsion of TIP characterized by a diffusive spreading in coordinate space.
The paper is composed as follows: Section 2 describes TIP with Coulomb interactions in the 1D Harper model, Section 3 describes TIP with a short range interaction in 1D, Section 4 describes TIP with Coulomb interactions in the 2D Harper model and the discussion of the results is presented in Section 5.
2 TIP with Coulomb interactions in 1D
The classical TIP Hamiltonian in the 1D Harper model reads:
| (4) |
Here is a strength of Coulomb interaction and is a certain screening or regularization length appearing due to quantum smoothing or effective finite distance in 2D. In the following we keep since the results are not very sensitive to value as soon as is smaller than the lattice period in space. Here we use dimensionless units where the lattice spatial period is . In physical units the interaction strength can be measured as where is electron charge and the lattice period.


At we have integrable dynamics of noninteracting particles which is bounded in space inside one periodic cell at any energy. For finite values the invariant Kolmogorov-Arnold-Moser (KAM) curves start to be destroyed by interactions with appearing of chaotic motion chirikov ; lichtenberg with unbounded diffusion of pairs in space. It is clear that particles can diffuse only in pairs since individual particles are localized inside one lattice period due to integrability of one-particle dynamics and energy restrictions discussed above. From the energetic viewpoint a kinetic energy of two particles can become larger than a potential barrier in effective 2D space of TIP that can allow to overcome this barrier leading to extended propagation of TIP. We call such delocalized TIP pairs chaons since they are generated by chaos.
We note that in presence of interactions the allowed energy band of the Hamiltonian (4) is (due to band energy structure and symmetry we consider only the repulsive case ; the attractive case has the same behavior as at ).


The Hamiltonian dynamics of (4) is integrated numerically by the Runge-Kutta method with a typical time step and the relative accuracy of energy conservation being around for times and better than for .
Examples of Poincaré sections lichtenberg at a moderate interaction are shown in Figure 2 for when noninteracting particles are localized inside one coordinate cell. At some energies the dynamics remains integrable (), it can be also chaotic but bounded inside one or two coordinate cells () or to be chaotic and unbounded in coordinate space (). The emergence of chaos induced by interactions is rather natural since the one-particle system is strongly nonlinear.
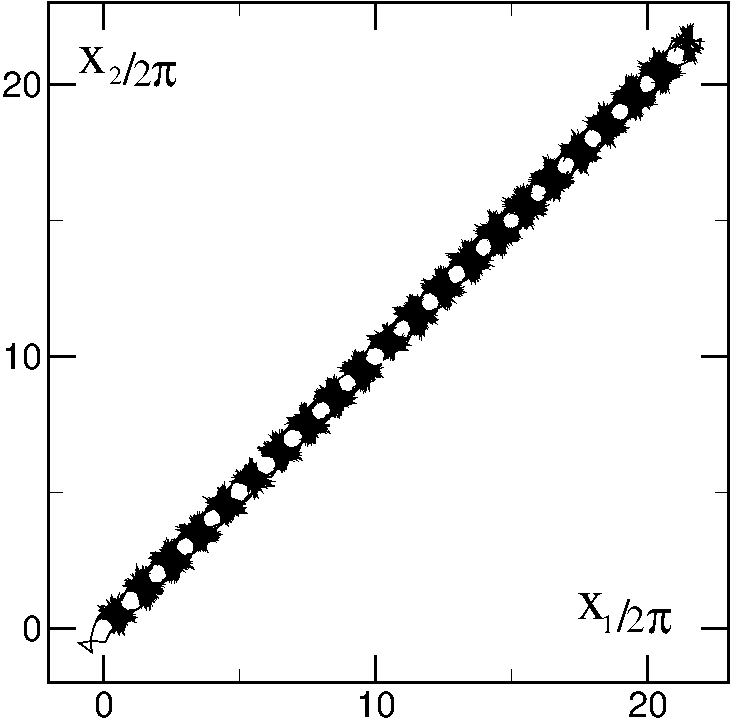
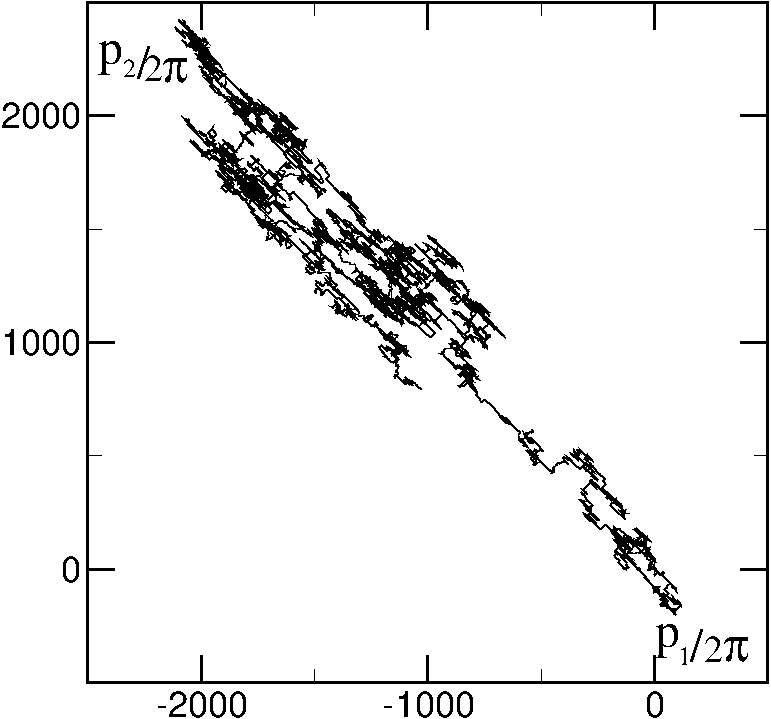
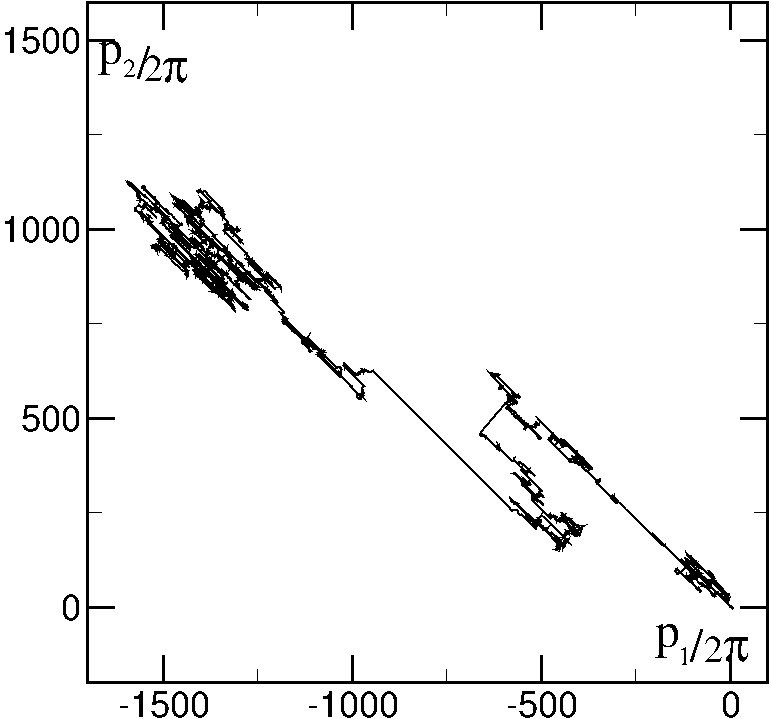
Typical examples of trajectories in coordinate and momentum space are shown in Figure 3 for and . On a scale of a few cells there is a complex, chaotic dynamics of TIP inside a given cell leading to chaotic transitions to nearby cells (top row). In this manner a chaotic propulsion of TIP generates TIP propagation along axis. In all cases of delocalized TIP at the distance between particles is not exceeding (middle row). While in direction the propagation is diffusive (see Figures 4, 5 below) the spreading in momentum remains quasiballistic with approximately linear growth of with time (bottom row); for momentum this is not very surprising since there is a ballistic growth of even for one particle (see Figure 1).


The diffusive nature of TIP propagation and spreading along is directly illustrated in Figures 4, 5. Indeed, the second moment grows linearly with time as , both for and (see Figure 4). These data are averaged over trajectories.


The probability or density distribution W(x,t) of these trajectories in is well described by the Fokker-Planck equation
| (5) |
Indeed, the analytic solution is in a good agreement with the numerical result obtained by averaging over trajectories of (4) at times (see Figure 5).


To determine the dependence of measure and diffusion coefficient on TIP energy we follow trajectories till time . Initially at all trajectories are homogeneously distributed in the phase space with TIP being inside the same cell. Those trajectories with displacements from initial positions being less then the size of 2 cells are considered as non-diffusive. The total measure of diffusive trajectories at all energies is determined as a fraction . The differential distribution is obtained from a histogram with energy interval . The obtained dependence on is shown in Figure 6 for at different interactions. The total measure is rather small at weak interactions ( at ), it increases till optimal values of being comparable with the total energy band width , and then decreases with . The maximum of is located approximately at energy since at the most deformed KAM curves are located at and on average the distance between particles inside one cell is giving a corresponding energy shift.
We note that for the measure of diffusive orbits decreases from down to if the initial positions of second particle are taken in nearby cell (). Indeed, on average this gives a reduction of interactions decreasing the measure of chaos. We should note that at these parameters for all diffusive trajectories the maximal separation of particles during time evolution is not exceeding the size of two cells ().
The energy dependence of diffusion coefficient is shown in Figure 7. The maxima of are approximately at the same energies as in Figure 6, corresponding to developed chaos leading to TIP transitions between nearby cells. Since only a fraction of trajectories are delocalized the fluctuations of from one trajectory to another are significant but averaging over trajectories inside histogram interval gives a reduction of such fluctuations. The diffusion rate can be also estimated as where is an average transition time between two cells. With typical value we obtain being significantly larger then the period of small oscillations of one particle in a vicinity of potential minimum in (2). This shows that many TIP collisions are required to allow a jump from one cell to another.
For the results of Figures 6, 7 show that the measure of diffusive trajectories and their diffusion coefficient are strongly reduced. Indeed, in this case the sum of kinetic terms of two particles is smaller than the potential barrier of one particle and thus the transitions of TIP from one cell to another can take place only in narrow regions of phase space (see Figure 3). This leads to small values of and .
In view of a strong growth of and their large separation growing with time (see Figure 3 bottom panels) it is clear that, for the original Harper system of charged particles in 2D potential (2) and a perpendicular magnetic field, there is no formation of diffusive TIP pairs due to separation of particles in direction which is analogous to in (3).
3 TIP with short range interactions in 1D
The one particle Hamiltonian (3) is strongly nonlinear and it is clear that practically any kind of interaction between particles should leads to appearance of chaotic propulsion of TIP in coordinate space at when all one-particle orbits are bounded to one cell.
As an example we consider the short range interaction
| (6) |
As in the previous section we use .


For this model an example of diffusive growth of the second moment is shown in Figure 8 for , and . For these values of and the measure of delocalized orbits is found to be approximately with in the energy range and close to zero outside. At these parameters the separation between particles does not exceed the cell size (see Figure 8, right panel).
These results demonstrate that the chaotic delocalization of TIP in the 1D Harper model appears also in the case of short range interactions.
4 TIP with Coulomb interactions in 2D
Let us now consider the dynamics of TIP in the 2D classical Harper model. Without interactions the Hamiltonian is the sum of the Hamiltonian (3) in and directions. As in 1D the dynamics of each particle is bounded to a one periodic cell. In presence of smoothed Coulomb interaction the TIP Hamiltonian has the form:
As for 1D case we taken in the following and . The available energy band is restricted to the interval .
As for 1D the dynamics is integrated numerically with approximately the same accuracy. The measure of diffusive trajectories is obtained from orbits homogeneously distribution inside one cell followed till times . The diffusive trajectories are defined as those that have a displacement larger than 3 cells during this time. The dependence of is shown in Figure 8 for at . The total measure at is increased comparing to the 1D case from (1D, Figure 6) to (2D, Figure 9). Indeed, due to a larger number of degrees of freedom in 2D the measure of chaos increases. However, for it becomes more difficult to penetrate through high potential barrier and there are practically no diffusive TIP at .
The data of Figure 9 show the existence of an approximate mobility edge with diffusion inside the energy interval (e.g. for ). Of course, we should note that in 2D there are 4 degrees of freedom and the Arnold diffusion can still lead to a small measure of diffusive orbits along chaotic separatrix layers chirikov ; lichtenberg , but their measure drops exponentially for and .


The dependence of the TIP diffusion coefficient on energy , determined from the relation , is shown in Figure 10 for parameters of Figure 9. The typical values of in 2D are by factor smaller than those in 1D (see Figure 7, e.g. at ). We attribute this to a larger volume of chaotic motion so that an effective pressure of one particle on another, which allows to overcome the potential barrier, becomes smaller and TIP needs more time to find a narrow channel leading to a transition from one cell to another. For the diffusion drops approximate in times comparing to in the agreement with the fact that here very specific combinations of all coordinates are required to overcome the potential barrier.
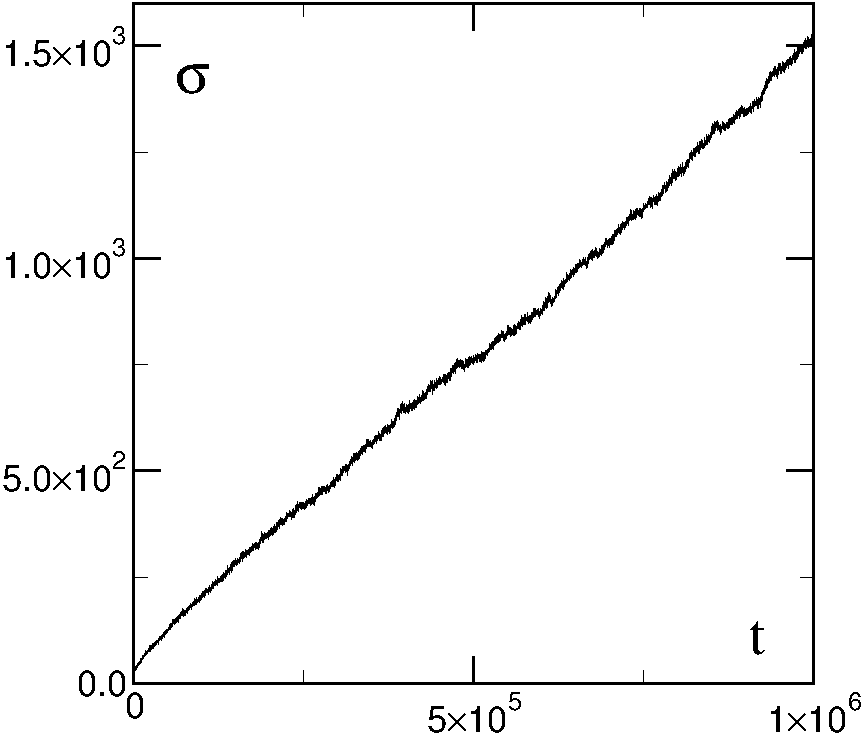
Due to a small values of the diffusion rate the fluctuations of and are larger for 2D case comparing to 1D. An example of a more exact computation of is shown in Figure 11 where the second moment is characterized by a linear growth with time reaching rather high values. Thus with large times and large number of trajectories the diffusion coefficient is determined with a high precision. Even if in Figure 11 has large values corresponding to TIP displacement on a typical distance of 16 cells the maximal distance between two particles remains small for and respectively for at .
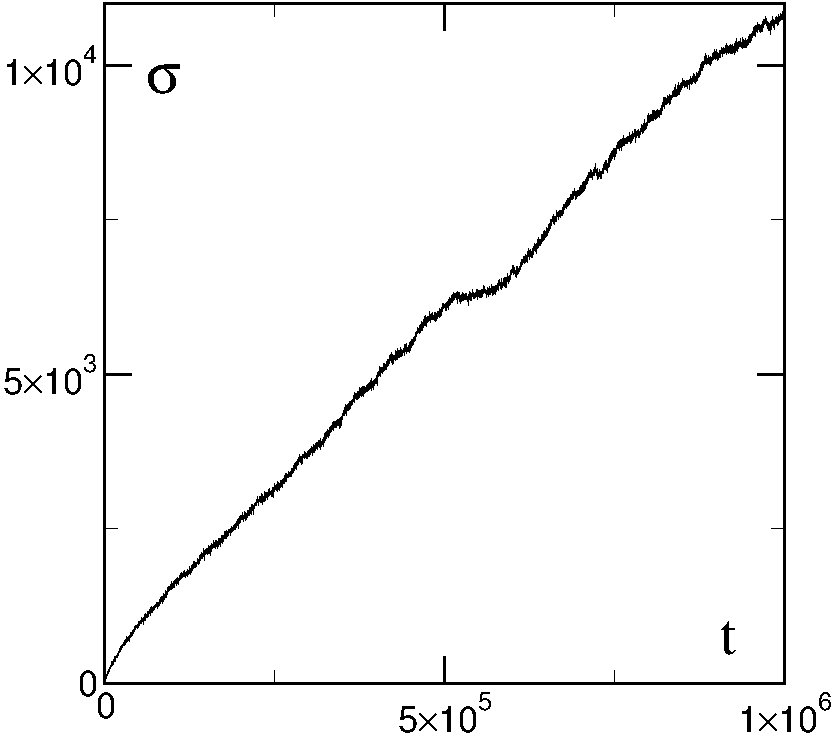
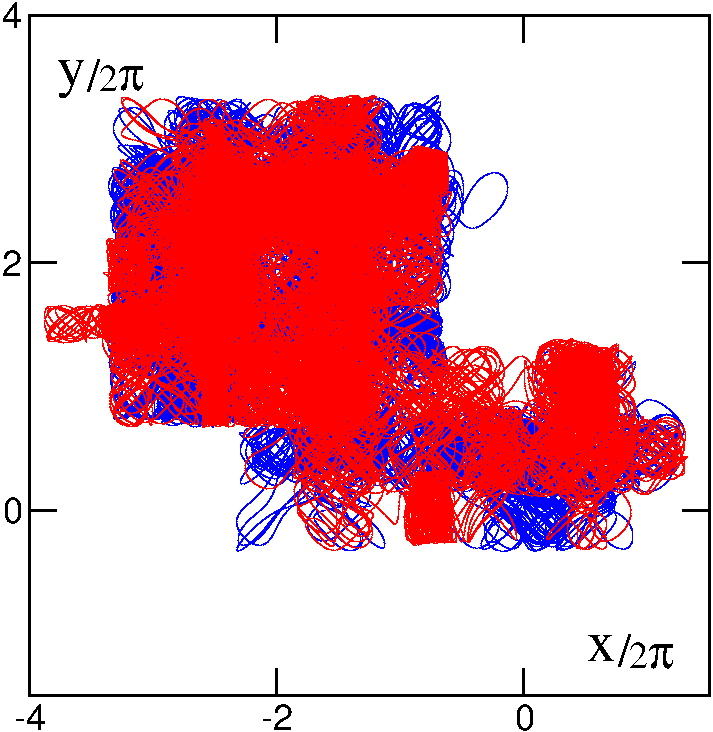
An example of complex chaotic motion of TIP on small scales at and is shown in Figure 12. During this time particles make a displacement of up to 5 cells while the distance between them remains less than 2 cells.
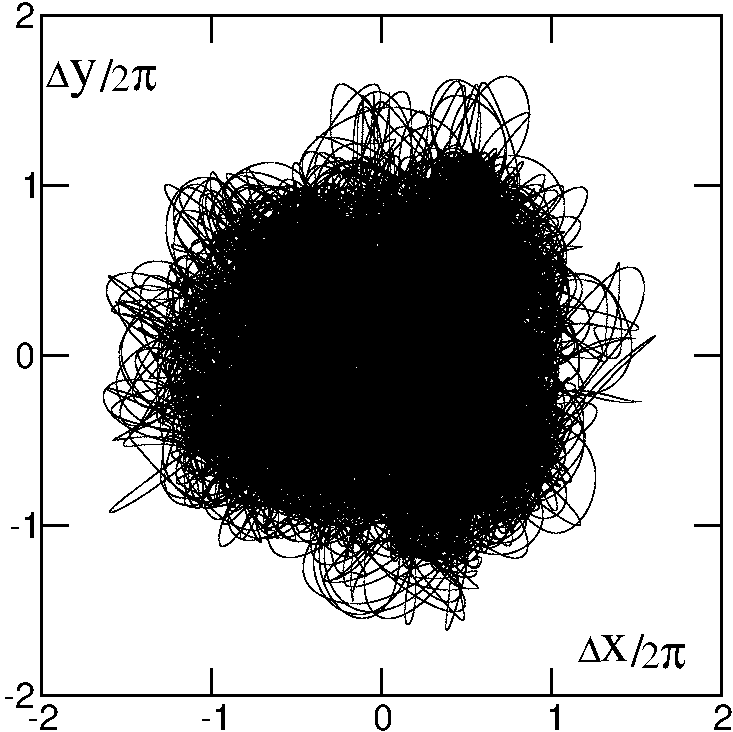
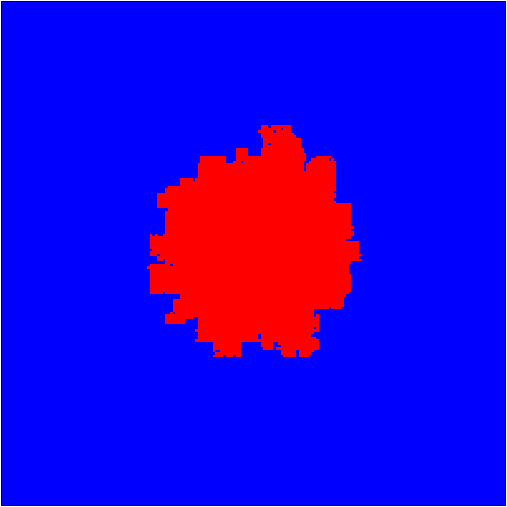
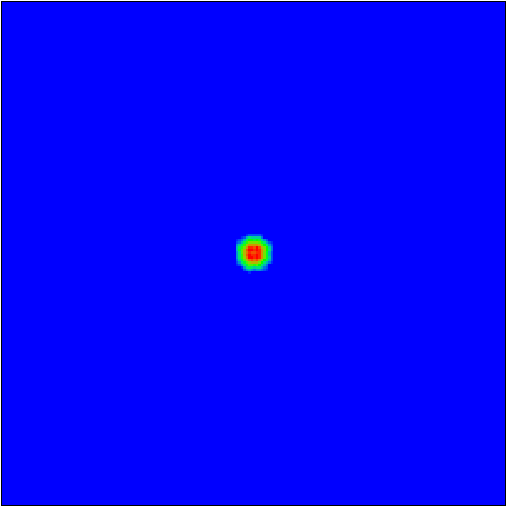
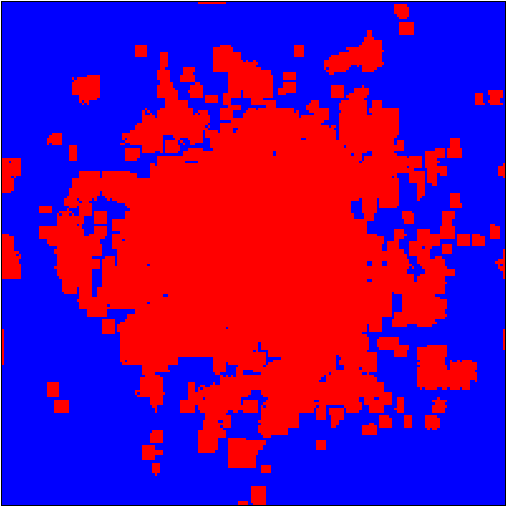
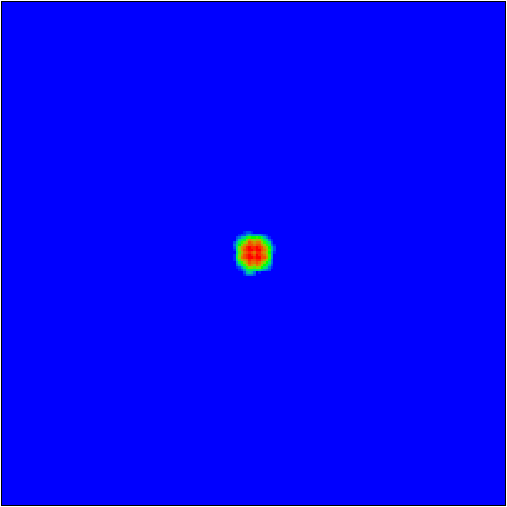
The spreading of TIP trajectories with time is illustrated in Figure 13. While with time TIP cover larger and larger area in plane their relative distance in number of cells remains less than 2.5. Isolated fragments visible in the bottom left panel of Figure 13 are generated by trajectories which gained a large TIP displacement but then due to fluctuations are stacked in a few cells on the time interval of averaging .
A more detailed verification of the validity of the Fokker-Planck equation in 2D (similar to Figure 5) requires averaging over larger number of trajectories and larger times due to smaller values of the diffusion coefficient in 2D and we do not perform such a comparison here considering that the linear growth of the second moment on large times in Figure 11 provides a sufficient confirmation of the diffusive TIP propagation in the 2D Harper model.
Finally, we note that the chaotic dynamics is also found in numerical simulations with the kinetic TIP spectrum , instead of in (4) or (4). However, for such a spectrum at energies above the potential barrier it is found that particles become separated from each other with one escaping to infinity and another one remaining trapped by a potential so that a joint propagation of TIP is not detected in the cases which have been studied numerically.
5 Discussion
The presented results clearly show that for the classical Harper model in 1D and 2D the interactions between two particles lead to emergence of chaos and chaotic propulsion of TIP with their diffusive spreading over the whole lattice. Such an interaction induced diffusion appears in the regime when without interactions particle motion is bounded to one cell of periodic potential. For diffusive delocalized TIP dynamics the relative distance between particles remains always smaller than the size of one to three periodic cells. In this sense the delocalized chaotic TIP represent a well defined new type of quasiparticles which we call chaons due to the chaos origin of their diffusive propagation over the whole system.
The chaon diffusion takes place inside a certain energy range of delocalized chaotic dynamics for a moderate interaction strength being comparable or even smaller then the one-particle energy band. Our results show that about a half of all energy band width can belong to delocalized dynamics. The energies play a role of mobility edge in energy. Of course, at very weak interactions the KAM integrability is restored keeping the TIP dynamics bounded inside one periodic cell. Since the Harper model is strongly nonlinear the chaotic delocalization takes plays for a broad range of interactions including the long range Coulomb interaction and a short range interaction.
The question about the quantum manifestations of this classical chaon delocalization is open for further investigations. It is possible that the quasiballistic FIKS pairs in the 1D quantum Harper model flach ; fiks1d appear as a result of quantization of classical chaons. Indeed, it is known that in the quasiperiodic quantum systems, which are chaotic and diffusive in the classical limit, the quantization can create quasiballistic delocalized states like it is the case in the kicked Harper model (see results and Refs. in lima ; ketzmerick ; prosen ; artuso ). However, the investigations of quantum chaons and their possible relation with FIKS pairs requires further studies. The results presented in flach ; fiks1d are mainly done for the Hubbard interaction or a short range interaction on a discrete lattice and a semiclassical limit for such interactions is not so straightforward. Indeed, the semiclassical regime requires a smooth potential variation and a large number of quantum states inside one potential period. It is possible that the semiclassical description can work even at moderate values of but a detailed analysis of semiclassical description of such cases is required. The quantum interference effects may lead to the quantum localization of chaon diffusion in a similar way as for the Anderson localization of TIP in 1D and 2D (see discussions for TIP in disordered potential in dlstip ; imry ; pichard ; dlscoulomb ). However, in the care of quasiperiodic potential, appearing for irrational values, the situation is rather nontrivial as show the results of subdiffusive spreading for TIP in the 2D quantum Harper model fiks2d .
The experimental investigations of diffusive chaons in the Harper model look to be promising. Indeed, the Aubry-André transition has been observed already with cold atoms in optical lattices and it has been shown that the interaction effects play here an important role roati ; modugno ; bloch . The experimental progress with cold ions in optical lattices (see e.g. blatt ; vuletic1 ; vuletic2 ) makes possible to study delocalized chaons with Coulomb interactions.
The author thanks Klaus Frahm for fruitful discussions of TIP properties and Vitaly Alperovich for discussions of possible realizations of considered Hamiltonian in semiconductor heterostructures.
References
- (1) P.G. Harper, Proc. Phys. Soc. London Sect. A 68, 874 & 879 (1955).
- (2) M.Y. Azbel, Sov. Phys. JETP 19, 634 (1964).
- (3) D.R. Hofstadter, Phys. Rev. B 14, 2239 ̵͑(1976).
- (4) S. Aubry and G. André, Ann. Israel Phys. Soc. 3, 133 (1980).
- (5) J.B. Sokoloff, Phys. Rep. 126, 189 (1985).
- (6) S.Y. Jitomirskaya, Ann. Math. 150, 1159 (1999).
- (7) J. Bourgain, and S. Jitomirskaya, Invent. Math. 148, 453 (2002).
- (8) A.Avila, S. Jitomirskaya and C.A.Marx, Ann. Math. arXiv:1602.05111v1[math-ph] (2016).
- (9) T. Geisel, R. Ketzmerick, and G. Petschel, Phys. Rev. Lett. 66, 1651 (1991).
- (10) M. Wilkinson, and E.J. Austin, Phys. Rev. B 50, 1420 (1994).
- (11) D.L. Shepelyansky, Phys. Rev. B 54, 14896 (1996).
- (12) A. Barelli, J. Bellissard, Ph. Jacquod, and D.L. Shepelyansky, Phys. Rev. Lett. 77, 4752 (1996).
- (13) G. Dufour, and G. Orso, Phys. Rev. Lett. 109, 155306 (2012).
- (14) D.L. Shepelyansky, Phys. Rev. Lett. 73, 2607 (1994).
- (15) Y. Imry, Europhys. Lett. 30, 405 (1995).
- (16) D. Weinmann, A. Muller–Groeling, J.-L. Pichard, and K. Frahm, Phys. Rev. Lett. 75, 1598 (1995).
- (17) K. Frahm, A. Muller–Groeling, J.-L. Pichard, and D. Weinmann, Europhys. Lett. 31, 169 (1995).
- (18) F. von Oppen, T. Wetting, and J. Muller, Phys. Rev. Lett. 76, 491 (1996).
- (19) F. Borgonovi, and D.L. Shepelyansky, J. de Physique I France 6, 287 (1996).
- (20) K.M. Frahm, Eur. Phys. J. B, 10, 371 (1999).
- (21) D.L. Shepelyansky, Phys. Rev. B 61, 4588 (2000).
- (22) J. Lages, and D.L. Shepelyansky, Eur. Phys. J. B 21, 129 (2001).
- (23) K.M. Frahm, Eur. Phys. J. B, XX, XXX (2016); arXiv:1602.08257[cond-mat.quant-gas] (2016).
- (24) S. Flach, M. Ivanchenko, and R. Khomeriki, Europhys. Lett. 98, 66002 (2012).
- (25) K.M. Frahm, and D.L. Shepelyansky, Eur. Phys. J. B 88, 337 (2015).
- (26) K.M. Frahm, and D.L. Shepelyansky, Eur. Phys. J. B 89, 8 (2016).
- (27) G. Roati, C. D‘Errico, L. Fallani, M. Fattori, C. Fort, M. Zaccanti, G. Modugno, M. Modugno, and M. Inguscio, Nature 453, 895 (2008).
- (28) E. Lucioni, B. Deissler, L. Tanzi, G. Roati, M. Zaccanti, M. Modugno, M. Larcher, F. Dalfovo, M. Inguscio, and G. Modugno, Phys. Rev. Lett. 106, 230403 (2011).
- (29) M. Schreiber, S.S. Hodgman, P. Bordia, H. Luschen, M.H. Fischer, R. Vosk, E. Altman, U. Schneider, and I. Bloch, Science 349, 842 (2015).
- (30) P. Bordia, H.K. Luschen, S.S. Hodgman, M. Schreiber, I. Bloch, and U. Schneider, http://arxiv.org/abs/1509.00478 (2015).
- (31) V.L. Pokrovsky and A.L. Talapov, Theory of Incommensurate Crystals, Harwood, London v.1 (1984).
- (32) G. Gruner, Density Waves in Solids, Addison-Wesley Publ. Company, New York (1994).
- (33) S.A.Brazovskii, Ferroelectricity and charge ordering in quasi-1D organic conductors, in The Physics of Organic Superconductors and Conductors A.Lebed (Ed.), p.313, Springer-Verlag, Berlin (2008).
- (34) V.L. Alperovich, N.T. Moshegov, V.A. Tkachenko, O.A. Tkachenko, A.I.Toropov, and A.S.Yaroshevich, Pis’ma ZhETF 70, 112 (1999) [in Russian].
- (35) B.V. Chirikov, Phys. Reports 52, 263 (1979).
- (36) A.J.Lichtenberg, M.A.Lieberman, Regular and chaotic dynamics, Springer, Berlin (1992).
- (37) R. Lima, and D.L. Shepelyansky, Phys. Rev. Lett. 67, 1377 (1991).
- (38) R. Ketzmerick, K. Kruse, and T. Geisel, Physica D 131, 247 (1999).
- (39) T. Prosen, I. I. Satija, and N. Shah, Phys. Rev. Lett. 87, 066601 (2001).
- (40) R. Artuso, Scholarpedia 6(10), 10462 (2011).
- (41) P. Jurcevic, P. Hauke, C. Maier, C. Hempel, B.P. Lanyon, R. Blatt, and C.F. Roos, Phys. Rev. Lett. 115, 100501 (2015).
- (42) A. Bylinskii, D. Gangloff, and V. Vuletic, Science 348, 1115 (2015).
- (43) A. Bylinskii, D. Gangloff, I. Counts and V. Vuletic, Nature Materials doi:10.1038/nmat4601 (2016).