Measuring the local GitHub developer community
Abstract
Creating rankings might seem like a vain exercise in belly-button gazing, even more so for people so unlike that kind of things as programmers. However, in this paper we will try to prove how creating city (or province) based rankings in Spain has led to all kind of interesting effects, including increased productivity and community building. We describe the methodology we have used to search for programmers residing in a particular province focusing on those where most population is concentrated and apply different measures to show how these communities differ in structure, number and productivity.
1 Introduction
One of the keys to create a community is to actually identify who is part of it and how they participate. As part of the effort by the Free Software Office of the University of Granada, we have tried, through the years, to know who is involved in the creation of open source projects. However, the only way of finding out who was is to make them come to any of our events or contact us through any means.
So the initial intention for creating a ranking of FLOSS (Free/Libre/Open/Source Software) was to know who is out there and the kind of things they are doing, be them part of the academic world or outside it, in business; creating a census would allow us to discover new FLOSS developers in our own city and even to collaborate with them.
So we used initially the GitHub top-1000 generation script by Paul Miller to achieve that, making small modifications to the source and creating our own version, which was eventually moved to a new repository. But this had several effects. First, as soon as the ranking was published some people contacted us and the first GitHub meet-up in Granada took place. More modifications and changes were added and new data was obtained. As part of the code tests, more cities were tested and we ended up with lots of data. And data begs for analysis, which we eventually started to do. And, along the way, we built a community of users that previously had not known each other. We discovered that the only fact that a census exists does not imply that there is a community, but it definitely helps. We have had some experience with this kind of reactions in the past. In [TRM03] we did some studies on social network analysis and other measures of the Spanish-speaking blogosphere. Then, the reactions were two fold: on one side, people showed big interest in the index in order to be listed there; some blog providers provided also data. On the other side, people that were expecting to appear in better positions were a bit angry about it111You can see some of the discussions and links -unfortunately most of them do not work- at: http://www.blogalia.com/historias/7744 (in Spanish). Anyway we feel that self-consciousness is always a good thing and this work can serve as a driving force for more code sharing and increase relations among developers.
In this paper, using the tool that we have created for searching for the users in particular cities or provinces, we will show how the GitHub activity in these cities or provinces compare with each other and what kind of characteristics they have, including basic metrics. We will also delve into the effect of publishing the ranking itself, which has surprisingly increased the productivity of all communities measured. Finally, we will try to draw some conclusions on how measuring activity affects that activity and what are the general characteristics of open source developers in the provinces measured, which are the top 20 in population in Spain.
Coming up next we will review different papers that deal with creating lists and rankings of contributions and trying to measure or explain the dynamics of communities. In section 3 we will show the methodology for obtaining the users in a particular province in Spain; next we will analyze data obtained and show how different provinces stack up in terms of contributions and finally we will draw some conclusions.
2 State of the art
Geographically based community metrics have had some attention in the last years [GBRAIG08, TH10, vEFS13] but they do not seem to have arisen a lot of interest in the FLOSS metrics [HICRH+09] community. Most efforts seem to be focused in creating tools for actually measuring repositories for activity; for instance, Laura Arjona describes the Debian Contributors tool in [AR14] whose results are dumped to a website that includes information on the projects that every user has contributed and some other data such as how users are identified in the databases. However, geography seems to be relevant in human interactions even when we are in Internet, where one could expect this factor to be less important. See, for example, ‘Visualizing Friendships’222https://www.facebook.com/notes/facebook-engineering/visualizing-friendships/469716398919 where the authors studied interactions inside the Facebook social network, or [RSC+10] where the subject of analysis are phone calls. We can see that even when there is technology-mediated communication, the geography seems to be an important driver.
It is interesting to note that some models [RMGGB05] use the concept of stigmergy, that is, interaction using the environment, to model the dynamics of libre software projects; the mere existence of these tools can be a catalyst of this interaction and the harbinger of new software projects. In fact, this seems to be what has happened in the community (or communities) under observation: the mere creation of a document that mentions many different users acts as a substrate that allows the creation and growth of the community through the stigmergy paradigm.
Next we will briefly explain the tool that was designed to search for geographically based GitHub users.
3 GitHub city rankings, the tool
| province | population | users | contributions | stars | followers |
|---|---|---|---|---|---|
| Alicante | 1852789 | 52 | 4941 | 255 | 276 |
| Asturias | 1054408 | 59 | 8121 | 584 | 358 |
| Baleares | 1121739 | 31 | 2037 | 361 | 212 |
| Barcelona | 5435373 | 808 | 108576 | 35070 | 16836 |
| Bilbao | 1138090 | 84 | 9071 | 1912 | 1475 |
| Cádiz | 1247884 | 44 | 2497 | 604 | 401 |
| Córdoba | 796680 | 65 | 3821 | 298 | 371 |
| Coruña | 1130354 | 60 | 4551 | 1049 | 462 |
| Gerona | 741017 | 29 | 2078 | 894 | 346 |
| Granada | 919663 | 182 | 29610 | 1416 | 1243 |
| Las Palmas | 1102750 | 56 | 3031 | 548 | 298 |
| Madrid | 6376610 | 798 | 143739 | 37003 | 13375 |
| Málaga | 1626168 | 86 | 7356 | 926 | 528 |
| Murcia | 1463797 | 37 | 2893 | 752 | 272 |
| Pontevedra | 948588 | 55 | 2939 | 1065 | 417 |
| Sevilla | 1937412 | 115 | 11385 | 1255 | 1186 |
| Tarragona | 792868 | 21 | 1353 | 160 | 121 |
| Tenerife | 1017785 | 60 | 5816 | 577 | 591 |
| Valencia | 2521771 | 215 | 20037 | 2718 | 1383 |
| Zaragoza | 967354 | 86 | 13938 | 1466 | 1010 |
It is quite unlikely that if you are reading this you do not know what is GitHub. GitHub is a web-based git repository that has a number of “social” features, including the declaration of a profile and @ mentions in commit messages and issues. The profile page includes information on the number of followers, as well as the repositories and the number of contributions every person has made during the last year. Besides this easily-scrapeable information, GitHub has a REST API that can be accessed from any language.
Some other web-based repos do have many of the characteristics, and, besides, are based in free software themselves, like Gitorious333http://gitorious.org/, SourceForge444http://sourceforge.net/, Google Code555http://code.google.com/, just to name a few of them. However the number (and the activity) of users of these repositories is quite small compared to GitHub, which has become the tool of choice for FLOSS developers. That is why GitHub was chosen, apart from the availability of tools to mine profile information: it provides an API that allows us to study things in an easier way. Notice also that all the projects in GitHub can not be considered FLOSS as we can see at [Wil14]. Nevertheless, people seems to be following the web culture where sharing and broadcasting are the usual ways of relation and they are not paying attention to licensing issues.
The tool used initially, by Paul Miller was written in CoffeeScript and designed for creating a ranking of the top 1000 users with more than an (arbitrary) numbers of followers equal to 256. The tool used the GitHub REST API to make requests, and saved them in a human-readable form in Markdown and also CSV and JSON. It was separated in three scripts that were called from a Makefile. Some utility functions were written in Node.js; the node.js module was called from several scripts.
Our intention was to look for users in a particular location, that is, to limit them not by minimum number of users but for the location declared in their profiles. Every run of the program required 10 API requests which are limited to 20 per hour, so our first modification [Mer15] was to ochange it so that it used authenticated requests. Finally, we had to rearrange the whole code so that it counted the number of stars and could be filtered according to regular expressions, since the country a city or province is might be ambiguous (you know Toledo, Ohio, but there is also a Toledo in Spain); Markdown handling was hard-coded into the program so it was moved to a template-based solution. The resulting solution [Mer15] kept the same license and included also a few additional tools for data processing.
One of the main problem we found in Spain was the different forms of the province name. Besides the fact that people write it in any of the official languages (Spanish and, in some cases, national languages like Basque or Catalan) and, well, sometimes with typos (with or without tildes), some people do not mention their province when writing their location. To make a long story short, we had to provide a configuration file (in JSON) which lists several possible names that might be used by people in a particular province; for instance, for Majorca we had to include this: "location": ["Balears","Baleares","Palma de Mallorca"]. This, of course, excludes those that simply do not care about listing their location, but more on this later on.
The script is then run with a city name (if there is no particular configuration option, Madrid, for instance) or a configuration file name granada. This can be launched weekly, or simply at a particular moment or under request.
The results for each user list the number of followers, contributions, the number of stars his/her repositories have received, the longest and the current contribution streak as well as the predominant language and avatar. Some of these metrics are shown in the Markdown rankings; for instance, see the one for Madrid.
Data is saved to a different repository and is aggregated and processed using R and Perl scripts. All of them are included in the same repository. As part of our commitment to free/open science, all graphics and data were published as soon as they were produced in Twitter from my @jjmerelo account.
4 Results and analysis
We reduced the search to the 20 most populated provinces in Spain, for which appropriate search strings and filters were created666Population data was obtained from the National Statistics Institute http://www.ine.es/. All data was downloaded during January 2015, and is available from the already mentioned repo. Aggregate data for these 20 provinces is shown in table 1.
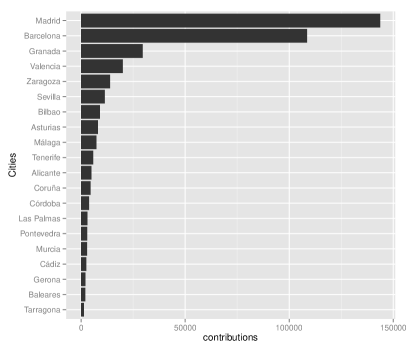
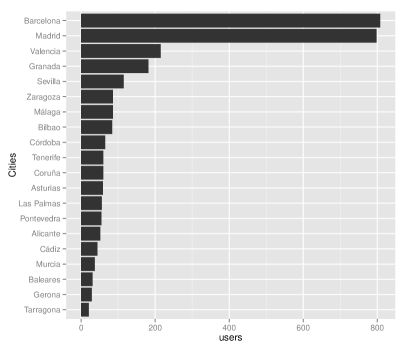
The range of users shown in the table hovers around the hundreds, with the one in the biggest provinces (and cities) approaching 1000. However, population and users/contributions are not directly related. We can already see some differences in figure 1, that shows the number of contributions (left) and users (right) in decreasing order. The first two, Madrid and Barcelona, should only be expected, but then Granada (17th in population) and Zaragoza also occupy a place that does not correspond exactly to the population they have; same as Bilbao (actually Vizcaya), but in the opposite direction.
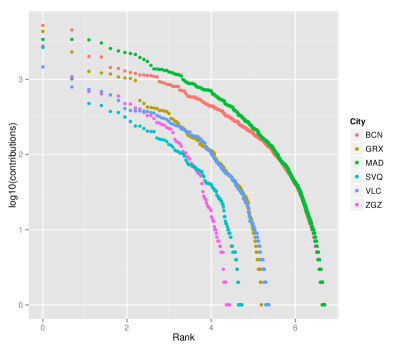
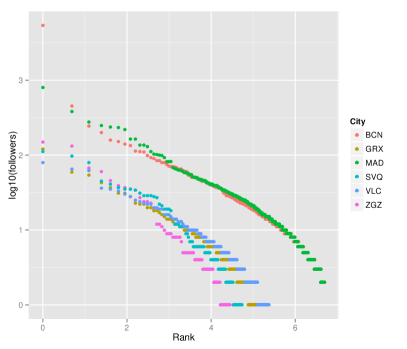
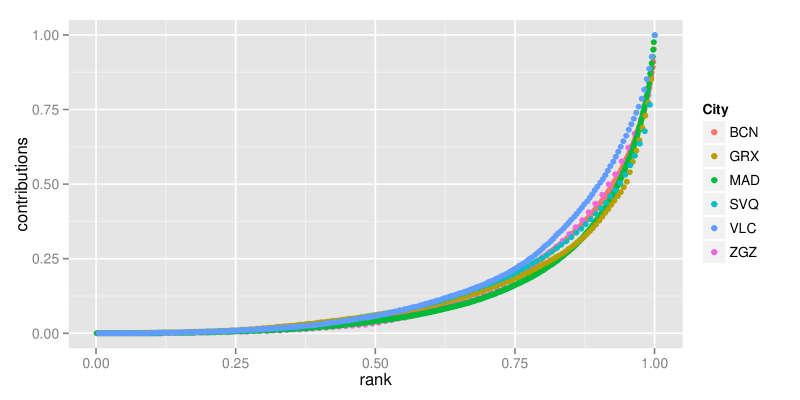
So let us look at the distribution of contributions and users looking for an explanation of the dancing places in the ranking. A users and contributions vs. rank plot is shown in figure 2; it shows different slopes which imply different distribution, but there is a clear indication that a Zipf-like distribution is taking place in all cases. So let us compute the Zipf exponent and objective, which we show in table 2.
| city | exponent | obj |
|---|---|---|
| Zaragoza | 1.510043 | 85.85441 |
| Sevilla | 1.342720 | 81.24680 |
| Granada | 1.259239 | 91.25858 |
| Valencia | 1.227201 | 172.91440 |
| Madrid | 1.201127 | 739.38890 |
| Barcelona | 1.157690 | 737.07838 |
This can be interpreted in a different way by plotting the Lorenz curve, which is the accumulated normalized sum of contributions for these six cities. This is shown in figure 3; this Lorenz curve tends to represent the inequality between those that contribute more and those that contribute less and is usually represented by the Gini index, which is shown in table 3.
| city | gini |
|---|---|
| Madrid | 0.7491426 |
| Granada | 0.7347302 |
| Zaragoza | 0.7281052 |
| Sevilla | 0.7224632 |
| Barcelona | 0.7206917 |
| Valencia | 0.6839236 |
The Gini coefficient measures inequality in the sense of share of, in this case, contributions between those with the most contributions and those with the least. An index equal to 1 would mean a single person did all the contributions, while the rest did 0, and index equal to 0 would mean all users make the same number of contributions. The table 3 ranks the cities from least equal (Madrid) to most egalitarian, Valencia. However, there is no big range of variation, hovering around 0.70, which is way over the inequality of the most unequal country in the world, the Seychelles. However, this is meaningless in absolute terms; in relative terms, it means roughly that the top contributors contribute roughly 70% more than the bottom contributors, and that there is no big variation among the different cities/provinces. It is quite clear, however, that the contributions by the top contributor, as well as those made by the average one, are quite different from place to place. So we represent in figure 4 the average number of contributions, that is, the number of contributions divided by the number of users.

Figure 4 shows that average contributions have a bigger range than the Gini coefficient; Valencia is right in the middle, around 100; in fact, the top contributor (pakozm has 1462 contributions and 25% have more than 100). In Madrid, however, the top 10 have more than 2000 contributions and there are 200 users (25% with more than 150), so that accounts for the bigger inequality. But productivity is highest in Madrid, Zaragoza and, once again, in Granada, if we consider productivity exclusively the number of contributions.
Finally, it is interesting to find out if the publication of these rankings had any kind of impact. This is shown in figure 5 for the three cities for which we have the most tests, including Granada.
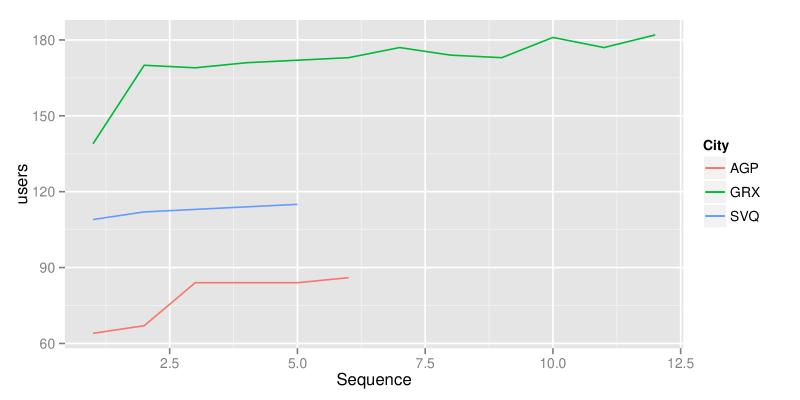
The first time the census for Granada was published it included around 140 users. A month (approximately) later, there were more than 180, a 28% increase, more or less the same than for Málaga and more than for Seville, where a small increase was noted. Take into account that this is not absolute number of users, but only active users; in fact, it might decrease due to some user becoming inactive (no contribution) in the last year (this happens in some of the cases in Granada). So, in general, it should be expected to go every which way, depending on the city. The fact that all cities whose rankings have been published have increased the number of active users after diffusion, mainly in Twitter, might be an indication more users becoming active, more mentioning their city/province in their profile, or small competitions taking place locally to scale up the rankings if there is a chance to do so. All hypothesis are equally valid lacking other evidence, but we would say that at least some increase will be due to the fact that the rankings exist.
5 Conclusions
In this paper we have shown what happened when city/province based rankings were created using GitHub search API and what conclusions can be extracted from measuring the number of users and contributions made by these users.
In general, it is interesting to note that Spain hosts a vibrant, abundant and diverse community of developers. Looking at the raw numbers, most of them are based in the big cities, Madrid, Barcelona and Valencia, but some smaller cities like Zaragoza and Granada also host a numerous and productive group of developers. The publishing of the rankings has created a lively discussion in Twitter, and also allowed the discovery of many developers in many areas. In Granada GitHub monthly meetings have started, and many interesting projects, including this paper, have been started.
There are many things that remain to be done. The first one is to check the ability of GitHub to act as a social network; we would like to analyze how developers in a city connect to each other and how these actual communities change with time and what is their background, companies, academia or user groups. Other productivity measures could also be taken, including number of lines; besides, a differentiation between code and artifacts could be made, in the same way it was done by Robles et al. in [RGBM06].
6 Acknowledgements
This paper is part of the open science effort at the university of Granada. It has been written using knitr, and its source as well as the data used to create it can be downloaded from the GitHub repository. It has been supported in part by GeNeura Team.
References
- [AR14] Laura Arjona-Reina. Debian contributors. Technical report, Universidad Politécnica de Madrid., July 2014. Available from https://wiki.debian.org/DebianContributors/DcDocs, January 2015.
- [GBRAIG08] Jesus M. Gonzalez-Barahona, Gregorio Robles, Roberto Andradas-Izquierdo, and Rishab A. Ghosh. Geographic origin of libre software developers. Information Economics and Policy, 20(4):356–363, December 2008.
- [HICRH+09] Israel Herraiz, Daniel Izquierdo-Cortazar, Francisco Rivas-Hernández, Jesús Gonzalez-Barahona, Gregorio Robles, S Duenas-Dominguez, Carlos Garcia-Campos, Juan Francisco Gato, and Liliana Tovar. Flossmetrics: Free/libre/open source software metrics. In Software Maintenance and Reengineering, 2009. CSMR’09. 13th European Conference on, pages 281–284. IEEE, 2009.
- [Mer15] Juan Julián Merelo. github-city-rankings, 01 2015.
- [RGBM06] Gregorio Robles, Jesus M. Gonzalez-Barahona, and Juan Julián Merelo. Beyond source code: The importance of other artifacts in software development (a case study). Journal of Systems and Software, 79(9):1233–1248, 2006. Selected papers from the fourth Source Code Analysis and Manipulation (SCAM 2004) Workshop, September 2006.
- [RMGGB05] Gregorio Robles, Juan-Julián Merelo-Guervós, and Jesús M. González-Barahona. Self-organized development in libre software projects: a model based on the stigmergy concept. In Proceedings of the 6th International Workshop on Software Process Simulation and Modeling (ProSim 2005), St. Louis, Missouri, USA, page 16 pages, May 2005.
- [RSC+10] Carlo Ratti, Stanislav Sobolevsky, Francesco Calabrese, Clio Andris, Jonathan Reades, Mauro Martino, Rob Claxton, and Steven H. Strogatz. Redrawing the Map of Great Britain from a Network of Human Interactions. PLoS One, 5(12), 2010. doi:10.1371/journal.pone.0014248.
- [TH10] Y. Takhteyev and A. Hilts. Investigating the geography of open source software through GitHub. Technical report, http://takhteyev.org/, 2010. Online, http://takhteyev.org/papers/Takhteyev-Hilts-2010.pdf. Accessed January 2015.
- [TRM03] Fernando Tricas, Víctor Ruiz, and Juan Julián Merelo. Do we live in an small world? Measuring the Spanish-speaking blogosphere. In Thomas N. Burg, editor, BlogTalks, pages 158–173, 2003. ISBN 3901806008. Available from http://www.blogalia.com/pdf/20030506blogtalk.pdf.
- [vEFS13] Sebastian von Engelhardt, Andreas Freytag, and Christoph Schulz. On the Geographic Allocation of Open Source Software Activities. Int. J. Innov. Digit. Econ., 4(2):25–39, April 2013.
- [Wil14] A. Williamson. Licensing of Software on Github: A Quantitative Analysis, 2014. Online, http://www.softwarefreedom.org/resources/2013/lcs-slides-aaronw/. Accessed January 2015.