Quenching and Morphological Transformation in Semi-Analytic Models and CANDELS
Abstract
We examine the spheroid growth and star formation quenching experienced by galaxies since by studying the evolution with redshift of the quiescent and spheroid-dominated fractions of galaxies from the CANDELS and GAMA surveys. We compare the observed fractions with predictions from a semi-analytic model which includes prescriptions for bulge growth and AGN feedback due to mergers and disk instabilities. We facilitate direct morphological comparison by converting our model bulge-to-total stellar mass ratios to Sérsic indices. We then subdivide our population into the four quadrants of the sSFR-Sérsic index plane and study the buildup of each of these subpopulations. We find that the fraction of star forming disks declines steadily, while the fraction of quiescent spheroids builds up over cosmic time. The fractions of star forming spheroids and quiescent disks are both non-negligible, and stay nearly constant over the period we have studied. Our model is qualitatively successful at reproducing the evolution of the two “main” populations (star forming disks and quiescent spheroids), and approximately reproduces the relative fractions of all four types, but predicts a stronger decline in star forming spheroids, and increase in quiescent disks, than is seen in the observations. A model with an additional channel for bulge growth via disk instabilities agrees better overall with the observations than a model in which bulges can grow only through mergers. We also examine the relative importance of these different physical drivers of transformation (major and minor mergers and disk instabilities).
keywords:
galaxies: evolution - galaxies: interactions - galaxies: bulges - galaxies: star formation1 Introduction
The mechanisms by which galaxies are transformed and evolve over time, both in terms of their star formation rates and their morphologies, are still not clearly known. At low redshift, the distribution of galaxy colors is bimodal (Baldry et al., 2004; Bell et al., 2004b). This division of galaxies into the star forming “blue cloud” and the quiescent “red sequence” can be observed most clearly in the color-magnitude and specific star formation rate (sSFR)-stellar mass planes (Baldry et al., 2004; Brinchmann et al., 2004; Kauffmann et al., 2003; Strateva et al., 2001). Additionally, star forming galaxies can be said to occupy a “star forming main sequence,” a correlation between the star formation rate and the stellar mass of star forming galaxies (Noeske et al., 2007; Daddi et al., 2007; Elbaz et al., 2007; Rodighiero et al., 2011). Galaxies that are part of the red sequence have a wider range of star formation rates, although they do exhibit a correlation between mass (or luminosity) and color, where more massive galaxies tend to be redder (Bernardi et al., 2003; Gallazzi et al., 2006; Peng et al., 2010; Brammer et al., 2011; Muzzin et al., 2013b). In addition to the bimodality due to stellar populations, there is also a bimodality in the structure of galaxies (Kauffmann et al., 2003). Often characterized by the bulge-to-total luminosity or mass ratio, or light profile parameterizations such as the Sérsic index, galaxy morphology tends to be correlated with the star formation activity in the galaxy. Galaxy disks tend to be bluer than bulges (Peletier & Balcells, 1996; Bell et al., 2004a) and galaxies that are part of the blue cloud are more likely to be disk-dominated, while galaxies that are members of the red sequence are more likely to have more prominent bulges, or to have the concentrated light profiles that are characteristic of early type galaxies (Blanton & Moustakas, 2009; Schiminovich et al., 2007; Bell, 2008; Cheung et al., 2012).
Large surveys have shed light on how the galaxy population evolved over a large fraction of the age of the universe. These observations have shown that the bimodality seen in the local universe is in place even at (Brammer et al., 2009, 2011; Muzzin et al., 2013b). Analysis of the buildup of stellar populations from high redshift to the present reveals that the stellar mass contained in objects in the blue cloud has remained relatively constant, while the stellar mass represented by galaxies on the red sequence has grown significantly; this implies that blue star forming galaxies are in fact being transformed into red, quiescent ones (Bell et al., 2004b; Borch et al., 2006; Bell et al., 2007; Faber et al., 2007). The mechanism responsible for this “quenching” (or turning off of star formation) is not so clear. New information about the evolution of galaxy structure and morphologies has recently been gleaned from observations using the Hubble Space Telescope. Recent work suggests that quiescence is intimately tied to the presence of a bulge component (Wuyts et al., 2011b; Lang et al., 2014; Bluck et al., 2014; McIntosh et al., 2014). Moreover, observations have revealed a population of compact spheroid-dominated star forming galaxies at , which may be the progenitors of the quiescent, elliptical galaxies we see today (Wuyts et al., 2011b; Whitaker et al., 2012b; Barro et al., 2013; Williams et al., 2014; Barro et al., 2014; Williams et al., 2015). It seems likely that the mechanisms responsible for quenching, morphological, and size evolution are connected.
There have been several mechanisms proposed to explain galaxy quenching. One of the most popular scenarios involves feedback due to active galactic nuclei (AGN). AGN feedback can be broadly divided into two regimes: the radiatively efficient “quasar” or “bright” mode, which is proposed to drive a powerful wind which expels gas from the galaxy, and the “radio” or “maintenance” mode, which heats gas in the galactic halo, preventing it from cooling and forming stars (Somerville & Davé, 2014, and references therein). This AGN activity can be driven either by galaxy mergers (Ellison et al., 2011; Silverman et al., 2011) or in situ processes such as disk instabilities (Bournaud et al., 2011; Dekel & Burkert, 2014). Both of these processes lead to rapid transfer of angular momentum and the growth of a bulge component. Virial shock heating is another proposed mechanism: during collapse, gas can be heated via the conversion of gravitational potential energy into kinetic energy (White & Rees, 1978). Above a (redshift dependent) critical halo mass of , this shock heating may be able to keep a substantial fraction of the halo gas hot, leading to quenching (Birnboim & Dekel, 2003; Kereš et al., 2005).
While this does not seem directly related to the presence of a bulge component, it is clear from observations that galaxies residing in halos above are more likely to be bulge-dominated than disk-dominated (Dekel et al., 2009; Woo et al., 2015). There is also the possibility that the presence of a (significant) bulge may itself stabilize the disk against local instabilities, thus making star formation less efficient, an effect known as morphological quenching (Martig et al., 2009). Finally, there is a suite of processes connected with dense environments, including tidal and ram pressure stripping and harrassment. These are often collectively referred to as “environmental quenching” (Oemler, 1974; Dressler, 1980; Balogh et al., 2004; Tinker & Wetzel, 2010; Peng et al., 2010), and they likely primarily affect satellites orbiting within a larger halo. These processes probably operate on a different timescale, and lead to different sorts of morphological transformation, than the ones described above. In this paper, we focus on field galaxy environments, so environmental processes are likely to be sub-dominant. See also McIntosh et al. (2014) for a summary of proposed quenching processes.
If quenching and morphological transformation are (in most cases) intimately tied to each other, then galaxies which seem to be the “outliers” in this picture may be of particular interest: the quiescent disk-dominated galaxies and star forming spheroid-dominated galaxies. These populations are smaller than those of star forming disk-dominated and quiescent spheroid-dominated galaxies, although they are not insignificant in size (McGrath et al., 2008; van der Wel et al., 2011). Schawinski et al. (2014) did an analysis of galaxies in the local universe that occupy the “green valley,” the region in between the blue cloud and the red sequence on the color-magnitude diagram, using observational data from SDSS (York et al., 2000) and GALEX (Martin et al., 2005). They used morphology classifications from Galaxy Zoo (Lintott et al., 2008, 2011) and determined that there were two distinct paths through the green valley, one taken by galaxies that leave the blue cloud as disk dominated systems, the other by galaxies that transition as bulge-dominated systems (see also the work of (Smethurst et al., 2015). The path associated with spheroid-dominated galaxies is consistent with work that suggests that bulge growth precedes quiescence (Wuyts et al., 2011b; Wong et al., 2012; Lang et al., 2014), while the path taken by disk-dominated galaxies may explain the slowly growing population of quiescent disk galaxies in the local universe which have been cut off from their gas supply but suffered nothing catastrophic to destroy or use up their existing gas reservoirs. Barro et al. (2013) and Woo et al. (2015) similarly identify different scenarios of quenching based on structural evolution. McIntosh et al. (2014) also describe a path associated with spheroid-dominated galaxies when examining what they call “recently quenched ellipticals” in the Sloan Digital Sky Survey. In this light, these “outlying” populations are possibly much more important to the overall picture than originally suspected, and may be an indication that quenching is caused by multiple physical processes.
Aiding in the investigation of galaxy formation and evolution are state of the art numerical simulations and semi-analytic models. N-body dark matter simulations such as Bolshoi (Klypin et al., 2011) are an invaluable tool when testing the predictions of our currently favored Lambda Cold Dark Matter cosmological model, CDM. Semi-analytic models, or SAMs, plant galaxies in merger trees assembled in dark matter N-body simulations or constructed using techniques based on the Extended Press Schechter formalism. By following the evolution of these galaxies within the backbone of the dark matter history, accounting for physical processes such as gas accretion and cooling, star formation, merging and feedback with physically motivated recipes, population statistics for a cosmological sample of galaxies can be generated quickly and with minimal computational resources (Kauffmann et al., 1993; Cole et al., 1994; Somerville & Primack, 1999; De Lucia et al., 2006; Somerville et al., 2008a; Guo et al., 2011; Somerville et al., 2012; Porter et al., 2014a). SAMs have been used to study the evolution of star formation and the buildup of spheroid-dominated galaxies and to gauge which processes are especially important. De Lucia et al. (2006) and Benson & Devereux (2010) have investigated the buildup of spheroid-dominated galaxies in SAMs with cosmic time. These analyses and others have reiterated that bulge growth often appears to be connected to the cessation of star formation and also demonstrate that the two main channels for bulge growth are mergers and disk instabilities, both of which appear to be important, although their degree of importance may change with redshift, galaxy mass and environment, and is also model dependent (Parry et al., 2009; De Lucia et al., 2011; Fontanot et al., 2012; Porter et al., 2014a).
Recently, Porter et al. (2014a) compared the predictions of the latest version of the “Santa Cruz” SAM (Somerville & Primack, 1999; Somerville et al., 2008a) for the stellar mass function divided by morphology with available observations, and found fairly good agreement. They found that adding a prescription for bulge growth via disk instabilities brought the model into better agreement with the observed galaxy stellar mass function of spheroid-dominated galaxies at intermediate masses (). In addition, Porter et al. (2014a) developed a new model for predicting the radial sizes and velocity dispersions of bulges formed via mergers or disk instabilities, based on a simple analytic model calibrated using numerical hydrodynamic simulations of binary galaxy mergers. Their model reproduces the observed size-mass relation for spheroids and disks, and the evolution of this relation from to the present day (see also Somerville et al. in prep). Porter et al. (2014b) investigated the predictions of the same models for the correlation of the age and metallicity of stars in local spheroid-dominated galaxies with structural parameters such as size and velocity dispersion. They found a strong correlation between both stellar population parameters (age and metallicity) and internal velocity dispersion, in agreement with observations. They found no correlation between age and radius, and a weak correlation between metallicity and radius, also in agreement with observations of nearby early type galaxies. In this paper we follow up on the work by Porter and collaborators by directly studying the build-up of the spheroid-dominated population over cosmic time, and comparing with observations of high-redshift galaxies.
The conclusions of previous studies in the literature regarding the spheroid-dominated fraction of galaxies in SAMs and the agreement with observations are difficult to synthesize, because different analyses use different criteria to define spheroid-dominated galaxies both in the models and in the observations. The bulge-to-total mass ratio () that is readily predicted in SAMs is difficult to measure observationally. Therefore it has been difficult to make a direct comparison between model predictions and observations previously. One of the important new features of this study is that we extend our models to predict a morphological quantifier that can be compared more directly with observations. We describe our new method in detail below.
In this paper, we present new results quantifying the evolution of quenching and spheroid growth in observations from to the present, and also present new predictions of these same quantities from state-of-the-art semi-analytic models. We split galaxies according to their star formation rates and morphologies and examine the buildup of the quiescent and spheroid-dominated fractions of galaxies. We then go further than studies in the past by subdividing into four populations: star forming disk-dominated galaxies (SFDs), star forming spheroid-dominated galaxies (SFSs), quiescent disk-dominated galaxies (QDs) and quiescent spheroid-dominated galaxies (QSs). We examine the evolution of the fraction of galaxies in each of these populations. Our low redshift observational data () come from the Galaxy and Mass Assembly Survey (GAMA Driver et al., 2009) and our higher redshift data () come from the Cosmic Assembly Near-infrared Deep Extragalactic Legacy Survey (CANDELS; Grogin et al. 2011; Koekemoer et al. 2011). We use the Santa Cruz SAM of Somerville et al. (2008a) with updates as described in Somerville et al. (2012) and Porter et al. (2014a). Our semi-analytic model includes the effects of AGN feedback and bulge growth triggered by mergers and (optional) disk instabilities. Another way in which our study is unique is the way we characterize the morphologies of our model galaxies: we convert our model output, bulge-to-total mass ratio, to Sérsic index as described in Section 2 and Appendix A in order to facilitate a more direct comparison between model and observed galaxy morphologies than has been carried out before. We will also examine in detail the histories of galaxies selected from each population in order to shed light on the individual tracks that different types of galaxies move along as they evolve. The structure of the paper is as follows. In Section 2 we give an overview of our semi-analytic model and of the data sets with which we are comparing. In Section 3 we present a comparison of the evolution of these populations in the model and the observations. We present our discussion, in part informed by studying individual evolutionary tracks of galaxies from the model, in Section 4 and our summary and conclusions in Section 5.
2 Semi-Analytic Model and Observational Data
2.1 The Semi-Analytic Model
The SAMs used in this paper were first presented in Somerville & Primack (1999) and Somerville et al. (2001), and significantly updated in Somerville et al. (2008a, S08), Somerville et al. (2012, S12) and Porter et al. (2014a, P14). The model includes prescriptions for the following physical processes: the hierarchical growth of structure in the form of dark matter merger trees, the heating and cooling of gas, star formation as governed by the empirical Kennicut-Schmidt law, the evolution of stellar populations, supernova feedback, chemical evolution of the ISM and ICM due to supernovae, AGN feedback, and starbursts and morphological transformation due to galaxy mergers and disk instabilities. Here we will briefly summarize these processes, focusing mainly on the processes relevant to the evolution of star formation and morphology. For a more in depth description of the model, see S08 and P14. We assume a standard CDM cosmology ( ) and a Chabrier (2003) initial mass function. Our adopted baryon fraction is 0.1658. Our cosmology was chosen to match that adopted by the Bolshoi simulation (detailed below) and is consistent with the Wilkinson Microwave Anisotropy Probe (WMAP) 5/7-year results (Komatsu et al., 2009, 2011).
In this work, we use the CANDELS lightcones (Somerville et al. in prep) extracted from the Bolshoi dark-matter only N-body simulation (Klypin et al., 2011; Trujillo-Gomez et al., 2011). Dark matter halos are identified using the ROCKSTAR algorithm of Behroozi et al. (2013a). The Bolshoi simulation is complete down to halos with km/s, and has a force resolution and mass resolution of kpc and , respectively. Merger trees are constructed for each halo in the lightcone using the method of Somerville & Kolatt (1999). There is no appreciable difference in results when using merger trees extracted from the N-body simulation (as done in Porter et al. 2014) as opposed to EPS (as we do here). For our lowest redshift bin, the lightcones represent a very small volume so we simply use a low-z snapshot from the Bolshoi volume.
When dark matter haloes merge, the central galaxy of the largest progenitor becomes the new central galaxy, while all other galaxies become satellites. Satellite galaxies are able to spiral in and merge with the central galaxy, losing angular momentum to dynamical friction as they orbit. The merger time-scale is estimated using a variant of the Chandrasekhar formula from Boylan-Kolchin et al. (2008). Tidal stripping and destruction of satellites as described in S08 are also included.
Before the universe is reionized, each halo has a hot gas mass equal to the virial mass of the halo times the universal baryon fraction. The collapse of gas into low-mass haloes is suppressed after reionization due to the photoionizing background. We assume the universe is fully reionized by and use the results of Gnedin (2000) and Kravtsov et al. (2004) to model the fraction of baryons that can collapse into haloes of a given mass following reionization. Due to the galaxy mass range selected in this work, we do not expect our results to be sensitive to this prescription.
When dark matter haloes collapse or are involved in a merger that at least doubles the mass of the progenitors, the hot gas is shock-heated to the virial temperature of the new halo. The rate at which this gas can cool is determined by a simple spherical cooling flow model. Assuming a monotonically decreasing density profile for the gas, and that denser gas cools faster, we can define a “cooling radius”, within which all gas is able to cool within some time , which we have defined as the halo dynamical time. The initial density profile is assumed to be that of a singular isothermal sphere, and the cooling radius is found by using the atomic cooling curves of Sutherland & Dopita (1993). The cooling radius may be larger or smaller than the virial radius of the halo; when the cooling radius is larger, the cooling rate is limited only by the rate at which gas is infalling. The transition from to is associated with the transition from “cold flows”, where cold gas streams into the halo along dense filaments without being heated, to “hot flows”, where gas is shock heated on its way in, forming a diffuse hot gas halo before cooling (Birnboim & Dekel, 2003; Dekel & Birnboim, 2006; Kereš et al., 2005). Note that in this way, virial shock heating (sometimes referred to as ‘halo mass quenching’) is included in our SAMs. However, it has been shown by many studies (both numerical and semi-analytic) that this effect alone is insufficient to create the observed population of massive quiescent galaxies (Somerville & Davé, 2014, and references therein).
Newly cooled gas collapses to form a rotationally supported disk, the scale radius of which is estimated based on the initial angular momentum of the gas and the profile of the halo. We assume that angular momentum is conserved and that the self-gravity of the collapsing baryons causes the inner part of the halo to contract (Blumenthal et al., 1986; Flores et al., 1993; Mo et al., 1998). This method was shown to reproduce the observed size-stellar mass relations of disks out to in Somerville et al. (2008b). Spheroids can be created by mergers or disk instabilities. The sizes of spheroids formed in mergers are determined by the stellar masses, sizes and gas fractions of the two progenitors, as described in P14. The size of spheroids formed in disk instabilities is determined by assuming that they form from the center of the exponential stellar disk; the radius is simply the radius that contains the amount of mass that is to be transferred from the disk to the bulge (again, see P14 for details).
There are two modes of star formation in the model: a “normal” mode that occurs in isolated disks and a “starburst” mode that occurs as a result of a merger or internal disk instability, which will be discussed in more depth below. The normal mode follows the Schmidt-Kennicutt relation (Kennicutt, 1998) and assumes that gas must be above some fixed critical surface density (the adopted value here is ) in order to form stars.
Exploding supernovae and massive stars are capable of depositing energy into the ISM, which can drive outflows of cold gas from the galaxy. We assume that the mass outflow rate is proportional to the SFR and decreases with increasing galaxy circular velocity, in accordance with the theory of “energy-driven” winds. Some ejected gas is removed from the halo completely, while some is deposited into the hot gas reservoir of the halo and is eligible to cool again. The gas that is driven from the halo entirely is combined with the gas that has been prevented from cooling by the photoionizing background and may later reaccrete back into the halo. The fraction of gas which is retained by the halo versus the amount that is ejected is a function of halo circular velocity as decribed in S08.
Heavy elements are produced by each generation of stars, and chemical enrichment is modelled simply using the instantaneous recycling approximation. For each parcel of new stars , a mass of metals is also created, which is immediately mixed with the cold gas in the disk. The yield is assumed to be constant and is treated as a free parameter. Supernova driven winds act to remove some of this enriched gas, depositing a portion of the created metals into the hot gas or outside of the halo.
2.1.1 Mergers and Starbursts
Mergers between galaxies are assumed to remove angular momentum from stars and gas in the disk and drive material towards the center, building up a spheroidal component. In our model, this spheroidal component is formed instantaneously. In principle this could affect our results by forming bulges more quickly than they should form in the real universe. However, actual bulge formation time scales () are quite short compared with the times associated with our redshift bins, so we don’t expect this to have much of an effect.
Mergers also trigger a starburst, the efficiency of which depends on the gas fraction of the central galaxy and the mass ratio of the two progenitors. The time scale of the burst is also determined by properties of the progenitor galaxies. The parameterization is based on hydrodynamical simulations of binary mergers between disks (Hopkins et al., 2009b). Simulations show that the closer the mass ratio of the progenitors is to one (or how “major” the merger is) and the more gas-poor the merger is, the more efficient it is at removing angular momentum from the gas and driving it into the nucleus, and scattering disk stars into a hot spheroid component (Cox et al., 2006; Robertson et al., 2006). The gas fraction dependence can be understood as follows: if the progenitors are very gas-rich, there is not enough stellar mass to create a torque on the gas, making it difficult for the gas to shed angular momentum and collapse inward (Hopkins et al., 2009b). S08 parameterized the burst efficiency only as a function of mass ratio, but S12 and P14 introduced the gas fraction dependence in accordance with Hopkins et al. (2009a). Stars that are formed as part of the starburst are added to the spheroidal component, as are 80% of the stars from the merging satellite galaxy. The other 20% are deposited into a diffuse stellar halo component.
2.1.2 Disk Instabilities
Disk material can also be converted into a spheroidal component as a result of internal gravitational instabilities. A pure disk without a dark matter halo is very unstable to the formation of a bar or bulge, while massive dark matter haloes tend to stabilize a thin, cold galactic disk (Ostriker & Peebles, 1973; Fall & Efstathiou, 1980). When the ratio of dark matter mass to disk mass falls below a critical value, the disk can no longer support itself and material collapses into the inner regions of the galaxy (Efstathiou et al., 1982). Here we adopt an avenue for bulge growth due to disk instability, based on a Toomre-like stability criterion. Following Efstathiou et al. (1982), Mo et al. (1998), P14 and many other works, we define the stability parameter as
| (1) |
where is the maximum circular velocity of the halo (used as a proxy for the maximum circular velocity of the disk), is the scale length of the stellar disk and is the stellar mass of the disk. This is identical to the “Stars DI” disk instability criterion introduced in P14. Whenever , the disk is considered to be unstable. The value of in numerical simulations of isolated disks has been found to be in the range of , with disks containing stars and cold gas having a lower threshold than pure stellar disks (Efstathiou et al., 1982; Mo et al., 1998). We set as in P14, where this value was chosen to match the observed fraction of spheroid-dominated galaxies at . When the disk becomes unstable, stellar mass is moved from the disk to the bulge until . The gas in the disk is not affected. The “Stars+Gas DI” model of P14 included gas in determining the stability of the disk and also moved some gas to the bulge component to feed the central supermassive black hole when the disk became unstable. However, the results for the two approaches were very similar. Again, the creation of the bulge component is instantaneous. While we are aware that this implementation of disk instability is crude and perhaps does not capture all of the relevant physics, this is an approach that is commonly used in the literature. One of the goals of this work is to explore how important bulge growth through disk instabilities might be, in order to guide future investigations. Later, we discuss more physical models of disk instability and how including them might affect the results of this study.
It is worth noting that we also do not account for the possibility that a previously existing bulge may help stabilize the disk against another instability. Because of this (and the fact that we only move as much material as needed to restabilize the bulge) it is possible (even common) for disks to develop chronic instabilities which lead to the steady growth of a bulge component.
Below we present our results for versions of the SAM both with the disk instability prescription turned on (DI model) and off (noDI model). The DI model is our fiducial model, however, and unless otherwise noted, it is the DI model that is shown.
2.1.3 Black Hole Accretion and Feedback
Galaxies are initially seeded with a massive black hole of (Hirschmann et al., 2012). When two galaxies merge as described above, their central black holes are assumed to merge as well, after which the new central black hole of the merger remnant engages in a bout of feeding and radiatively efficient, or “quasar” mode, AGN activity. During this time, the black hole accretes at its Eddington limit. As the black hole accretes and radiates, it deposits energy into the surrounding medium until it reaches a critical mass which corresponds to the energy which would stop accretion and begin driving an outflow, such as those seen in many recently merged systems(Rupke & Veilleux, 2013; Emonts et al., 2014). The black hole effectively starves itself of material, as its accretion rate declines as a power law, in accordance with the results of Hopkins et al. (2006). We follow the hydrodynamical binary merger simulations of Hopkins et al. (2007) for our definition of the critical mass, , at which the black hole accretion rate enters the declining phase, and , at which the black hole stops feeding. If the newly merged black hole is already more massive than , there is no accretion event. We note that our predicted final black hole and bulge masses are consistent with the observed relation (Somerville et al., 2008a; Hirschmann et al., 2012).
A bout of black hole accretion and AGN activity can also be triggered by a disk instability. When disk mass is transferred to the bulge as previously described, we assume the black hole accretes a gas mass equivalent to some fraction of that mass. Following Hirschmann et al. (2012), we set this term to be , which leads to good agreement with the observed number density of low-luminosity AGN. The black hole can continue to accrete until this fuel is consumed.
The black hole is also able to feed and effect feedback in the “radio” or “maintenance” mode. In this mode the black hole feeds via Bondi-Hoyle accretion from the hot halo (Bondi, 1952). The accretion is usually significantly sub-Eddington. This feedback mode is associated with giant radio jets which heat the surrounding gas, preventing it from cooling and forming stars. Once the accretion rate is determined, a coupling constant determines how effectively the energy released couples to the surrounding gas. The radio mode heating rate is then calculated and subtracted from the cooling rate described above.
2.1.4 Computing Sérsic Indices
This work involves comparing the morphologies of model galaxies with with those of observed galaxies. From the SAM, we can easily calculate the bulge-to-total stellar mass ratio, and we have predictions for the radii of the galactic bulge and disk. There are many different methods used to classify the morphologies of observed galaxies. One commonly used method is to fit the light profile with a Sérsic function, resulting in the determination of the Sérsic index (Sérsic, 1963). In an effort to put the observations and model on equal footing, we have converted our model outputs to a Sérsic index using a lookup table which takes in the bulge-to-total mass ratio and bulge radius to disk radius ratio and gives an effective radius and Sérsic index. This lookup table was generated by fitting Sérsic indices and effective radii to synthetic bulge+disk systems (=1 for disks and =4 for bulges) for a range of different bulge-to-total mass ratios and bulge radius to disk radius size ratios. The values that come out of the lookup table are discrete for obvious reasons, so we use a 2D interpolation of the table to generate our Sérsic indices and effective radii. More information and some tests of our approach can be found in Appendix A.
2.2 Observational Samples
2.2.1 CANDELS
In this work, we make use of Hubble Space Telescope/Wide Field Camera 3 (HST/WFC3) observations of galaxies taken as part of the Cosmic Assembly Near-infrared Deep Extragalactic Legacy Survey (CANDELS; Grogin et al. 2011; Koekemoer et al. 2011). These observations span two of the five CANDELS fields: the Ultra-Deep Survey (UDS; Lawrence et al. 2007) and the Great Observatories Origins Deep Survey South (GOODS-S; Giavalisco et al. 2004). With the combined strengths of galaxy selection in the F160W (H) band and the availability of rich multi-wavelength datasets, the CANDELS catalogs afford us an unprecedented study of galactic structure and the rise and fall of star formation activity from high redshift toward the present day.
Here, we give only an outline of the galaxy catalogs used for our analysis111All CANDELS catalogs are available at the Rainbow Database-http://arcoiris.ucolick.org/Rainbow_navigator_public/. The galaxies were drawn from the CANDELS catalogs for UDS and GOODS-S; for more details we refer the reader to Galametz et al. (2013) and Guo et al. (2013), respectively. Briefly, the UV-to-NIR multiwavelength photometric catalogs were computed using the template-fitting method TFIT (Lee et al., 2012; Laidler et al., 2007) which allows us to consistently merge datasets with significantly different spatial resolution.
Photometric redshifts were determined following the method described in Dahlen et al. (2013) which combines redshift probability distributions from several different codes using a Bayesian approach to improve the precision and reduce the number of catastrophic outliers. For a sample of 480 spectroscopically confirmed GOODS-S galaxies without an active galactic nucleus, the median and standard deviation of are approximately -0.014 and 0.045, respectively.
The stellar masses were drawn from the catalog presented in Santini et al. (2015). The catalog includes stellar masses computed using different SED fitting codes and modeling assumptions. For this work, we adopted stellar masses computed using FAST (Kriek et al., 2009) with Bruzual & Charlot (2003) stellar population synthesis models, a Chabrier initial mass function Chabrier (2003), exponentially declining star formation histories, solar metallicity and the Calzetti dust extinction law (Calzetti, 2001). The total star formation rate for galaxies detected in the mid- and/or far-infrared is defined as SFRtotal=SFRUV+IR = SFRUV+SFRIR, where SFR SFR2800 is the unobscured (and therefore uncorrected for dust extinction) component derived from (the luminosity at 2800Å), and SFRIR is the integrated -based obscured component. The integrated (or total) infrared luminosity, , is itself derived from fitting 24 m fluxes using Chary & Elbaz (2001) templates and a calibration determined from Herschel data (see Elbaz et al. 2011). Two major assumptions underlying this mapping from 24 m flux to the total IR (8m to 1000m) luminosity are (1) the IR SEDs of galaxies do not evolve significantly with redshift, and (2) emission from dust heated by an obscured AGN does not significantly increase the 24 m fluxes (again, consult Elbaz et al. (2011) for the validity of these assumptions).
To be more concrete, SFR, based on Kennicutt (1998) and Bell et al. (2005), and assuming a Chabrier (2003) IMF (see Barro et al. (2011) for more information). For galaxies without an infrared detection and thus no total estimate, we instead corrected SFR for dust extinction assuming the Calzetti law (Calzetti, 2001), giving us a comparable estimate of SFRtotal: SFR SFR. The optical extinction parameter for each galaxy was determined by FAST, and the factor of 1.8 in the exponent is the attenuation parameter, . We refer the reader to Wuyts et al. (2011a) and Pérez-González et al. (2008) for further details about the derivation of total star formation rates, including a wealth of comparisons between different estimates of SFRtotal.
The structural measurements of the observed galaxies (Sérsic indices, in particular), as computed by GALFIT (Peng et al., 2002; van der Wel et al., 2012) from the HST/WFC3 F160W (H-band) images, are used throughout this work. To secure the robustness and completeness of our sample, we consider only those galaxies with , , and GALFIT flag equal to 0 (good fits only). For the redshift range considered in this paper (), these three major selection cuts leave us with the following numbers of galaxies in each field: 1123 in GOODS-S and 1594 in UDS. The GALFIT high-quality flag cut was applied last; our sample sizes before that particular cut were 1333 and 1798 galaxies in GOODS-S and UDS, respectively. Guo et al. (2013) and Galametz et al. (2013) respectively show that the GOODS-S and UDS samples are complete after taking into account our m cut. Guo et al. (2013) further show that the completeness in GOODS-S also depends on morphology by splitting a synthetic comparison sample into disk-dominated and spheroid-dominated subsamples (based on the Sérsic index). Nevertheless, our morphology-dependent subsamples should continue to remain complete given our m and mass selection criteria.
2.2.2 GAMA
Given the small volume probed by CANDELS at , and the need to compare our high-redshift results to those obtained from a robust low-redshift anchor point, we incorporate multi-wavelength data from the Galaxy And Mass Assembly (GAMA) survey into our analysis. GAMA is a large (144 deg2) spectroscopic survey that builds on the legacy of the Sloan Digital Sky Survey (SDSS; York et al. 2000) and the Two-degree Field Galaxy Redshift Survey (2dFGRS; Colless et al. 2001), reaching a limiting magnitude of mag with % spectroscopic completeness (see Driver et al. (2011) for a review of the first three years of GAMA). It is this intermediate depth and high spectroscopic completeness, combined with photometry spanning a large wavelength range (1 nm to 1m Liske et al., 2014)), in contrast to wider and shallower spectroscopic surveys in the past, that makes GAMA a unique survey, and an ideal complement to the CANDELS dataset. In addition to conducting its own spectroscopic observations with the AAOmega spectrograph on the Anglo-Australian Telescope, GAMA has assembled existing and is pursuing new spectroscopic and imaging data in collaboration with several other independent surveys (see Baldry et al. (2010), and Tables 1 and 4 of Liske et al. (2014)).
Specifically, this work makes use of Data Release 2 (DR2) from the GAMA survey. DR2 provides, among other things, local bulk flow-corrected redshifts (see Section 2.3 of Baldry et al. 2012), stellar masses (Taylor et al., 2011), H-based star formation rates (Gunawardhana et al., 2013; Hopkins et al., 2013), observed and rest-frame photometry (Hill et al., 2011), and GALFIT structural measurements (Kelvin et al., 2012, we use -band fits). These data are released for 72,225 objects distributed over three GAMA regions: two 48 deg2 fields with limiting magnitude mag, and one 48 deg2 field with limiting magnitude mag, giving a total survey volume of 144 deg2. Liske et al. (2014) provide an overview of DR2 for GAMA as well as further information about the survey’s progress.
For the sake of consistency, the H-based SFR for each GAMA galaxy, SFRHα, was converted from a Salpeter IMF basis to a Chabrier IMF basis(Bell et al., 2005). The SFRHα measurements provided by GAMA should not, in principle, deviate greatly from the SFRUV+IR and SFRUV,corr prescriptions that we have adopted for CANDELS galaxies because the H luminosity () estimates for GAMA galaxies have been corrected for dust extinction and Balmer stellar absorption (Gunawardhana et al., 2013). Furthermore, we applied aperture corrections to the stellar mass and rest-frame magnitude estimates to account for the fraction of mass (or flux) that falls outside of the -band (SExtractor AUTO Bertin & Arnouts, 1996) aperture used for aperture-matched photometry (Liske et al., 2014).
In order to ensure robustness and consistency, we apply the following selection cuts to the GAMA DR2 catalog: , -band GALFIT flag equal to 0 (good fits only), and high-quality redshifts only (“NQ” in the DR2 catalog). As mentioned earlier, the limiting magnitudes are mag for two fields, and mag for the third field. We consider only galaxies with local bulk flow-corrected redshifts between 0.005 and 0.12; the lower limit is to prevent stellar contamination in our galaxy sample (in fact, the lowest redshift in our sample after applying the aforementioned cuts is ), and the latter limit is the maximum redshift at which we are complete for galaxies. These selection cuts leave us with a total of 5112 GAMA DR2 galaxies. Before the GALFIT high-quality flag cut, but after all other cuts, our GAMA sample size was 5977.
For each galaxy in our final GAMA sample, we derive completeness correction weights using the weighting technique (Schmidt 1968, and see Section 3 of Taylor et al. 2015). is the total comoving volume contained within the 144 square degree GAMA survey (taking into account the survey geometry, and considering only our chosen redshift slice, ). is the maximum comoving volume within which a given galaxy could have been detected, again taking into account the survey geometry (i.e., using the provided and for each galaxy, corresponding to the three 48 square degree GAMA fields with different -band selection limits). equals 1 for galaxies for which we are complete, and it is greater than 1 for galaxies for which we are incomplete. The median weight is 1.0, and only 187 galaxies (3%) have a weight greater than 1.0 (with the maximum value being about 35). As expected, our GAMA sample is 97% complete.
3 Results
We now examine how well our model (with the disk instability prescription turned both on and off) matches the buildup of the quiescent and spheroid-dominated fraction of observed galaxies. We then subdivide the model and observed populations further and examine the buildup of the four quadrants of the sSFR-Sérsic index plane. In this way we can assess where our model is succeeding and failing in transforming galaxies in terms of their star formation rates and morphologies.
3.1 Quiescent Fraction
3.1.1 Dividing by sSFR
Our first step is to split galaxies into star forming and quiescent populations. We preferred not to simply divide our population by eye and sought an automated process which would divide our galaxies in each redshift bin in a reasonable way. One approach used in the literature is to divide at a specific star formation rate , where is the Hubble time at the redshift of interest. This divider in sSFR is roughly equivalent to the division of galaxies into star forming and quiescent on the UVJ color-color diagram as described in Whitaker et al. (2012a) and Muzzin et al. (2013b). This division line, as well as others that we attempted to use, all shared the same problem: the distribution of sSFRs in the model and from observations is somewhat different, especially at z>2.2, so dividing lines which made a reasonable cut for model galaxies did not work as well for observed galaxies and vice versa. The sSFR distribution of model galaxies is not as bimodal as it is for the observations; rather than having a second peak at very low sSFR, our model distribution tails off. We don’t expect this to significantly affect the results of this work as the star formation rates in question are already very low (our model galaxies are being quenched; their sSFRs just aren’t distributed in quite the same way as the observations) and any new stars formed shouldn’t change the structural parameters with which we concern ourselves later. Still, this makes defining quiescence by examining the trough between populations somewhat difficult. We instead seek to define our dividing line in relation to the star forming main sequence, which leads us to a slightly different issue.
The star formation rates of the observed galaxies are systematically slightly higher than those of the model galaxies, so a typical observed star forming galaxy (one which we would say occupies the main sequence of star formation) has a different sSFR than a corresponding model galaxy. The dependence of sSFR on stellar mass for star forming galaxies is also steeper for observed galaxies than for model galaxies. This may point to a deficiency in some of our prescriptions for star formation and/or stellar feedback (see the discussion in Somerville & Davé, 2014, and references therein). However, in this work we are concerned with broadly distinguishing between star forming and quiescent, and with the processes responsible for moving galaxies fairly dramatically off of the main sequence. Therefore as long as we define our dividing line relative to the main sequence in the models and in the observations, our analysis should be robust.
To deal with these issues, we introduce a method to calculate a dividing line between star forming and quiescent galaxies which we apply to both the observations and the model galaxies; however, the actual normalization, slope, and redshift dependence of the dividing line are not the same for the model and the observational samples. Geha et al. (2012) has shown that, in the local universe, essentially all isolated galaxies with show active star formation. This is also the case in our models. Therefore, at low stellar masses we should be able to measure the “native” star-forming main sequence (SFMS), unaffected by internal quenching processes. We cannot reliably reach such low mass limits, but we use galaxies with stellar masses between and to measure the baseline SFMS (we restrict our sample in the models to central galaxies for reasons mentioned in Section 4.3). We then find the mean log(sSFR) of galaxies in this mass range in time bins, tracking the evolution of the sSFR of typical star forming galaxies across cosmic time. Once this evolution is known, we calculate the main sequence slope by measuring the change in the mean log(sSFR) between stellar masses of and . In a given redshift bin, we use the mean low-mass sSFR and derived slope to define a mass-dependent main sequence line. We then define quiescent galaxies as having less than 25% of the sSFR of the main sequence line. Our quiescence divisor for a given redshift and stellar mass is given by
| (2) |
where is the slope we derived and is the mean log(sSFR) measured in the low mass bin (). The values of these quantities are determined separately for the model galaxies and for the observed galaxies. The coefficients for and the values of in each of our redshift bins are listed in Tables 1 and 2, respectively.
| Dataset | ||||
|---|---|---|---|---|
| SAM | -0.0012 | 0.039 | -0.499 | -7.640 |
| GAMA & CANDELS | -0.0017 | 0.039 | -0.398 | -7.513 |
| Redshift | SAM | GAMA & CANDELS |
|---|---|---|
| 0.021 | -0.303 | |
| -0.105 | -0.400 | |
| -0.054 | -0.144 | |
| -0.241 | -0.130 | |
| -0.377 | -0.236 | |
| -0.408 | -0.256 | |
| -0.487 | -0.370 |
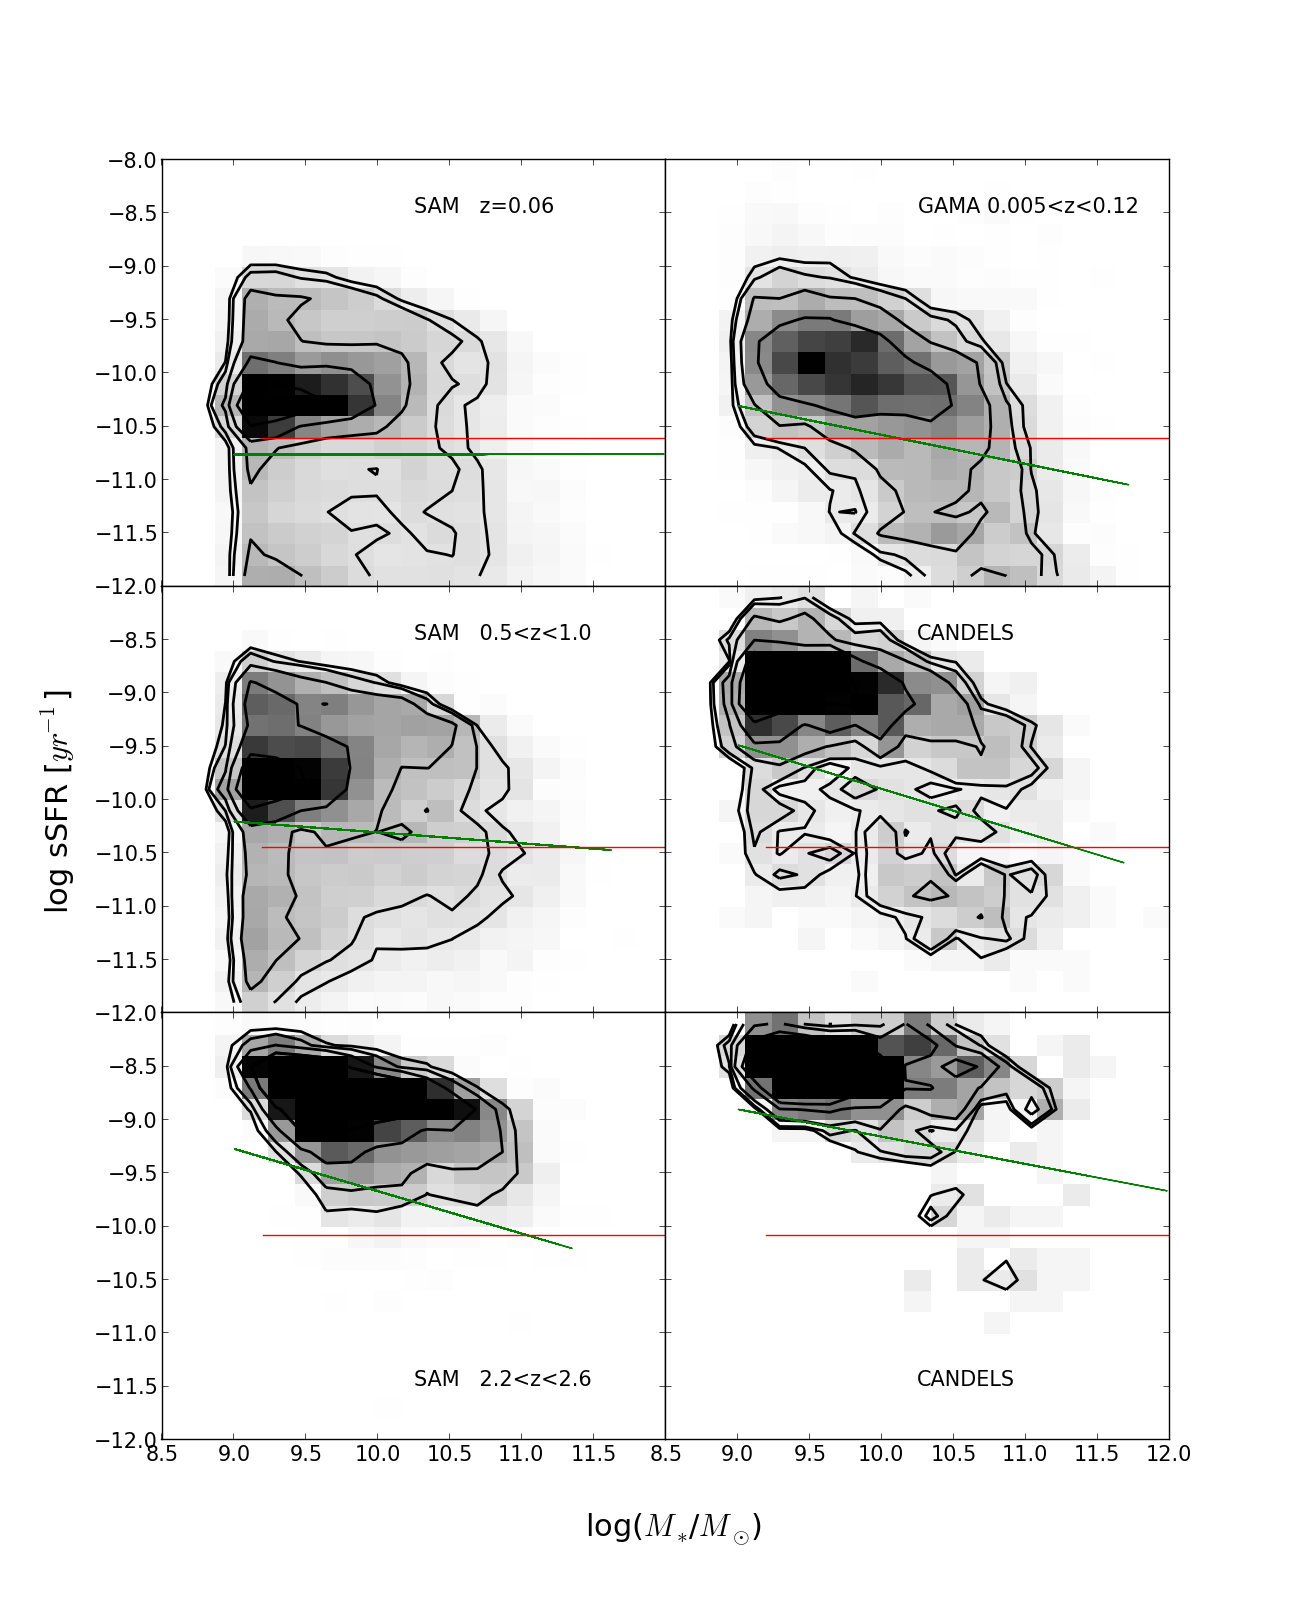
Figure 1 shows the division of star forming and quiescent galaxies for the model (including disk instability) and from the observations in the redshift bins , and . Although the galaxy sample we will use for the remainder of this work includes only galaxies with log(/)>10.0, here we plot galaxies down to stellar masses of , since these are the galaxies from which our dividing lines are derived. The green line indicates our split between star forming and quiescent galaxies. The red line is drawn at , where is the Hubble time at the median redshift of the bin, for comparison with alternate dividing lines commonly used in the literature. We apply the cut derived for the DI model to the noDI model as well, since we would like to see how the disk instability affects the sSFRs of galaxies within the model and that information would be lost if we allowed the cut to move between the two models. It is worth noting, however, that and are very similar between the two models. We can see in all three bins that the dividing line has a different slope and normalization for the models than for the observations.
3.1.2 Evolution of the Quiescent Fraction
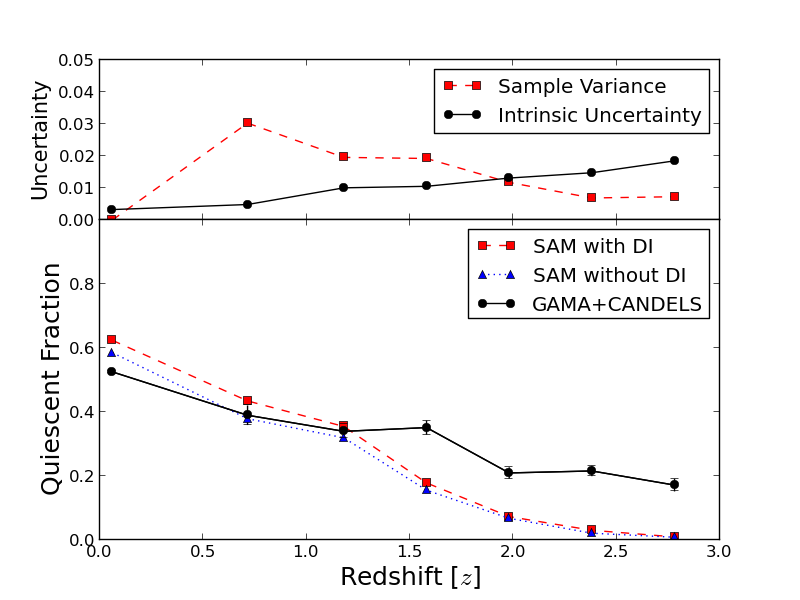
Figure 2 shows the evolution of the quiescent fraction of galaxies with redshift for galaxies from the SAM, both the DI and noDI models, and from observational data taken from GAMA and CANDELS. We compute 1- uncertainties due to field-to-field variance and uncertainty in observed galaxy properties (stellar mass, Sérsic index and star formation rate) as follows. Our lightcones are about nine times larger than the CANDELS fields that we are comparing with, so we select a model sample from a subsection of the lightcone that has comparable area. If we select different CANDELS-sized areas from our lightcone to do our analysis, we get a measure of the effect of cosmic variance. We also calculate the 1- error in the quiescent fraction due to uncertainties in the estimates of galaxy properties in the observational sample. We use quoted uncertainties in Sérsic index, assume an uncertainty of 0.25 dex for star formation rates and use the redshift-dependent stellar mass uncertainty of Behroozi et al. (2013b). The separate uncertainties due to cosmic variance and parameter estimation can be seen in the top panel. We add the uncertainty due to each in quadrature and apply them to the observations. In the lowest redshift bin, the error estimates reflect only the uncertainties due to errors in the physical parameters; these uncertainties dominate over the cosmic variance due to the large volume probed by GAMA. We note here that we are still likely underestimating uncertainties due to systematics such as the assumed star formation histories of CANDELS galaxies, possible variations in the IMF, etc.
The quiescent fraction of galaxies in the model is relatively insensitive (changing by <10% in all redshift bins) to the inclusion of disk instabilities in our models; as we will see, the net effect of the disk instability is mainly to create more bulge-dominated galaxies. This is due in part to the fact that our disk instability prescription does not affect gas and limits the amount of low-level AGN feedback that is triggered by disk instabilities. Both models agree well with observations at low redshift; for , the fractions differ by no more than . Above this redshift, however, the fractions begin to differ by about , with the model predicting fewer quiescent galaxies than are observed. Overall, the model exhibits a steeper evolution than the observed galaxies, predicting basically no quiescent galaxies at . It seems that the model is not quenching galaxies early enough. We will discuss possible reasons for this discrepancy later.
In Figure 3, we examine the mass dependence of the quiescent fraction evolution. The behavior is similar in each mass bin to the overall behavior in Figure 2. At redshifts above the model predicts a smaller quiescent fraction than is observed for all three mass bins. This discrepancy gets worse as the stellar mass increases. In the highest mass bin, the fractions can differ by as much as 40 %. This is an extension of the overall high redshift discrepancy in Figure 2; since our model predicts no quiescent galaxies (in any mass range) and in general more massive galaxies are likely to be considered quiescent, the gulf between our model quiescent fraction and the observed fraction widens as the masses considered become larger. In the two lower mass bins, the DI model actually overproduces quiescent galaxies by as much as 0.15 at , but it is in better agreement (within 0.05) with observations in the highest mass bin. As expected, the quiescent fraction increases for galaxies with higher stellar mass for both the model and the observations. The model also captures the steeper evolution of the quiescent fraction for higher masses, although again, the evolution in the model is steeper than observations for all mass bins.

3.2 Spheroid-Dominated Fraction
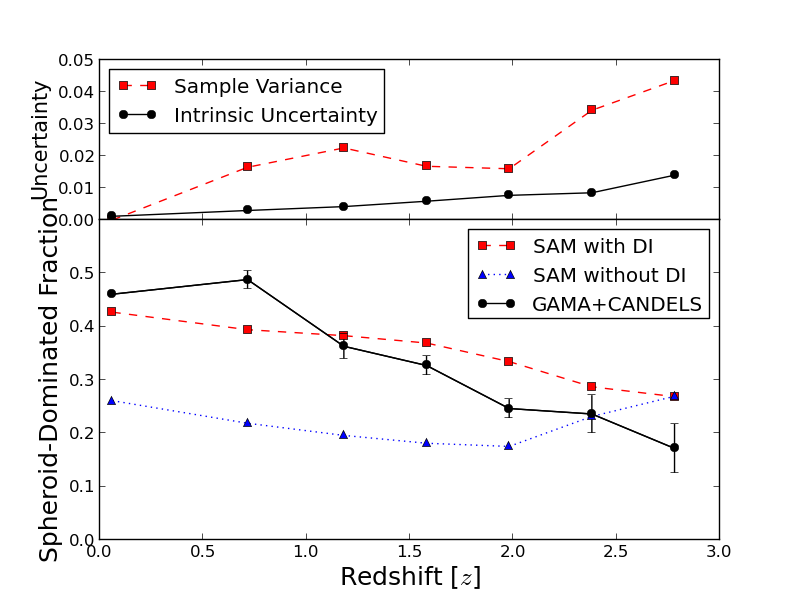
We now split galaxies into spheroid-dominated and disk-dominated populations. We define spheroid-dominated galaxies as having Sérsic indices greater than 2.5, the average of a pure disk () and pure bulge (), as has been done in many other studies (Shen et al., 2003; Lange et al., 2015; Bruce et al., 2014; Mortlock et al., 2015). We discuss later how making this spheroid-domination cut less stringent (at ) affects our results. We have also done the same analysis by dividing galaxies at a bulge-to-total mass ratio of 0.5. These results are very similar and can be found in Appendix B. Figure 4 shows the evolution with redshift of the spheroid-dominated fraction of galaxies. Here, we see the main effect of the disk instability. The noDI model severely underpredicts the fraction of spheroid-dominated galaxies at almost all redshifts, with the disagreement becoming worse towards lower redshifts. The DI model does a much better job of matching the observed spheroid-dominated fraction, increasing our prediction by almost a factor of two at low redshift; within the uncertainties, the fractions do not disagree by more than at any redshift. However, the evolution of the spheroid-dominated fraction in the model is somewhat shallower than in observations, so we overpredict the spheroid-dominated fraction at and underpredict it at .
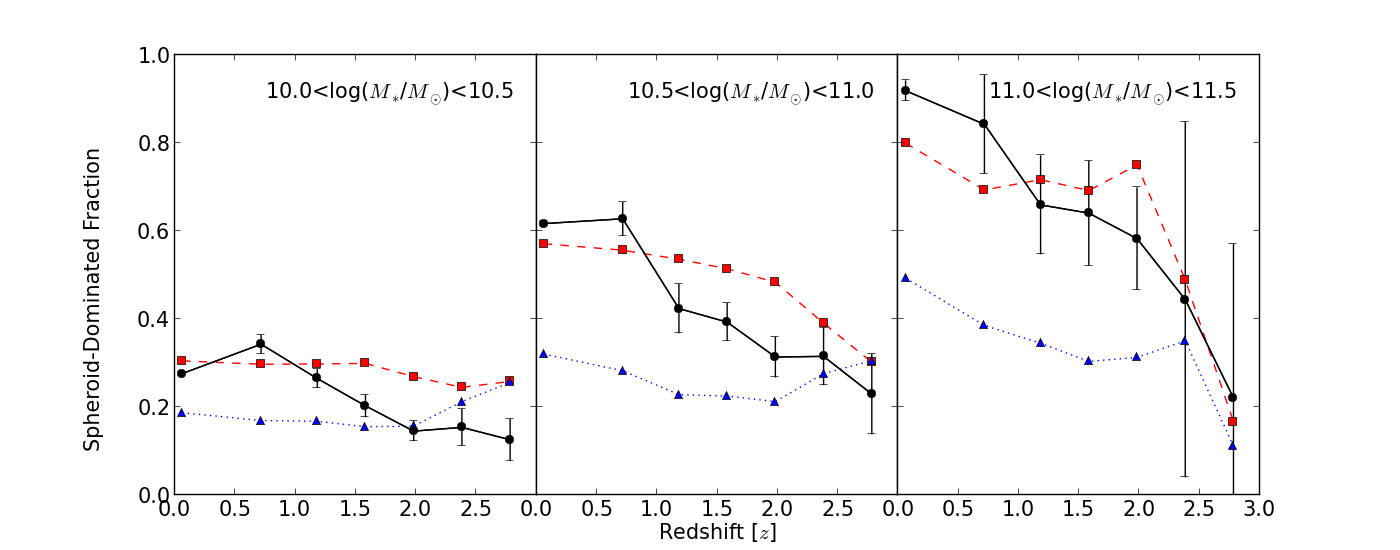
We once again investigate the mass dependence in Figure 5. Again, as expected, at larger masses, the spheroid-dominated fraction is greater at almost all redshifts, and the spheroid-dominated fraction increases more rapidly with redshift for massive galaxies. There appears to be a population of massive, disk-dominated galaxies at high redshift in both the observations and the model. The behavior in all three mass bins is reminiscent of the overall behavior in Figure 4, except for the high mass, high redshift case. As in Figure 4, the disk instability brings the model mainly into better agreement, although in the two lower mass bins at the fractions can differ by as much as , which is slightly more than for the overall population.
3.3 Comparison with Previous Results
We take a moment here to compare with previous work that has probed the evolution of the quiescent and spheroid-dominated fractions of galaxies. Brammer et al. (2011) and Muzzin et al. (2013b) both examine the dependence of the quiescent fraction on stellar mass across a range of redshifts. Brammer et al. (2011) examine galaxies from the NEWFIRM Medium-Band Survey (NMBS) (van Dokkum et al., 2009; Whitaker et al., 2010) while Muzzin et al. (2013b) observe a sample of galaxies in the COSMOS/UltraVISTA field (Muzzin et al., 2013a) over a similar redshift range. Our observational results are in good agreement with both studies. The quiescent fraction is higher at larger stellar masses and lower redshifts and the quiescent fraction of high stellar mass galaxies increases more steeply with redshift than that of low mass galaxies. The quiescent fraction evolution of our high mass bin () is in good agreement with Brammer et al. (2011); in both cases, the fraction increases from at to –0.9 at 0.5. Muzzin et al. (2013b) is in good agreement with our high mass quiescent fraction as well, but also investigates the quiescent fraction down to lower stellar mass so we can compare our lower mass bins. These also agree very well. For galaxies with , the quiescent fraction increases from at 2 to at 0.2–0.5. Meanwhile, the quiescent fraction of galaxies with increases from at to –0.6 at 0.2–0.5.
In terms of spheroid-dominated fraction, Buitrago et al. (2013) examines the fraction of spheroid-dominated galaxies with masses > from to the present day. They cover this range by combining several different surveys: SDSS DR7 (Abazajian et al., 2009), POWIR/DEEP2 (Bundy et al., 2006; Conselice et al., 2007) and the GOODS NICMOS Survey (GNS;Conselice et al. 2011). They find a steady increase in the fraction of spheroid-dominated galaxies () whereas, when the same mass cut is applied (as can be seen in the right panel of Figure 5), we predict a sharper increase in spheroid-dominated fraction from % at to % at . Because of this, we predict a somewhat larger spheroid-dominated fraction than theirs between and 2. Bruce et al. (2014) observe galaxies with > in the COSMOS and UDS fields from the CANDELS survey over the redshift range 1<<3. They use bulge-disk decompositions to sort galaxies by and compute the spheroid-dominated fraction. They find a spheroid-dominated fraction of for and a fraction of for . This is in very good agreement with our results (again cutting at and now defining spheroid-dominated as having >0.5); we find a spheroid-dominated fraction of for and for .
3.4 Dividing into Quadrants
Having divided the sSFR-Sérsic plane in halves, we now further divide the plane into four quadrants to examine the evolution of the populations in each one: SFDs, QSs, SFSs and QDs. Figure 6 shows an example of the division of galaxies into quadrants for both the model and the observations in the redshift bins , and . The star formation division line is a least mean squares fit to the individual star formation thresholds for each galaxy in the redshift bin according to its stellar mass and specific redshift. Figures 7 and 8 show the distributions of Sérsic index and sSFR for our DI models and for the observations in the redshift bin . In both cases, the distributions are similar, but not exactly the same. Our model has trouble reproducing the strong observed bimodality in both quantities; our disk instability creates many galaxies of intermediate Sérsic index. As we move toward lower redshift, the differences between the distributions of model and observed galaxies become more significant. We will return to this point in the discussion.
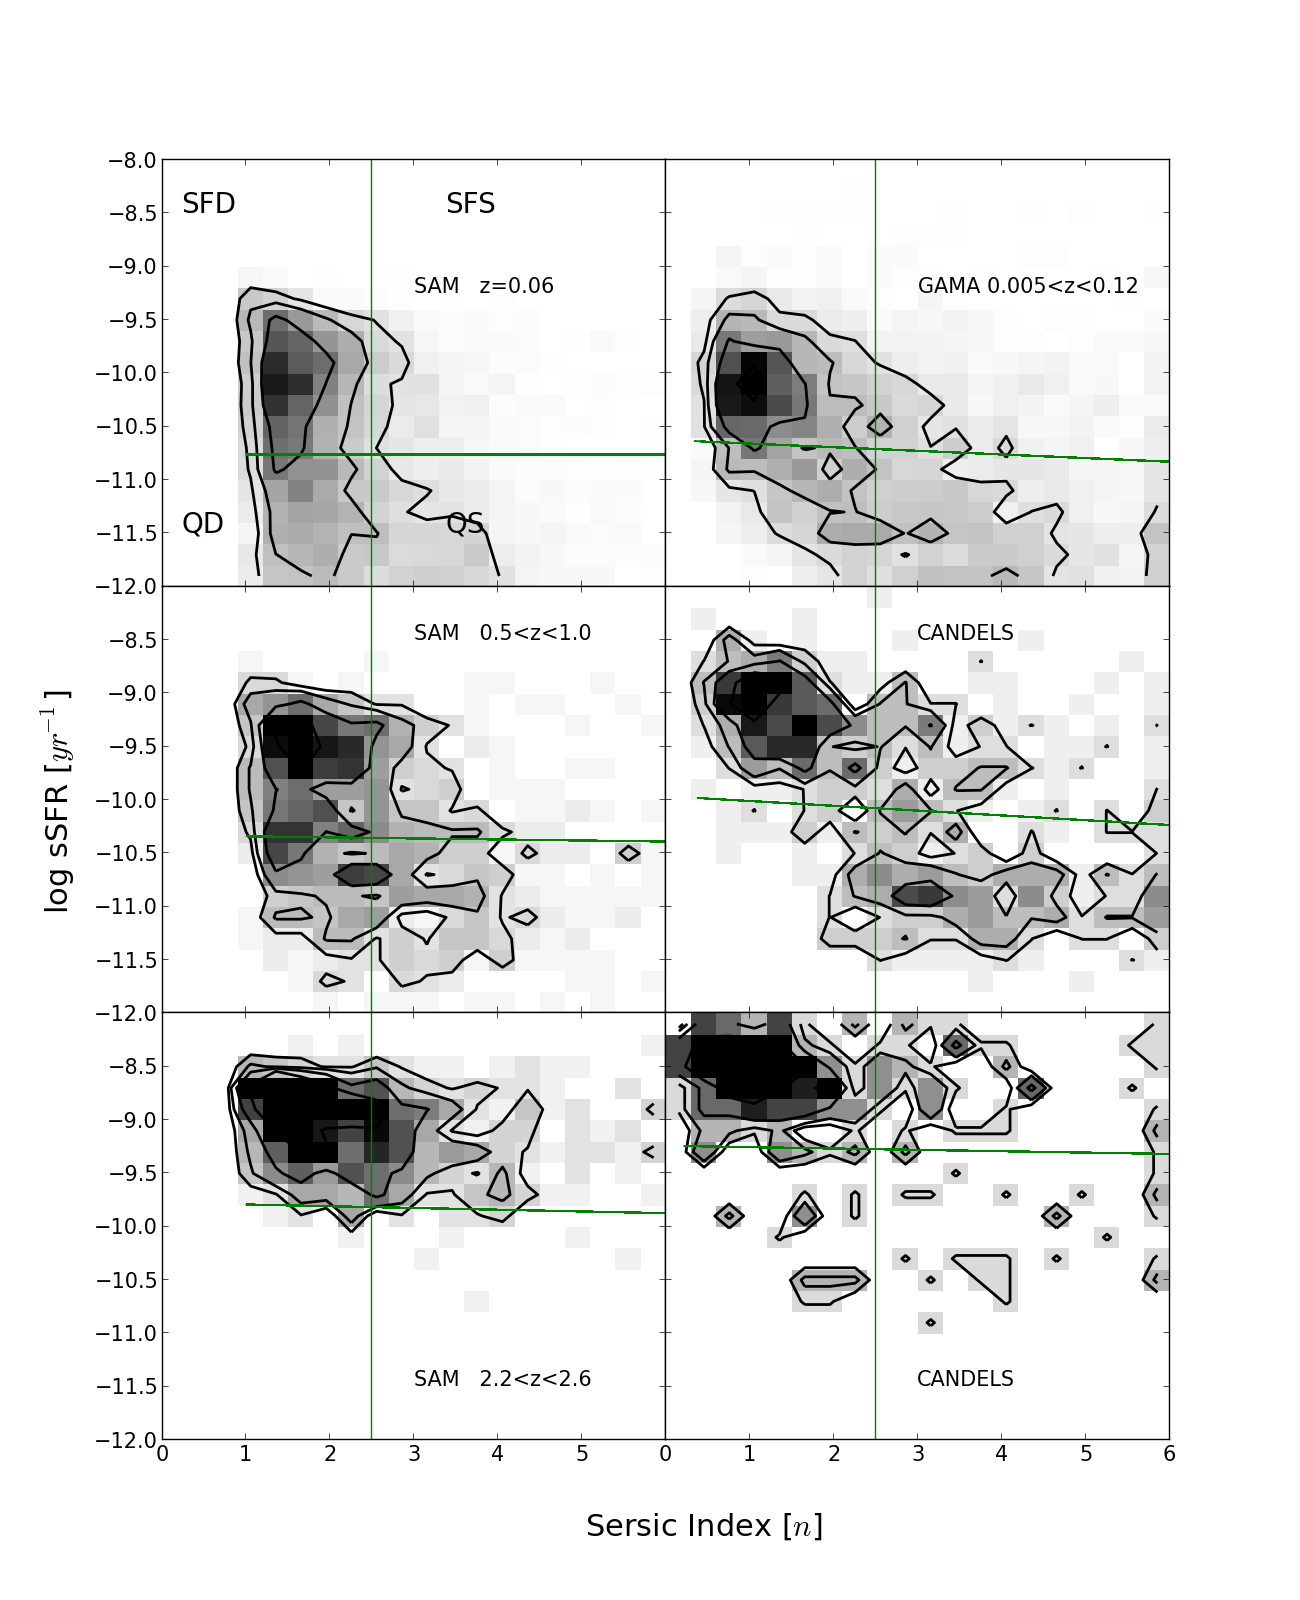
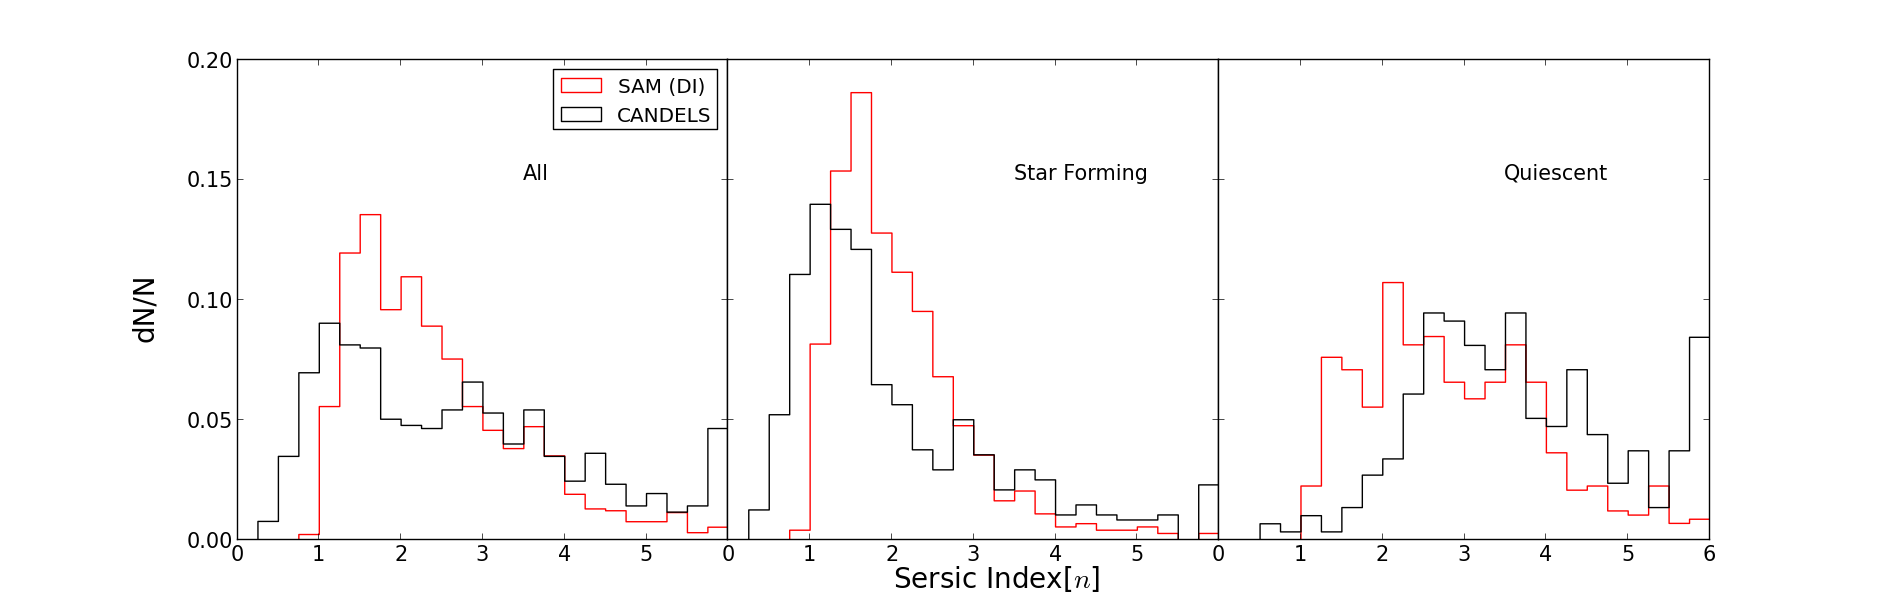
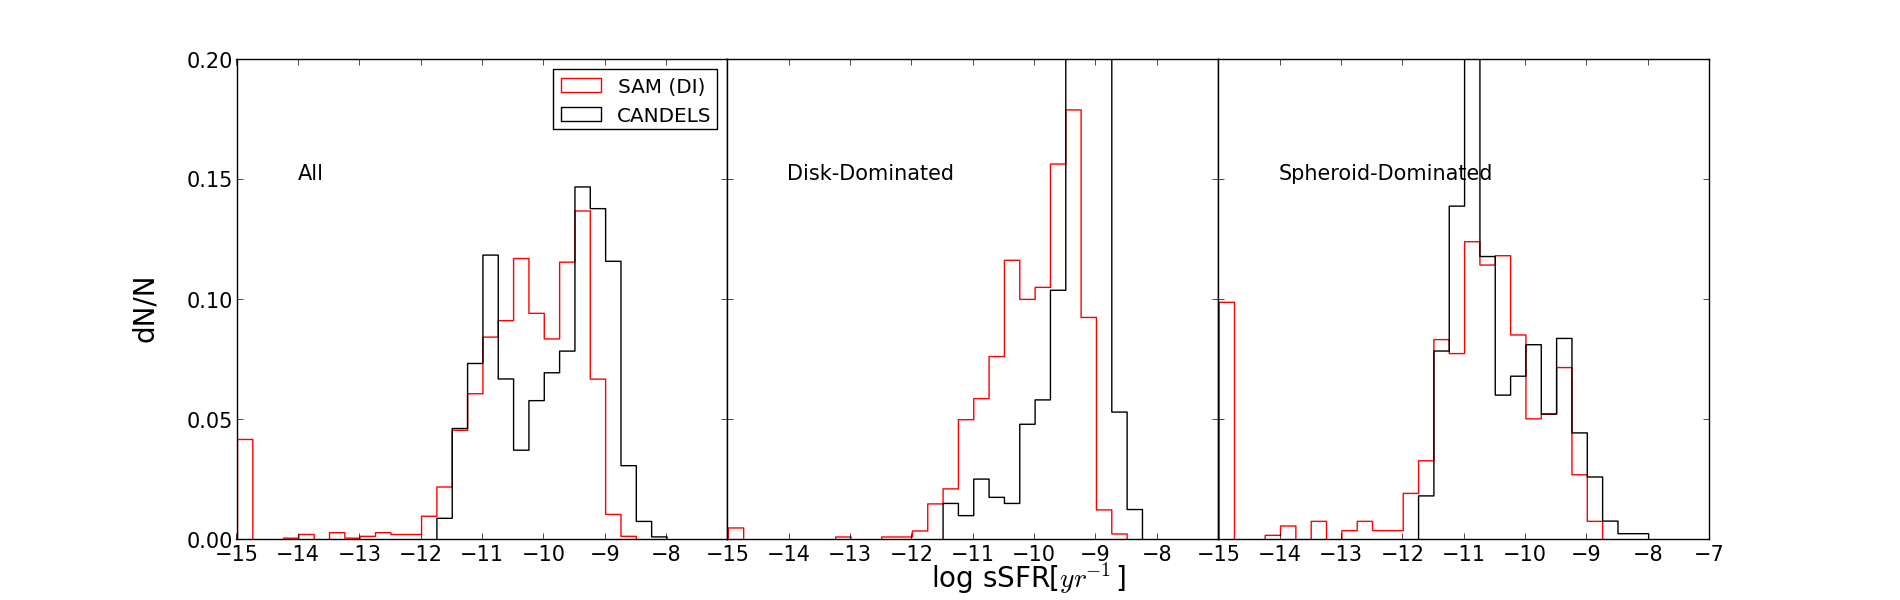
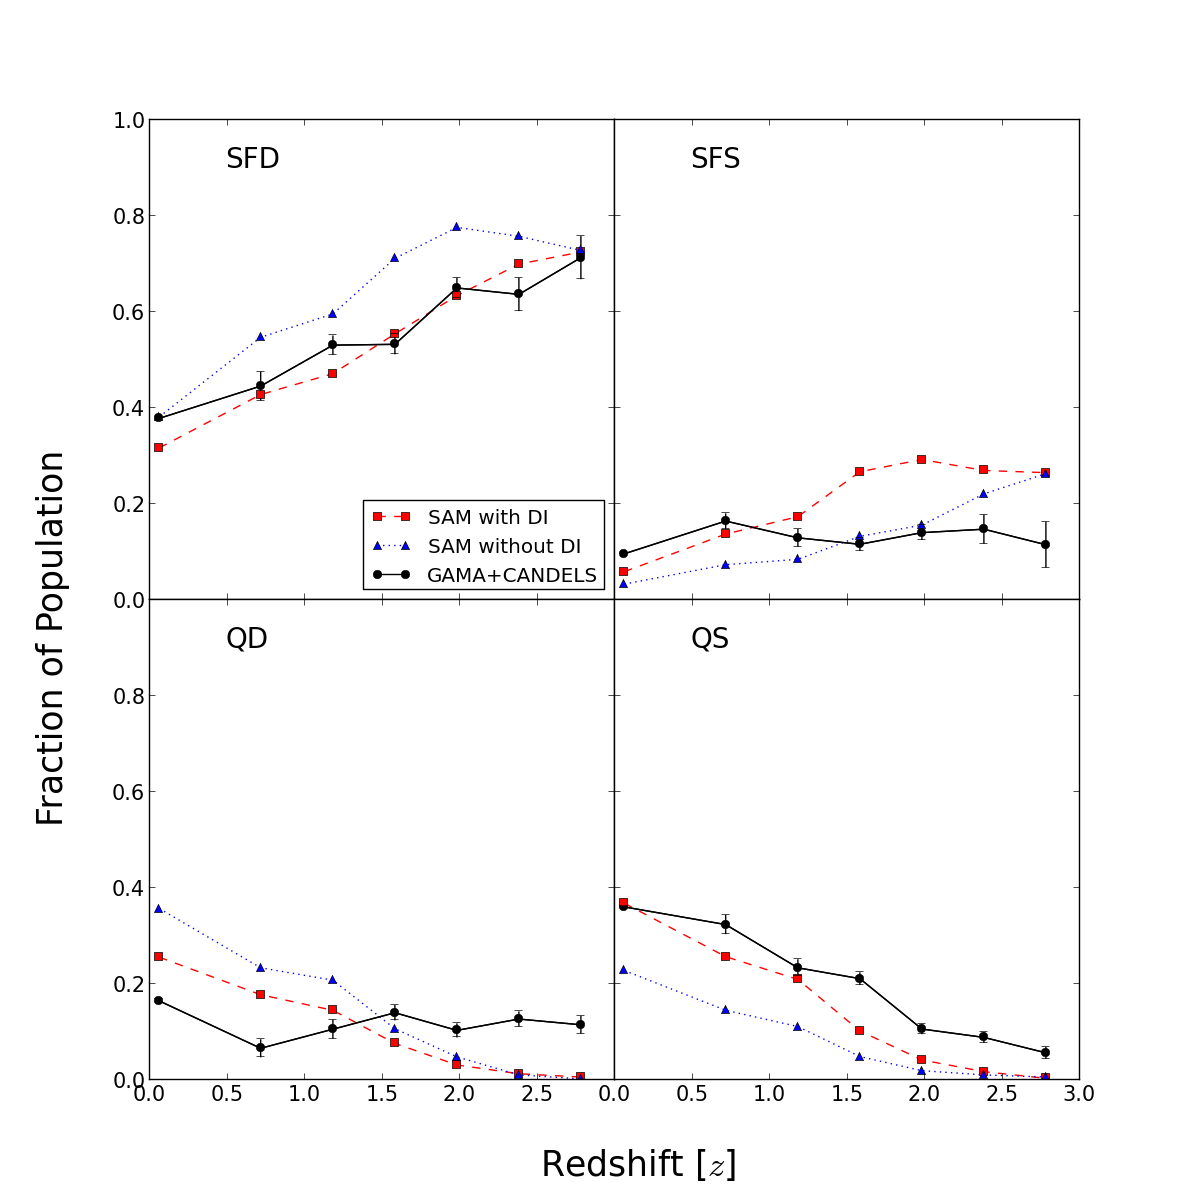
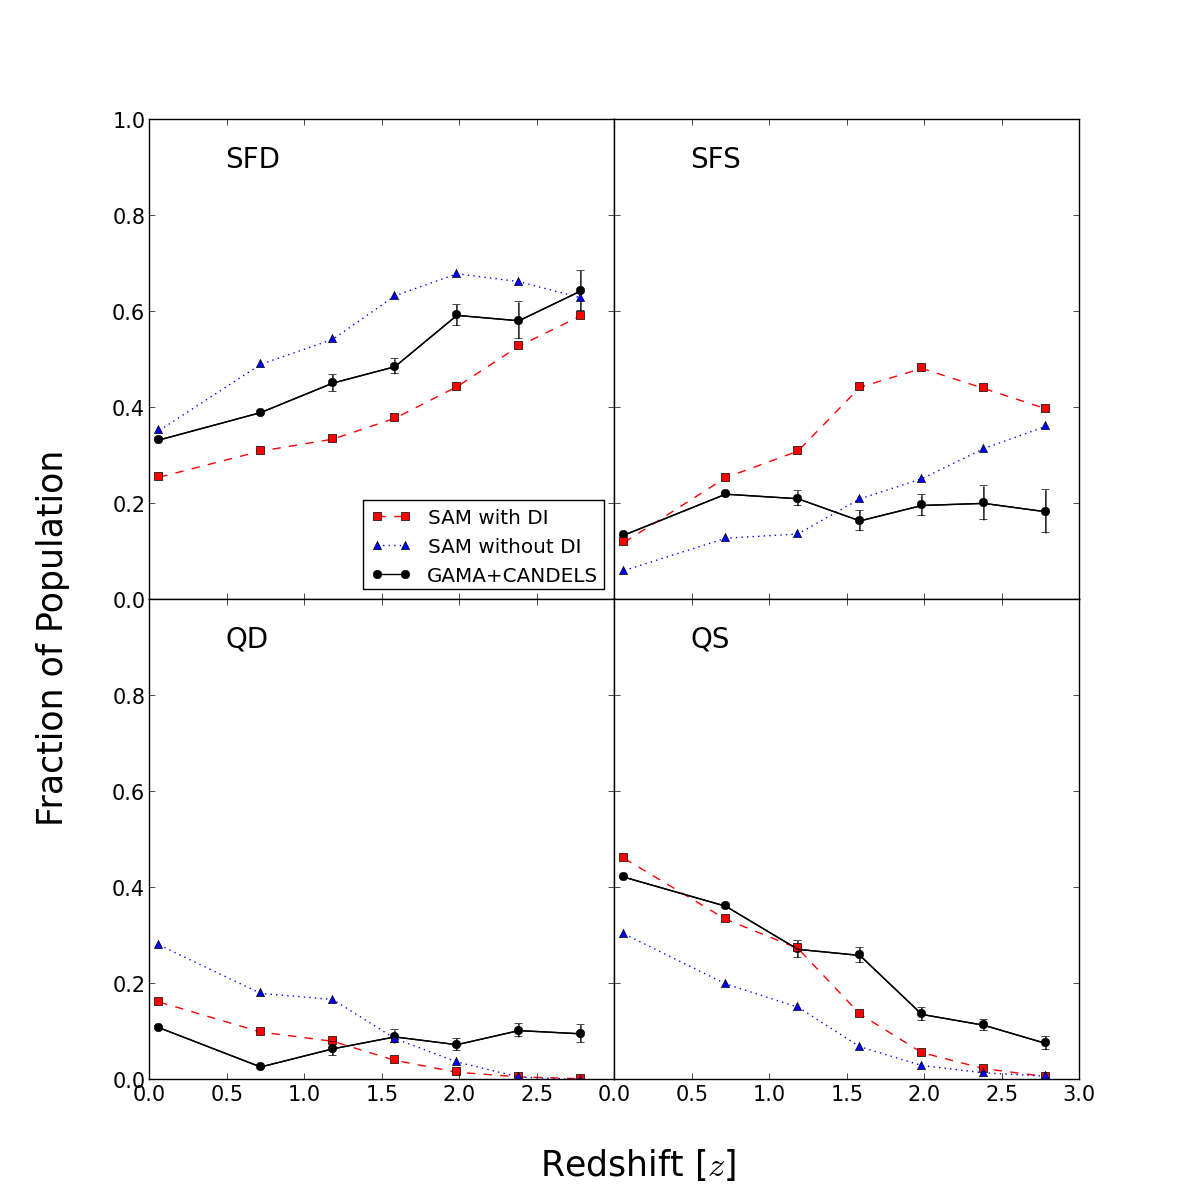
Figure 9 shows the evolution of the fraction of all galaxies in each quadrant with redshift for the DI model, the noDI model and the observations. We see here again the reason for the difference in how the quiescent and spheroid-dominated fractions change with the disk instability: the disk instability decreases the fraction of QDs while increasing the fraction of QSs, leaving the quiescent fraction relatively unchanged. The two spheroid-dominated populations, however, are both increased, leading to the large change in the overall spheroid-dominated fraction. The DI model reproduces the evolution of SFDs to within a few percent as their numbers dwindle due to various transformative processes. The noDI model predicts too many SFDs, the model and observed fractions differing by as much as 0.2. The DI model reproduces the observed fraction of QSs at , but slightly underproduces QSs at higher redshifts, although the fractions do not differ by more than . The noDI model underproduces QSs at all redshifts, to an even larger degree. Both models underpredict the fraction of QDs at (which is again an extension of the overall issue seen in Figure 2) and overpredict them at . Once again, the disagreement is worse when the model with no disk instability is considered. While the models match the observed fraction of SFSs to a few percent at redshifts , they predict too many at high redshift, in some cases by a factor of two. It becomes clear when comparing the two models that the disk instability is mostly responsible for the excess of SFSs that we predict at redshifts . At redshifts higher than this, mergers seem to become increasingly important as a channel for bulge growth. We expect some SFSs in the universe to have disturbed morphologies due to the process responsible for making them an SFS. It is possible that some of the CANDELS galaxies that would be classified as SFSs are dust obscured and are either not detected or not considered star forming, leading to an underestimate of the fraction of SFSs. While we do include the effect of dust extinction in our model, as well as make the same -band magnitude cut as is used for CANDELS, the possibility remains that we are underestimating dust extinction. This would cause objects that are missed in CANDELS due to the -band magnitude limit to be included in our model catalogs. It is not unreasonable that we would be underestimating the effects of dust in these objects in particular, as our prescription is based on an undisturbed disk geometry and does not account for the possibly heavily-obscured starbursting systems we are concerned with in the SFS quadrant.
We also note here that changing our cut in Sérsic index from to , which still distinguishes systems with significant bulge components, does change our results somewhat as the distribution of in the models is different from the observed distribution (as seen in Figures 6 and 7). The spheroid-dominated fraction increases more for the DI model than for the observations, especially at higher redshifts. The noDI model is changed very little. When looking at different mass bins as in Figure 5, the change of the spheroid-dominated fraction of the DI model relative to the observations is more pronounced in the two lower mass bins than in the highest one. Figure 10 shows the evolution of the fraction of all galaxies in each quadrant for the morphology cut at . The DI model now underpredicts the fraction of SFDs by about 0.1-0.15 at all redshifts and overpredicts SFSs at high redshift by an even larger amount (as much as 0.4). The fraction of QSs matches the observational results well at but still underpredicts these objects at higher redshifts. However, qualitatively the results are very similar, so we continue to use our cut for the rest of this work.
Now, knowing both where our model succeeds and fails in matching the buildup of these populations, we can dig into the model to see which mechanisms are responsible for moving our simulated galaxies in the sSFR- plane.
4 Discussion
The SAM can provide us with details about galaxy formation histories which we cannot glean directly from observations; we now examine the statistics of events that drive galaxy tranformation and quenching (mergers and disk instabilities) in our models, and provide representative examples of how individual galaxies trace out their histories in the sSFR- plane.
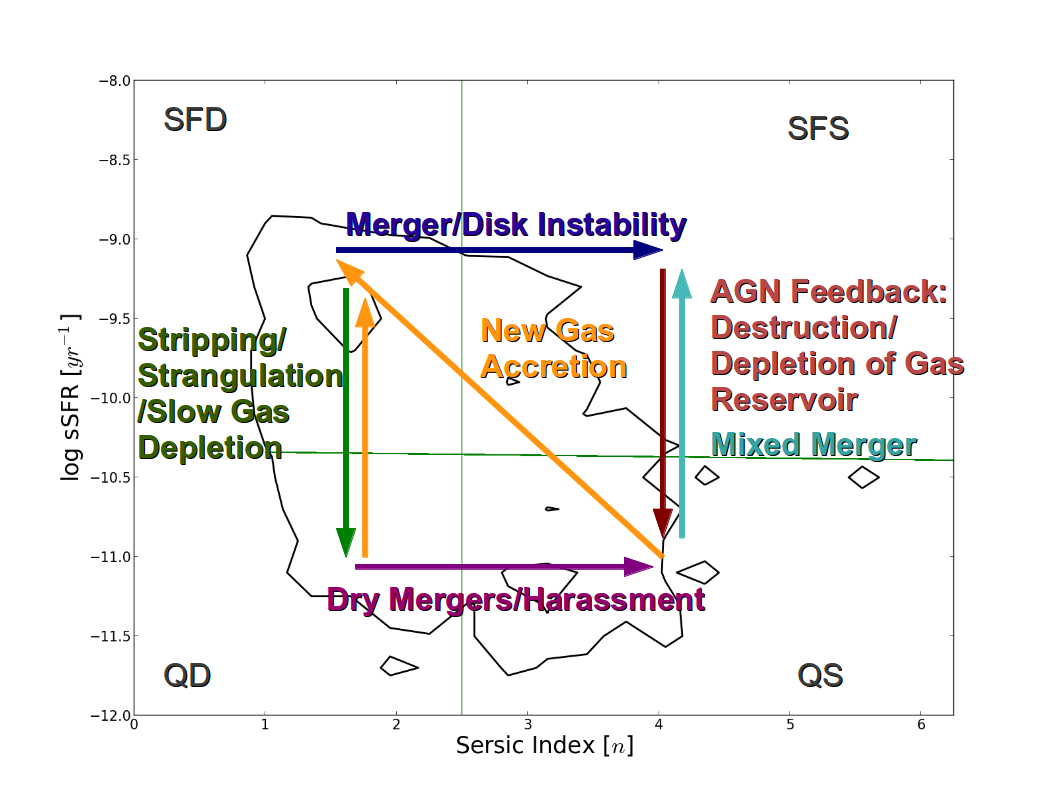
Figure 11 shows density contours for galaxies from the SAM () in the sSFR- plane. Overlaid arrows show how different physical processes might move galaxies in this diagram. SFDs may merge with each other or suffer disk instabilities to form bulge-dominated galaxies which then undergo gas depletion by AGN feedback, leading to quenching of star formation. In the SAM this occurs over relatively short time scales of several hundred million years. Meanwhile, other SFDs may passively evolve, depleting their gas reservoirs over much longer time scales of a Gyr or more, eventually becoming QDs, which may then experience dry (gas-poor) mergers which puff them up and form QSs. Quiescent galaxies may then accrete new gas which allows regrowth of a disk component. We now examine the importance of some of these processes in the SAM in a bit more detail.
4.1 How Recently Have Different Types Been Disturbed?
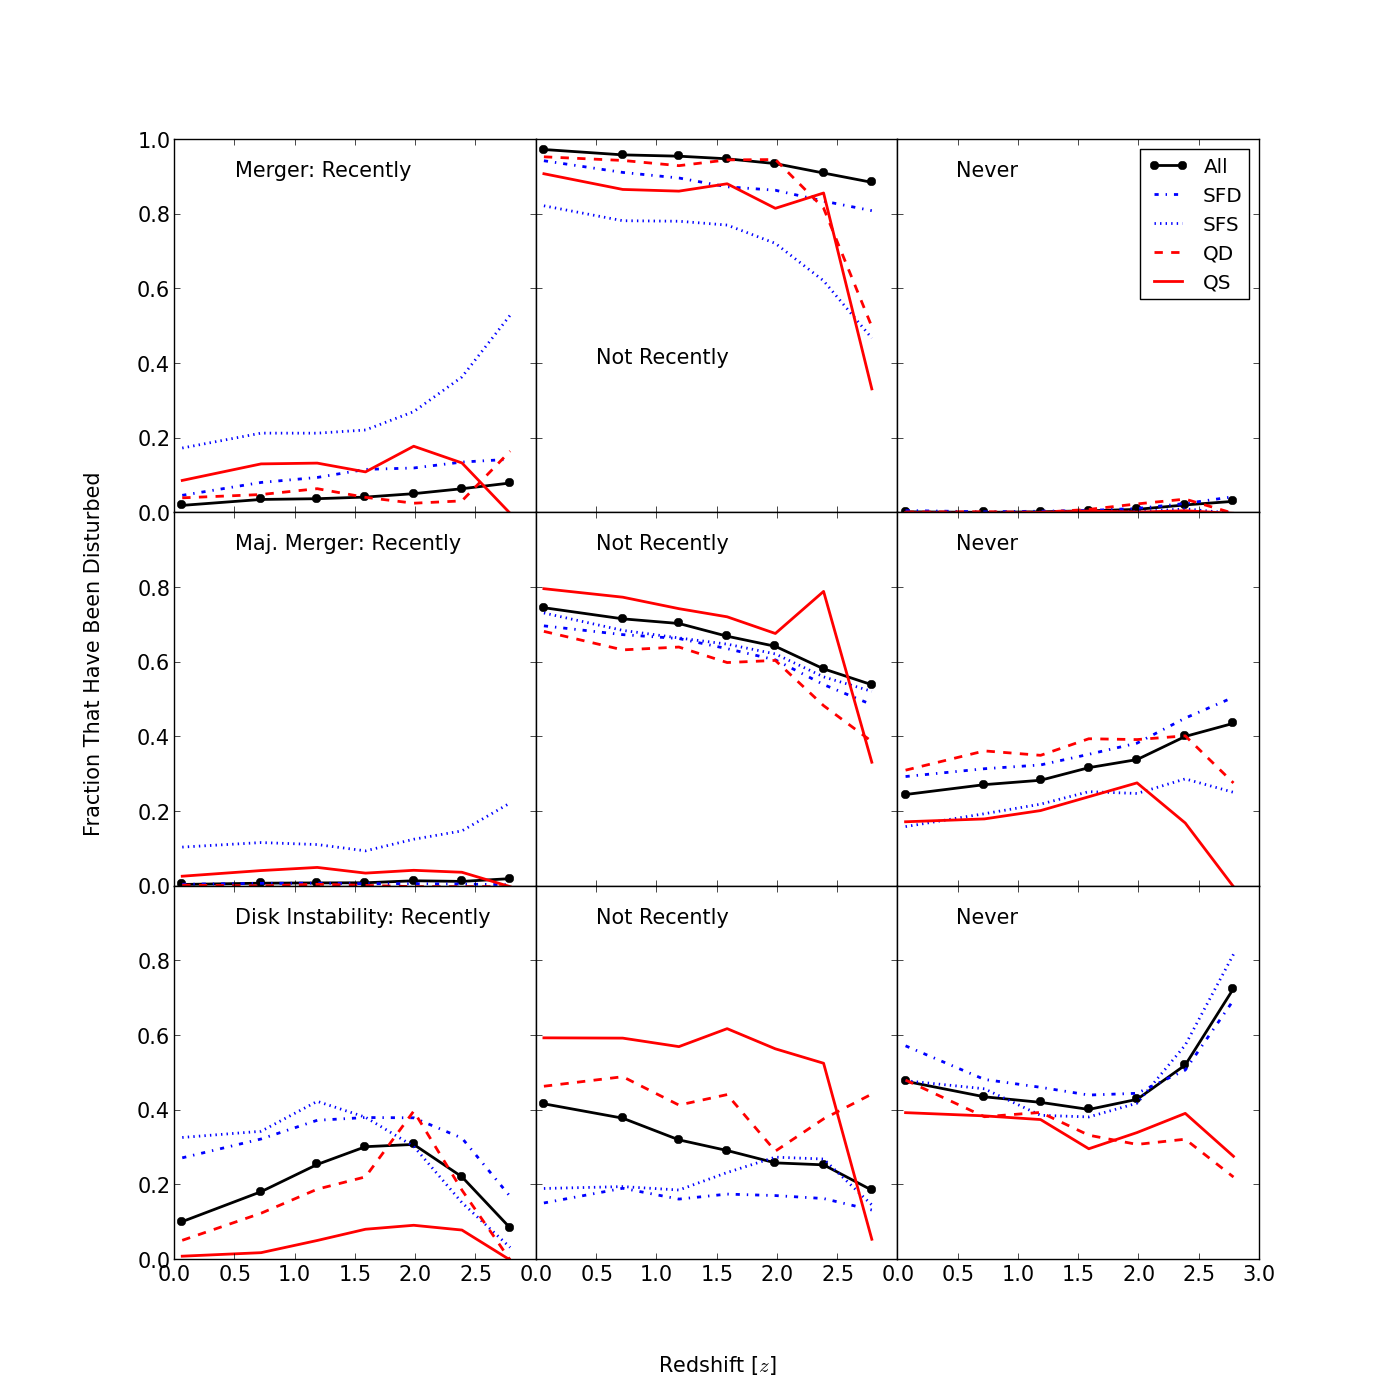
We would like to know how galaxies in different quadrants in the sSFR-Sérsic plane are formed or evolve to their current state and with the SAM we can directly measure the time since traumatic events such as mergers and disk instabilities. In the top left panel of Figure 12, we look at the fraction of > galaxies of each type which have undergone a recent merger, with “recently” being defined as within three dynamical times (where ). We see that SFSs are more likely to have experienced a recent merger at all redshifts, while very few QDs have undergone a recent merger. SFDs and QSs fall in between. All types of galaxies are more likely to have experienced a recent merger at higher redshift. In the top right panel, we see that almost no galaxies at any redshift have avoided ever having a merger in their lifetime.
In the middle row, we restrict our attention to major mergers with a mass ratio >1:3 (the mass used to calculate this ratio is the combined baryonic (cold gas+stellar) and dark matter mass within 2 halo scale radii; see S08) and see that basically no QDs have undergone recent major mergers, while the fraction of SFDs with recent major mergers is only slightly higher (no more than %). This is because it is very unlikely to experience a major merger and still retain enough of a disk to be considered disk-dominated within a dynamical time of the merger. QSs are slightly more likely to have undergone a recent major merger than SFDs, while 65-80% (depending on redshift) have undergone a non-recent major merger. This is simply because very soon after a major merger, the merger-triggered starburst would cause the spheroid-dominated galaxy to be classified as an SFS. After some time has passed and star formation has been quenched, it would be classified as a QS. For this same reason, SFSs are the least likely to have undergone a non-recent major merger; if the major merger wasn’t recent, they’re unlikely to still be star forming. SFSs are still most likely to have had a recent major merger and that likelihood increases somewhat towards higher redshift. The disk-dominated classes are actually more likely to have had a non-recent major merger than never to have had one at all, after which they must have regrown a substantial disk component. Unsurprisingly, the disk-dominated populations are more likely to have never had a major merger than the spheroid-dominated populations.
In the bottom row, we see that the fraction of all types which have undergone a recent disk instability peaks at . We note that this is in qualitative agreement with the peak of the clumpy fraction of galaxies (in the mass range 9.8<log(/)<10.6) found in Guo et al. (2015). We cannot make a quantitative comparison with these results as we have no way to estimate clumpiness in our models, but clumpy galaxies are expected to be associated with minor mergers and disk instabilities (Dekel et al., 2009).
Our star forming classes are more likely than our quiescent classes to have undergone a recent disk instability, but the fraction of SFSs plummets towards higher redshift, signaling the fact that mergers seem to be the dominant bulge-growing channel at high redshift, with disk instabilities increasing in importance as mergers become less frequent, as has been speculated in previous works (Parry et al., 2009; De Lucia et al., 2011; Fontanot et al., 2012). QSs are much more likely to have never had a disk instability, or to have had one longer ago (since it has likely been a while since they had a disk). QDs are just as likely to have had a disk instability recently, not recently, or not at all, suggesting that disk instabilities don’t play a huge role in their evolution. Finally, a significant fraction of all types (40-60%) have never experienced a disk instability. This fraction increases steeply towards high redshift, presumably because the merger rate increases and it is less likely for a galaxy to go undisturbed long enough to develop an instability on its own.
We note that there is a large amount of uncertainty in the highest redshift bin for our quiescent classes. There are very few galaxies classified as quiescent and so we suffer from small number statistics in that bin.
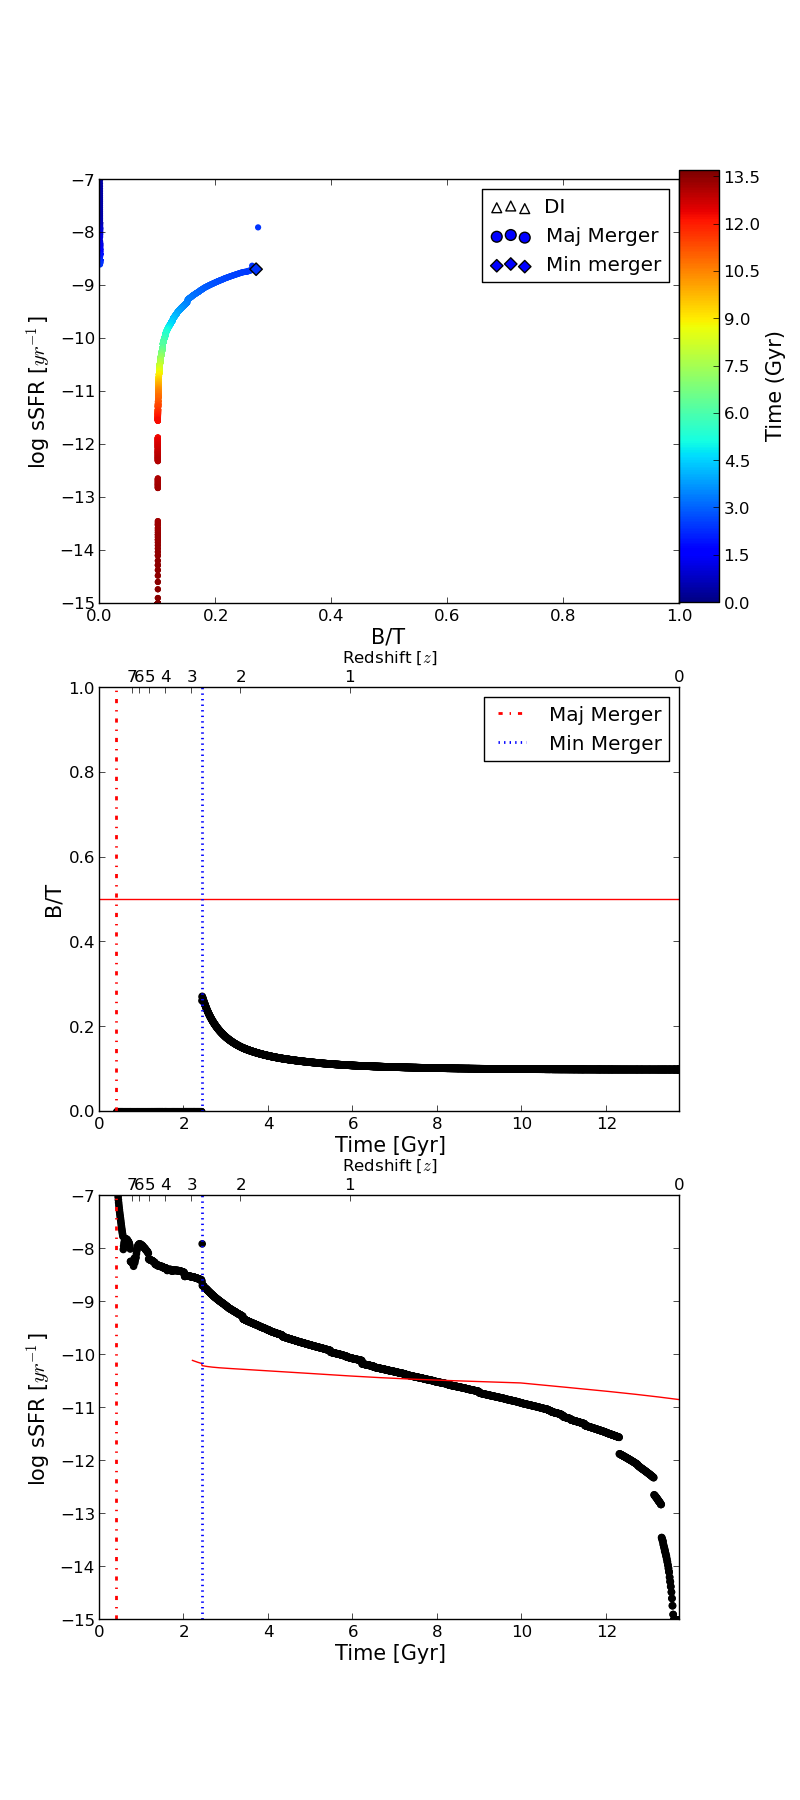
4.2 Individual Galaxy Histories
To illustrate how individual galaxies evolve, we now inspect the evolutionary tracks of four galaxies selected from the SAM, which end up in the four different quadrants of the sSFR- plane at . Here we use bulge-to-total mass ratio as our proxy for morphology, since the tracks in the sSFR-morphology plane are much easier to see this way (and because the results are very similar: see Appendix B). Figure 13 shows the evolutionary path of a galaxy with a fairly quiet history that ends up as an SFD. This galaxy has a mass of at . The top panel is its track in the sSFR-morphology plane, color coded by the age of the universe. The bottom and middle panels are the evolution with time of the morphology and sSFR respectively. We see that this galaxy has a few mergers early on after which its evolution is entirely due to accretion of new material, allowing it to continue forming stars. The decrease in following the merger events is due to the regrowth of a disk component.
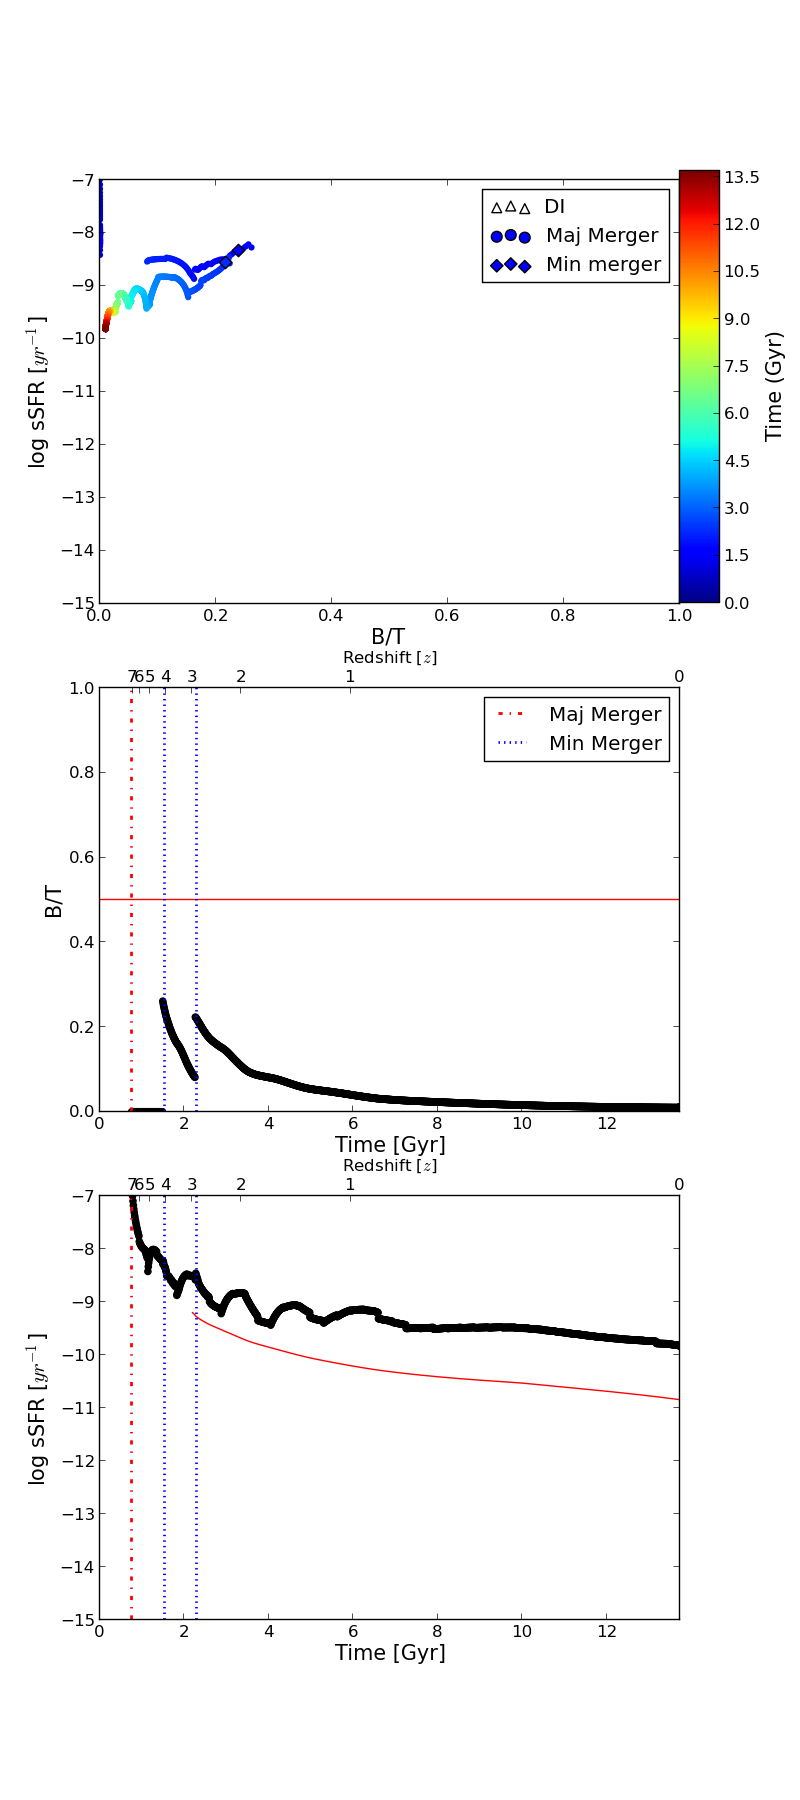
Figure 14 is a somewhat striking example of a galaxy being pummeled repeatedly by mergers until it is almost entirely bulge dominated, after which it finds itself unable to form more stars because of the black hole it has grown over the course of its traumatic history; the black hole is now keeping any remaining gas too hot for star formation through radio-mode feedback. This can also be effected by one (or more) big major merger(s). In both cases, it is likely that the system will make an appearance as an SFS for a time before quickly evolving into the QS quadrant. Once a galaxy falls into this quadrant, it tends to stay there, except for very rarely when it collides with a gas-rich galaxy, at which point it might briefly return to the SFS quadrant before quickly using up all of its new gas and falling back down again. This can be seen in the very short spikes of star formation accompanying the last two mergers in the bottom panel. This galaxy is far more massive than the SFD above, with a stellar mass of , which is due to all of the merger events it has experienced and is consistent with many of the most massive galaxies in the universe being QSs. We note that the QS population in the models is much more concentrated toward lower Sérsic index than that from the observations, as can be seen in Figure 6. Our model is still not producing enough very bulge-dominated galaxies. As the most massive bulges are believed to be the result of mergers, this may indicate that we are still underestimating the role of merging.
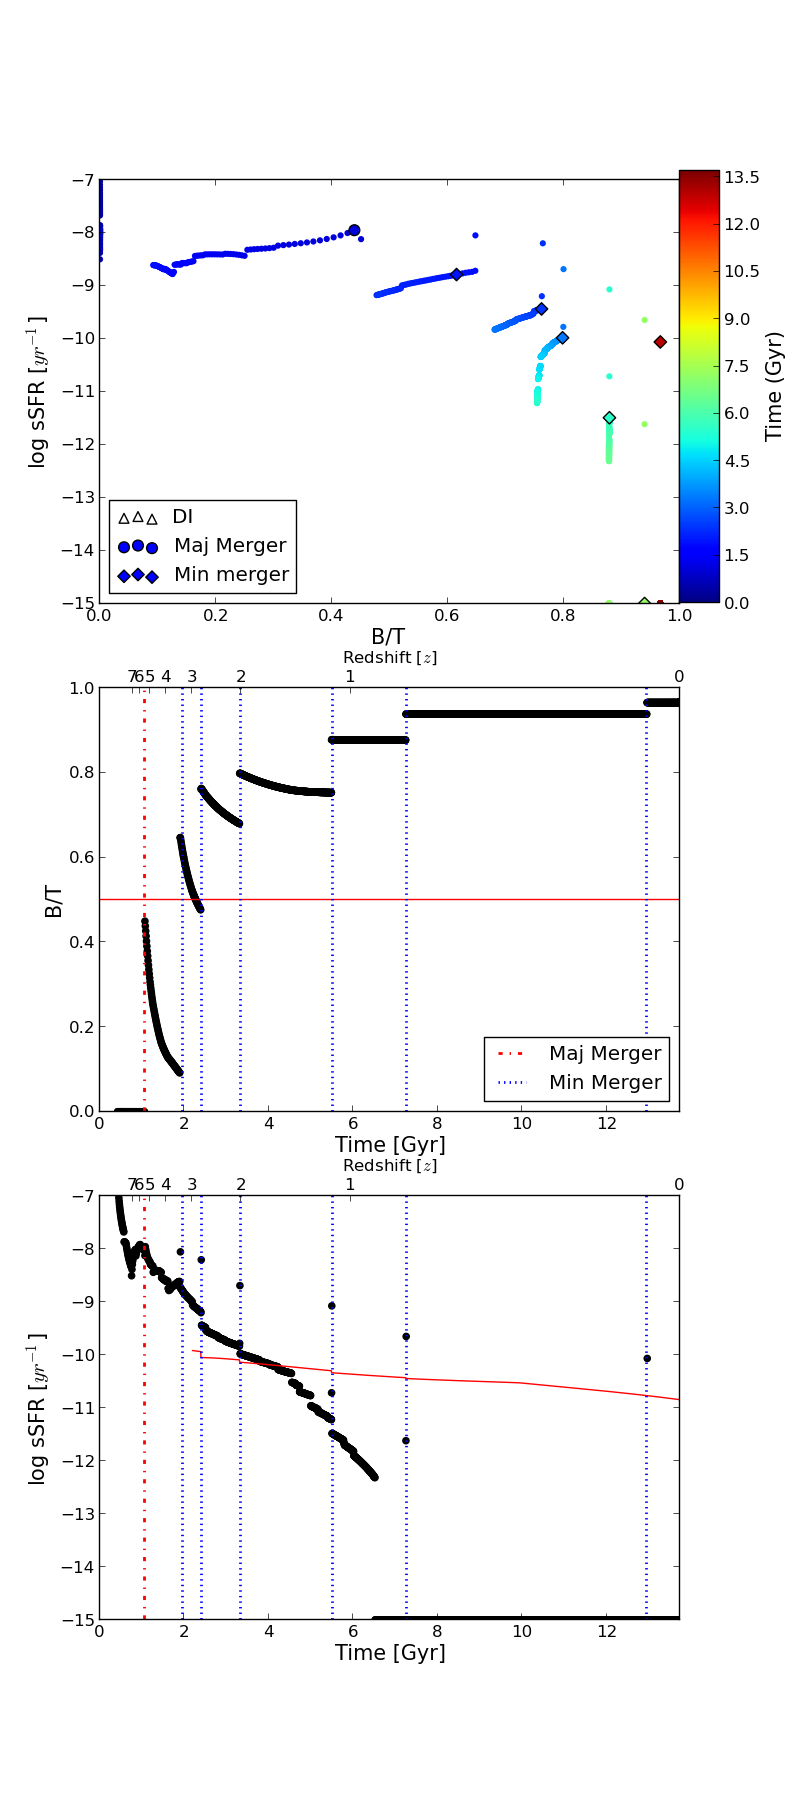
Figure 15 shows the evolution of a galaxy that ends up as an SFS. Its final mass is , which is more massive than the SFD considered above because of its more active merger history. We see here what a major merger can do in terms of bulge growth: the first major merger this galaxy experiences gives it a substantial bulge component. After each bulge growth episode, the galaxy begins to regrow a disk, causing to decrease steadily. This is the case for many galaxies in the SAM, as long as they have the gas to form new stars or continue to accrete new gas from the IGM. Changes in sSFR between merger events for this system are largely due to the interplay between “normal” star formation and new gas accretion. If this galaxy had not undergone a major merger recently, it would not have been considered an SFS, as the steady regrowth of its disk would have caused it to be classified as disk-dominated instead.
The SFS quadrant is more of a way station than a destination in galaxy evolution, with galaxies either quickly evolving back towards the SFD quadrant by regrowing their disks, or evolving downwards into the QS quadrant as they quench (this system is very close to being classified as a QS). This can be seen in Figure 6, where the SFS quadrant appears more to be made up of the tails of populations in the SFD and QS quadrants than to be a distinct population. This is something upon which the models and observations appear to agree, and is an explanation for why the evolution of the overall spheroid-dominated fraction is less steep than for the quiescent fraction: there is high turnover in the SFS quadrant so the fraction in that state is relatively constant, meaning that the buildup of the spheroid-dominated population relies mainly on the steady buildup of QSs. Meanwhile the quiescent fraction is built up by the steady growth of both the QS and QD populations. This interpretation seems to be corroborated by the CANDELS-based study of Rizer et al. (in prep.), in which visual morphological classifications are used. They find that while their QS population builds up steadily, their SFS population remains relatively constant, suggesting that bulge growth is leading to star formation quenching in many cases.
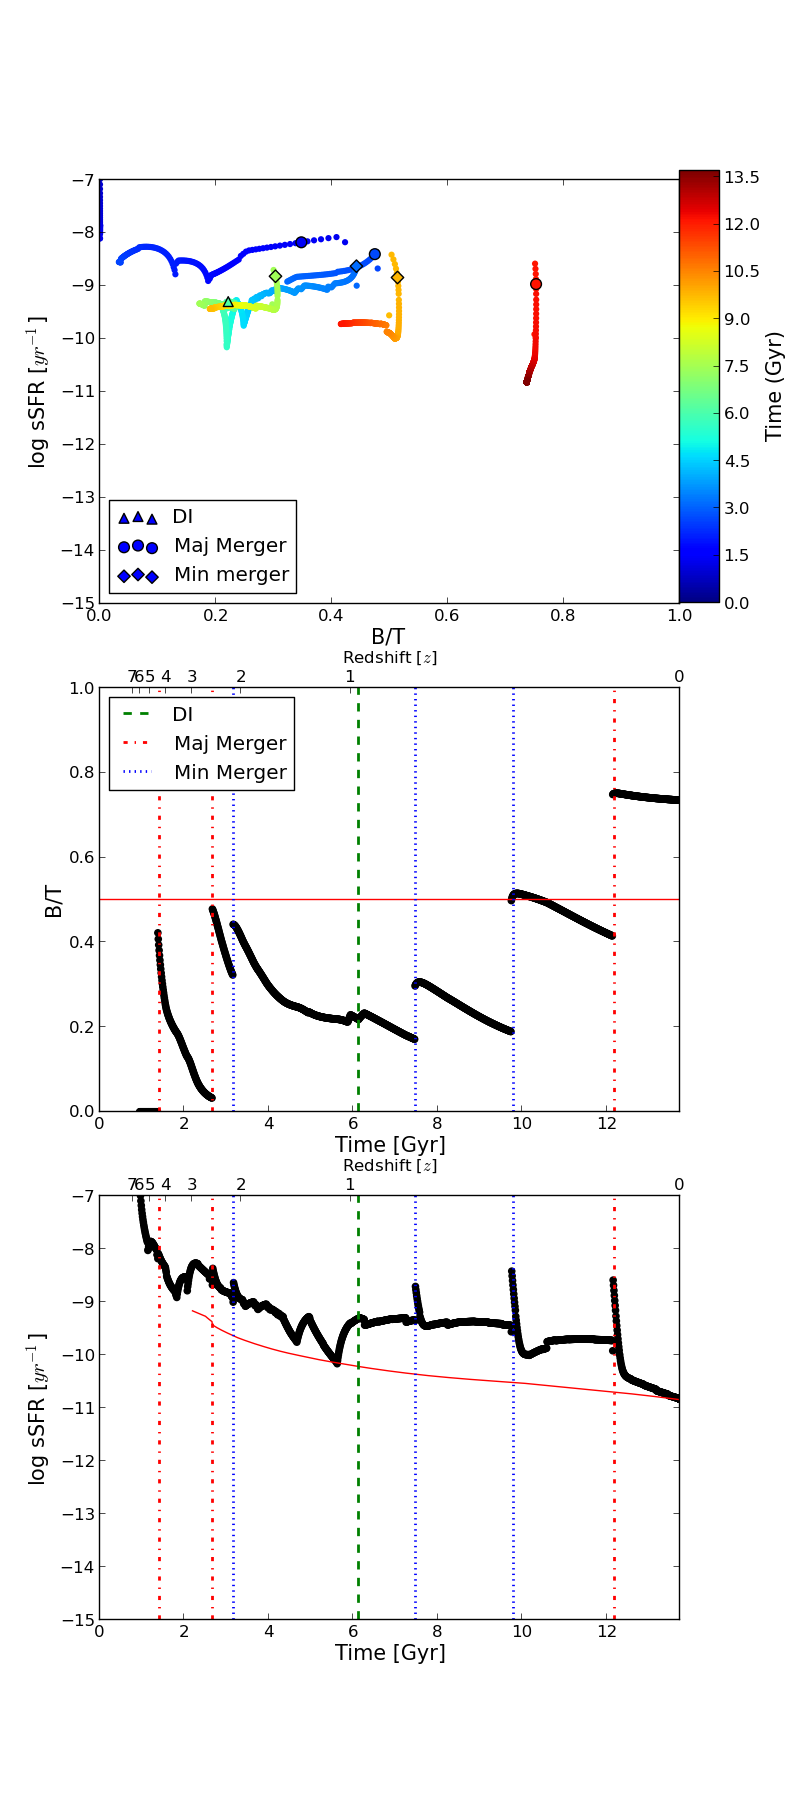
Figure 16 represents one possible path to becoming a quiescent disk-dominated galaxy. Some quiescent disks in our model are galaxies with quiet histories such as the one seen in Figure 13 above, but which have run out of gas (perhaps because they are more massive and have a harder time accreting new material) or can’t form stars with the gas they do have (see below for a brief discussion). However, many of our disk-dominated quiescent galaxies really aren’t very disk-dominated but in fact are systems which have had a somewhat more eventful history similar to that of a QS. These end up as QDs by one of two ways. In the first case, the events which lead to star formation quenching and bulge formation do not form enough of a bulge for the system to be considered spheroid-dominated. However, the galaxy still falls into the QD quadrant in the same way we expect SFSs to migrate sometimes to the QS quadrant after a traumatic event. In the second case, the galaxy does become an SFS, but retains gas to regrow a disk sufficient to be considered disk-dominated before falling into quiescence.
We see a mixture of these two fates in Figure 16; while its bulge growth episode was not enough to make it spheroid-dominated, the event which caused the bulge growth was enough to cut this galaxy off from new gas, causing it to become quiescent. We also see substantial disk growth in its decreasing . This combination of both scenarios causes this galaxy to be somewhat rare: a QD which is both very disk-dominated and very quiescent. This galaxy is very massive at with a stellar mass of . QDs are often quite massive due either to their merger histories or prolonged star formation which has led the galaxy to be unable to accrete new gas due to virial shock heating. In general, the average for QDs is only slightly higher than for SFDs. However, as QDs with lower star formation rates are considered, the average becomes larger, as these systems are the result of the QS-like paths described above. The very disk-dominated QDs are likely to have relatively higher sSFRs. This does bring up a larger point about dividing lines in general: some galaxies which fall below our dividing line are still forming stars, albeit at a slower rate than the majority of galaxies of their mass. They are “quenched” in the sense that their star formation rate is lower than expected, but they are not truly “quiescent” as is the case for some of our galaxies, which have had their star formation completely turned off. There is also the possibility, mentioned above, that some of our quiescent galaxies might begin to form stars again due to a wet merger or new gas accretion. In the case of a wet merger, this is likely to be short-lived, but in the case of new gas accretion, it can lead to a whole new life for a galaxy. Having clarified that, however, we believe this is happening in both the models and the observations, so it should not bias our results.
It appears that the QDs are much like the SFSs in that the population is a combination of tails of the SFD and QS populations. Curiously, the gas fractions of QDs in the SAMs are not systematically smaller than those of SFDs of the same mass. It appears that the quenching leading to very disk-dominated QDs has two possible origins, as mentioned above: a low gas accretion rate, or an extended low surface-density gas disk which is inefficient at making stars. In the models considered here, only gas that is above a critical surface density is allowed to participate in star formation; galaxies with larger than average angular momentum form more extended disks, which have a larger fraction of their gas sitting below this critical surface density. There is observational evidence in the local universe for these gas rich but relatively quiescent disks (Lemonias et al., 2014; Schiminovich et al., 2010). Thus while the SFSs may be understood as a transient population, a step in the path from SFD to QS, it seems that QDs may be a static population.
In addition, our model QDs on average have smaller stellar and black hole masses than our QSs. They are also more likely to be satellites than QSs. In our lowest redshift bin, about 75% of model QSs are central galaxies, while only 50% of QDs are. The very disk-dominated QDs () don’t exist in our model before . When compared with the rest of the QDs, they have even smaller black hole masses, as they likely have not undergone any events which would have triggered AGN feeding. They are also even more likely to be satellites; in our lowest redshift bin, only 25% of very disk-dominated QDs are central galaxies. We note that the likelihood of being a satellite galaxy is not the only reason that QDs tend to have smaller stellar and black hole masses; this trend is observed even when only central galaxies are considered.
What these analyses and evolutionary tracks show is that the transformative processes which affect galaxies take them all over the map (and the sSFR- plane). It is likely too simplistic to tell a simple story about two star forming disk galaxies colliding or one of them buckling under its own weight and triggering feedback which produces a nice, dead elliptical galaxy. These processes (mergers, disk instabilities, accretion of new gas) likely work together, sometimes in tandem and sometimes at cross purposes. It appears that a complex history with multiple transformative events is the norm rather than the exception and galaxy histories don’t necessarily look like the arrows in Figure 11.
4.3 How Might a Different Implementation of Disk Instability Change Our Results?
As mentioned above, our treatment of disk instabilities is based on rather dated simulations of isolated disk galaxies which are not in a cosmological context, and may not capture all of the relevant physics. Some of the questions associated with disk instabilities include: 1) What is the most relevant criterion for determining the onset of a disk instability? 2) What happens to the gas and stars in the disk when it becomes unstable? 3) How efficiently do disk instabilities feed a nuclear black hole?
As an aside, we have so far elided over a possibly important distinction. There are two kinds of physical mechanisms that are commonly referred to as “disk instabilities” in the literature, although in one case this is something of a misnomer, as we explain below. In “violent disk instabilities” (VDI; Dekel et al., 2009), the disk becomes globally unstable, leading to the formation of clumps of stars and gas, which may migrate to the center of the galaxy, building the spheroid. As the giant clumps orbit within the disk, even if they disrupt before reaching the center, they may drive inflows of gas into the galaxy nucleus, via the same sort of physics as merger-induced nuclear inflows, again leading to growth of the spheroid through in situ star formation, and feeding of the black hole (Bournaud et al., 2011). The second kind of “disk instability” involves the secular transfer of angular momentum outwards, and mass inwards, again leading to the building of a central compact and dynamically hot structure, and is accompanied by the formation of a bar (Kormendy & Kennicutt, 2004). The term “instability” is a misnomer here, as the disk essentially remains in dynamical equilibrium. The relatively crude morphological statistics used in this analysis are not able to distinguish between edge-on bars and bulges, so some of the ‘spheroids’ we count in the observations may actually be bars. In addition, the nuclear structures that are formed via this secular process do not have the same properties as “classical” bulges, and are sometimes called “pseudobulges”. See Kormendy & Kennicutt (2004) for a detailed discussion of the differences between classical bulges and pseudobulges; the most germane for our purposes here is that pseudobulges do not obey the same scaling relationships with the SMBH mass as classical bulges (Kormendy & Ho, 2013), suggesting that black hole feeding and/or feedback may operate differently.
One major limitation of our approach is that we based the disk instability criterion on the properties of the stellar disk only, and only stars are moved from the disk to the spheroid when the disk is deemed unstable. This is not what is seen in modern cosmological hydrodynamic simulations, in which VDI are ubiquitous at high redshift (Ceverino et al., 2010; Mandelker et al., 2014), and as mentioned above are associated with strong nuclear inflows of gas as well as stars. In addition, VDI can lead to significant quenching even in the absence of associated AGN feedback (Gammie, 2001; Dekel & Burkert, 2014; Forbes et al., 2014), which is not accounted for in our current models. Perhaps this could lead to a higher fraction of quiescent galaxies at high redshift, in accord with observations. Additional complications are the possible stablizing effects of a pre-existing bulge or central mass concentration, and possible triggering of disk instabilities by minor mergers.
P14 attempted to model a scenario closer to the modern VDI picture with their “Stars+Gas DI” model. They found that the results were very similar to the “Stars DI” model which is why we consider only that model here (this implementation of DI is similar to the one that is most commonly applied in other SAMs in the literature). In addition, the P14 “Stars+Gas DI” model is still very arbitrary and simplified. In future work, we plan to carry out a thorough analysis of state-of-the-art hydrodynamic simulations to develop a more detailed and physical treatment of disk instabilities in SAMs.
4.4 Other Possible Model Improvements
Aside from our treatment of disk instabilities, there are several ways in which we could improve our model in order to better capture what we believe is occuring in real galaxies. Our implementation of satellite stripping does not account for any change in morphology of satellites and many which are not destroyed are stripped of their gas and remain disk dominated. Only central galaxies are supplied with new gas in our accretion and cooling model, so this may artificially increase our fraction of quiescent disk-dominated galaxies. While this effect dominates at low stellar masses and should not be as important in the mass range we consider in this work, , it is worth noting (and is the reason we neglected satellites when determining the typical model main sequence star formation rate above). We do point out that the same analysis done for the model excluding satellite galaxies leads to very similar results; the largest difference is in the low redshift QD fraction, which in the lowest bin decreases from % to %.
While our merger prescription is based on numerical hydrodynamic simulations of binary mergers (Hopkins et al., 2009b), we treat all mergers as discrete events, while in the real universe there may be a complex interplay between merger events if the galaxy has not had time to relax between them (Moster et al., 2014). This could have an effect on both the star formation rates and the morphologies of our post-merger remnants, especially of those that have had somewhat active merger histories.
In addition, in our current models galaxies are primarily kept quiescent by the “maintenance mode” type radio mode feedback, which becomes important only at relatively late times. Winds driven by radiatively efficient accretion (“bright mode” feedback) are assumed to be able to remove cold gas from the ISM but have no effect on the hot gas surrounding galaxies. However, recent cosmological simulations have shown that momentum-driven winds associated with bright mode accretion actually modify the hot gas profile and significantly retard cooling over long timescales (Choi et al., 2014, 2015). Including this physics might also help us to produce more quenched galaxies at high redshift, and could also suppress the re-formation of disks via cooling.
Finally, there is the issue of putting the models and observations on the same footing when it comes to quantitative comparison of morphologies; we would like to improve the way we assign morphology to our model galaxies, namely by using the masses (or luminosities) and sizes of our disk and bulge components to generate mock images which can then be processed like real observations (including noise, point-spread function, etc) and assigned morphological classifications. This way each galaxy would have its profile measured separately and other effects such as inclination angle could be taken into account. Comparing the observed and predicted fractions of morphologically disturbed galaxies would also be interesting, but obviously requires us to be able to quantify this in the SAM in a way that can be compared with observations. This may be possible using our merger statistics in combination with a library of numerical simulations, as in Lotz et al. (2011); see also recent work by Snyder et al. (2014).
5 Summary and Conclusions
We have studied the coevolution of star formation rate and morphology from to the present by examining the buildup of galaxies in the four quadrants of the sSFR versus Sérsic index () plane. We have compared galaxies with stellar mass > from the “Santa Cruz” semi-analytic model outlined in S08, S12 and P14 with galaxies observed as part of the GAMA and CANDELS surveys. Our conclusions are as follows:
-
•
Our models qualitatively reproduce the increasing fraction of quiescent galaxies since seen in observations, and produce excellent quantitative agreement with observations at . At higher redshift, the models underproduce the fraction of quiescent galaxies relative to observations.
-
•
Our model in which spheroids are built solely through mergers (noDI) predicts an evolution in the fraction of spheroid dominated galaxies that is much too mild compared with observations. This model also underproduces spheroid-dominated galaxies at compared with observations. Adding a channel for bulge growth via disk instabilities (DI model) leads to much better agreement with the observed evolution of the spheroid-dominated fraction, although still produces slightly flatter evolution than observed.
-
•
The quiescent fraction is largely unaffected by the inclusion of disk instabilities, with changes <10%. We note, however, that our current disk instability model may be underestimating the change in quiescent fraction, especially at high redshift.
-
•
Our models further qualitatively reproduce the observed evolutionary behavior of four classes of galaxies defined by both star formation activity and morphology: star forming disk-dominated, quiescent spheroid-dominated, star forming spheroid-dominated and quiescent disk-dominated. In both the observations and in our models, the fraction of star forming disks decreases over time while the fraction of quiescent spheroids increases. In the observations, the fractions of both star forming spheroids and quiescent disks remain nearly constant from –0. Models predict a stronger decrease in star forming spheroids and a stronger increase in quiescent disks with redshift than is seen in the observations, but the predicted fractions are not off from the observed fractions by more than and in most cases are off by less.
-
•
In our models, star forming-disk dominated galaxies are galaxies which have had very quiet histories. They have avoided major mergers and if they have experienced any merger or disk instability activity, they have recovered by accreting new gas and regrowing a disk.
-
•
Again in our models, quiescent spheroid-dominated galaxies are likely to have either undergone at least one extreme major merger or many smaller mergers or disk instabilities. In either case they have built up a substantial bulge component and AGN feedback has made it impossible for them to accrete significant amounts of new gas, eventually leading to cessation of star formation.
-
•
Star forming spheroid-dominated galaxies seem to be a short-lived population. Truly spheroid-dominated star forming galaxies are indicators of a recent trauma, as they are still experiencing a post-trauma starburst. At this point, they can regrow a disk with their remaining gas reservoir or through the accretion of new gas. In the absence of new gas, they can deplete their gas reservoirs and become quiescent.
-
•
Quiescent disk-dominated galaxies are a combination of two populations: disk-dominated galaxies which have stopped accreting gas (in some cases due to environmental effects) and galaxies with extended low-surface density gas disks, which are inefficient at forming stars.
Despite the room for possible improvements to our model described above, the qualitative similarity between the buildup of our model populations with those of observed galaxies gives us confidence that we are beginning to capture the complicated interplay of several processes which lead to the diversity of galaxies and their evolution over time.
Acknowledgments
We thank the anonymous referee for a very positive and helpful report. RB was supported in part by HST Theory grant HST-AR-13270-A. rss thanks the Downsbrough family for their generous support. We acknowledge the contributions of hundreds of individuals to the planning and support of the CANDELS observations, and to the development and installation of new instruments on HST, without which this work would not have been possible. Support for HST Programs GO-12060 and GO-12099 was provided by NASA through grants from the Space Telescope Science Institute, which is operated by the Association of Universities for Research in Astronomy, Inc., under NASA contract NAS5-26555.
References
- Abazajian et al. (2009) Abazajian K. N., et al., 2009, ApJS, 182, 543
- Baldry et al. (2004) Baldry I., Balogh M., Bower R., Glazebrook K., Nichol R., 2004, AIP Conference Proceedings, 743, 106
- Baldry et al. (2010) Baldry I. K., et al., 2010, MNRAS, 404, 86
- Baldry et al. (2012) Baldry I. K., et al., 2012, MNRAS, 421, 621
- Balogh et al. (2004) Balogh M., et al., 2004, MNRAS, 348, 1355
- Barro et al. (2011) Barro G., et al., 2011, ApJS, 193, 30
- Barro et al. (2013) Barro G., et al., 2013, ApJ, 765, 104
- Barro et al. (2014) Barro G., et al., 2014, ApJ, 791, 52
- Behroozi et al. (2013a) Behroozi P. S., Wechsler R. H., Wu H.-Y., Busha M. T., Klypin A. A., Primack J. R., 2013a, ApJ, 763, 18
- Behroozi et al. (2013b) Behroozi P. S., Wechsler R. H., Conroy C., 2013b, ApJ, 770, 57
- Bell (2008) Bell E. F., 2008, ApJ, 682, 355
- Bell et al. (2004a) Bell E. F., et al., 2004a, ApJL, 600, L11
- Bell et al. (2004b) Bell E. F., et al., 2004b, ApJ, 608, 752
- Bell et al. (2005) Bell E. F., et al., 2005, ApJ, 625, 23
- Bell et al. (2007) Bell E. F., Zheng X. Z., Papovich C., Borch A., Wolf C., Meisenheimer K., 2007, ApJ, 663, 834
- Benson & Devereux (2010) Benson A. J., Devereux N., 2010, MNRAS, 402, 2321
- Bernardi et al. (2003) Bernardi M., et al., 2003, AJ, 125, 1882
- Bertin & Arnouts (1996) Bertin E., Arnouts S., 1996, A&AS, 117, 393
- Birnboim & Dekel (2003) Birnboim Y., Dekel A., 2003, MNRAS, 345, 349
- Blanton & Moustakas (2009) Blanton M. R., Moustakas J., 2009, ARA&A, 47, 159
- Bluck et al. (2014) Bluck A. F. L., Mendel J. T., Ellison S. L., Moreno J., Simard L., Patton D. R., Starkenburg E., 2014, MNRAS, 441, 599
- Blumenthal et al. (1986) Blumenthal G. R., Faber S. M., Flores R., Primack J. R., 1986, ApJ, 301, 27
- Bondi (1952) Bondi H., 1952, MNRAS, 112, 195
- Borch et al. (2006) Borch A., et al., 2006, A&A, 453, 869
- Bournaud et al. (2011) Bournaud F., Dekel A., Teyssier R., Cacciato M., Daddi E., Juneau S., Shankar F., 2011, ApJ, 741, L33
- Boylan-Kolchin et al. (2008) Boylan-Kolchin M., Ma C.-P., Quataert E., 2008, MNRAS, 383, 93
- Brammer et al. (2009) Brammer G. B., et al., 2009, ApJ, 706, L173
- Brammer et al. (2011) Brammer G. B., et al., 2011, ApJ, 739, 24
- Brinchmann et al. (2004) Brinchmann J., Charlot S., White S. D. M., Tremonti C., Kauffmann G., Heckman T., Brinkmann J., 2004, MNRAS, 351, 1151
- Bruce et al. (2014) Bruce V. A., et al., 2014, MNRAS, 444, 1001
- Bruzual & Charlot (2003) Bruzual G., Charlot S., 2003, MNRAS, 344, 1000
- Buitrago et al. (2013) Buitrago F., Trujillo I., Conselice C. J., Häußler B., 2013, MNRAS, 428, 1460
- Bundy et al. (2006) Bundy K., et al., 2006, ApJ, 651, 120
- Calzetti (2001) Calzetti D., 2001, PASP, 113, 1449
- Ceverino et al. (2010) Ceverino D., Dekel A., Bournaud F., 2010, MNRAS, 404, 2151
- Chabrier (2003) Chabrier G., 2003, PASP, 115, 763
- Chary & Elbaz (2001) Chary R., Elbaz D., 2001, ApJ, 556, 562
- Cheung et al. (2012) Cheung E., et al., 2012, ApJ, 760, 131
- Choi et al. (2014) Choi E., Naab T., Ostriker J. P., Johansson P. H., Moster B. P., 2014, MNRAS, 442, 440
- Choi et al. (2015) Choi E., Ostriker J. P., Naab T., Oser L., Moster B. P., 2015, MNRAS, 449, 4105
- Cole et al. (1994) Cole S., Aragon-Salamanca A., Frenk C. S., Navarro J. F., Zepf S. E., 1994, MNRAS, 271, 781
- Colless et al. (2001) Colless M., et al., 2001, MNRAS, 328, 1039
- Conselice et al. (2007) Conselice C. J., et al., 2007, MNRAS, 381, 962
- Conselice et al. (2011) Conselice C. J., et al., 2011, MNRAS, 413, 80
- Cox et al. (2006) Cox T. J., Dutta S. N., Di Matteo T., Hernquist L., Hopkins P. F., Robertson B., Springel V., 2006, ApJ, 650, 791
- Daddi et al. (2007) Daddi E., et al., 2007, ApJ, 670, 156
- Dahlen et al. (2013) Dahlen T., et al., 2013, ApJ, 775, 93
- De Lucia et al. (2006) De Lucia G., Springel V., White S. D. M., Croton D., Kauffmann G., 2006, MNRAS, 366, 499
- De Lucia et al. (2011) De Lucia G., Fontanot F., Wilman D., Monaco P., 2011, MNRAS, 414, 1439
- Dekel & Birnboim (2006) Dekel A., Birnboim Y., 2006, MNRAS, 368, 2
- Dekel & Burkert (2014) Dekel A., Burkert A., 2014, MNRAS, 438, 1870
- Dekel et al. (2009) Dekel A., Sari R., Ceverino D., 2009, ApJ, 703, 785
- Dressler (1980) Dressler A., 1980, ApJ, 236, 351
- Driver et al. (2009) Driver S. P., et al., 2009, Astronomy and Geophysics, 50, 12
- Driver et al. (2011) Driver S. P., et al., 2011, MNRAS, 413, 971
- Efstathiou et al. (1982) Efstathiou G., Lake G., Negroponte J., 1982, MNRAS, 199, 1069
- Elbaz et al. (2007) Elbaz D., et al., 2007, AAP, 468, 33
- Elbaz et al. (2011) Elbaz D., et al., 2011, A&A, 533, A119
- Ellison et al. (2011) Ellison S. L., Patton D. R., Mendel J. T., Scudder J. M., 2011, MNRAS, 418, 2043
- Emonts et al. (2014) Emonts B. H. C., Piqueras-López J., Colina L., Arribas S., Villar-Martín M., Pereira-Santaella M., Garcia-Burillo S., Alonso-Herrero A., 2014, A&A, 572, A40
- Faber et al. (2007) Faber S. M., et al., 2007, ApJ, 665, 265
- Fall & Efstathiou (1980) Fall S. M., Efstathiou G., 1980, MNRAS, 193, 189
- Flores et al. (1993) Flores R., Primack J. R., Blumenthal G. R., Faber S. M., 1993, ApJ, 412, 443
- Fontanot et al. (2012) Fontanot F., Cristiani S., Santini P., Fontana A., Grazian A., Somerville R. S., 2012, MNRAS, 421, 241
- Forbes et al. (2014) Forbes J. C., Krumholz M. R., Burkert A., Dekel A., 2014, MNRAS, 438, 1552
- Galametz et al. (2013) Galametz A., et al., 2013, ApJS, 206, 10
- Gallazzi et al. (2006) Gallazzi A., Charlot S., Brinchmann J., White S. D. M., 2006, MNRAS, 370, 1106
- Gammie (2001) Gammie C. F., 2001, ApJ, 553, 174
- Geha et al. (2012) Geha M., Blanton M. R., Yan R., Tinker J. L., 2012, ApJ, 757, 85
- Giavalisco et al. (2004) Giavalisco M., et al., 2004, ApJ, 600, 93
- Gnedin (2000) Gnedin N. Y., 2000, ApJ, 542, 535
- Grogin et al. (2011) Grogin N. A., et al., 2011, ApJS, 197, 35
- Gunawardhana et al. (2013) Gunawardhana M. L. P., et al., 2013, MNRAS, 433, 2764
- Guo et al. (2011) Guo Q., et al., 2011, MNRAS, 413, 101
- Guo et al. (2013) Guo Y., et al., 2013, ApJS, 207, 24
- Guo et al. (2015) Guo Y., et al., 2015, ApJ, 800, 39
- Hill et al. (2011) Hill D. T., et al., 2011, MNRAS, 412, 765
- Hirschmann et al. (2012) Hirschmann M., Somerville R. S., Naab T., Burkert A., 2012, MNRAS, 426, 237
- Hopkins et al. (2006) Hopkins P. F., Hernquist L., Cox T. J., Di Matteo T., Robertson B., Springel V., 2006, ApJS, 163, 1
- Hopkins et al. (2007) Hopkins P. F., Hernquist L., Cox T. J., Robertson B., Krause E., 2007, ApJ, 669, 45
- Hopkins et al. (2009a) Hopkins P. F., et al., 2009a, MNRAS, 397, 802
- Hopkins et al. (2009b) Hopkins P. F., Cox T. J., Younger J. D., Hernquist L., 2009b, ApJ, 691, 1168
- Hopkins et al. (2013) Hopkins A. M., et al., 2013, MNRAS, 430, 2047
- Kauffmann et al. (1993) Kauffmann G., White S. D. M., Guiderdoni B., 1993, MNRAS, 264, 201
- Kauffmann et al. (2003) Kauffmann G., et al., 2003, MNRAS, 341, 54
- Kelvin et al. (2012) Kelvin L. S., et al., 2012, MNRAS, 421, 1007
- Kennicutt (1998) Kennicutt R. C., 1998, ApJ, 498, 541
- Kereš et al. (2005) Kereš D., Katz N., Weinberg D. H., Davé R., 2005, MNRAS, 363, 2
- Klypin et al. (2011) Klypin A. A., Trujillo-Gomez S., Primack J., 2011, ApJ, 740, 102
- Koekemoer et al. (2011) Koekemoer A. M., et al., 2011, ApJ, 197, 36
- Komatsu et al. (2009) Komatsu E., et al., 2009, ApJS, 180, 330
- Komatsu et al. (2011) Komatsu E., et al., 2011, ApJS, 192, 18
- Kormendy & Ho (2013) Kormendy J., Ho L. C., 2013, ARAA, 51, 511
- Kormendy & Kennicutt (2004) Kormendy J., Kennicutt Jr. R. C., 2004, ARAA, 42, 603
- Kravtsov et al. (2004) Kravtsov A. V., Gnedin O. Y., Klypin A. A., 2004, ApJ, 609, 482
- Kriek et al. (2009) Kriek M., van Dokkum P. G., Labbé I., Franx M., Illingworth G. D., Marchesini D., Quadri R. F., 2009, ApJ, 700, 221
- Laidler et al. (2007) Laidler V. G., et al., 2007, PASP, 119, 1325
- Lang et al. (2014) Lang P., et al., 2014, ApJ, 788, 11
- Lange et al. (2015) Lange R., et al., 2015, MNRAS, 447, 2603
- Lawrence et al. (2007) Lawrence A., et al., 2007, MNRAS, 379, 1599
- Lee et al. (2012) Lee K.-S., et al., 2012, AJ, 752, 66
- Lemonias et al. (2014) Lemonias J. J., Schiminovich D., Catinella B., Heckman T. M., Moran S. M., 2014, ApJ, 790, 27
- Lintott et al. (2008) Lintott C. J., et al., 2008, MNRAS, 389, 1179
- Lintott et al. (2011) Lintott C., et al., 2011, MNRAS, 410, 166
- Liske et al. (2014) Liske J., Baldry I. K., Driver S. P., Tuffs R. J., 2014, MNRAS, in prep.
- Lotz et al. (2011) Lotz J. M., Jonsson P., Cox T. J., Croton D., Primack J. R., Somerville R. S., Stewart K., 2011, ApJ, 742, 103
- Mandelker et al. (2014) Mandelker N., Dekel A., Ceverino D., Tweed D., Moody C. E., Primack J., 2014, MNRAS, 443, 3675
- Martig et al. (2009) Martig M., Bournaud F., Teyssier R., Dekel A., 2009, ApJ, 707, 250
- Martin et al. (2005) Martin D. C., et al., 2005, ApJ, 619, L1
- McGrath et al. (2008) McGrath E. J., Stockton A., Canalizo G., Iye M., Maihara T., 2008, ApJ, 682, 303
- McIntosh et al. (2014) McIntosh D. H., et al., 2014, MNRAS, 442, 533
- Mo et al. (1998) Mo H. J., Mao S., White S. D. M., 1998, MNRAS, 295, 319
- Mortlock et al. (2015) Mortlock A., et al., 2015, MNRAS, 447, 2
- Moster et al. (2014) Moster B. P., Macciò A. V., Somerville R. S., 2014, MNRAS, 437, 1027
- Muzzin et al. (2013a) Muzzin A., et al., 2013a, ApJS, 206, 8
- Muzzin et al. (2013b) Muzzin A., et al., 2013b, ApJ, 777, 18
- Noeske et al. (2007) Noeske K. G., et al., 2007, ApJ, 660, L43
- Oemler (1974) Oemler Jr. A., 1974, ApJ, 194, 1
- Ostriker & Peebles (1973) Ostriker J. P., Peebles P. J. E., 1973, ApJ, 186, 467
- Parry et al. (2009) Parry O. H., Eke V. R., Frenk C. S., 2009, MNRAS, 396, 1972
- Peletier & Balcells (1996) Peletier R. F., Balcells M., 1996, AJ, 111, 2238
- Peng et al. (2002) Peng C. Y., Ho L. C., Impey C. D., Rix H.-W., 2002, AJ, 124, 266
- Peng et al. (2010) Peng Y.-J., et al., 2010, ApJ, 721, 193
- Pérez-González et al. (2008) Pérez-González P. G., et al., 2008, ApJ, 675, 234
- Porter et al. (2014a) Porter L., Somerville R., Primack J., Johansson P., 2014a, MNRAS, 444, 942
- Porter et al. (2014b) Porter L. A., Somerville R. S., Primack J. R., Croton D. J., Covington M. D., Graves G. J., Faber S. M., 2014b, MNRAS, 445, 3092
- Robertson et al. (2006) Robertson B., Cox T. J., Hernquist L., Franx M., Hopkins P. F., Martini P., Springel V., 2006, ApJ, 641, 21
- Rodighiero et al. (2011) Rodighiero G., et al., 2011, ApJ, 739, L40
- Rupke & Veilleux (2013) Rupke D. S. N., Veilleux S., 2013, ApJ, 768, 75
- Santini et al. (2015) Santini P., et al., 2015, ApJ, 801, 97
- Schawinski et al. (2014) Schawinski K., et al., 2014, MNRAS, 440, 889
- Schiminovich et al. (2007) Schiminovich D., et al., 2007, ApJS, 173, 315
- Schiminovich et al. (2010) Schiminovich D., et al., 2010, MNRAS, 408, 919
- Schmidt (1968) Schmidt M., 1968, ApJ, 151, 393
- Sérsic (1963) Sérsic J. L., 1963, Boletin de la Asociacion Argentina de Astronomia La Plata Argentina, 6, 41
- Shen et al. (2003) Shen S., Mo H. J., White S. D. M., Blanton M. R., Kauffmann G., Voges W., Brinkmann J., Csabai I., 2003, MNRAS, 343, 978
- Silverman et al. (2011) Silverman J. D., et al., 2011, ApJ, 743, 2
- Simard et al. (2002) Simard L., et al., 2002, ApJS, 142, 1
- Simard et al. (2011) Simard L., Mendel J. T., Patton D. R., Ellison S. L., McConnachie A. W., 2011, ApJS, 196, 11
- Smethurst et al. (2015) Smethurst R. J., et al., 2015, MNRAS, 450, 435
- Snyder et al. (2014) Snyder G. F., Lotz J., Moody C., Peth M., Freeman P., Ceverino D., Primack J., Dekel A., 2014, ArXiv e-prints
- Somerville & Davé (2014) Somerville R. S., Davé R., 2014, ArXiv e-prints
- Somerville & Kolatt (1999) Somerville R. S., Kolatt T. S., 1999, MNRAS, 305, 1
- Somerville & Primack (1999) Somerville R. S., Primack J. R., 1999, MNRAS, 310, 1087
- Somerville et al. (2001) Somerville R. S., Primack J. R., Faber S. M., 2001, MNRAS, 320, 504
- Somerville et al. (2008a) Somerville R. S., Hopkins P. F., Cox T. J., Robertson B. E., Hernquist L., 2008a, MNRAS, 391, 481
- Somerville et al. (2008b) Somerville R. S., et al., 2008b, ApJ, 672, 776
- Somerville et al. (2012) Somerville R. S., Gilmore R. C., Primack J. R., Domínguez A., 2012, MNRAS, 423, 1992
- Strateva et al. (2001) Strateva I., et al., 2001, AJ, 122, 1861
- Sutherland & Dopita (1993) Sutherland R. S., Dopita M. A., 1993, ApJS, 88, 253
- Taylor et al. (2011) Taylor E. N., et al., 2011, MNRAS, 418, 1587
- Taylor et al. (2015) Taylor E. N., et al., 2015, MNRAS, 446, 2144
- Tinker & Wetzel (2010) Tinker J. L., Wetzel A. R., 2010, ApJ, 719, 88
- Trujillo-Gomez et al. (2011) Trujillo-Gomez S., Klypin A., Primack J., Romanowsky A. J., 2011, ApJ, 742, 16
- Whitaker et al. (2010) Whitaker K. E., et al., 2010, ApJ, 719, 1715
- Whitaker et al. (2012a) Whitaker K. E., Kriek M., van Dokkum P. G., Bezanson R., Brammer G., Franx M., Labbé I., 2012a, ApJ, 745, 179
- Whitaker et al. (2012b) Whitaker K. E., van Dokkum P. G., Brammer G., Franx M., 2012b, ApJ, 754, L29
- White & Rees (1978) White S. D. M., Rees M. J., 1978, MNRAS, 183, 341
- Williams et al. (2014) Williams C. C., et al., 2014, ApJ, 780, 1
- Williams et al. (2015) Williams C. C., et al., 2015, ApJ, 800, 21
- Wong et al. (2012) Wong O. I., et al., 2012, MNRAS, 420, 1684
- Woo et al. (2015) Woo J., Dekel A., Faber S. M., Koo D. C., 2015, MNRAS, 448, 237
- Wuyts et al. (2011a) Wuyts S., et al., 2011a, ApJ, 738, 106
- Wuyts et al. (2011b) Wuyts S., et al., 2011b, ApJ, 742, 96
- York et al. (2000) York D. G., et al., 2000, AJ, 120, 1579
- van Dokkum et al. (2009) van Dokkum P. G., et al., 2009, PASP, 121, 2
- van der Wel et al. (2011) van der Wel A., et al., 2011, ApJ, 730, 38
- van der Wel et al. (2012) van der Wel A., et al., 2012, ApJS, 203, 24
Appendix A: Conversion from B/T to Sérsic Index
As part of this work, we compare the morphologies of model galaxies to observed galaxies. To do this, we convert bulge-to-total stellar mass ratios (), which our model naturally outputs, to Sérsic indices from single component fits, which are directly comparable to observations. To do this, we use a lookup table generated from synthetic galaxies which are made up of an exponential () disk and a bulge with =4. A Sérsic index and effective radius are derived by fitting to the two-component profile for a wide range of and / (which we hereafter refer to as “rbd”). The lookup table takes in and rbd and outputs a Sérsic index and effective radius for the composite system. Since the values are discrete, we have interpolated between the table values to generate our Sérsic indices. Appendix A of Lang et al. (2014) illustrates that the relationship between and derived from these synthetic galaxies matches well with the relationship derived from CANDELS galaxies with 2-component bulge+disk fits. Here we present the mapping between and Sérsic index in order to illustrate the relationship between the two. Then, in the next section, we will show that the results of the analysis presented in the main text are largely unchanged when done in terms of rather than Sérsic index. We also refer the reader to Figure A6 in Lang et al. (2014), where this analysis is done for the observed galaxies with bulge-disk decompositions. They carry out their analysis in terms of both bulge-to-total stellar mass ratio and H-band light ratio. We have used the lookup table generated in terms of the mass ratio, but we would expect results in terms of light ratio to be qualitatively similar (see Appendix B of Lang et al. 2014).
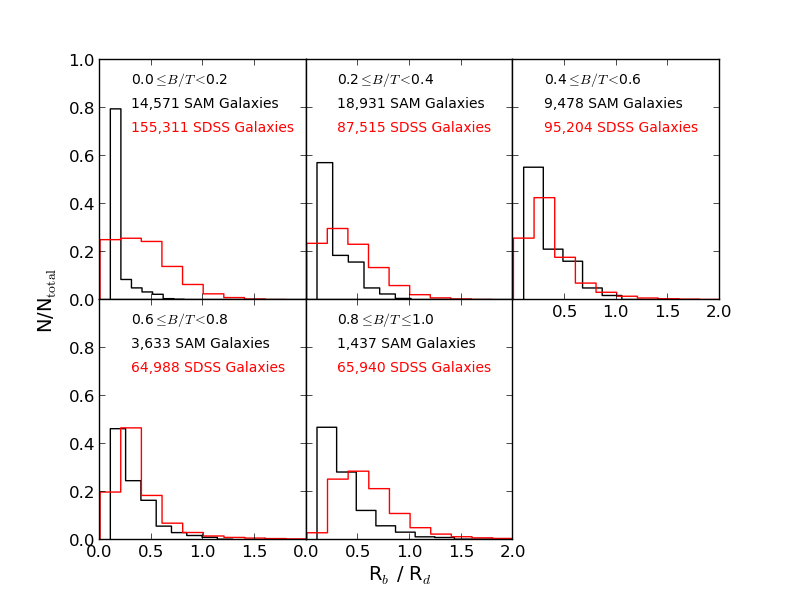
To test the SAM predictions for the bulge and disk sizes, we use the -band bulge+disk decompositions of SDSS galaxies performed by Simard et al. (2011). We trimmed the original catalog of 1,123,718 galaxies down to 618,186 galaxies by applying the following selection cuts: , , , , , , , , , and , where the subscript “pure" refers to single-component (pure) Sérsic fits (which were also computed for the galaxies). The bulge+disk decompositions were fit simultaneously in the - and -band in order to minimize errors, and the assumed model was a de Vaucouleurs bulge () with a pure exponential disk. The fits were done using the Galaxy Image 2D (GIM2D) program; see Simard et al. (2002) and Simard et al. (2011) for further details about the fitting procedure and outputs. In general, the model predictions and observational results are similar, except in the lowest bin, where our model predicts more compact bulges relative to the disk sizes than is seen in the observations. This excess is seen to a lesser degree in the other bins as well. However, as the discrepancy is the largest for disk-dominated galaxies (where the radial size of the bulge component will have little impact on our results), we conclude that our model should produce reasonable predictions for the composite Sérsic indices in most cases. In the future, it will be interesting to compare the SAM results with the sizes and ratios obtained from multi-component bulge-disk decompositions, which are starting to become available.
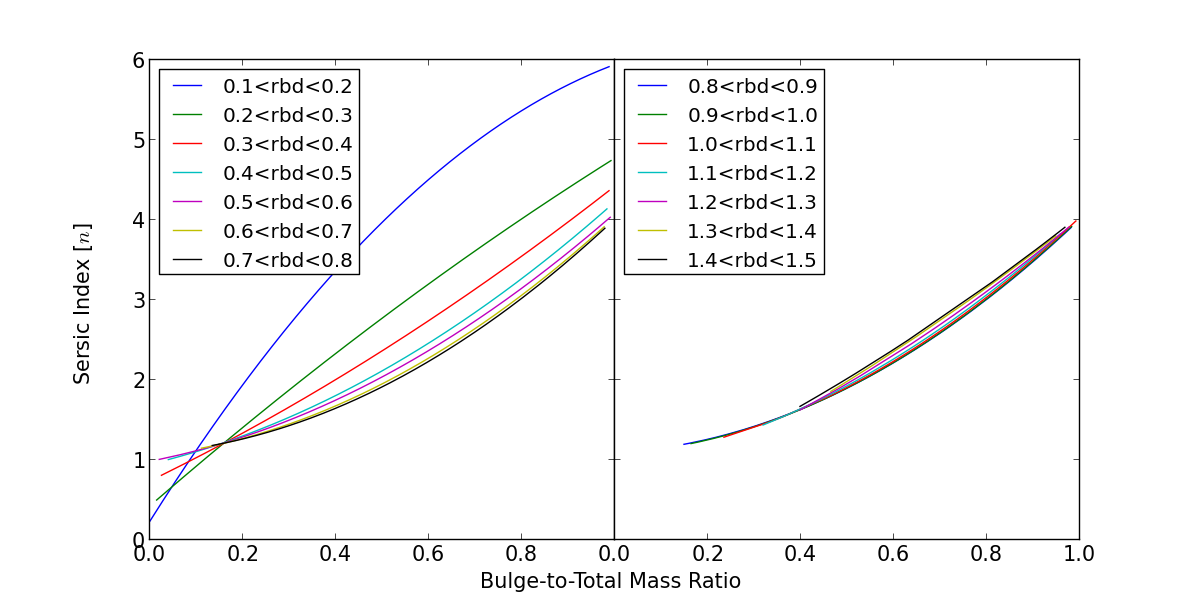
Figure 18 shows the best fit curves to the relationship between and in bins of rbd. If rbd, for a given a larger rbd will lead to a lower Sérsic index (unless the galaxy also has very low , in which case is mostly concentrated between anyway). Above an rbd of , there is a nearly one-to-one mapping between and Sérsic index. However, as we saw in Figure 17, in the SAMs and in nearby galaxies, most galaxies have rbd. We see here that a split in instead of will lead to the selection of slightly different sets of galaxies because the bulge radius to disk radius ratio causes a spread in Sérsic index for a given bulge-to-total mass ratio and vice versa.
Appendix B: Results Using B/T
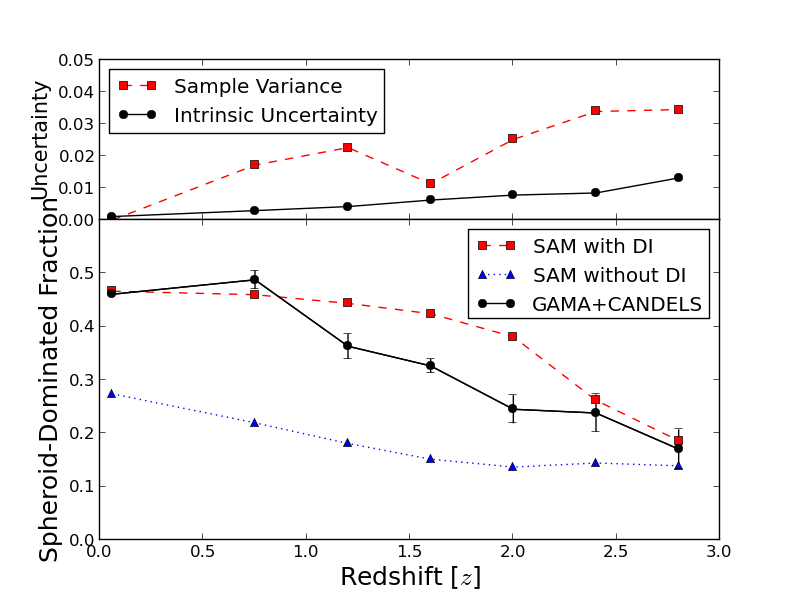
In this section we present the main (morphology-dependent) results of the above analysis again, this time using as our morphological parameter. These results may be able to be compared with future observational analyses, if bulge-disk decompositions are carried out, and may be more easily compared with predictions from other theoretical models. Our dividing line between star forming and quiescent remains the same, but our condition for spheroid domination is now . Figure 19 shows the evolution of the spheroid-dominated fraction of galaxies as in Figure 4. The observed spheroid-dominated fraction is still derived using a Sérsic index to make the cut. We can see that the evolution of model galaxies is similar to the evolution in Figure 4. However, splitting by we predict more spheroid-dominated galaxies for and fewer for . The predicted fraction does not vary by more than 0.1 at any redshift. This variation suggests that there are more galaxies at high redshift with smaller values of rbd than at low redshift.
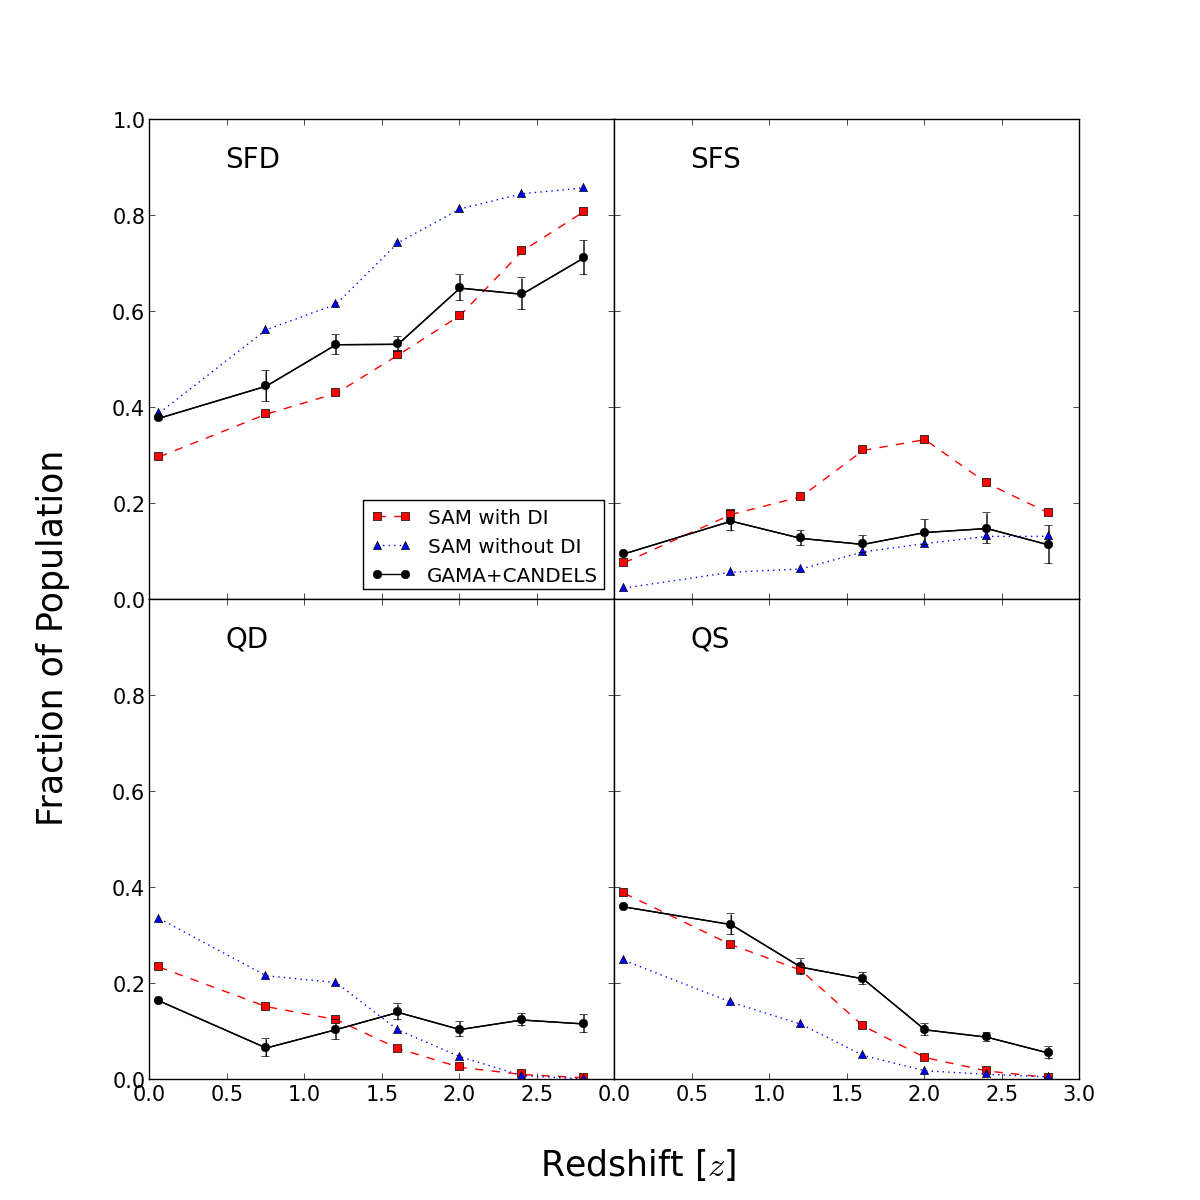
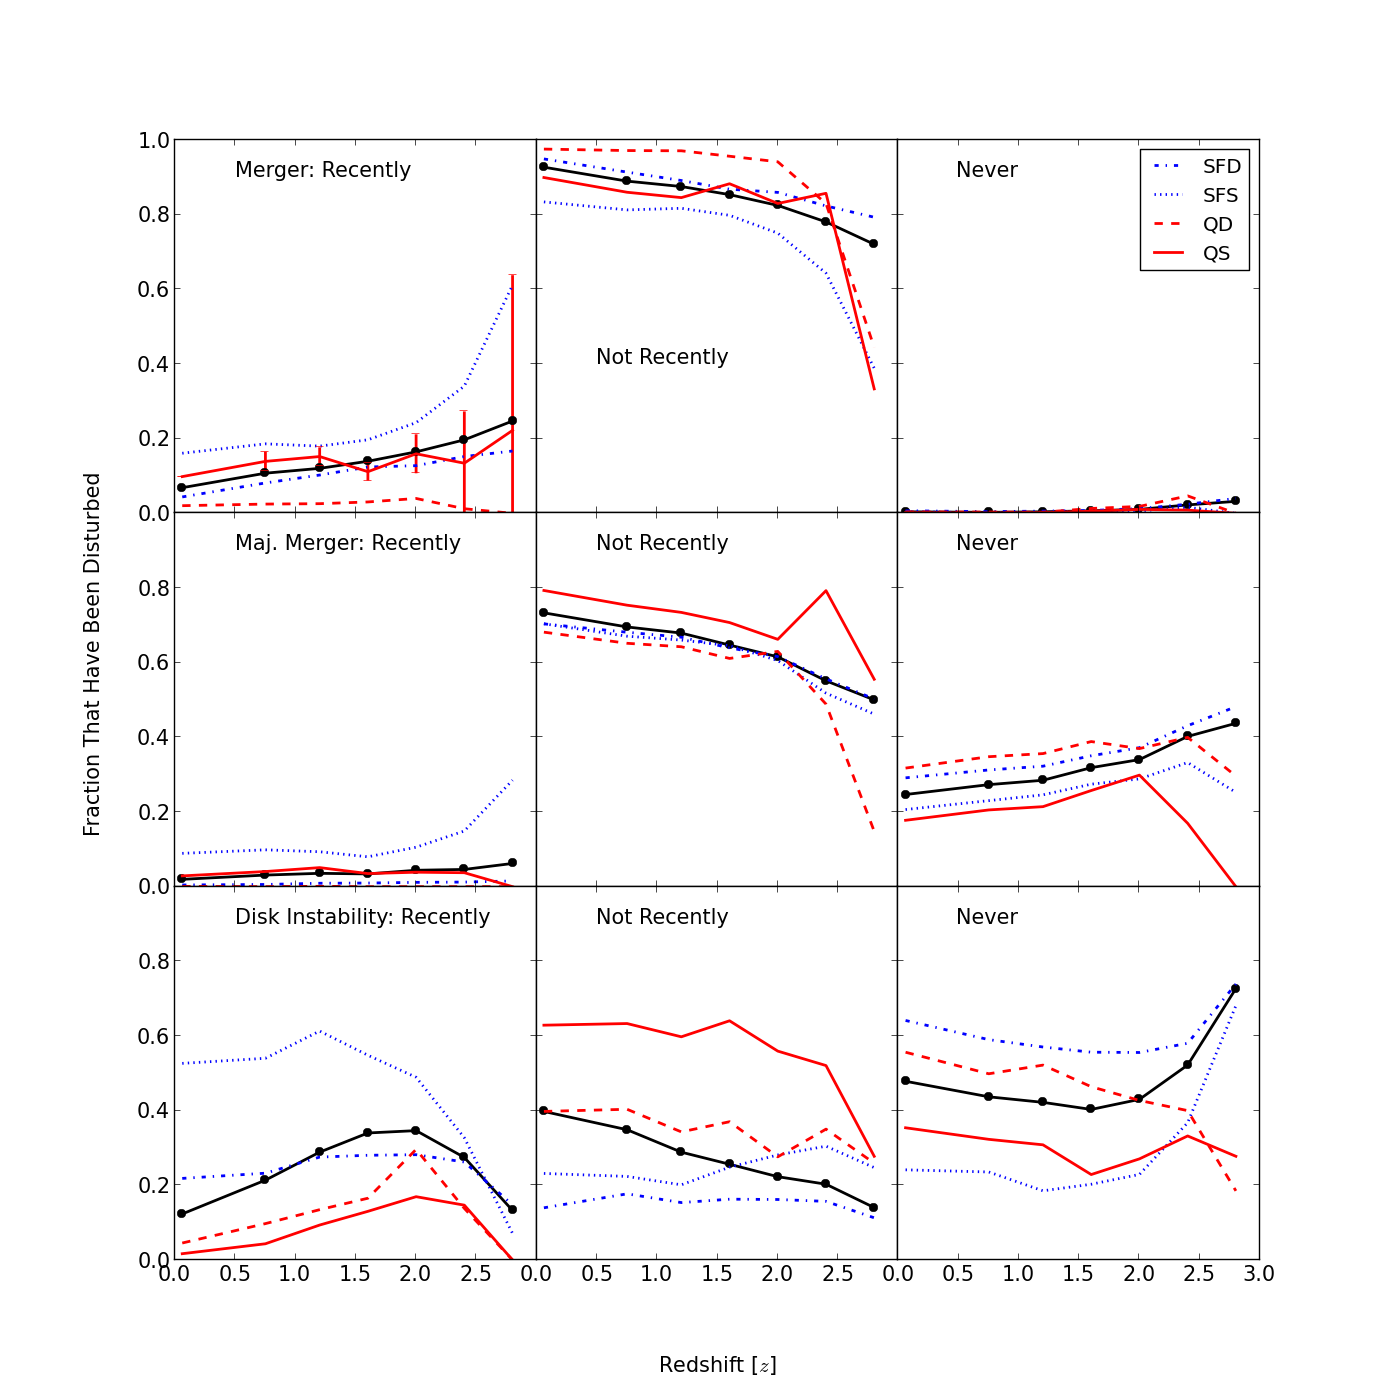
The evolution of the quadrant fractions in Figure 20 is extremely similar to that in Figure 9. The fraction predicted in each of the spheroid-dominated quadrants is slightly larger than in the Sérsic index case. Figure 21 is like Figure 12. The only significant difference when splitting by instead of is in the disk instability plot. More SFSs and QSs have had recent disk instabilities as defined by than by . This is because the change in definition is not likely to affect galaxies that are very clearly disk-dominated or spheroid-dominated. The galaxies that have intermediate Sérsic indices or are the ones that are traded back and forth depending on definition (because of their rbd values), and a large fraction of these are created by the disk instability. This is also why the results for the DI model seem to be affected more strongly by morphological definition than the noDI model.