A summary of the Planck constant measurements using a watt balance with a superconducting solenoid at NIST
Abstract
Researchers at the National Institute of Standards and Technology have been using a watt balance, NIST-3, to measure the Planck constant for over ten years. Two recently published values disagree by more than one standard uncertainty. The motivation for the present manuscript is twofold. First, we correct the latest published number to take into account a recently discovered systematic error in mass dissemination at the Bureau International des Poids et Mesures (BIPM). Second, we provide guidance on how to combine the two numbers into one final result. In order to adequately reflect the discrepancy, we added an additional systematic uncertainty to the published uncertainty budgets. The final value of measured with NIST-3 is . This result is fractionally higher than . Each number in parentheses gives the value of the standard uncertainty in the last two digits of the respective value and is the conventional value of the Planck constant given by , where and denote the conventional values of the Josephson and von Klitzing constants, respectively.
I Introduction
Researchers at the National Institute of Standards and Technology (NIST) have published two results for the Planck constant, in 2007 rs07 and in 2014 ss14 using the same apparatus, the third generation of the NIST watt balance, referred to as NIST-3. The published values are
and
respectively. Each number in parentheses gives the value of the standard uncertainty () in the last two digits of the quoted value. The symbol denotes the conventional value of the Planck constant given by , where and denote the conventional values of the Josephson and von Klitzing constants, respectively.
Before we discuss the two measurements, we note that the 2014 result must be adjusted due to an offset in the SI unit of mass disseminated by the Bureau International des Poids et Mesures (BIPM). During the extraordinary comparison extrao of the international prototype of the kilogram (IPK) at the BIPM, it was found that the mass unit as maintained by the BIPM is 35 g larger than the mass of IPK mass_offset .
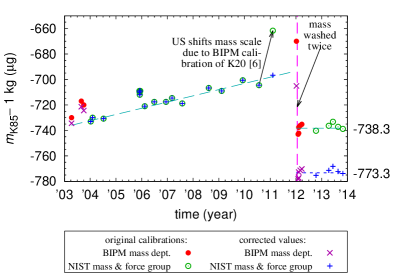
All measurements of the Planck constant discussed here were performed with the NIST platinum-iridium prototype No. 85, known as K85. Figure 1 shows the calibration history of K85. The first calibration certificate for K85 was issued by the BIPM in November 2003. Shortly after being put in service with NIST-3, the mass of this prototype drifted upwards with a rate of approximately 5 g per year. At the time of the NIST-3 experiment, this drift was taken into account in the calculations of the published values of . In 2010, the United States shifted its mass scale by g/kg, because it was found during a routine calibration of the US national standard prototype K20 that the BIPM mass scale and the US mass scale differed by g/kg zk14 . At the end of 2011, K85 was sent for calibration to the BIPM, where it was washed two times. The measurements of the mass of K85 performed by the NIST mass and force group and the BIPM in 2012 and 2013 are in agreement within uncertainties. A constant value for the mass of K85 of g was used to calibrate all NIST-3 measurements made in 2012 and 2013.
In 2014, during the extraordinary mass comparison, it was discovered that the mass unit as maintained by the BIPM is g/kg larger than the mass scale set by the IPK mass_offset . It is believed that the difference between the mass unit as maintained by the BIPM and the IPK has accumulated between 2000 and 2014. Calibrations made at the BIPM before 2000 are therefore deemed good calibrations with respect to the IPK extrao . But, calibration certificates issued by the BIPM after 2000 have to be corrected to be consistent with the international definition of the kilogram. According to a numerical model made by the BIPM, the calibration value assigned to K85 by the BIPM in 2003 must be decreased by approximately g and the one assigned in 2012 by approximately g BIPMcorr . The latter correction largely erases the adjustment made to the US mass scale in 2010.
After K85 had arrived at NIST at the end of 2003, it was measured against the national prototype, K20, by the NIST mass and force group. The national prototype, as well as the national check standard, K4, have been calibrated at the BIPM in 1999. At this time the mass unit as maintained by the BIPM was still synchronized to the IPK. Hence, it is believed that the calibration values determined by the NIST mass and force group for K85 from 2004 through the end of 2011 are accurate representations of the mass of K85 with respect to the mass of the IPK. The measurements taken during this time do not need to be corrected zeina .
In 2011, the mass and force group shifted its mass scale to be consistent with the mass scale given by the mass unit as maintained by the BIPM, which, as we now know, was different than the mass unit given by the IPK. Hence, all data taken with NIST-3 in 2012 and 2013 used a value for K85 that was tied to the mass scale as maintained by the BIPM, which was about g different from the mass of the IPK at that time. Therefore, the measured value for needs to be corrected down relatively by . This yields
In summary, the time dependent shape of the correction to the NIST values is a step function rather than a smooth interpolation. The relative correction that must be applied to the published values is for data taken before Dec. 2011 and for data taken thereafter.
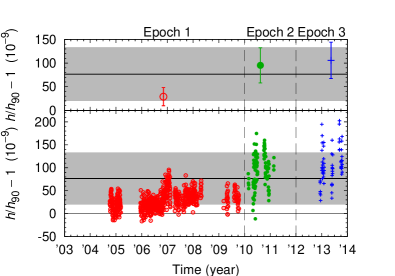
The relative difference between the values of and is . All data obtained with NIST-3 using K85 are shown in Figure 2. The data points after January 2012 are corrected by the as discussed above. The lower panel shows the data grouped in daily data runs. The data can be divided into three epochs. The upper panel shows the values obtained by taking the mean of the data in each epoch. The error bars indicate the statistical standard deviation of the data. The mean value and the statistical standard deviation for each epoch are also given in table 1.
The average value of the data in the first epoch is slightly larger than the value published in rs07 . This is due to the fact that rs07 includes data up to July 2006, while the first epoch includes data up to the end of 2009. The additional data increased the combined mean by a non-significant amount, i.e., the mean of the epoch and the published value are consistent within uncertainties.
| epoch | time | ||
|---|---|---|---|
| 1 | 2004-2009 | 29 | 19 |
| 2 | 2010/2011 | 95 | 37 |
| 3 | 2012/2013 | 106 | 38 |
| unweighted mean | 77 | ||
The measured value of shifted by a relative amount of approximately , which at the time was not recognized, but we now term as the beginning of the second epoch of data recording. Nearly simultaneously with the (only later realized) long term shift, the day to day scatter of the data increased by a factor of two. At the time, the experiment was being incrementally improved while being studied to determine the cause of the sudden changes. Even recent reexamination of the change records and effects could find no clear, single cause for the shift or the increase in scatter.
Since 2010, the measured values were stable around a mean value of and the data could have been summarized into one longer epoch. However, significant changes were implemented starting in 2012 as summarized in ss14 . Most importantly, the 2012 and 2013 measurements were performed blind with the researchers involved not knowing the true result until the unknown offset was publicly revealed in June 2013. Considering the fact that major changes between the second and third epoch did not alter the mean values gives us more confidence in the later number. Moreover, the shift in the mass scale discussed above can be interpreted as a second blind bias added to the experiment. Yet, the 2012 and 2013 results agree with the measurements taken between 2010 and 2011. Hence, we decided to give the later data more weight (two epochs after 2010 vs. one epoch before 2010). Weighting the data after 2010 more heavily, also reflects the fact that our understanding of the apparatus grew as a function of time. Towards the end of the data shown in Fig. 2, we were more confident in our understanding of the system.
After more than fifteen years of experience with this apparatus, we believe that our best measurement of is obtained from the unweighted average of the values obtained in the three epochs listed in Table 1. This average is .
Despite all our experience, we acknowledge that we do not understand the cause of the approximately relative shift. This lack of understanding must be reflected in the uncertainty assigned to the final value. We assign half of the observed shift, , as an additional relative uncertainty component to account for a possible unexplained systematic effect in the measurements. By adding this type B component in quadrature to the relative uncertainty published in ss14 , a combined relative standard uncertainty of is obtained.
The final value for the Planck constant obtained with NIST-3 in ten years of measurement is
A previous version of the NIST watt balance (NIST-2) was used to determine a value of the Planck constant in a measurement campaign lasting four months in 1998 ew98 ; rs05 . The result
was obtained using two gold masses with a combined mass of 1 kg. Hence, the value is independent of the mass changes discussed above and there is no need to modify this value or its uncertainty. Based on the previous estimate CODATA06 of 0.14 for the correlation coefficient between and , we estimate
to be an upper limit for the correlation coefficient between and .
We thank the mass and force group at NIST, especially Zeina Kubarych and Patrick Abbott, for calibrating our masses and for sharing their expertise in mass metrology with us.
References
- (1) R. Steiner, E. Williams, R. Liu and D. Newell 2007 Uncertainty Improvements of the NIST Electronic Kilogram, IEEE Trans. Instrum. Meas. 56 592–6.
- (2) S. Schlamminger, D. Haddad, F. Seifert, L.S. Chao, D.B. Newell, R. Liu, R.L. Steiner, and J.R. Pratt 2014 Determination of the Planck constant using a watt balance with a superconducting magnet system at the National Institute of Standards and Technology, Metrologia 51 S15–S24.
- (3) BIPM, private communication, to be published in Metrologia
- (4) BIPM calibration certificate, No. 53 of protoype No. 102, October 7th 2014, Sèvres, France.
- (5) Revised mass values for BIPM calibrations following the Extraordinary Calibration Campaign against the IPK 2014 BIPM, private communication.
- (6) Z.J. Kubarych, P.J. Abbott 2014 The Dissemination of Mass in the United States: Results and Implications of Recent BIPM Calibrations of US National Prototype Kilograms, J. Res. NIST 119 1–5.
- (7) private communication Zeina Kubarych, National Institute of Standards and Technology.
- (8) E.R. Williams, R.L. Steiner, D.B. Newell, and P.T. Olsen 1998 Accurate Measurement of the Planck Constant, Phys. Rev. Lett. 81 2404–2407.
- (9) R. Steiner, D. Newell, and E. Williams 2005 Details of the 1998 Watt Balance Experiment Determining the Planck Constant , J. Res. NIST 110 1–26.
- (10) P.J. Mohr, B.N. Taylor, and D.B. Newell 2008 CODATA recommended values of the fundamental physical constants: 2006, Rev. Mod. Phys. 80 633 – 730.