Search for dark Higgsstrahlung in and missing energy events with the KLOE experiment
Abstract
We searched for evidence of a Higgsstrahlung process in a secluded sector, leading to a final state with a dark photon and a dark Higgs boson , with the KLOE detector at DANE. We investigated the case of lighter than , with decaying into a muon pair and producing a missing energy signature. We found no evidence of the process and set upper limits to its parameters in the range 1000 MeV, .
keywords:
dark matter , dark forces , U boson , upper limit , higgsstrahlung, , , , , , , , , , , , , , , , , , , , , , , , , , , , , , , , , , , , , , , , , , , , , , , , , , , , , , , ,
1 Introduction
Astrophysical data reveal in a more and more convincing way that our knowledge of the Universe is limited to about 4-5% of the total matter-energy content: this is generally interpreted as an evidence of the existence of dark matter and dark energy components. In recent years, several astrophysical observations have failed to find a common interpretation in terms of standard astrophysical or particle physics sources [1, 2, 3, 4, 5, 6, 7, 8, 9, 10]. Although there are alternative explanations for some of these results, they could all be explained with the existence of a dark matter weakly interacting massive particle, WIMP, belonging to a secluded gauge sector under which the Standard Model (SM) particles are uncharged [11, 12, 13, 14, 15, 16, 17, 18, 19, 20]. In a minimal model, a new abelian gauge field is introduced, the U boson or dark photon, with mass near the GeV scale, coupled to the SM only through its kinetic mixing with the SM hypercharge field. The kinetic mixing parameter is expected to be of the order [12, 13, 14, 15, 16, 17, 18, 19, 20, 21], so that observable effects can be detected at colliders [22, 21, 23, 24, 25] or at fixed target experiments working in the GeV region [26, 27, 28, 29]. The existence of the U boson, through its mixing with the ordinary photon, can also accomodate the observed discrepancy in the measured muon anomalous magnetic moment with respect to the SM prediction [30]. Several searches of the boson have been performed in recent years with negative results, setting upper limits to : A1 [31, 32], APEX [33], WASA [34], HADES [35], KLOE [36, 37], BaBar [38].
Since the U boson needs to be massive, one can implement, in close analogy with the SM, a spontaneous breaking mechanism of the symmetry, thus introducing a Higgs-like particle, or dark Higgs, whose mass hierarchy with the dark photon is not constrained by the theory [22].
The U boson can be produced at colliders via different processes: , (dark Higgsstrahlung) and in decays of vector particles to pseudoscalars. In this work the Higgsstrahlung process is studied, using data collected by the KLOE experiment at the collider DANE at the Frascati laboratory, both at a center of mass energy of 1019 MeV, the mass of the meson (on-peak sample), and at a center of mass energy of 1000 MeV (off-peak sample). The process , with decaying into lepton or hadron pairs, is an interesting reaction to be studied at an collider, being less suppressed, in terms of the mixing parameter, than the other final states listed above. There are two very different scenarios depending on the masses of the dark photon and of the dark Higgs boson . For larger than 2, the dark Higgs boson would decay dominantly and promptly to a U boson pair, thus giving rise to a six charged particle final state (the scenario with larger than but smaller than is similar, with one dark photon off shell): this case was recently investigated by the BaBar [39] and Belle [40] experiments. On the other side, Higgs bosons lighter than the dark photon would have, in most of the parameter space region, such a large lifetime to escape detection, showing up as a missing energy signature. We confined the search only to the latter case, , the so called “invisible” dark Higgs scenario.
The lifetime of the dark Higgs boson depends on the kinetic mixing parameter , the boson masses and and the dark coupling constant [22]. For boson masses of the order of 100 MeV and , the dark Higgs boson lifetime would be for , corresponding, for the energy range explored in this analysis, to a decay length of 100 m. The dark Higgs boson would be thus invisible up to , depending on the mass.
In this work the search is limited to the decay of the U boson in a muon pair: the final state signature is then a pair of opposite charge muons plus missing energy. The measurement is thus performed in the range 1000 MeV with the constraint .
The production cross section of the dark Higgsstrahlung process is proportional to the product and depends on the boson masses [22]. Values as high as hundreds of fb are reachable in this model. Compared to the B-factory case [39, 40], KLOE benefits of the 1/s factor and of the resonance-like behaviour expected for the production cross section [22]. The branching ratio of the U boson into muon pairs is predicted to be just below the 50% level for masses slightly above the kinematical threshold , then to decrease up to a minimum around 5%, for masses corresponding to the resonance (due to the concurrent decay into hadrons), and then to increase to up to 1 GeV [22].
2 The KLOE Detector
DANE, the Frascati -factory, is an collider working at the center of mass energy, GeV [41]. Positron and electron beams collide at an angle of 25 mrad, producing mesons nearly at rest. The KLOE detector is made up of a large cylindrical drift chamber (DC) [42], surrounded by a lead scintillating fiber electromagnetic calorimeter (EMC) [43]. A superconducting coil around the EMC provides a 0.52 T magnetic field along the axis of the colliding beams.
The EMC consists of barrel and end-cap modules covering 98% of the solid angle. The calorimeter modules are segmented into five layers in depth and read out at both ends by 4880 photomultipliers. Energy and time resolutions are and , respectively. The drift chamber, with only stereo sense wires, m in diameter and m long, has a mechanical structure in carbon-fiber and operates with a low-mass gas mixture (90% helium, 10% isobutane). The spatial resolutions are and mm. The momentum resolution for large angle tracks is . The trigger [44] uses both EMC and DC information. Data are then analysed by an event classification filter [45] , which selects and streams various categories of events in different output files.
3 Event selection
The analysis of the process , , invisible ( in the following), has been performed on a data sample of 1.65 fb-1 collected at a center of mass energy of 1019 MeV, corresponding to the mass of the meson (on-peak sample in the following), and on a data sample of 0.206 fb-1 at a center of mass energy of 1000 MeV (off-peak sample in the following), well below the resonance.
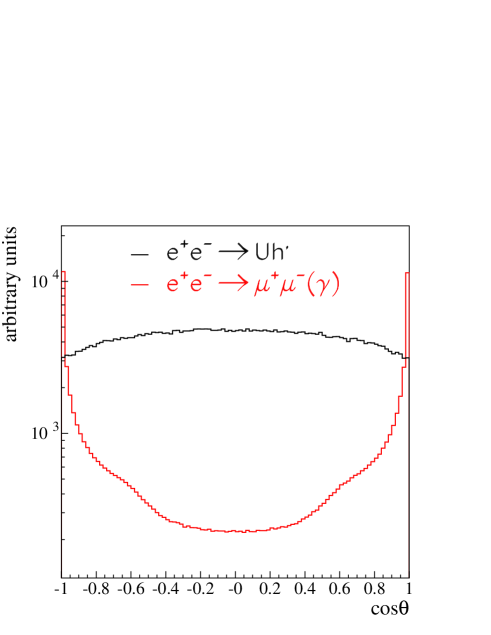
The Monte Carlo simulation of the signal process has been produced using an ad hoc generator interfaced with the standard KLOE simulation program [45]. Signal samples have been generated for various pairs of - values along a grid with steps of 30 MeV to cover all the allowed kinematic region. The invariant mass resolution varies between 0.5 and 2 MeV for the muon pair (), and between 3 and 17 MeV for the event missing mass (). The signal process signature would thus be the appearance of a sharp peak in the bidimensional distribution - . Moreover, the distribution of the polar angle direction of the muon pair momentum, , contrarily to most of the dominant background processes, is expected to prefer large angles. The differential cross section has two dominant terms proportional to and [22], with relative weights smoothly dependent on the boson masses. This angular distribution allows to reject most of the background of QED processes with a simple geometrical selection and implies that the missing momentum direction preferably points to a very well equipped region of the KLOE detector, where the best efficiency is achieved. Fig. 1 shows the distributions of the muon pair polar angle direction for the signal (black line) and the background (red line), where all the generated samples at various and masses are included in the signal sample.
As a first step of the analysis, a preselection was performed by requiring:
-
•
events with only two opposite charge tracks with associated EMC clusters, with polar angles and momenta below 460 MeV, that form a reconstructed vertex inside a cylinder of 30 cm length, 4 cm radius, centered at the interaction point (IP);
-
•
the sum of the momenta of the two tracks to be greater than 450 MeV;
-
•
the polar angle of the dimuon momentum to be in the barrel acceptance: ;
-
•
the modulus of the missing momentum to exceed 40 MeV.
After this selection, mostly aimed at rejecting backgrounds from QED processes, the hermeticity and tightness of the electromagnetic calorimeter was used as a veto to avoid the presence of photons in the event by requiring no prompt EMC clusters unassociated to tracks. The calorimeter veto inefficiency as a function of the energy was studied with a sample of radiative Bhabha scattering events and found to range between 10% at 20 Mev and 0.1% at about 200 MeV.
The event selection then proceeded by applying a particle identification (PID) algorithm to the two tracks, based on the excellent energy and time resolution of the EMC. A set of feed-forward neural networks, organised for different values of track momentum and track polar angle, was trained on simulated Monte Carlo samples to perform muon to electron discrimination. The neural networks used five input variables (cluster time, energy to momentum ratio and three variables related to energy depositions in calorimeter layers) and produces one output. The PID performances were checked on selected data samples of , , : the fraction of events where both tracks were identified as muons was measured to be 85% in events, 10-4 in events and 50% in events (showers produced by muons or pions have similar properties at low energies).
After missing energy and PID selections, a large background from , events survived in the on-peak sample. This happens when both kaons decay semileptonically close to the IP. Charged kaons have an average decay length of 90 cm in KLOE. The reconstructed vertex of the muon tracks is thus expected to be displaced from the IP and with a bad fit quality. Cuts on the radial and z projections of the distance between the reconstructed vertex and the IP and on the of the fit allowed to reduce by a factor 80 the , background, lowering the signal efficiency by 65%.
Events surviving all the described selections were organized in bidimensional histograms with the muon pair mass and the event missing mass on the two axes. The binning was chosen to keep most of the signal inside a single bin. For a 5 MeV bin width was enough over all the plane; while for a variable binning of 15, 30 and 50 MeV widths was chosen. According to the simulation, a fraction of 9095% of the signal was contained in one single bin. The signature of the process would thus be the appearance of an excess in a single bin in the - plane over the background. The signal selection efficiency, estimated from Monte Carlo on the generated points of the - grid, was found to be between 15% and 25%, depending on the masses, with most frequent values of 20%. The efficiency for a generic point on the - plane was then evaluated by linear interpolation.
4 Results
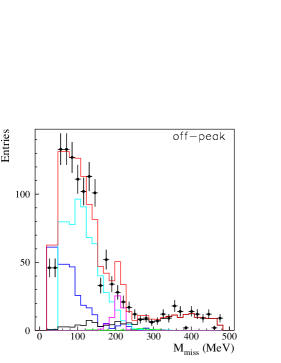
After all the described selections, 15278 events survived in the on-peak sample (fig. 2, left plot) and 783 in the off-peak sample (fig. 2, right plot). In the left plot of fig. 2 (on-peak sample) several sources of backgrounds can be distinguished:
-
•
, (quadrangular region at the left of the populated part of the distribution);
-
•
(quasi-horizontal band, corresponding to events in which both photons from the decay are undetected), partly intersecting the , region;
-
•
and events in the continuum (diagonal and horizontal bands starting from the right-bottom part of the distribution);
-
•
and (photon-photon interactions, top triangular part of the distribution, for 350 MeV), with in the final state being scattered at very small angles in the beam pipe.
In the distribution in the right plot of fig. 2 (off-peak sample) all the backgrounds from the decays are strongly suppressed and only those in the continuum remain visible.


Monte Carlo generators fully interfaced with the KLOE detector simulation program were available for all the background processes but for the and . For these two processes the Courau generator program [46] was used and the results smeared to keep into account the detector effects.
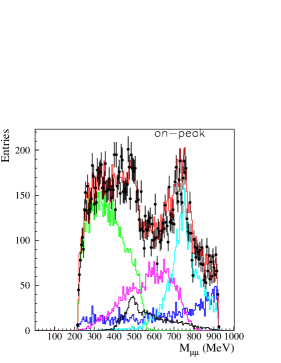
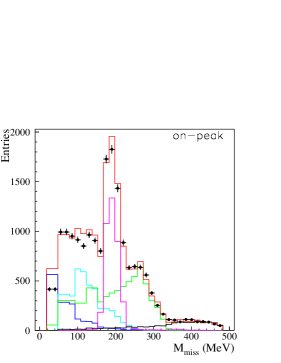
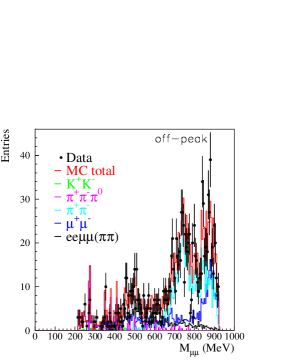
As most of the signal is expected to populate a single bin of the mass distributions, a 55 bin matrix in the - plane was built and moved sliding all along the distributions of fig. 2 both on data and Monte Carlo. The presence of a possible signal was checked by using the central bin, while the others were used for background evaluation. This was done by computing a data-Monte Carlo scale factor based on the sum of the contents of the 24 bins surrounding the central one in data () and Monte Carlo (): . The prediction for the background in the central bin is then simply defined as the product of the central bin content in Monte Carlo rescaled by . The usage of the described scaling procedure allowed to reduce the systematic uncertainties due to the background evaluation (see sec. 5). Fig. 3 shows the data-Monte Carlo comparison after the scaling correction for the on-peak and off-peak samples, projected along the and axes, together with the individual contributions of the different background processes. The agreement is satisfactory all over the populated regions of the distributions.
5 Systematic errors
Systematic uncertainties affect the signal efficiency evaluation and the background estimate. Several sources of systematic uncertainties in the signal efficiency evaluation from Monte Carlo were taken into account.
Uncertainties from the PID procedure were estimated by selecting samples of in data and Monte Carlo, applying the PID algorithms to one of the two tracks to increase the purity of the selection and studying on the opposite track the data-Monte Carlo differences of the PID efficiency as a function of the track momentum. The total effect, defined as the average product of individual effects on the single tracks, was found to vary between 2% and 3%, depending on the boson masses. A similar procedure was applied to evaluate the correction factors and systematic uncertainties of the PID algorithms for pion identification, which affect the background evaluation.
The same samples selected in data and in the simulation were used to evaluate the effect of the cut on the vertex-IP distance. A correction to the Monte Carlo signal efficiencies of the order of 15%, weakly dependent on , was derived and applied. An associated systematic error of 0.5% was estimated and added on the signal efficiency evaluation.
The systematic uncertainty due to the usage of the EMC veto was evaluated by selecting samples of , in data and Monte Carlo. In this case, the cut on the vertex-IP distance was slightly relaxed, in order to increase the size of the sample. A 2% data-Monte Carlo difference was observed and used both to correct the Monte Carlo efficiency and to quote a systematic uncertainty due to this source.
The systematic uncertainty due to the kinematical preselections of the analysis was estimated by varying track angles and momenta within their measurement errors by one standard deviation: a 1% effect was ascribed to this source.
The systematic uncertainty due to the binning choice was estimated by evaluating in the simulation the binomial statistical error on the fraction of the signal contained in one bin. This turned out to be of the order of 0.3%, on average.
Finally, an average uncertainty was estimated due to the linear interpolation procedure in the signal efficiency evaluation process.
The total systematic uncertainty on the signal efficiency was then evaluated as the quadratic sum of all the above effects. It never exceeded 4%, with an average value of 3.5%, very small when compared to the statistical uncertainties affecting this measurement.
Most of the systematic uncertainties in the background evaluation cancel in the scale factor ratio . All the systematic sources considered for the signal efficiency evaluation, but those related to the linear interpolation procedure, were taken into account and their effect on the background estimate computed.
Additional effects were taken into account. The uncertainties on the background process cross sections were varied within their theoretical and measurement errors; a further 1% uncertainty was added for those related to the photon-photon final states, for which no full simulation was available; the uncertainty on the integrated luminosity was estimated to be 0.3%.
The total systematic uncertainty on the background was evaluated as the quadratic sum of all the above effects. It has an average value of 2.7% with a very small tail extending up to 10%.
6 values and Upper Limits
In order to evaluate the compatibility of the observed results with the background only hypothesis ( value) and to derive upper limits to the parameters of the dark Higgstrahlung process, a Bayesian procedure was set up. For each position of the bin mass matrix, a likelihood function was devised based on uniform prior probabilities of the counting variables (constrained to be non negative) and on four Poissonian distributions representing the probabilities related respectively to the number of observed events in the central bin of the sliding matrix, the number of predicted background events in the same bin from Monte Carlo, the number of observed and predicted events in the surronding 24 bins ( and , entering in the scale factor ratio ). This procedure takes thus into full account the fluctuations due to the data and Monte Carlo statistics. The systematic uncertainties on the signal efficiency and on the background estimate were taken into account by convolving the four Poissonian distributions with two correlated Gaussian distributions, with variances set equal to the estimated systematic errors. Whenever the dark Higgsstrahlung process was searched for, the small fraction of signal expected outside the central bin of the 5x5 sliding matrix was explicitly taken into account in the likelihood expression.
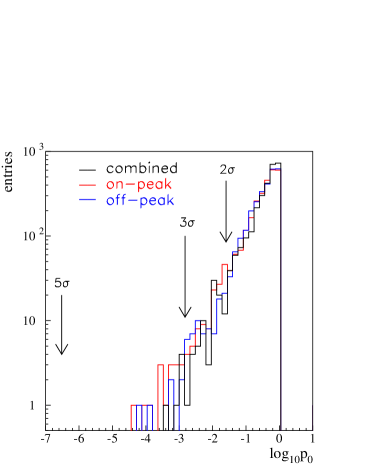
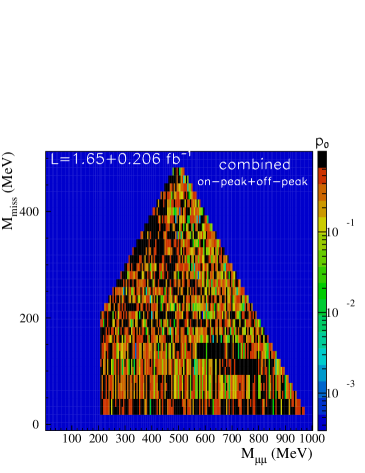
The distributions for the on-peak, off-peak and combined samples are shown in fig. 4, left plot. Fig. 4, right plot, shows the computed values as a function of - masses for the combined sample. There are three values exceeding the threshold corresponding to a 3 excess, while 4.2 were expected on probabilistic base. The excess significance of those points (see fig. 4) are at the level of 3.1, 3.2 and 3.4. In the on-peak and off-peak samples the most significant values exceeding the 3 threshold are at the level of 3.9 and 3.8 respectively (see fig. 4, left plot) These excesses, even though at quite interesting level, are then lost in the combination of the two samples, becoming fluctuations of average size.
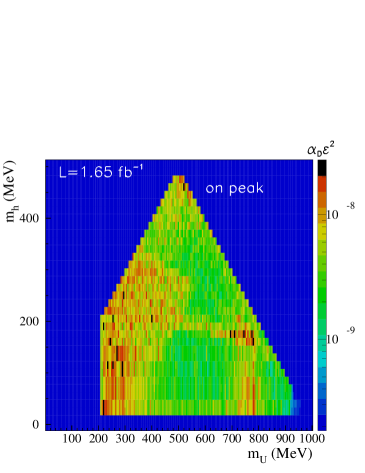
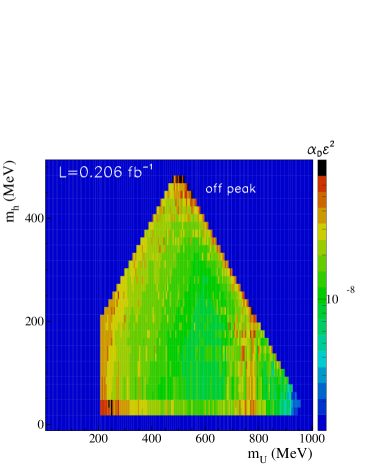
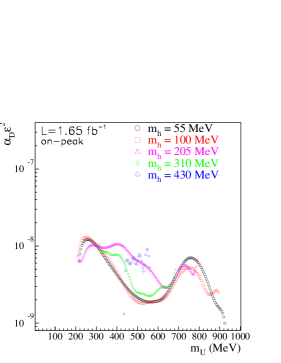
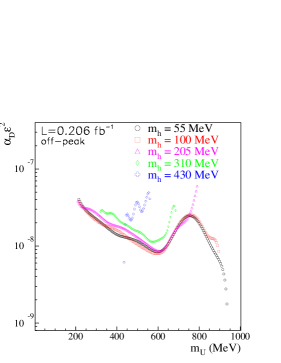
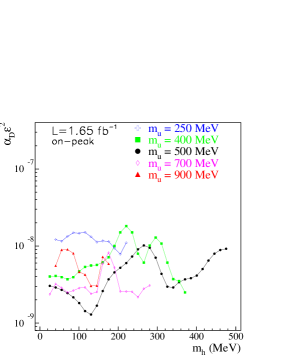
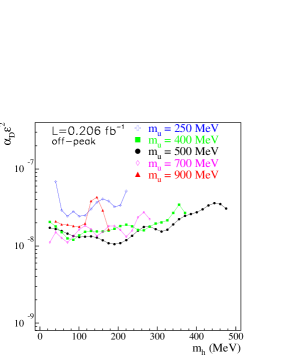
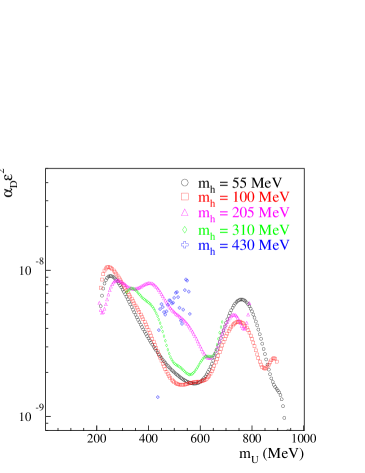
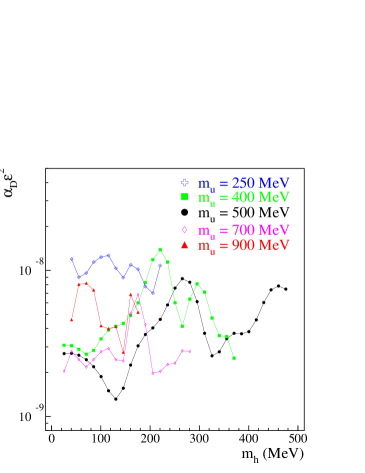
As no evidence of the dark Higgsstrahlung process was found, 90% confidence level Bayesian upper limits on the number of events were derived bin by bin in the - plane, separately for the on-peak and off-peak samples, and then converted in terms of . They are shown in fig. 5. Fig. 6 shows the on-peak and off-peak 90% CL upper limits projected along the and axes after a slight smoothing to make them more readable. The different curves in () correspond to different values of (). These results were then combined by taking into account the different integrated luminosities of the two samples and the respective signal efficiencies and cross sections. The combined results are almost everywhere dominated by the on-peak sample, because of the larger available statistics, with the exception of some very noisy background regions. They are shown in fig. 7. These limits are largely dominated by the data statistics. Values as low as 1010-8 of the product are excluded at 90% CL for a large range of the dark photon and dark Higgs masses.
7 Conclusions
A search for the dark Higgsstrahlung process , , invisible, has been performed by KLOE in the range 1000 MeV with . No evidence for signal has been observed and upper limits on the product of the kinetic mixing parameter and the dark coupling constant have been set in the range 1010-8 in . With the arbitrary hypothesis these measurements translate into limits on the kinetic mixing parameter in the range 1010-3.
8 Acknowledgments
We warmly thank our former KLOE colleagues for the access to the data collected during the KLOE data taking campaign.
We thank the DANE team for their efforts in maintaining low background running conditions and their collaboration during all data taking. We want to thank our technical staff:
G.F. Fortugno and F. Sborzacchi for their dedication in ensuring efficient operation of the KLOE computing facilities;
M. Anelli for his continuous attention to the gas system and detector safety;
A. Balla, M. Gatta, G. Corradi and G. Papalino for electronics maintenance;
M. Santoni, G. Paoluzzi and R. Rosellini for general detector support;
C. Piscitelli for his help during major maintenance periods.
This work was supported in part by the EU Integrated Infrastructure Initiative Hadron Physics Project under contract number RII3-CT- 2004-506078; by the European Commission under the 7th Framework Programme through the ‘Research Infrastructures’ action of the ‘Capacities’ Programme, Call: FP7-INFRASTRUCTURES-2008-1, Grant Agreement No. 227431; by the Polish National Science Centre through the Grants No. 0469/B/H03/2009/37, 0309/B/H03/2011/40, DEC-2011/03/N/ST2/02641,
2011/01/D/ST2/00748, 2011/03/N/ST2/02652, 2013/08/M/ST2/00323 and by the Foundation for Polish Science through the MPD programme and the project HOMING PLUS BIS/2011-4/3.
References
- [1] P.Jean et al, Astron. Astrophys. 407 (2003) L55
- [2] O. Adriani et al., Nature 458 (2009) 607
- [3] M. Aguilar et al., Phys. Rev. Lett. 110 (2013) 141102
- [4] J. Chang et al., Nature 456 (2008) 362
- [5] A.A. Abdo et al., Phys. Rev. Lett. 102 (2009) 181101
- [6] F. Aharonian et al., Phys. Rev. Lett. 101 (2008) 261104
- [7] F. Aharonian et al., Astron. Astrophys. 508 (2009) 561
- [8] R. Bernabei et al., Int. J. Mod. Phys. D13 (2004) 2127
- [9] R. Bernabei et al., Eur. Phys. J. C56 (2008) 333
- [10] C.E. Aalseth et al., Phys. Rev. Lett. 107 (2011) 141301
- [11] M. Pospelov, A. Ritz, M.B. Voloshin, Phys. Lett. B662 (2008) 53
- [12] N. Arkani-Hamed, D.P. Finkbeiner, T.R. Slatyer, N. Weiner, Phys. Rev. D79 (2009) 015014
- [13] D.S.M. Alves, S.R. Behbahani, P. Schuster, J.G. Wacker, Phys. Lett. B692 (2010) 323
- [14] M. Pospelov, A. Ritz, Phys. Lett. B671 (2009) 391
- [15] J. Hisano, S. Matsumoto, M.M. Nojiri, Phys. Rev. Lett. 92 (2004) 031303
- [16] M. Cirelli, M. Kadastik, M. Raidal, A. Strumia, Nucl. Phys. B813 (2009) 1
- [17] J. March-Russell, S.M. West, D. Cumberbatch, D. Hooper, JHEP 0807 (2008) 058
- [18] I. Cholis, G. Dobler, D.P. Finkbeiner, L. Goodenough, N. Weiner, Phys. Rev. D80 (2009) 123518
- [19] I. Cholis, D.P. Finkbeiner, L. Goodenough, N. Weiner, JCAP 0912 (2009) 007
- [20] N. Arkani-Hamed, N. Weiner, JHEP 0812 (2008) 104
- [21] R. Essig, P. Schuster, N. Toro, Phys. Rev. D80 (2009) 015003
- [22] B. Batell, M. Pospelov, A. Ritz, Phys. Rev. D79 (2009) 115008
- [23] M. Reece, L.T. Wang, JHEP 0907 (2009) 051
- [24] N. Borodatchenkova, D. Choudhury, M. Drees, Phys. Rev. Lett. 96 (2006) 141802
- [25] P.F. Yin, J. Liu, S.h. Zhu, Phys. Lett. B679 (2009) 362
- [26] J.D. Bjorken, R. Essig, P. Schuster, N. Toro Phys. Rev. D80 (2009) 075018
- [27] B. Batell, M. Pospelov, A. Ritz, Phys. Rev. D80 (2009) 095024
- [28] R. Essig, P. Schuster, N. Toro, B. Wojtsekhowski, JHEP 1102 (2011) 009
- [29] M. Freytsis, G. Ovanesyan, J. Thaler JHEP 1001 (2010) 111
- [30] M. Pospelov, Phys. Rev. D80 (2009) 095002
- [31] H. Merkel et al, Phys. Rev. Lett. 106 (2011) 251802
- [32] H. Merkel et al, Phys. Rev. Lett. 112 (2011) 221802
- [33] S. Abrahamyan et al, Phys. Rev. Lett. 107 (2011) 191804
- [34] P. Adlarson et al, Phys. Lett. B726 (2013) 187
- [35] G. Agakishiev et al, Phys. Lett. B731 (2014) 265
- [36] D. Babusci et al, Phys. Lett. B720 (2013) 111
- [37] D. Babusci et al, Phys. Lett. B736 (2014) 459
- [38] J.P. Lees et al, Phys. Rev. Lett. 113 (2014) 201801
- [39] J.P. Lees et al. (BaBar Collab.), Phys. Rev. Lett. 108 (2012) 211801
- [40] Igal Jaegle for the Belle Collaboration, arXiv:1211.1403 [hep-ex]
- [41] A. Gallo et al., DAFNE status report, Conf. Proc. C060626 (2006) 604-606
- [42] M. Adinolfi et al., Nucl. Instr. Meth. A488 (2002) 51
- [43] M. Adinolfi et al., Nucl. Instr. Meth. A482 (2002) 364
- [44] M. Adinolfi et al., Nucl. Instr. Meth. A492 (2002) 134
- [45] F. Ambrosino et al., Nucl. Instr. Meth. A534 (2004) 403
- [46] A. Courau, A fast Monte Carlo generator for untagged experiments (1984), SLAC-PUB-3363.