Large-scale shell-model calculations for unnatural-parity high-spin states in neutron-rich Cr and Fe isotopes
Abstract
We investigate unnatural-parity high-spin states in neutron-rich Cr and Fe isotopes using large-scale shell-model calculations. These shell-model calculations are carried out within the model space of -shell + + orbits with the truncation allowing excitation of a neutron. The effective Hamiltonian consists of GXPF1Br for -shell orbits and with a modification for the other parts. The present shell-model calculations can describe and predict the energy levels of both natural- and unnatural-parity states up to the high-spin states in Cr and Fe isotopes with . The total energy surfaces present the prolate deformations on the whole and indicate that the excitation of one neutron into the orbit plays the role of enhancing the prolate deformation. For the positive(unnatural)-parity states in odd-mass Cr and Fe isotopes, their energy levels and prolate deformations indicate the decoupling limit of the particle-plus-rotor model. The sharp drop of the levels in going from to in odd-mass Cr and Fe isotopes is explained by the Fermi surface approaching the orbit.
pacs:
21.10.-k, 21.10.Jx, 21.10.Ky, 21.60.CsI Introduction
The evolution of the shell structure in neutron-rich nuclei is one of the main interests of modern nuclear physics. The neutron-rich -shell region has attracted particular attraction in this context because new neutron magic numbers have recently been established. The subshell closure at is indicated from high levels and reduced values in 52Ca Huck et al. (1985); Gade et al. (2006), 54Ti Janssens et al. (2002); Dinca et al. (2005), and 56Cr Chapman et al. (1968); Bürger et al. (2005) compared to neighboring isotopes. A new subshell closure at was observed in 54Ca in 2013 Steppenbeck et al. (2013), more than a decade after its prediction Otsuka et al. (2001). Evaluating the evolution of those shell gaps is facilitated by advances in shell-model calculations for the full -shell space Honma et al. (2004); Caurier et al. (2005). The appearance of the and magic numbers in the proton-deficient region is attributed to the tensor-force driven shell evolution Otsuka et al. (2005).
The evolution of the shell gap at , one of the main objectives of this paper, constitutes a key to understanding the characteristic features of the nuclear structure in the neutron-rich region. While the magicity seems to be rather stable in Ni isotopes Broda et al. (1995); Ishii et al. (2000); Sorlin et al. (2002), it breaks down completely in Cr and Fe isotopes: very low levels and large values in 60-64Cr Pritychenko et al. (2012); Aoi et al. (2009); Baugher et al. (2012); Crawford et al. (2013) and 66-68Fe Pritychenko et al. (2012); Rother et al. (2011); Crawford et al. (2013) cannot be reproduced without considerable neutron excitations across the shell gap Kaneko et al. (2008); Oba and Matsuo (2008); Lenzi et al. (2010). Most recently, it has been reported that the breakdown of the magicity can possibly be extended even to Ti isotopes Gade et al. (2014) having less proton-neutron quadrupole collectivity than the Cr and Fe isotopes. This abrupt nuclear-structure change from Ni to lower- isotopes is analogous to what is observed in the so-called “island of inversion” region around 32Mg Warburton et al. (1990) where neutron excitation induces a large deformation. The evolution of the shell gap contributes greatly to the formation of the island of inversion in Cr and Fe isotopes. Indeed, it is suggested in Lenzi et al. (2010) that the shell gap reduces with a decreasing proton number in a similar way to the evolution of the gap proposed in Utsuno et al. (1999). The tensor force accounts for this reduction of the harmonic-oscillator shell gaps at and 40 toward lower , and also plays a crucial role in the occurrence of the spherical-oblate-prolate shape coexistence in 68Ni through the Type-II shell evolution proposed in Tsunoda et al. (2014).
While the evolution of the shell gap thus causes a number of intriguing phenomena, it is very difficult to directly deduce this shell gap from the structure of the Cr and Fe isotopes that belong to the island of inversion. This is because low-lying states of those nuclei are dominated by multi-particle multi-hole excitations, and this property is not very sensitive to small changes of the shell gap. On the other hand, the states dominated by one-particle one-hole (-) excitation provide more direct information on the shell gap, when those levels are compared to the - states. For Cr and Fe isotopes, low-lying unnatural-parity states with are regarded as such - states because low-lying natural-parity states in this region are excellently described within the -shell configurations Honma et al. (2004). The nuclear properties of unnatural-parity states in Cr and Fe isotopes in the last decade have been measured mainly from -ray spectroscopy experiments. Important findings from recent experiments include a sharp drop of the levels in going from to observed in Cr and Fe isotopes Appelbe et al. (2003); Deacon et al. (2005); Freeman et al. (2004); Deacon et al. (2007); Hoteling et al. (2008). If this change in energy level is an indication of a sharp evolution of the orbit with an increasing neutron number as suggested in Kaneko et al. (2008), the driving force of the evolution needs to be clarified.
Another significant nuclear-structure issue in the unnatural-parity states in Cr and Fe isotopes is their nuclear shapes; in particular, how these shapes are polarized by an additional neutron in the orbit. The development of deformation is indicated experimentally from the regular spacing between energy levels observed up to high-spin states Appelbe et al. (2003); Deacon et al. (2011, 2005, 2007); Hoteling et al. (2008). While various models show the dominance of prolate deformation in the ground states of Cr isotopes (see Lalazissis et al. (1998) for instance), an oblate deformation in the unnatural-parity band of 59Cr has been suggested in Freeman et al. (2004) from the observed isomeric state located at 503 keV, which should be the lowest among unnatural-parity states. This level is interpreted naively as the bandhead of the intrinsic state, which appears to be the lowest for oblate deformation. On the other hand, a recent study with a projected shell-model calculation has shown that prolate deformation is favored based on comparison with experimental data Yang et al. (2011). A similar isomeric state is observed in 61Fe, and its magnetic moment Matea et al. (2004) and absolute value of quadrupole moment Vermeulen et al. (2007) support prolate deformation according to the particle-triaxial-rotor model Hoteling et al. (2008). More elaborate systematic calculations incorporating various degrees of freedom for deformation and configuration help draw a definite conclusion about the shape evolution in Cr and Fe isotopes.
In this paper, we report on systematic large-scale shell-model calculations for natural-parity and unnatural-parity states in Cr and Fe isotopes for , by clarifying the structure of their - and - bands. Using a combination of known effective interactions that are slightly modified, we achieve excellent agreement with experiment in the whole region studied. This highly descriptive power enables extracting shell and shape evolutions in this region. This paper is organized as follows. In Sec. II, we present our theoretical framework including the effective Hamiltonian to be used in this work. In Sec. III, first, we show the results of the energy levels for neutron-rich Cr and Fe isotopes; secondly, we discuss the deformation for the natural- and unnatural-parity states in these nuclei. In Sec. IV, we discuss how the orbit evolves in this mass region by using theoretical and experimental information. Conclusions of this study are given in Sec. V.
II Theoretical framework
II.1 Shell-model calculation
In the mass region of or from to , the natural-parity states with for even(odd)-mass nuclei are usually described well within the -shell model space with the 40Ca inert core. However, the unnatural-parity states with for even(odd)-mass nuclei cannot be described within one major shell. In the quasi-SU3 model Zuker et al. (1995), the pairs of orbits of a major shell describe quadrupole collectivity. Hence, we choose the and orbits and add them to the -shell model space. In the present shell-model calculation, the model space is composed of -shell (, , , ) + + orbits. To focus on the states dominated by - excitation across the shell gap, a truncation is introduced so that one neutron is allowed to occupy the or orbit, which means that the excitation of a neutron to the shell occurs in only unnatural-parity states.
The present shell-model Hamiltonian has the following form which consists of one- and two-body terms:
| (1) |
where and represent the bare single-particle energy and the two-body matrix element, respectively, denotes a creation(annihilation) operator of a nucleon in a single-particle orbit , and is the term proposed by Gloeckner and Lawson to remove the spurious center-of-mass motion due to the excitation beyond one major shell Gloeckner and Lawson (1974). The parameter of is applied as MeV, where is the mass number: . We take from the empirical value: MeV.
In the present work, the Hamiltonian matrix with an scheme is diagonalized by the thick-restart Lanczos method with MSHELL64 code Mizusaki et al. for the dimension of the matrix below and KSHELL code Shimizu for the dimension over .
II.2 The effective Hamiltonian
In this subsection, we explain the details of the effective Hamiltonian in Eq. (1) in the present work. For the shell-model calculations within the -shell model space, the GXPF1A Hamiltonian Honma et al. (2005) is often applied to reproduce and to predict the properties of nuclei in the region of or from to . Recently, the GXPF1A Hamiltonian has been improved to explain the observed energy levels in neutron-rich Ca isotopes: GXPF1B Honma et al. (2008) with the modification of five two-body matrix elements and the bare single-particle energy which involve the orbit from GXPF1A, and GXPF1Br Steppenbeck et al. (2013) with the modification of the monopole interaction for from GXPF1B. The GXPF1B Hamiltonian can reproduce the energy levels of 51,52Ca, and the GXPF1Br Hamiltonian can reproduce those of 53,54Ca besides 51,52Ca. Here, we adopt the newest effective Hamiltonian, GXPF1Br, for -shell orbits. For neutron excitation to the or orbits, we create the cross-shell two-body interaction between the -shell and -shell orbits from Otsuka et al. (2010), which has the central force of a simple Gaussian form and the tensor force of the mesons exchange force to reproduce the monopole properties of the shell-model Hamiltonian in and shells. We utilize with the refinement Utsuno et al. (2012) by adding the M3Y spin-orbit force Bertsch et al. (1977) and the density dependence for the central force described in Brown et al. (1988). All two-body matrix elements are scaled by as the mass dependence.
In addition to the cross-shell two-body interaction, the bare single-particle energies with the 40Ca inert core for the and orbits need to be determined. The bare single-particle energy of is determined so as to reproduce the excitation energy of states systematically. However, determining the bare single-particle energy of is more difficult than that of . The single-particle property of the orbit in this mass region is masked. In fact, the experimental spectroscopic factors of the state in neutron-rich odd-mass Cr and Fe nuclei are rather small in comparison with those of the state Junde (2008); Bhat (1998); Baglin (2002). Here, we assume that the bare single-particle energy of is equal to that of . This assumption is considered to be reasonable because the splitting of the effective single-particle energies between and for nuclei taken in this study, around 2 MeV, is close to the phenomenological -shell orbits splitting in this mass region Bohr and Mottelson (1975). In the present work, the bare single-particle energy of (= that of ) is determined so as to be fitted to reproduce the excitation energies of in 55,57,59Cr. The resulting value is MeV.
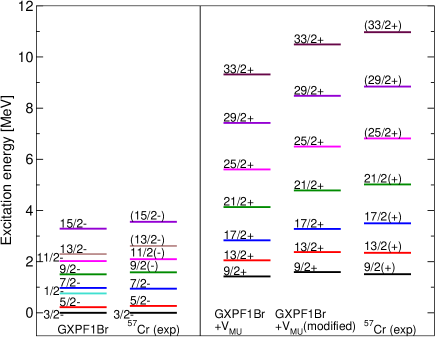
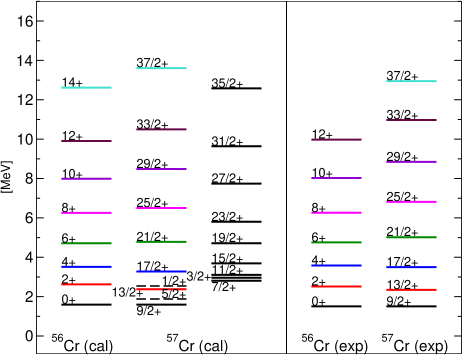
Figure 1 shows the energy levels of 57Cr and the results of the shell-model calculations with the above mentioned Hamiltonian. As seen in Fig. 1, the shell-model calculation with GXPF1Br reproduces the negative(natural)-parity states quite well and GXPF1Br + without modification reproduces the positive(unnatural)-parity states reasonably well. For further improvement, we change the cross-shell two-body matrix elements by MeV for and by MeV for . This modification increases the energy intervals in the positive-parity band by about as a whole. These results labeled GXPF1Br + (modified) in Fig. 1 agree with the experimental data within 500 keV. In the following, we present the results for Cr and Fe isotopes with the new effective Hamiltonian, GXPF1Br + (modified).
 |
|
|
|
|
|
 |
 |
|
|
III Results and Discussion
III.1 Energy levels
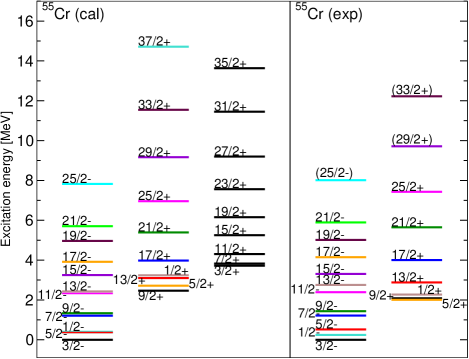
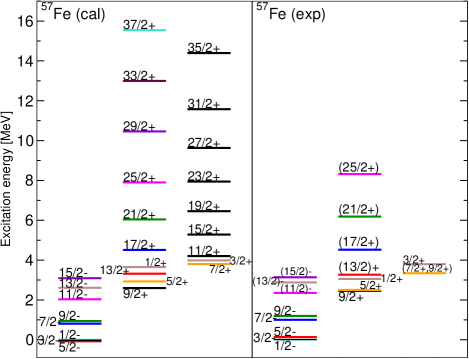
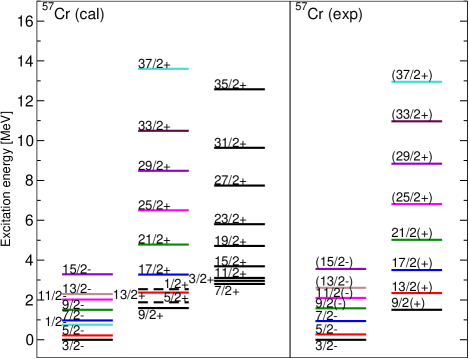
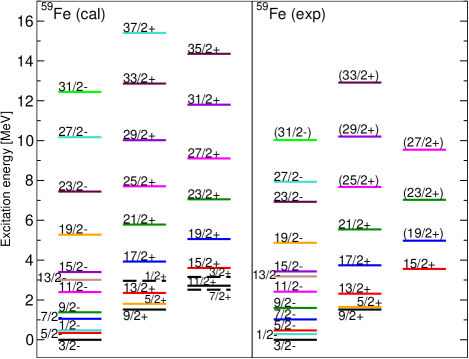
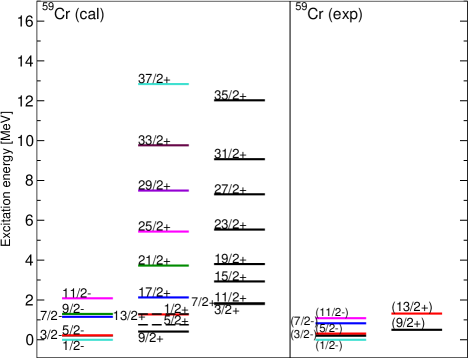
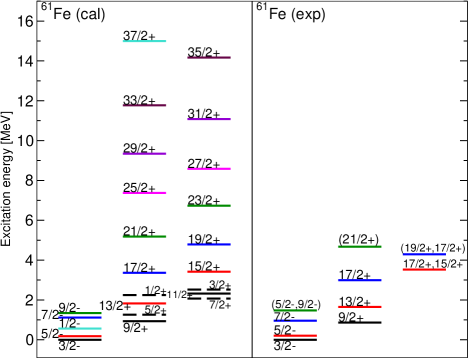
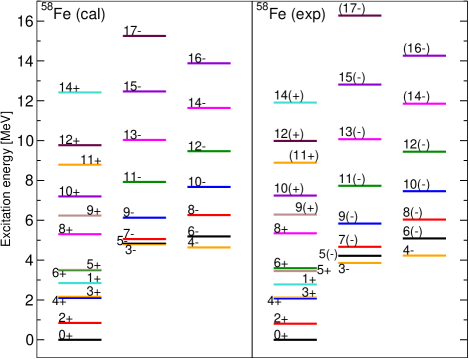
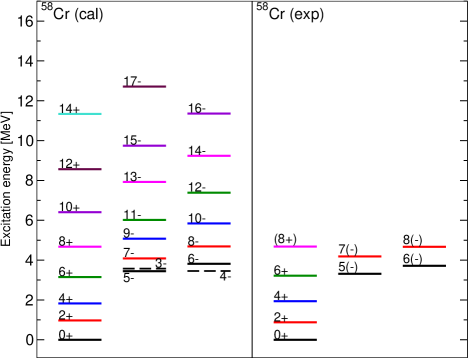
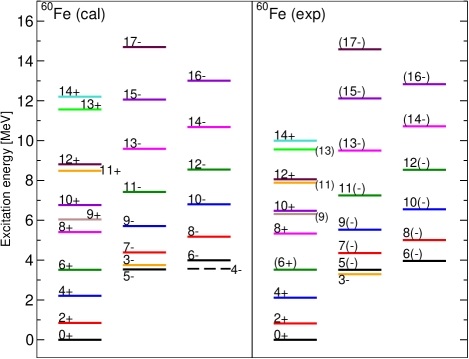
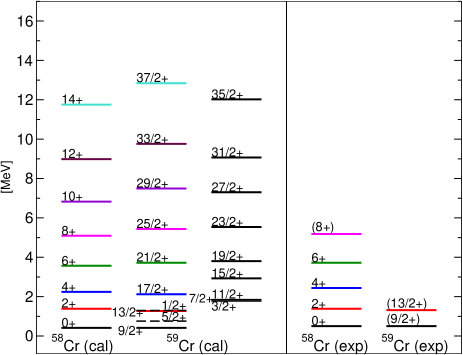
The results of the present shell-model calculation with GXPF1Br + (modified) are compared with the experimental data for Cr and Fe isotopes. We focus here on the lowest states for a given spin and parity . The results for odd-mass and even-mass nuclei are shown in Figs. 2 and 3, respectively, where the unnatural-parity states are classified into two sequences.
For the odd-mass 55-59Cr and 57-61Fe, as seen in Fig. 2, the negative-parity states are described well by the shell-model calculation within the -shell model space. Furthermore, almost all of the observed positive-parity states are reproduced excellently by the present shell-model calculation. For the highest-spin state in 57Cr, the backbending indicated by the small energy interval between the and Zhu et al. (2006) is not well reproduced in this calculation. This shows the limitation of description within the present model space and truncation. The theoretical results show that the and states lie at higher energy than the state in each nucleus. This means that each state is the lowest state in its band. Actually, the and states observed in 55Cr and 57,59Fe are almost degenerate. The present shell-model calculation predicts that the other positive-parity band including , , … is located higher than in each nucleus.
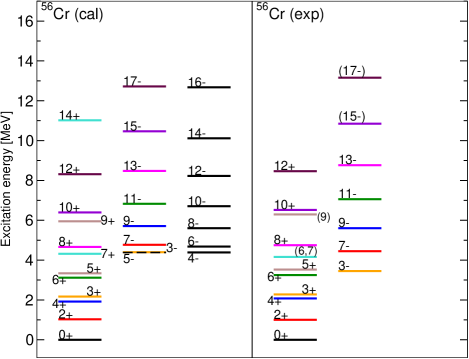
For even-mass 56,58Cr and 58,60Fe, as seen in Fig. 3, the present calculation excellently describes the positive- and negative-parity states except for some of the high-spin states and the states. The observed states lie at slightly lower energies than the calculated ones, which may indicate that these states are described not as a single particle-hole configuration but as collective states, for instance octupole vibrational states. The relative positions of the negative-parity odd- and even- bands are well reproduced with the present calculation. In 58Fe, for instance, the and levels are located higher than the and levels, respectively, whereas higher-spin states follow the regular ordering according to spin. In contrast, we predict that the partners such as and lie very close up to high-spin states for 56Cr.
One of the interesting features for these Cr and Fe nuclei is that the level spacing between of the band built on in the odd-mass nuclei is similar to that of the band in the neighboring even-mass nuclei. For 56-57,58-59Cr, in Fig. 4, we compare the level spacing of the positive-parity yrast states between even- and odd-mass nuclei, which has already been discussed for 54-55Cr Appelbe et al. (2003) and 56-57,58-59,60-61Fe Hoteling et al. (2008). One can see the similar level spacing between the yrast band in even-mass nuclei and the band of the in odd-mass nuclei. Although the experimental information for the high-spin states in 59Cr is not enough, the present calculation predicts this similarity of the level spacing between 58-59Cr. This level structure indicates the decoupling limit of the particle-plus-rotor model Ring and Schuck (1980); Stephens (1975) as discussed in the next subsection.
|
|
|
|---|
|
|
III.2 Deformations
In this subsection, we discuss the deformations for natural- and unnatural-parity states in neutron-rich Cr and Fe nuclei in terms of their intrinsic quadrupole moments. There is no straightforward way to determine the intrinsic quadrupole moments with the shell-model calculations because the shell-model wave functions are described in the laboratory frame. Here we probe deformations from two different approaches. One is approximating the wave function in the intrinsic frame. The other is extracting intrinsic deformations from shell-model wave functions using the geometric model.
The intrinsic-frame approximation in the shell model is often performed with the -constrained Hartree-Fock method Mizusaki et al. (1999); Shimizu et al. (2012). This method is, however, not suitable for deducing intrinsic wave functions for unnatural-parity states which are usually located higher than natural-parity states. In the present study, we calculate the total energy surfaces separately for positive- and negative-parity states by performing the -constrained Hartree-Fock calculation with variation after parity projection. We utilize the parity-projected wave function written as
| (2) |
where represents the space-reflection operator, denotes the parity, , and represent the numbers of the valence particles and the single-particle orbits in the model space, respectively, and denotes an inert core. The coefficients in of Eq. (2) are determined to minimize the energy with the constraints of quadrupole moments and , where the intrinsic axes are chosen to satisfy . is the component of the mass quadrupole operator. Note that the wave function of Eq. (2) is solved by using the shell-model Hamiltonian.
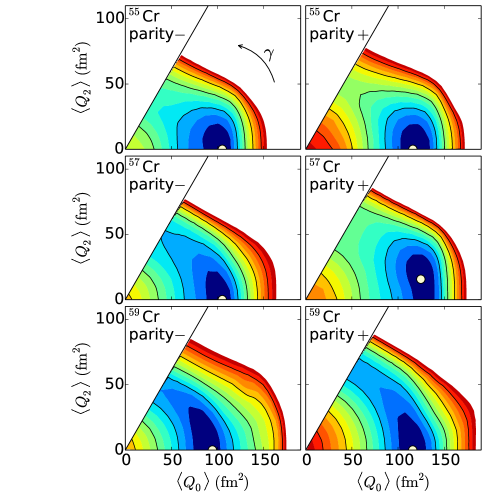
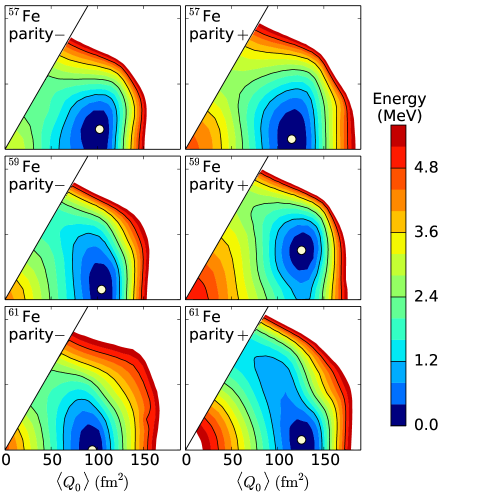
The total energy surfaces for the negative- and positive-parity states in odd-mass 55-59Cr and 57-61Fe are shown in Fig. 5. Those energy surfaces indicate the dominance of prolate deformation. For the negative-parity states, the quadrupole moments at the energy minima are around fm2. For the positive-parity states, those values are enlarged to be around fm2. The wave functions near the energy minima of the positive-parity energy surfaces are dominated by the excitation of one neutron into the orbit. This confirms the validity of the truncation of the model space introduced in this study. While the one-neutron excitation into the orbit induces larger deformation by %, the shape is not changed significantly. In 59Cr, the energy surfaces are -soft for both negative- and positive-parity states. In 61Fe, -softness is seen for the positive-parity state. For the positive-parity state of 59Fe, triaxiality is well developed.
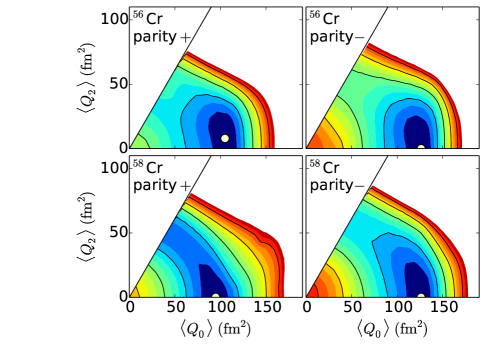
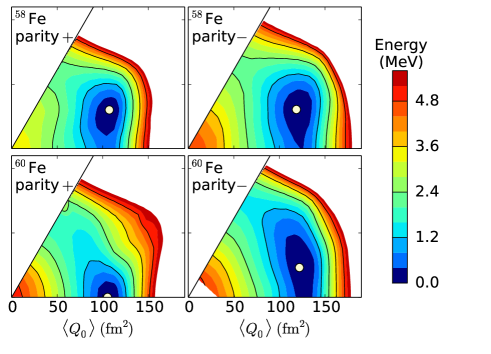
The situation of the even-mass Cr and Fe nuclei is very similar to that of the odd-mass nuclei as seen in Fig. 6. These energy surfaces indicate the dominance of prolate deformation. For the negative-parity states in even-mass nuclei, larger prolate deformations are induced by the excitation of one neutron into the orbit. In 58Fe, triaxiality is developed for both the positive- and negative-parity states as suggested by the -vibrational band Steppenbeck et al. (2012); Cavallaro et al. (1977). In 60Fe, triaxiality is developed for the negative-parity state.
The intrinsic quadrupole moment can also be deduced from the spectroscopic quadrupole moment by assuming the quantum number Bohr and Mottelson (1975) as
| (3) |
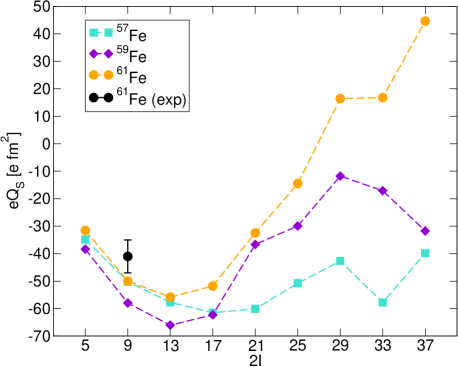
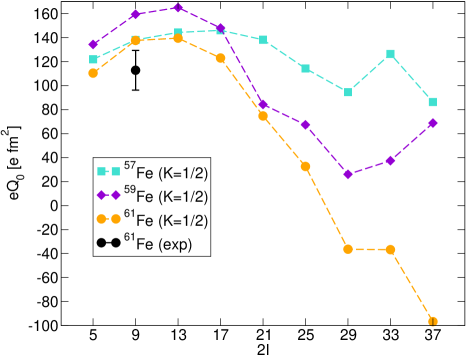
where denotes the spin of the state. is an observable and is also calculated directly by the shell model. We calculate with the effective charges and . The results for the band members starting from are shown in Fig. 7, together with the experimental data for the state in 61Fe Vermeulen et al. (2007). The calculation reasonably reproduces the measured value. It should be noted that the magnetic moment of this state Matea et al. (2004) is also close to the calculated value using the free-nucleon factors.
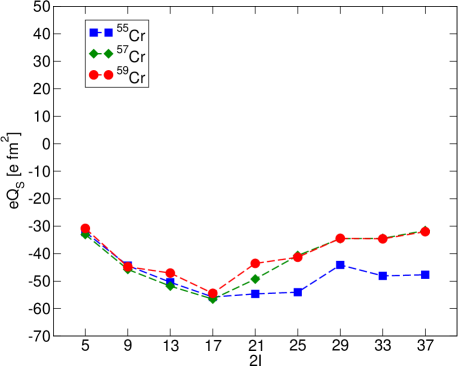
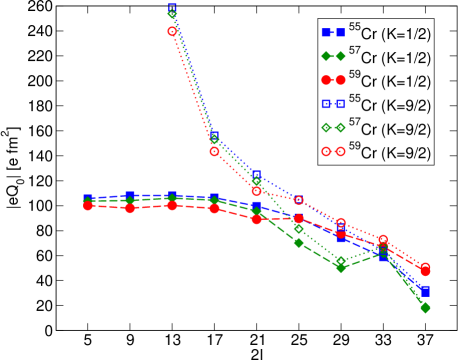
Since is identical among the members of an ideal rotor, the stability of within a band provides a key to determining the intrinsic state. Here, we take the two possibilities of for the band members built on : and correspond to prolate and oblate shapes, respectively. Figure 7 shows the intrinsic quadrupole moment assuming for odd-mass nuclei 55-59Cr and 57-61Fe. As seen in Fig. 7, the value is nearly constant in Cr isotopes, whereas it decreases for high-spin states in Fe isotopes. This decrease might be due to change in shape or number, as suggested by the predicted backbending in the of 61Fe (see Fig. 2). If is assumed, on the other hand, we find a singular behavior of the value for each nucleus: the value is about fm2 in the state and it suddenly transits into the large positive value of about fm2 in the state.
The intrinsic quadrupole moment is also connected to the value Bohr and Mottelson (1975):
| (4) |
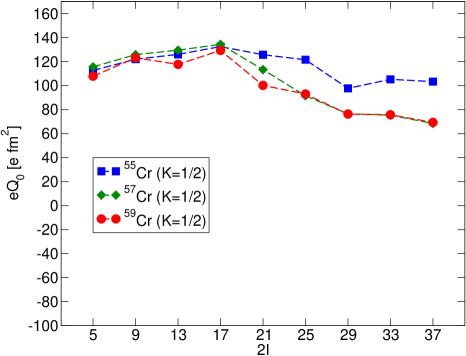
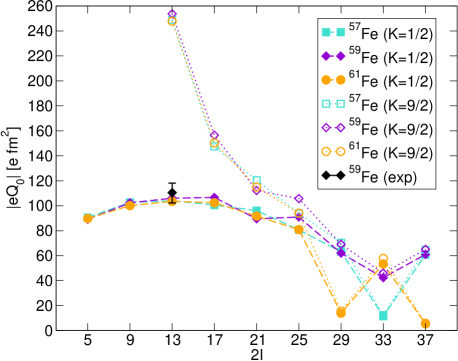
where denotes the Clebsch-Gordan coefficient. Note that the sign of cannot be determined using Eq. (4). We calculate the values with the same effective charges as the ones used for . The lowest panels of Fig. 7 show the absolute values of solved by Eq. (4) under the assumptions of and . The present calculation reproduces the experimental in 59Fe. Similar to , the values lead to much more stable intrinsic quadrupole moments with than with . Although the mixing of the quantum numbers occurs in reality due to the Coriolis effect, the present calculation supports the dominance of rather than and thus prolate deformation for the odd-mass Cr and Fe nuclei studied.
We point out here that the overall prolate deformation in the positive-parity states of 55,57,59Cr and 57,59,61Fe is indeed suggested by the measured energy levels, according to the analysis of the particle-plus-rotor model presented in Ring and Schuck (1980); Stephens (1975). It is quite reasonable to apply the particle-plus-rotor model in which the last neutron occupies the orbit because the states of those nuclei have rather large spectroscopic factors as presented in the next section. The level structure realized by the particle-plus-rotor model strongly depends on the strength of the Coriolis term relative to the term (originating from the Nilsson levels and recoil term), where is the projection of the angular momentum of an orbit onto the symmetry axis. We here consider the case where the orbit is occupied by the last nucleon alone. For oblate deformation having the maximum (), the Coriolis term is less dominant because its matrix element is proportional to . The energy levels then follow the strong-coupling limit of (), where is the moment of inertia. For prolate deformation, on the other hand, the Coriolis term can dominate over the term especially when a high- orbit is involved. The energy levels in this case follow the decoupling limit of , where is the projection of onto the rotation axis. The lowest-lying states take the largest possible . Since symmetry considerations require to be even, favored states with consist of and unfavored states with consist of . As a result, two major differences arise between prolate and oblate shapes. One is that the splitting of the favored and unfavored states is seen only for prolate deformation. The other is that energy spacings in the levels are identical with those of even-even core, , for prolate deformation but are much wider for oblate deformation. Those differences are also obtained from a microscopic calculation using the projected shell model Yang et al. (2011). The observed levels shown in Figs. 2 and 4 clearly support the decoupling limit which is realized for prolate deformation. Oblate deformation is quite unlikely but might not be completely excluded if deformation is small. Measuring unfavored states will provide additional information on shape.
 |
 |
 |
IV Evolution of the orbit
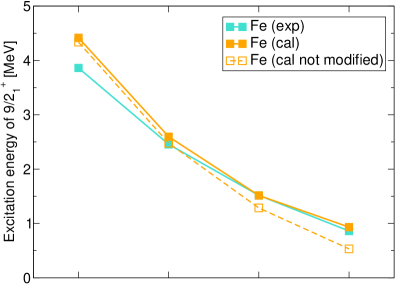
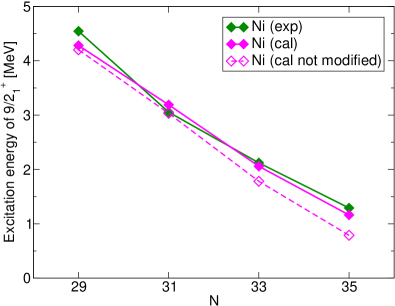
In this section, we examine what causes the sharp drop of the level with increasing neutron number observed in Cr and Fe isotopes. A particular attention is paid to the relation to the evolution of the orbit. For this purpose, we also investigate the levels in Ni isotopes, which should more directly reflect spherical single-particle structure. It is noted that the maximum -scheme dimension reaches for 59Ni.
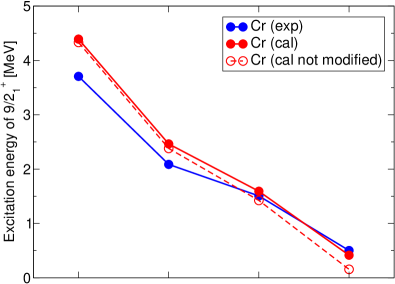
We first confirm the descriptive power of our approach. Figure 8 shows the results of the excitation energy of from to . The sharp drop of is reproduced quite well in the present calculations. Although the evolution of the level is improved, as well as the high-spin levels, by the modification of the Hamiltonian introduced in Sec. II.2, its basic trend is already seen without the modification. Thus, the interaction gives a reasonable evolution of the orbit, if the levels are of single-particle origin. Besides Cr and Fe isotopes, the present calculation also reproduces the systematics of in Ni isotopes. This shows wide applicability of the present Hamiltonian in this mass region.
| () | cal | exp |
| 53Cr | 0.564 | 0.520 Rao et al. (1968), 0.95 Bock et al. (1965), 0.57 Kocher and Haeberli (1972) |
| 55Cr | 0.458 | 0.67 Bock et al. (1965), 0.582 Macgregor and Brown (1972) |
| 57Cr | 0.479 | - |
| 59Cr | 0.498 | - |
| 55Fe | 0.568 | 0.74 Fulmer and McCarthy (1963), 0.465 Maxwell and Parkinson (1964), 0.375 Roussel et al. (1970), |
| 0.67 Karban et al. (1991) | ||
| 57Fe | 0.494 | 0.270 Sen Gupta et al. (1971), 0.447 Thomson (1974) |
| 59Fe | 0.442 | 0.510 McLean et al. (1972), 0.38 Taylor and Cameron (1980) |
| 61Fe | 0.527 | - |
| 57Ni | 0.611 | - |
| 59Ni | 0.580 | 0.84 Chowdhury and Sen Gupta (1973), 0.47 Aymar et al. (1973a), 0.56 Taylor and Cameron (1980), |
| 0.381 Iwamoto et al. (1994), 0.390 Roussel et al. (1970), 0.69 Videbaek et al. (1985) | ||
| 61Ni | 0.503 | 0.62 Cohen et al. (1962), 0.750 Fulmer et al. (1964), 0.8450 Cosman et al. (1967), |
| 0.537 Aymar et al. (1973b) | ||
| 63Ni | 0.446 | 0.61 Fulmer and McCarthy (1963), 0.672 Turkiewicz et al. (1970), 0.75 Anfinsen et al. (1970), |
| 0.75 Huttlin et al. (1974) | ||
| () | cal | exp |
| 53Cr | 0.161 | 0.090 Rao et al. (1968), 0.13 Bock et al. (1965), 0.10 Kocher and Haeberli (1972) |
| 55Cr | 0.142 | 0.225 Bock et al. (1965), 0.145 Macgregor and Brown (1972), 0.17 Taylor and Cameron (1980) |
| 57Cr | 0.148 | - |
| 59Cr | 0.152 | - |
| 55Fe | 0.117 | 0.172 Fulmer and McCarthy (1963), 0.079 Maxwell and Parkinson (1964), 0.13 Kocher and Haeberli (1972), |
| 0.25 Karban et al. (1991) | ||
| 57Fe | 0.120 | 0.110 Sen Gupta et al. (1971), 0.114 Thomson (1974) |
| 59Fe | 0.113 | 0.128 McLean et al. (1972), 0.11 Taylor and Cameron (1980) |
| 61Fe | 0.133 | - |
The single-particle properties of the odd-mass Cr, Fe and Ni isotopes are probed from the spectroscopic factors for neutron transfer reactions. The measured spectroscopic factors are compared to the calculated values in Table 1. While the experimental values scatter in some nuclei, the present calculation well reproduces their systematic behavior: for the states and - for the states. This indicates that these states are the single-particle-like states but that the states are not. Hence, the excitation energy of in these nuclei is influenced directly by the location of the orbit.
 |
|
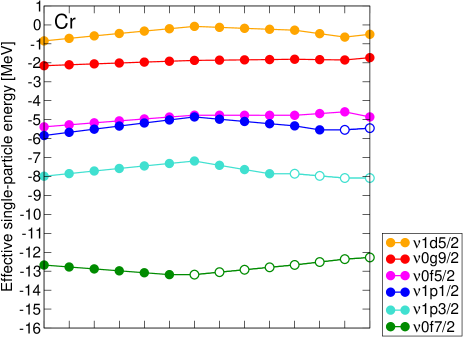
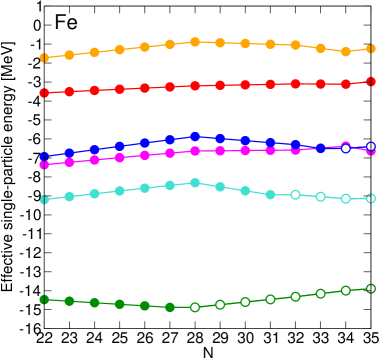
Neutron effective single-particle energies (ESPEs) Storm et al. (1983) in Cr and Fe isotopes are displayed in Fig. 9 using the present Hamiltonian. The ESPEs of are rather constant with increasing neutron number, and so are the shell gaps between the shell and . This indicates that the evolution of the level is explained by the Fermi surface approaching the orbit with increasing neutron number. This is in contrast to the result of a previous shell-model study Kaneko et al. (2008) in which this evolution occurs due to the lowering of the orbit. This lowering was realized in Kaneko et al. (2008) by shifting the monopole interaction between and by MeV. It should be noted that the monopole matrix elements in realistic interactions are in general rather small Otsuka et al. (2010).
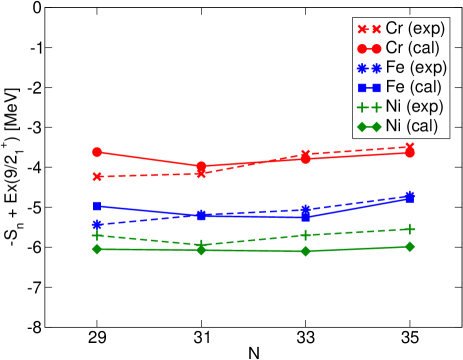
The evolution of the orbit can be probed from experimental energies. Namely, in the independent-particle limit, the single-particle energy is identical with the energy of the state measured from the adjacent even-even core nucleus, . This idea can be extended to deformed single-particle energies. In Fig. 10, the values are compared between the experimental data and the present calculation. The observed stabilities in along the Cr, Fe and Ni isotopic chains suggest that the single-particle energies are kept nearly constant as shown in Fig. 9.
V Conclusions
We have investigated unnatural-parity high-spin states in neutron-rich Cr and Fe isotopes by large-scale shell-model calculations for the model space of -shell + + orbits with the truncation allowing excitation of a neutron. The effective Hamiltonian is composed of GXPF1Br for -shell orbits and a modified for the other parts. The shell-model calculations with the present Hamiltonian can describe and predict the energy levels of both natural- and unnatural-parity states up to the high-spin states in Cr and Fe isotopes with . This shell-model calculation has shown that the states are the lowest positive-parity states in the odd-mass nuclei and the level spacings of the bands built on in the odd-mass nuclei are similar to those of the bands in the neighboring even-mass nuclei.
We have also discussed the deformations of Cr and Fe isotopes by utilizing the -constrained Hartree-Fock calculation with variation after parity projection. This study has indicated that the present Cr and Fe nuclei have the prolate deformations on the whole. In these energy surfaces, the excitation of one neutron into the orbit plays the role of enhancing the prolate deformation. The electric intrinsic quadrupole moments , which are calculated by using the electric spectroscopic quadrupole moments and the values obtained in the shell-model calculation, have supported the prolate deformations of the states in the band built on in odd-mass Cr and Fe nuclei and have indicated that their dominant quantum number is . This situation corresponds to the decoupling limit of the particle-plus-rotor model, which can explain the systematics of the positive-parity level schemes in these Cr and Fe nuclei.
In the present calculation, the effective single-particle energies of in Cr and Fe isotopes are rather constant in the region with , which means very weak attraction between the -shell orbits and orbit as given by . We have shown that this can be confirmed from the one-neutron separation energy () and the excitation energy of (). This result indicates that the sharp drop of the levels in the Cr and Fe nuclei in this mass region is explained by the Fermi surface approaching the orbit with the increase of neutron number.
Acknowledgements.
This work was supported in part by MEXT SPIRE Field 5 “The origin of matter and the universe” and JICFuS. This research partly used the computational resources of the K computer provided by the RIKEN Advanced Institute for Computational Science through the HPCI System Research Project (Project ID:hp130024, hp140210), the FX10 supercomputer at the Information Technology Center at the University of Tokyo, and the computational resources of the RIKEN-CNS joint research project on large-scale nuclear-structure calculations.References
- Huck et al. (1985) A. Huck et al., Phys. Rev. C 31, 2226 (1985).
- Gade et al. (2006) A. Gade et al., Phys. Rev. C 74, 021302(R) (2006).
- Janssens et al. (2002) R. V. F. Janssens et al., Phys. Lett. B 546, 55 (2002).
- Dinca et al. (2005) D.-C. Dinca et al., Phys. Rev. C 71, 041302(R) (2005).
- Chapman et al. (1968) R. Chapman et al., Nucl. Phys. A 119, 305 (1968).
- Bürger et al. (2005) A. Bürger et al., Phys. Lett. B 622, 29 (2005).
- Steppenbeck et al. (2013) D. Steppenbeck et al., Nature 502, 207 (2013).
- Otsuka et al. (2001) T. Otsuka et al., Phys. Rev. Lett. 87, 082502 (2001).
- Honma et al. (2004) M. Honma et al., Phys. Rev. C 69, 034335 (2004).
- Caurier et al. (2005) E. Caurier et al., Rev. Mod. Phys 77, 427 (2005).
- Otsuka et al. (2005) T. Otsuka et al., Phys. Rev. Lett. 95, 232502 (2005).
- Broda et al. (1995) R. Broda et al., Phys. Rev. Lett 74, 868 (1995).
- Ishii et al. (2000) T. Ishii et al., Phys. Rev. Lett 84, 39 (2000).
- Sorlin et al. (2002) O. Sorlin et al., Phys. Rev. Lett 88, 092501 (2002).
- Pritychenko et al. (2012) B. Pritychenko et al., At. Data Nucl. Data Tables 98, 798 (2012).
- Aoi et al. (2009) N. Aoi et al., Phys. Rev. Lett. 102, 012502 (2009).
- Baugher et al. (2012) T. Baugher et al., Phys. Rev. C 86, 011305(R) (2012).
- Crawford et al. (2013) H. L. Crawford et al., Phys. Rev. Lett. 110, 242701 (2013).
- Rother et al. (2011) W. Rother et al., Phys. Rev. Lett. 106, 022502 (2011).
- Kaneko et al. (2008) K. Kaneko et al., Phys. Rev. C 78, 064312 (2008).
- Oba and Matsuo (2008) H. Oba and M. Matsuo, Prog. Theor. Phys. 120, 143 (2008).
- Lenzi et al. (2010) S. M. Lenzi et al., Phys. Rev. C 82, 054301 (2010).
- Gade et al. (2014) A. Gade et al., Phys. Rev. Lett 112, 112503 (2014).
- Warburton et al. (1990) E. K. Warburton et al., Phys. Rev. C 41, 1147 (1990).
- Utsuno et al. (1999) Y. Utsuno et al., Phys. Rev. C 60, 054315 (1999).
- Tsunoda et al. (2014) Y. Tsunoda et al., Phys. Rev. C 89, 031301(R) (2014).
- Appelbe et al. (2003) D. E. Appelbe et al., Phys. Rev. C 67, 034309 (2003).
- Deacon et al. (2005) A. N. Deacon et al., Phys. Lett. B 622, 151 (2005).
- Freeman et al. (2004) S. J. Freeman et al., Phys. Rev. C 69, 064301 (2004).
- Deacon et al. (2007) A. N. Deacon et al., Phys. Rev. C 76, 054303 (2007).
- Hoteling et al. (2008) N. Hoteling et al., Phys. Rev. C 77, 044314 (2008).
- Deacon et al. (2011) A. N. Deacon et al., Phys. Rev. C 83, 064305 (2011).
- Lalazissis et al. (1998) G. A. Lalazissis et al., Nucl. Phys. A 628, 221 (1998).
- Yang et al. (2011) Y.-C. Yang et al., Phys. Lett. B 700, 44 (2011).
- Matea et al. (2004) I. Matea et al., Phys. Rev. Lett. 93, 142503 (2004).
- Vermeulen et al. (2007) N. Vermeulen et al., Phys. Rev. C 75, 051302(R) (2007).
- Zuker et al. (1995) A. P. Zuker et al., Phys. Rev. C 52, R1741 (1995).
- Gloeckner and Lawson (1974) D. H. Gloeckner and R. D. Lawson, Phys. Lett. 53B, 313 (1974).
- (39) T. Mizusaki, N. Shimizu, Y. Utsuno, and M. Honma, private communications.
- (40) N. Shimizu, arXiv:1310.5431.
- Honma et al. (2005) M. Honma et al., Eur. Phys. J. A 25, s01, 499 (2005).
- Honma et al. (2008) M. Honma et al., RIKEN Accelerator Progress Report 41, 32 (2008).
- Otsuka et al. (2010) T. Otsuka et al., Phys. Rev. Lett. 104, 012501 (2010).
- Utsuno et al. (2012) Y. Utsuno et al., Phys. Rev. C 86, 051301(R) (2012).
- Bertsch et al. (1977) G. Bertsch et al., Nucl. Phys. A 284, 399 (1977).
- Brown et al. (1988) B. A. Brown et al., Ann. Phys. 182, 191 (1988).
- Junde (2008) H. Junde, Nucl. Data Sheets 109, 787 (2008), and references therein.
- Bhat (1998) M. R. Bhat, Nucl. Data Sheets 85, 415 (1998), and references therein.
- Baglin (2002) C. M. Baglin, Nucl. Data Sheets 95, 215 (2002), and references therein.
- Bohr and Mottelson (1975) A. Bohr and B. R. Mottelson, Nuclear Structure vol. 2 (1975).
- Zhu et al. (2006) S. Zhu et al., Phys. Rev. C 74, 064315 (2006).
- Steppenbeck et al. (2012) D. Steppenbeck et al., Phys. Rev. C 85, 044316 (2012).
- Junde et al. (2011) H. Junde et al., Nucl. Data Sheets 112, 1513 (2011), and references therein.
- Nesaraja et al. (2010) C. D. Nesaraja et al., Nucl. Data Sheets 111, 897 (2010), and references therein.
- Browne and Tuli (2013) E. Browne and J. K. Tuli, Nucl. Data Sheets 114, 1849 (2013), and references therein.
- Sun et al. (2009) Y. Sun et al., Phys. Rev. C 80, 054306 (2009).
- Ring and Schuck (1980) P. Ring and P. Schuck, The Nuclear Many-Body Problem (1980).
- Stephens (1975) F. S. Stephens, Rev. Mod. Phys. 47, 43 (1975).
- Mizusaki et al. (1999) T. Mizusaki et al., Phys. Rev. C 59, R1846 (1999).
- Shimizu et al. (2012) N. Shimizu et al., Phys. Rev. C 85, 054301 (2012).
- Cavallaro et al. (1977) S. Cavallaro et al., Nucl. Phys. A 293, 125 (1977).
- Junde (2009) H. Junde, Nucl. Data Sheets 110, 2689 (2009), and references therein.
- Bhat (1999) M. R. Bhat, Nucl. Data Sheets 88, 417 (1999), and references therein.
- B. Erjun and H. Junde (2001) B. Erjun and H. Junde, Nucl. Data Sheets 92, 147 (2001), and references therein.
- Rao et al. (1968) M. N. Rao et al., Nucl. Phys. A 121, 1 (1968).
- Bock et al. (1965) R. Bock et al., Nucl. Phys. 72, 273 (1965).
- Kocher and Haeberli (1972) D. C. Kocher and W. Haeberli, Nucl. Phys. A 196, 225 (1972).
- Macgregor and Brown (1972) A. E. Macgregor and G. Brown, Nucl. Phys. A 198, 237 (1972).
- Fulmer and McCarthy (1963) R. H. Fulmer and A. L. McCarthy, Phys. Rev. 131, 2133 (1963).
- Maxwell and Parkinson (1964) J. R. Maxwell and W. C. Parkinson, Phys. Rev. 135, B82 (1964).
- Sen Gupta et al. (1971) H. M. Sen Gupta et al., Nucl. Phys. A 160, 529 (1971).
- Thomson (1974) J. A. Thomson, Nucl. Phys. A 227, 485 (1974).
- McLean et al. (1972) K. C. McLean et al., Nucl. Phys. A 191, 417 (1972).
- Taylor and Cameron (1980) T. Taylor and J. A. Cameron, Nucl. Phys. A 337, 389 (1980).
- Chowdhury and Sen Gupta (1973) M. S. Chowdhury and H. M. Sen Gupta, Nucl. Phys. A 205, 454 (1973).
- Aymar et al. (1973a) J. A. Aymar et al., Nucl. Phys. A 207, 596 (1973a).
- Iwamoto et al. (1994) O. Iwamoto et al., Nucl. Phys. A 576, 387 (1994).
- Cohen et al. (1962) B. L. Cohen et al., Phys. Rev. 126, 698 (1962).
- Fulmer et al. (1964) R. H. Fulmer et al., Phys. Rev. 133, B955 (1964).
- Cosman et al. (1967) E. R. Cosman et al., Phys. Rev. 163, 1134 (1967).
- Aymar et al. (1973b) J. A. Aymar et al., Nucl. Phys. A 213, 125 (1973b).
- Turkiewicz et al. (1970) I. M. Turkiewicz et al., Nucl. Phys. A 143, 641 (1970).
- Anfinsen et al. (1970) T. R. Anfinsen et al., Nucl. Phys. A 157, 561 (1970).
- Huttlin et al. (1974) G. A. Huttlin et al., Nucl. Phys. A 227, 389 (1974).
- Roussel et al. (1970) P. Roussel et al., Nucl. Phys. A 155, 306 (1970).
- Karban et al. (1991) O. Karban et al., Nucl. Phys. A 535, 377 (1991).
- Videbaek et al. (1985) F. Videbaek et al., Nucl. Phys. A 433, 441 (1985).
- Storm et al. (1983) M. H. Storm et al., J. Phys. G: Nucl. Phys. 9, L165 (1983).