The Panchromatic Hubble Andromeda Treasury X. Ultraviolet to Infrared Photometry of 117 Million Equidistant Stars
Abstract
We have measured stellar photometry with the Hubble Space Telescope (HST) Wide Field Camera 3 (WFC3) and Advanced Camera for Surveys (ACS) in near ultraviolet (F275W, F336W), optical (F475W, F814W), and near infrared (F110W, F160W) bands for 117 million resolved stars in M31. As part of the Panchromatic Hubble Andromeda Treasury (PHAT) survey, we measured photometry with simultaneous point spread function fitting across all bands and at all source positions after precise astrometric image alignment (5-10 milliarcsecond accuracy). In the outer disk, the photometry reaches a completeness-limited depth of F475W28, while in the crowded, high surface brightness bulge, the photometry reaches F475W25. We find that simultaneous photometry and optimized measurement parameters significantly increase the detection limit of the lowest resolution filters (WFC3/IR) providing color-magnitude diagrams that are up to 2.5 magnitudes deeper when compared with color-magnitude diagrams from WFC3/IR photometry alone. We present extensive analysis of the data quality including comparisons of luminosity functions and repeat measurements, and we use artificial star tests to quantify photometric completeness, uncertainties and biases. We find that largest sources of systematic error in the photometry are due to spatial variations in the point spread function models and charge transfer efficiency corrections. This stellar catalog is the largest ever produced for equidistant sources, and is publicly available for download by the community.
1. Introduction
The stellar content of galaxies probes fundamental quantities such as the initial mass function, the cluster mass function, the distance scale, stellar evolution, galaxy growth, the history of star formation, and star formation feedback energetics. Resolved stellar photometry for a massive spiral galaxy therefore provides a superb testbed for validating the details of many astrophysical processes.
Interpreting large libraries of Galactic stars is currently challenging due to the uncertain and wide-ranging distances and extinctions. In contrast, M31, the nearest large spiral galaxy to our own, is far enough away that all of the disk stars are at the same distance to within 1%. Furthermore, M31 is the only other galaxy in the Local Group that is similar in mass, morphology, and metallicity to those that host most of the stellar content of the universe (massive disk-dominated galaxies of roughly solar metallicity; Driver et al., 2007; Gallazzi et al., 2008).
1.1. Ground-based M31 Disk Catalogs
Although M31 seems an ideal target for producing a valuable library of stellar photometry, work has historically been inhibited by its large angular size (190′ major axis; de Vaucouleurs et al., 1991). Most ground based studies of M31 that have concentrated on the field star population, on OB associations, or on portions of the halo (Massey et al., 1986; Mould & Kristian, 1986; Pritchet & van den Bergh, 1988; Haiman et al., 1994; Davidge, 1993; Durrell et al., 1994, 2001; Ibata et al., 2001; McConnachie et al., 2009).
Due to the poor angular resolution available, ground-based surveys of the disk are limited to photometry of only the brightest stars. The first resolved star study covering the optical disk was that of Magnier et al. (1992), providing a catalog of 360,000 objects in 4 bands. This catalog has been superseded by Massey et al. (2006), which contains a similar number of stars in 5 bands with improved photometric and astrometric precision and which has led to a census of the brightest and most massive M31 members. This photometry also provided some constraints on the age distribution and star formation rate of the disk (Williams, 2003).
Ground-based halo studies have taken advantage of the very large fields of view available on many telescopes, leading to the discovery of extended density features from accreted smaller galaxies (Ibata et al., 2001; Ferguson et al., 2002). Further ground-based photometry and spectral work showed the halo metallicity gradient and more structure (McConnachie et al., 2009; Gilbert et al., 2012).
1.2. HST M31 Catalogs
Until now, HST imaging has been limited in coverage because of the large angular size of M31; however, even small studies have had significant scientific impact. Studies of the stellar populations in the bulge in the UV (Bertola et al., 1995) resolved hot stars, later found to be post-AGB stars (Brown et al., 2008). Studies of the luminosity function of the field stars in the bulge have also been done in the IR (Stephens et al., 2003).
HST observations of the resolved stellar populations of halo fields provided detailed evidence of its metal-rich nature (Rich et al., 1996), and very deep observations have provided the detailed metallicity and age distribution of a handful of halo pointings (Brown et al., 2003, 2006, 2007, 2008, 2009)
There have been several isolated HST fields in the disk analyzed as well (Sarajedini & Van Duyne, 2001; Williams, 2002; Bellazzini et al., 2003; Ferguson et al., 2005; Brown et al., 2006). These studies have provided insight into how portions of the disk formed, including finding signs for early metal enrichment, a typical age older than 1 Gyr and extended star formation in many of the currently star forming regions. Furthermore, many individual star forming regions in the disk have been observed in detail in the UV (e.g., Bianchi et al., 2012), allowing initial measurements of hierarchical clustering and dispersion timescales of young stars.
Many other HST resolved star studies of M31 have focused on star clusters, measuring metallicities, structural parameters for old clusters (e.g., Holland et al., 1997; Barmby et al., 2000, 2002) and ages for young clusters (Williams & Hodge, 2001a, b), finding many similarities to the Milky Way cluster population, but a larger number of young, massive clusters in M31. Improved catalogs and measurements of star cluster parameters have also been ongoing (Krienke & Hodge, 2008; Barmby et al., 2009; Hodge et al., 2010; Perina et al., 2010; Tanvir et al., 2012; Wang & Ma, 2013; Agar & Barmby, 2013)
All of these studies to date made significant advances in our knowledge of M31, even though they were limited to scattered fields across the disk and halo of M31.
1.3. The Panchromatic Hubble Andromeda Treasury
Given that M31 offers the best opportunity to study the resolved stellar populations of a large spiral galaxy, we carried out the Panchromatic Hubble Andromeda Treasury (PHAT) survey, covering 1/3 of the star-forming disk of M31 in six bands from the near-UV to the near-IR using HST’s imaging cameras. This survey combines the wide field coverage typical of ground-based surveys with the precision of HST observations. The overall survey strategy, initial photometry and data quality assessments were described in detail in Dalcanton et al. (2012a). Our wavelength coverage provides the data necessary to constrain masses, metallicities, and extinctions of individual stars, from which we can infer the spatially-resolved metallicity, age, and extinction distributions over a very large contiguous area.
The PHAT survey has been instrumental in several M31 discoveries already. These include improved constraints on post-AGB and AGB-manqu evolutionary phases (Rosenfield et al., 2012), tracing the stellar mass distribution of the inner M31 halo (Williams et al., 2012), new techniques for measuring robust ages and masses of star clusters (Beerman et al., 2012) and for measuring the initial mass function from resolved stellar photometry (Weisz et al., 2013), a major increase in the number of cataloged star clusters in M31 (Johnson et al., 2012; Fouesneau et al., 2014), evidence for a metallicity ceiling for Carbon stars (Boyer et al., 2013), and additional complexity in the structural components of M31 (Dorman et al., 2013). These results were based on our first generation of photometry, where measurements were made for each camera separately, and then combined at the catalog level.
In this paper, we report on our second generation of photometric measurements of the resolved stars in the PHAT imaging, in which we take advantage of all available information by carrying out photometry simultaneously in all 6 filters. This new approach gives a significant increase in the depth and accuracy of our photometry over that presented in Dalcanton et al. (2012a). Section 2 describes our technique for performing and merging simultaneous 6-filter photometry, fitting data from 3 HST cameras with different point spread functions (PSFs), distortion corrections, and pixel scales. Section 3 details the resulting color-magnitude diagrams (CMDs). Section 4 discusses contamination from non-M31 sources. Section 5 gives the detailed analysis of the quality of the photometry, including a full assessment of random and systematic uncertainties. Section 6 compares this generation of PHAT photometry to the previous version. Section 7 describes individual fields whose photometry may differ from that of the survey in general. Section 8 describes the available data products. Finally, Section 9 provides a summary of our work.
2. Data
2.1. Survey Overview
The data for the PHAT survey were obtained from July 12, 2010 to October 12, 2013 using the Advanced Camera for Surveys (ACS) Wide Field Channel (WFC), the Wide Field Camera 3 (WFC3) IR (infrared) channel, and the WFC3 UVIS (Ultraviolet-Optical) channel. The observing strategy is described in detail in Dalcanton et al. (2012a). In brief, we performed 414 2-orbit visits. Each visit was matched by another visit with the telescope rotated at 180 degrees, so that each location in the survey footprint was covered by the WFC3/IR, WFC3/UVIS, and ACS/WFC cameras. The different orientations were schedulable 6 months apart from one another, so that the WFC3 data and ACS observations of each region were separated by 6 months. A list of the target names, observing dates, coordinates, orientations, instruments, exposure times, and filters is given in Table 1. We note that each field includes a short (20 sec) exposure in F475W and F814W to avoid saturation of the brightest stars. In total, the area covered by all 6 filters is 0.5 deg2.
The survey was designed around the camera with the smallest footprint, the WFC3/IR. Thus the tiling is most easily navigated by plotting the WFC3/IR footprints, as shown in the F160W exposure map in Figure 2. The area plotted in Figure 2 corresponds to a single rectangle in Figure 1. The ACS/WFC and WFC3/UVIS exposure maps are shown in Figure 3. This tiling was necessarily much more complex to maximize the contiguous WFC3/IR coverage and make the most efficient use of the ACS parallels.
Each survey region is described by two identifiers, a “brick” number and a “field” number. “Bricks” are rectangular areas of 6 that correspond to a 36 array of WFC3/IR footprints. The bricks are numbered, 1-23, starting from the brick at the nucleus, and counting west to east, south to north. Odd numbered bricks move out along M31’s major axis, and even numbered bricks follow the eastern side of the odd-numbered bricks, as shown in Figure 1. Within each of the 23 bricks, there are 18 “fields” that each correspond to an IR footprint. These fields are numbered, 1-18, from the northeast corner, counting east to west, north to south (see Figure 2). Thus, Brick 23-Field 18 is the IR footprint in the southwest corner of the brick farthest out along the major axis. Each pointing has its own unique brick, field number. Images in other cameras are labeled by the brick and field of the IR footprint they primarily overlap (e.g., M31-B01-F13-ACS overlaps M31-B01-F13-IR even though it was taken in parallel during the primary observations of M31-B01-F16-IR).
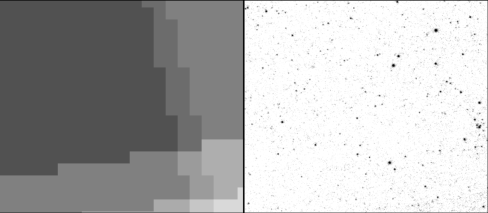
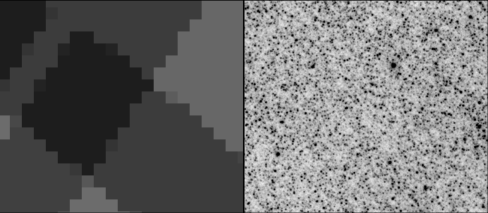
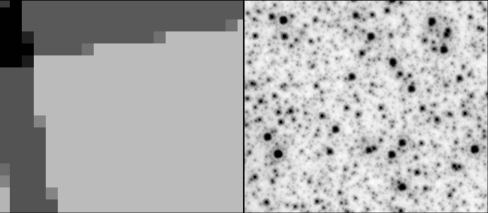
Although the neighboring fields overlap significantly in ACS and UVIS, for the purposes of this generation of photometry, we were not able to take advantage of this extra exposure due to computational limitations. Including all exposures that overlap a location in our survey requires putting more than 200 CCD reads into memory and slows down the measurements, requiring a large amount of processing time on expensive high-memory machines. Therefore, when carrying out the 6-filter photometry for each survey brick+field, we included only the UVIS, ACS, and IR data specifically pointed at that brick+field. The effective exposure for each field as measured is shown in Figure 4. Note that the single-field data leaves the chip gap in ACS uncovered; we discuss how these areas were treated in Section 2.4. The Figure also shows the other exposures in the survey that could be included in the photometry of this single field. For our next generation of photometry, the computing power should be available to include all overlapping exposures when measuring photometry of each field, which will improve the depth and homogeneity of the photometry.
2.2. Astrometry
To measure stars in all 6 bands, our first challenge was to align all of our data to a relative precision of 0.1 ACS pixel (5 milliarcseconds). We aligned the images based on preliminary star catalogs using initial photometry performed on each individual CCD readout to generate initial positions of stars for each CCD of each exposure. These catalogs were then cross-correlated to solve for the relative astrometry of each CCD of each exposure in each brick. We now describe the process in detail.
We first cleaned the images of cosmic rays (CRs) to avoid them being mistakenly matched and hindering alignment. The flt images as initially downloaded from MAST at the time did not have well-determined CRs, partially due to our observing strategy, which had only 2 exposures per band in UVIS and a very wide range of exposure times in ACS. Therefore, we performed out own CR flagging with the PyRAF task astrodrizzle (Gonzaga, 2012), which identifies CRs by finding pixels that are bright in one exposure and not in the other exposures in the same band. The CRs were identified and flagged in the DQ extensions of the flt images. We note that the MAST data reduction pipeline is always improving, so that future downloads may not require this extra step for reliable CR flagging.
We used the point spread function photometry package DOLPHOT — an updated version of HSTPHOT (Dolphin, 2000) — to find and measure the positions of stars on each CCD of each exposure of the survey. These positions provide the basis for astrometric alignment. The DOLPHOT task acsmask or wfc3mask updates the images into units of counts per pixel appropriate for DOLPHOT photometry. This task applies the data quality (DQ) flags as well as the pixel area map to the flt science (SCI) extensions to mask out bad pixels and CRs, and calibrates the flux in each pixel by the area coverage on the sky. The flt images were then split into their individual CCDs using the DOLPHOT task splitgroups. These single-CCD DOLPHOT catalogs were culled for artifacts using the same criteria as those used for the single-camera photometry in Dalcanton et al. (2012a).
For the UVIS and short ACS exposures, in some cases there were fewer than 10 stars for determining alignment. For several of these cases, we found that alignment solutions were not acceptable when we measured star positions on the flat-fielded (flt) images. However, we circumvented this problem in many cases by measuring star positions on charge transfer efficiency (CTE)-corrected (flc) images in cases where convergence was not reached from the positions measured on the flt images. Thus, we found that the CTE-corrected images produce more reliable centroids than the flt images, showing the high-quality of the on-image CTE-correction algorithm (Anderson & Bedin, 2010). However, there were still some exposures that were not able to be aligned due to the low density of detected point sources (see Section7).
Using the single-CCD catalogs, astrometric alignment was performed as follows. We first aligned the ACS catalogs with exposure times seconds with each other and with a deep CFHT i-band image (which was in turn calibrated to 2MASS). The alignment proceeds by assuming the input astrometry is roughly correct and then performing an astrometric cross-match between each pair of ACS images and each ACS image to the CFHT reference catalog. We align the brightest stars in each sample to reduce the computational cost and to reduce the impact of measurement error in fainter stars. Each matching provides a set of astrometric offsets, some of which are correct and some of which are due to spurious matches, or matches to neighboring stars. We fit these offsets as a mixture of a flat background (for spurious matches) and a Gaussian (for correct matches), using a coarse histogram to initialize an Expectation-Maximization method. The result allows us to weight each matched star by its probability of being drawn from the foreground distribution. We then solve the large least-squares problem to find astrometric shifts and affine transforms (rotations, scalings, and shears) of each input catalog to minimize the matching residuals. We repeat this process several times, using a decreasing matching radius and including an increasing number of fainter stars. After having aligned the long ACS exposures with each other and the reference frame in this way, we repeat this process, aligning the short ACS exposures and the WFC3 IR and UVIS exposures to the ACS reference.
The result of these alignment processes is a set of scripts that update the FITS WCS astrometric headers of the input images, including all affine geometric transformations. We applied the image header update scripts to their respective flt images as originally downloaded from STScI and processed by OPUS 2012_4. We then combined images with updated astrometry to produce images of each brick in each band, using the PyRAF task astrodrizzle with the following altered parameters: context=True, build=True, skysub=False, final_wcs=True, final_rot=0.0, clean=True. These brickwide astrodrizzled images are available from the Space Telescope Science Institute through the high-level science products archive.
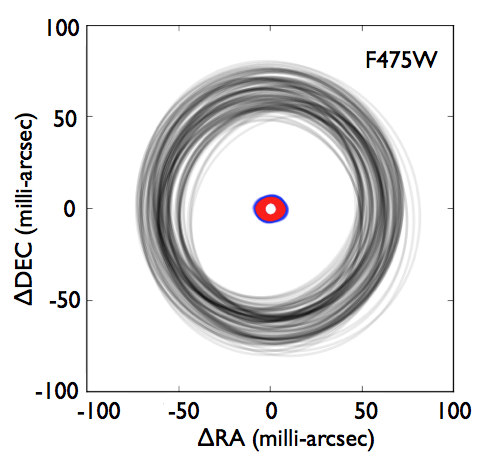
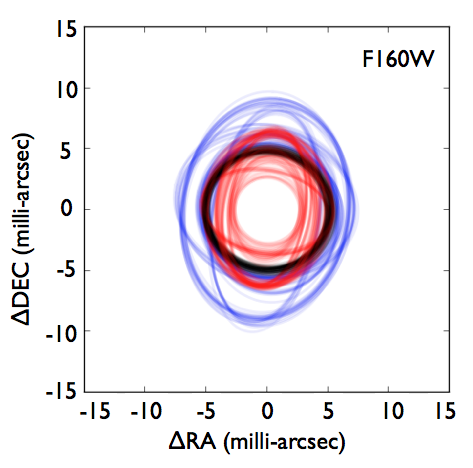
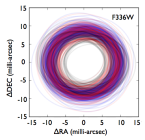
A zoomed example of a small (17) region with many overlaps in all 3 cameras is shown in Figure 5, which reveals the seamless nature of our stacked, aligned data. More quantitative alignment checks are shown in Figure 6, where the first 3 panels show error ellipses are plotted for each individual CCD read compared to the reference frame (gray), to other CCD reads in the same filter (red), and compared to CCD reads in other filters (blue). These one-sigma error ellipses were measured via expectation-maximization of a model of all star-to-star matches between each pair of exposures. The alignment uncertainties were typically 0.01′′ between different HST images in all cameras. The reference frame is the ground-based global astrometric reference for F475W, and the F475W images provide the reference frame for the other bands. The uncertainties on the alignment between the F475W and the reference frame are the largest (though still 0.05′′).
The resulting images were carefully checked by eye to look for any problems with alignments within each field and across overlaps with neighboring fields. These brickwide images are also publicly released in the Mikulski Archive at Space Telescope (MAST) High Level Science Products (HLSP).
2.3. Data Processing
After updating the original flt images with new astrometry, the images were passed through our multicamera photometry pipeline, which consists of several pre-processing steps, the run of DOLPHOT, and several post-processing steps to check quality and produce easy-to-use data products. We now describe the steps in detail.
2.3.1 Running DOLPHOT
The preprocessing divides the data into different groups determined by their respective brick+field locations. Data from each brick+field were processed separately (see left panel of Figure 4). This stack contains 31 CCD reads. There are 9 ACS exposures (2 CCDs per exposure), 5 IR exposures (1 CCD per exposure), and 4 UVIS exposures (2 CCDs per exposure). Thus, there were 18 separate groups of 31 CCD reads for each brick. The entire processing pipeline was run independently for each of these 18 groups.
Within each group, all of the preprocessing of the individual images was carried out in the same manner as when preparing them for individual photometry (see previous subsection), but with improved alignment. The identification of CRs was also more reliable because prior to our astrometry updates, misaligned stars were sometimes identified as CRs.
DOLPHOT uses a reference image as the astrometric standard. It ties each detection to a location on the reference image. We used the stacked, distortion-corrected F475W image as this reference because it offers the best combination of depth, completeness, and resolution. To generate the F475W reference image, the F475W astrodrizzle output was also processed with acsmask, calcsky, and splitgroups in order to be used as the DOLPHOT reference image.
As described in Dalcanton et al. (2012a), the package DOLPHOT was used for all of the photometry for the PHAT survey. However, the quality of the photometry output from DOLPHOT is strongly dependent on the appropriateness of the parameters set by the user. In particular, the precision and completeness of photometry in very crowded fields—like those in the PHAT survey—can be strongly affected by the technique DOLPHOT uses to measure the local sky and the size of the aperture used for determining PSF offsets.
To optimize our photometry, we performed a grid of test runs of DOLPHOT on several select fields using a variety of DOLPHOT parameters. The parameters we varied were RAper, RChi, FitSky, and PSFPhot which control the radius inside of which aperture photometry is compared with PSF-fitting, the radius inside of which the quality of the PSF fit is assessed, the method for measuring the background level for each star, and the weighting during PSF fitting, respectively. Ranges of the parameters were 2–8, 1.5–8, 1–3, and 1–2 for each of the four parameters, respectively. One thousand artificial stars were inserted at each of 2–3 CMD locations roughly corresponding to the main sequence (UVIS and ACS only), the RGB (ACS and IR only), and 1 mag above the S/N cutoff in both filters (all 3 cameras). All of our photometry uses the Anderson (ACS ISR 2006-01) PSF library.
To assess the quality of each set of test parameters, we calculated the number of detected sources (all 3 cameras), the red clump tightness (ACS only), and the RGB width (IR only) as measured from the output photometry for all combinations of processing parameters. We also assessed the artificial star completeness, bias, and scatter (all 3 cameras) as measured from the artificial star tests performed on the test fields for each set of test parameters.
Based on these metrics, the best photometry resulted from small apertures, standard PSF photometric weighting, and measuring the sky immediately outside the photometry aperture (but within the PSF). This requires adjusting the PSF for the fact that sky is being measured in a region where the star itself contributes. These parameters were clearly superior in the most crowded regions, and were at least as good as other parameter combinations in uncrowded regions, where the sensitivity to parameter choices is much less. Our final DOLPHOT processing parameters are given in Table 2.
We note that while CTE correction was turned on (UseCTE=1), CTE corrections were only made for the ACS bands (F475W and F814W) because when we began our photometry no CTE corrections were available for WFC3. In the next generation of photometry, we plan to run our measurements on CTE-corrected images, and turn the DOLPHOT CTE corrections off, which may further improve the level of systematic errors in our photometry.
We were able to improve the results from DOLPHOT by fixing the ref2img parameters, which control the distortion terms for the aligning images. To optimize cross-camera alignment, DOLPHOT uses the many stars in the image stack to refine the distortion solution for each camera. If these parameters were allowed to be freely fitted for all individual fields, sometimes relatively empty short exposures or UV exposures could throw off the solution. Thus, using a few fields from Brick 21, where the crowding is low, and the density of UV-bright stars is relatively high, we measured the ref2img values that provided the best image alignment. This DOLPHOT parameter provides minor changes to the IDCTAB specified distortions, which yield the best fit for our data, but because we did not include the overlaps at different cross-camera orientations from the standard PHAT observation strategy, our precise terms would likely not be relevant for other HST observing programs.
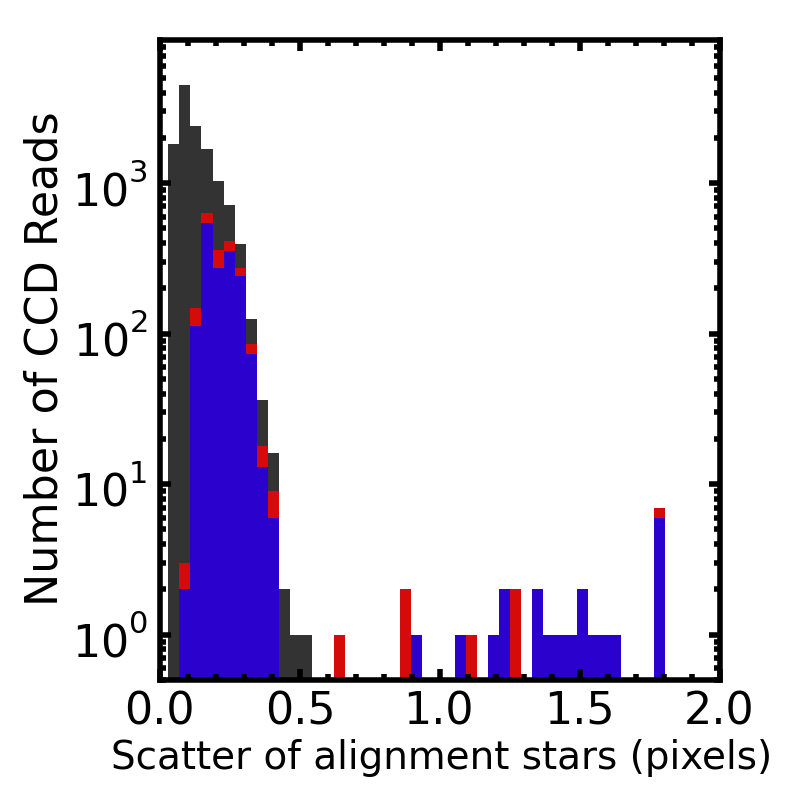
We fixed the ref2img values measured in Brick 21 for the rest of the survey data, which resulted in excellent alignment across the survey. DOLPHOT measures the precision by which the images of the input stack are aligned with the reference image. Our median astrometric precision is 5 milliarcseconds. In the lower-right panel of Figure 6, we provide the histogram of alignment values from DOLPHOT, in units of pixels, for all of the CCD chip readouts for the entire survey, showing 99.8% of all of the survey images are aligned to 0.5 pixels or better. The median value is 0.11 ACS pixels, or 5 milliarcseconds. The small tail of CCD reads with poor alignment are a small fraction of the very short exposure (10–15 s) ACS images in regions with few bright stars, and a few UVIS exposures in regions along the NE edge of the survey with little or no young stars to align the image. These few images are essentially pure noise, and therefore contribute very little to any of our photometry measurements. Because few, if any, stars are detected in these exposures, they are not included in the vast majority of combined photometry measurements. In cases where a noise spike is measured in the very short optical exposures (i.e. any star not saturated in the long exposures), that measurement will be weighted at 0.006 (0.6%, the fraction of the exposure time in these frames), making its effects on the resulting photometry at most 0.6%. These fields are described in more detail, along the other fields that have data issues, in § 7.
When DOLPHOT is run on a collection of images, all of the individual CCDs are aligned to the reference image in memory, stacked to search for any significant peaks, and then each significant peak above the background level is fitted with the point spread function for the specific band, and camera of each CCD in the stack. The measurements are corrected for charge transfer efficiency (CTE, ACS only) and calibrated to infinite aperture. The measurements are then combined into a final measurement of the photometry of the star. The final measurements include a combined value for all data in each band for the count rate, rate error, VEGA magnitude and error, background, of the PSF fit, sharpness, roundness, crowding, and signal-to-noise.
VEGA magnitudes apply the encircled energy corrections and zero points from the ACS handbook dated 15-July-2008 and the WFC3 encircled energy corrections and zero points from 2010 by J. Kalirai. The rate and rate error measurements are particularly useful for stars that were not detected in one or more bands (and therefore have negative rates or rates of 0, which results in an undefined magnitude), as they provide upper-limits in these bands that can be employed for constraints when fitting spectral energy distributions. The sharpness is zero for a perfectly-fit star, positive for a star that is too sharp (perhaps a cosmic ray), and negative for a star that is too broad (perhaps a blend, cluster, or galaxy). The crowding parameter is in magnitudes, and tells how much brighter the star would have been measured had nearby stars not been fit simultaneously. For an isolated star, the value is zero. These measurements are also output for each individual exposure, allowing for the possibility of variability studies (Wagner-Kaiser et al., in prep.) or searches for artifacts not masked by our preprocessing techniques. All measurements are output to a “.phot” ascii file.
2.3.2 Creation of Photometry Catalogs
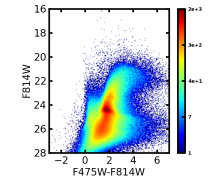
The star positions from DOLPHOT are then converted to RA and Dec using the header of the reference image (see above) for astrometry. RA and Dec are then added to the phot catalog, and the full photometric catalog (481 columns) is placed into a tagged FITS table (.phot.fits file). The data are then culled to include only the combined output for sources, significantly reducing the size of the data files for those not interested in the measurements on the individual CCD chips. At this step, we also kept only sources with S/N4 and reasonable sharpness (see Table 3) in at least one band (“ST” catalogs) to limit the number of noise spikes, CRs, and artifacts surrounding saturated stars in our catalogs. This initial cut removed up to 20% of the objects from the initial DOLPHOT output, mostly very low signal-to-noise with some scattered brighter measurements. An example CMD of the culled objects is shown in the right side panel of Figure 7, and it shows no overdensities associated with typical CMD features. Thus, users looking for a specific source may find it in the pre-culled phot.fits files, if it is not contained in the ST files; however, any measurement not included in the ST files should only be used with extreme caution.
The sources in the ST catalog are then flagged so that any band with measurements of high crowding or high square of the sharpness (see Table 3) or that have S/N4 can be easily left out of any analysis, resulting in the “GST” sample. The flagged measurements are likely to be unreliable (strongly affected by blending, CRs, or instrument artifacts). The key difference between all measurements in the ST catalogs and the subset that pass our GST criteria is that the GST criteria are performed per band. For example, if a star is well-measured in F275W, F336W, F475W, F814W, and F110W it may not be well-measured in F160W. Measurements in all six bands for the star will appear in the catalog, but its F160W measurement will have a GST flag of 0. A further difference between the full catalog measurements and those with the GST flag is the use of crowding as a quality metric. Crowding is one of the quality metrics considered when determining which bands pass the GST flag criteria for each star; however, crowding is not considered at all for inclusion in ST the catalog.
The precise values of sharpness and crowding used for cutting were different for the UV, optical, and IR, and are provided in Table 3. We used both qualitative and quantitative criteria to determine the photometric quality cuts that maximize the quality of the stellar CMDs (e.g., number of stars, photometric depth, tightness of features) and minimize the number of non-stellar objects (e.g., blends, background galaxies, cosmic rays). We accomplished this by a combination of visual inspection and fitting particular CMDs, which we now describe.
For each permutation of DOLPHOT input parameters (raper, rchi, fit sky psfphot), we constructed 140 per-camera CMDs for various permutations of sharpness and crowding. For each CMD, we calculated or visually inspected the following factors: CMD depth for a fixed SNR4, number of stars that passed the photometric cuts, quality of maximum likelihood fits of a Gaussian plus line model to the color and luminosity profile of the RC (only for the ACS and IR CMDs), and the CMD of rejected objects. In addition, we also considered the completeness fraction and color/magnitude biases from sets of artificial star tests (ASTs). Specifically, for each CMD, we inserted 1000 ASTs 1 magnitude above the S/N limit, 1000 on the upper MS, and 1000 on the upper RGB. We computed the recovered fraction (i.e., completeness) and mean magnitude and color biases for each set of 1000 ASTs.
Using all of the above criteria, we found that the majority of photometric quality cut combinations produced CMDs that were clearly not ideal (e.g., poor completeness, obvious stellar features on the rejected CMDs, poor fits to the RC). We readily eliminated these permutations and focused on the small subset that produced deep CMDs with clear features. To distinguish among these, we primarily considered the completeness fraction and magnitude and color spreads of the AST sets. We also visually compared high S/N regions of the various CMDs for tightness of the luminous CMD features (e.g., upper MS), and eliminated those that rejected a higher percentage of high S/N objects that had colors and magnitudes consistent with known stellar sequences (e.g., MS, HeB sequence). Based on this iterative process, we found the parameters listed in Table 3 provided for the best overall CMDs. We note that these cuts were chosen to provide an approximate set of values for obtaining high-quality CMDs from our catalogs over the entire survey. Those using our photometry for specific projects will likely want to determine their own flags optimized for their science needs.
2.4. Merging Catalogs
The final ST photometry catalogs for the individual fields are then combined into brick-wide catalogs, and then into a survey-wide catalog. To avoid duplicate catalog entries, for each brick we generated a grid in RA and Dec with single-point corners inside the IR footprint corners of the survey, creating unique regions and trimming the IR detector edges simultaneously. Then the catalog of each field of the grid was cut to include only detections inside of that field region as defined by the grid. These cut catalogs were then combined into a initial brickwide catalogs with no duplicate entries and no gaps in UVIS or IR coverage.
Because ACS exposures from neighboring fields are not included in the DOLPHOT photometry measurements of an individual field, the ACS chip gap contains no optical coverage (the UVIS chip gap was covered by dithers). Thus, the initial brickwide catalogs had only UV and IR measurements for stars in the ACS chip gap. However, the catalogs for the neighboring fields contain optical measurements at these locations. Within the chip gaps, we include ACS measurements from neighboring fields: for example, the top half of the chip gap in Field 1 is has optical measurements in the catalog for Field 2 (the field to the right), while the bottom half has optical measurements in the catalog for Field 7 (the field below). The resulting final brick-wide catalogs have full 6-band coverage throughout, although the photometry in the chip gap has matching that was performed at the catalog level. Therefore, in the ACS chip gaps, the UVIS and IR photometry will be of different quality due to the lack of ACS data in that region when the image stack was being reduced (see Section 6). To allow investigators to efficiently leave out the chip gaps if they would like to avoid these non-uniform measurements, we have included an inside_chipgap flag in our catalogs, which is set to 1 for all stars that were affected by this catalog-level merging.
We defined brick edges in the same way as field edges, with single corner points. Then we trimmed the brickwide catalogs to contain only stars within these single corner points. Once trimmed in this way, the catalogs could be merged to produce a single catalog for the entire survey with no duplicate entries and no gaps in 6-band coverage. We note the only gap to be the 0.1 arcmin2 area that we did not observe due to changes in the observing program that were necessary to have guide stars for all observations (see Section 7.3 for details).
The number of stars in each 6-band brick catalog is given in Table 4, where the total number of ST stars measured in each brick is given along with the number of reliable (high signal-to-noise, low crowding) GST measurements in each band. The entire generation 2 catalog has 116,861,772 stars. Each one of these was measured in at least 16 exposures (ignoring overlaps between fields and the very short ACS exposures), making 1,869,788,352 photometric measurements. In cases where the star was not detected in a given band, the rate and rate_error, measured based on the sky level, can be used as a constraint for a non-detection, which is recorded as a 99.999 in the magnitude column. The full catalog is available in machine readable format on Vizier. The individual brick catalogs are available in FITS format from MAST.111http://archive.stsci.edu/missions/hlsp/phat/ A small example of the catalog is provided in Table 5.
It is clear from Table 4 that no band has good measurements of all 117 million stars, but each of the 117 million stars has a good measurement in at least one band. The most extreme cases of this are in the UV, where only 0.3% of the total 2nd generation catalog has reliable measurements (other than upper-limits) for both the F275W and F336W bands. A very high percentage of these UV measurements are actually full 6-band measurements.
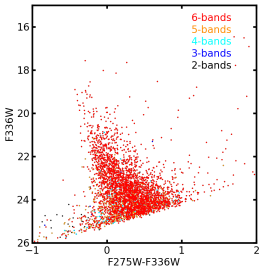
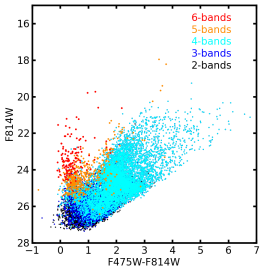
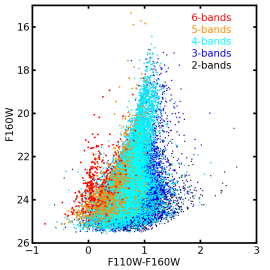
In Figure 8 we plot UV, Optical, and IR CMDs of a small random sample from our catalog, with the points color-coded by the total number of bands with reliable measurements. The UV CMD shows that nearly every data point corresponds to a star with reliable measurements in all 6 bands. The optical CMD shows that a high fraction of RGB stars are detected in 4 bands (the optical and IR bands), and only the brightest main-sequence stars tend to be detected in 6 bands. The IR CMD shows again that most RGB stars are measured in 4 bands (optical and IR) while only the brightest main sequence stars are measured in the UV. Taken together, these results show that only faint blue stars tend to have good measurements in fewer than 4 bands. UV-bright stars tend to have good IR measurements, but IR-bright stars do not tend to have good UV measurements. Both tend to have good optical measurements, given that the ACS data have the greatest depth in terms of CMD features; however, the reddest RGB stars are only detected in the IR.
3. CMDs
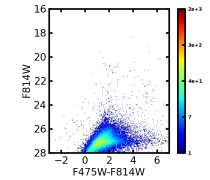
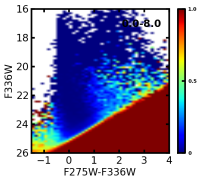
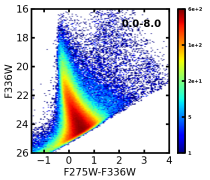
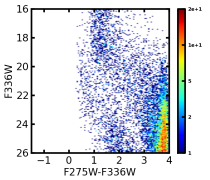
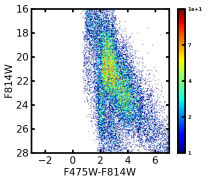
We show the UV photometry for the entire survey in the CMDs in Figure 9. The UV photometry had roughly equal depth throughout the survey because it had constant, low crowding everywhere due to its not being deep enough to include the very numerous RGB stars, which are very faint in the UV. Thus, only for the UV do we show the entire survey on a single CMD. The figure shows the CMD before our quality cuts, the fraction of sources that pass our quality cuts as a function of color and magnitude, and the CMD after our quality cuts. Stars that survive the cuts but fall in regions where large fractions of the stars were rejected have a higher probability of being poor measurements.
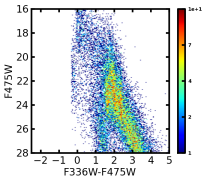
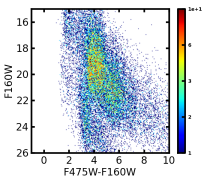
Because of the high density of RGB stars in M31, the depth of our optical and IR photometry varied greatly with position in the galaxy. We therefore have produced 6 color-magnitude diagrams in each of 4 filter combinations, following the spatial distribution shown in Figure 10. These densities are relative logarithmic star number densities taken from a model distribution. They were used only to provide a reasonable division of the catalog into regions with similar photometric depths. The areal coverage of each stellar density range is different, with 770, 481, 349, 113, 106, and 31 arcmin2 for the 0.0–0.3, 0.3–0.6, 0.6–1.2, 1.2–1.8, 1.8–3.0 and 3.0–8.0 regions, respectively. In figures 11-18, we show the fraction of measurements that pass our quality cuts, and the CMDs after quality cuts in each of these filter combinations at each of these densities.
Apart from the familiar features like the RGB and main sequence, these CMDs reveal several detailed features that have been already commented on in Dalcanton et al. (2012a, Figure 20), but which appear somewhat more clearly in the present photometry, such as the sharp drop in star counts at the tip of the RGB at F814W20 or F160W18, and spanning a broad range of colors, the red clump at F814W24 or F160W23.5. Other features appear that are associated with the red clump, such as the extension to red colors caused by differential extinction, the half-magnitude extension to fainter magnitudes caused by the secondary red clump (Girardi, 1999), and a more subtle extension to bluer colors and fainter F814W magnitudes caused by horizontal branch stars (Williams et al., 2012). In addition, there is a clear concentration of stars at the early-AGB about 1.5 mag above the red clump. Younger helium burning stars draw more feeble and less-defined sequences towards brighter magnitudes, but their upper part is clearly seen at F814W20, F475W-F814W3. Finally, the UV CMDs of the bulge region (e.g., Figure 12, bottom-right panel) reveal the unusual sequences of hot horizontal branch and post asymptotic giant branch stars and their progeny (Rosenfield et al., 2012), while the NIR CMDs reveal a plume of TP-AGB stars departing from the TRGB towards brighter magnitudes.
4. Milky Way and Background Galaxy Contamination
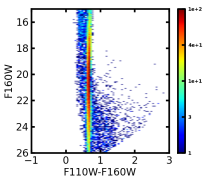
Figures 9-18 also contain contributions from foreground MW stars. We plot the CMDs for the model foreground in Figure 19. The foreground stars draw nearly-vertical sequences at colors 1F275W-F336W3, 0F336W-F475W2, 1F475W-F814W4, 1.5F475W-F160W5, and 0.4F110W-F160W0.8. These features are expected given that the PHAT survey covers 0.5 deg2. For example, the vertical feature at 0.4F110W-F160W0.8 corresponds to the locus of nearby dwarfs, of masses 0.3–0.5 M⊙. Due to their low effective temperatures, these stars develop marked water vapor features in their near-infrared spectra and hence accumulate at those NIR colors (e.g., Allard et al., 2000).
Because the higher density regions cover less area and the foreground contamination has constant density on the sky, the foreground features are less pronounced in the higher density region CMDs. We ran a simulation of the Girardi et al. (2005, 2012) model of the stellar population of the Milky Way at the location of M31. The model returns 23000 stars down in the range 15I27 in a 0.5 deg2 region. This total is likely an upper-limit as the models are not well constrained at the faint end, and other models (such as Robin et al., 2003) predict far fewer. Thus, the foreground contamination in our catalog is expected to be an inconsequential percentage (0.02%).
Although the percentage is low, the foreground stars occupy regions of color-magnitude space that could overlap with interesting and sparsely-populated features for M31 stars. In general, the bright portion of our CMDs, where the young He-burning stars and bright AGB stars in M31 lie, also contain MW foreground.
In addition to foreground stars, we would expect some contamination from background galaxies; however, most of these are flagged by our sharpness cut. Our previous work has found a background contamination density in the optical bands of 60 arcmin-2 (Dalcanton et al., 2009). As our deepest bands are the same bands and are of comparable depth to Dalcanton et al. (2009), we expect our background galaxy contamination density to be similar. This density suggests 105 background galaxies in the survey after our sharpness and crowding cuts, still 1% of the total number of stars.
5. Data Quality
We consider a number of tests to characterize photometric quality of the data. These include: (1) recovery of artificial stars, (2) comparing repeated measurements of stars in overlapping data, and (3) stability of CMD features at fixed magnitude across the survey. We now discuss each of these tests in turn.
5.1. Random Uncertainties, Biases, and Completeness
We first measured the precision and completeness of our photometry in each band with a series of artificial star tests in each field. To cover the most relevant portions of the 6-band space, we produced 50,000 spectral energy distributions (SEDs) in our 6 bands covering a grid of Kurucz (1979) model spectra, applying our assumed M31 distance, and applying a random extinction to each model of 02. We only included model stars that had magnitudes 1 mag below our limiting magnitude in at least one band. These 50,000 model SEDs were then assigned random positions within each of 6 fields that covered the full range of red giant branch stellar densities in our data (i.e., corresponding to the range of densities sampled in the Hess diagrams in Figures 12-18), but with higher sampling where the crowding increases most dramatically. In each of the six chosen fields (each covering one-eighteenth of a brick), the artificial stars were added to the entire stack of data (all 18 ACS and WFC3 exposures). Thus, while our tests cover the full range of crowding levels in our data, they only cover 1.5% of the survey area. These tests are computationally expensive (2000 CPU hours to run 50,000 for one field). Thus we performed this efficient set of tests to provide an accurate quality check at a range of crowding levels.
We applied photon noise to each model SED, and added a star with the corresponding magnitudes to the images of each field using the PSF of each image. We then reran the photometry to determine if the artificial star was recovered, and if it was recovered, to compare the input and output magnitudes. These tests were performed one star at a time to avoid the artificial stars from affecting one another. A star was considered to be recovered if it was detected within two pixels of the same position, passed our quality criteria, and had a measured magnitude within 2 magnitudes of the input value. A catalog of our artificial star tests is provided on Vizier, as well as in Table 7. The RMS uncertainties and median magnitude bias from the artificial stars, along with the corresponding DOLPHOT reported error, and ratio of the RMS to the DOLPHOT reported error as a function of stellar density, filter, and magnitude are provided in Table 8. We now describe the results in detail.
5.1.1 Magnitude Errors and Bias
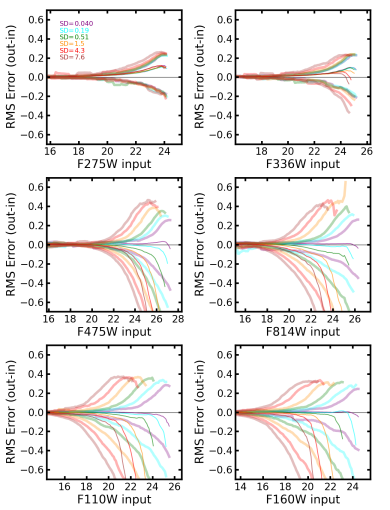
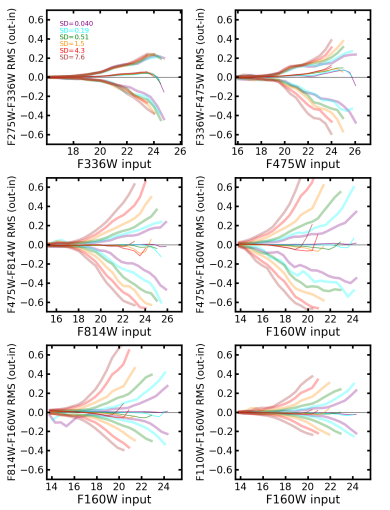
Figure 20 shows the root mean square (RMS) scatter in positive and negative directions (calculated separately) and the median bias of the artificial star photometry in each band, as a function of magnitude for six characteristic fields, color-coded by stellar density of the region. The magnitude biases and uncertainties are clearly a strong function of band and stellar density.
In the UV, the RGB stellar density has little effect on the photometry because our UV images do not probe the RGB. Therefore none of our UV images suffer from significant crowding. In all areas of the survey, the UV photometry goes from a bias of 0 at the bright end to 0.1 mag at the faint end, and the uncertainties go from 0.01 mag at the bright end to 0.2 mag at the faint end. The bias in the UV is in the direction of stars at the faint end being recovered at fainter magnitudes than the input. This result clearly shows that crowding is not the cause of magnitude bias in our UV photometry. We attribute this bias to charge transfer efficiency (CTE). The CTE trails in the image cause the sky level to be slightly over-estimated, making the brightness of the star systematically low.
All of the other bands show clear crowding effects. In the lower density regions that represent the bulk of our survey, the magnitude bias is 0.05, and is not correlated with brightness. As the RGB stellar density increases, the bias becomes negative (the measurement is brighter than the input) at brighter magnitudes and redder bands, reaching 0.5 mag at the faint end. This crowding bias is of most concern in the most dense portion of the M31 bulge, where it begins to affect photometry near the TRGB in F814W. Thus, in the most crowded regions of the survey, the bias can cause RGB stars to be measured brightward of the TRGB. Such biases will be important to consider for any study seeking to disentangle the stellar populations of the central M31 bulge.
Figure 21 shows the same quantities as Figure 20 for 6 color combinations from the UV to the IR. These plots show that while the scatter is larger in color than magnitude, the color bias in our photometry is generally 0.1 mag outside of our faintest detections. This result is not surprising, since our bias is dominated by contamination from blended stars, which will push all of the bands to be biased brightward, resulting in less color bias than magnitude bias. Again, the fact that crowding is not the source of magnitude bias in the UV is noticeable, as the color bias in the UV is worse than in the other bands. Thus, our artificial star tests appear to provide a reasonable estimate of the effects of crowding on our photometric measurements.
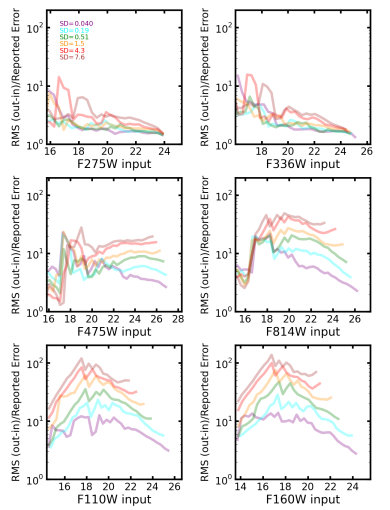
Figure 22 shows the ratio of the RMS of the artificial star tests to the error reported by DOLPHOT (photon statistics error) as a function of stellar density, filter, and magnitude. In the UV, the DOLPHOT reported errors tend to be underestimated by factors of 2 to 10, with the worst underestimates coming at the bright end, where photon statistics typically give very small uncertainties that are much smaller than the dominant systematic errors. In the optical, the brightest stars are only measurable in the very short exposure (they are saturated in the long exposures), making their photon statistics poor. At 18th magnitude, the stars are measurable in the longer ACS exposures, and the photon statistics yield very small errors that are underestimated by factors of 10–20, again due to the dominance of systematic errors. At the faint end in the optical the factor by which the DOLPHOT reported errors are underestimated is a strong function of crowding, with errors in low-density regions underestimated by factors of a few and errors in high-density regions underestimated by factors of 20–30. In the IR, crowding causes DOLPHOT reported errors to be severely underestimated at all stellar densities, ranging from factors of 4–20 at the bright end, factors of 10–100 at 18th magnitude, and factors of 3–80 at the faint end, depending on the degree of crowding. Thus, over most of our survey, the errors are dominated by sources of uncertainty other than photon counting, and which are better characterized by using artificial star tests, or an interpolation of the artificial star test results presented here.
5.1.2 Completeness
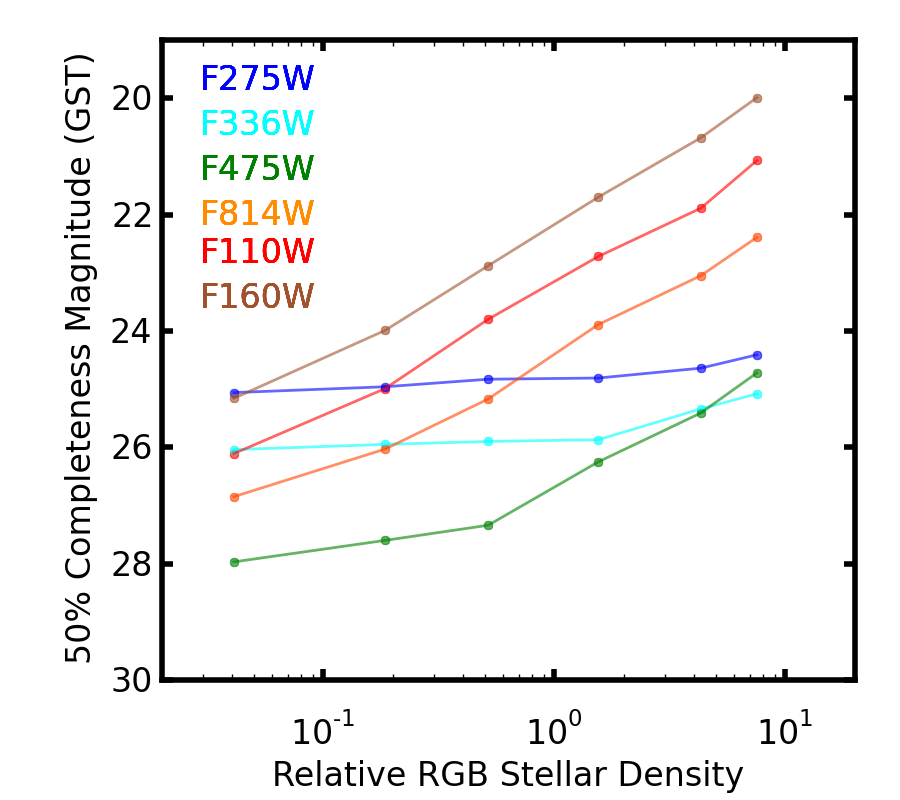
Figure 23 and Table 9 provide the 50% completeness limit for each band as a function of the surface density of stars with 18.5F160W19.5 in stars per arcsec2. These values are about 1 mag deeper in the IR bands and 1 mag deeper in F336W compared to those performed on the individual camera data presented in Dalcanton et al. (2012a). This improvement is due to both our DOLPHOT parameter optimization and in inclusion of data from all cameras in the DOLPHOT runs (see Section 6). Essentially, the deep, high-resolution ACS data increases the fidelity and precision of source positions, improving deblending and accuracy of photometry for faint sources in the shallower data from the other cameras.
The completeness trends for each band reveal the effects of crowding as a function of spectral window. In redder bands (F814W–F160W), which are sensitive to the very numerous RGB stars in the M31 disk, the completeness is crowding-limited (we detect stars to the point where they are hopelessly blended with neighbors of similar brightness), as shown by the monotonic decrease in depth as RGB stellar density increases. In the UV, which only contains the much less numerous massive young stars, the completeness shows no trend with RGB stellar density, showing that the completeness is photon-limited (we detect stars to the signal-to-noise limit). Finally, in the intermediate F475W band, the completeness becomes a strong function of RGB stellar density only when the stellar density reaches 0.5 stars with 18.5F160W19.5 in stars per arcsec2.
5.2. Systematic Uncertainties
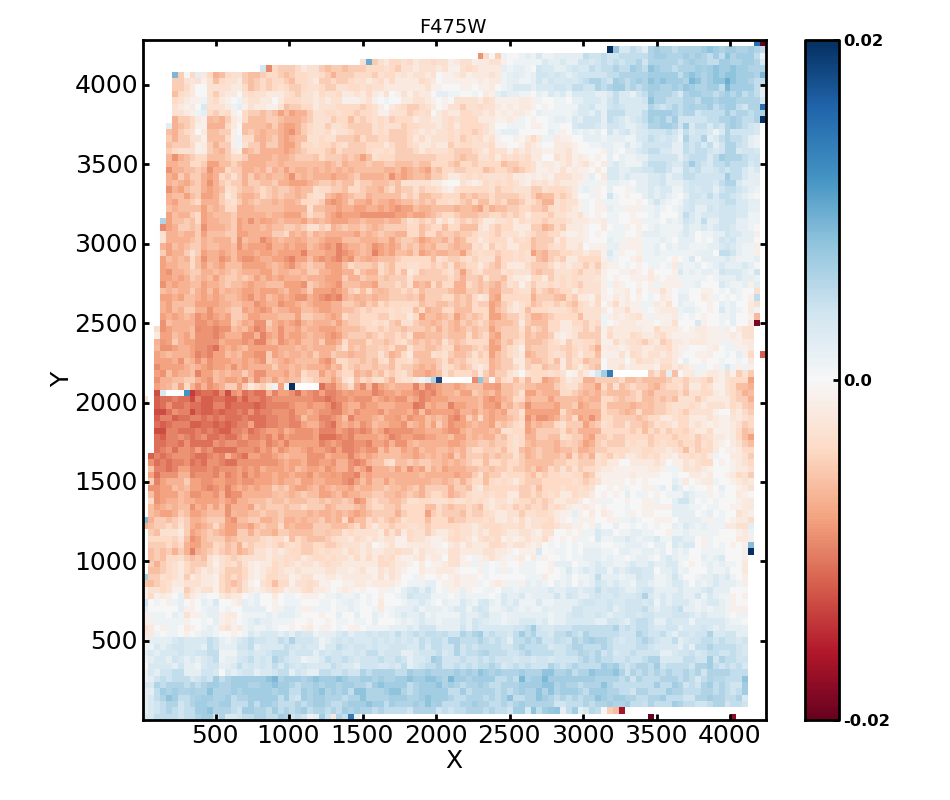
Because of the high stellar density and our overlapping fields in ACS (entire survey) and WFC3/IR (Brick 9 and 11 boundary), we have multiple measurements of many stars taken at different locations on the detectors222Although UVIS does contain overlapping measurements, the stellar density was not high enough to provide a useful check for systematic uncertainties in this way. To test the consistency of our photometry, we have matched our overlapping measurements across locations on the detectors to look for systematic trends. We match a large number of stars with magnitude between 22 and 24 in the relevant filter, using a matching radius of 50 milli-arcseconds. We drop matches with large differences in magnitude between the two measurements, via sigma clipping. In Figure 24, we show the median magnitude residual in spatial bins in pixel coordinates for ACS and WFC3-IR.
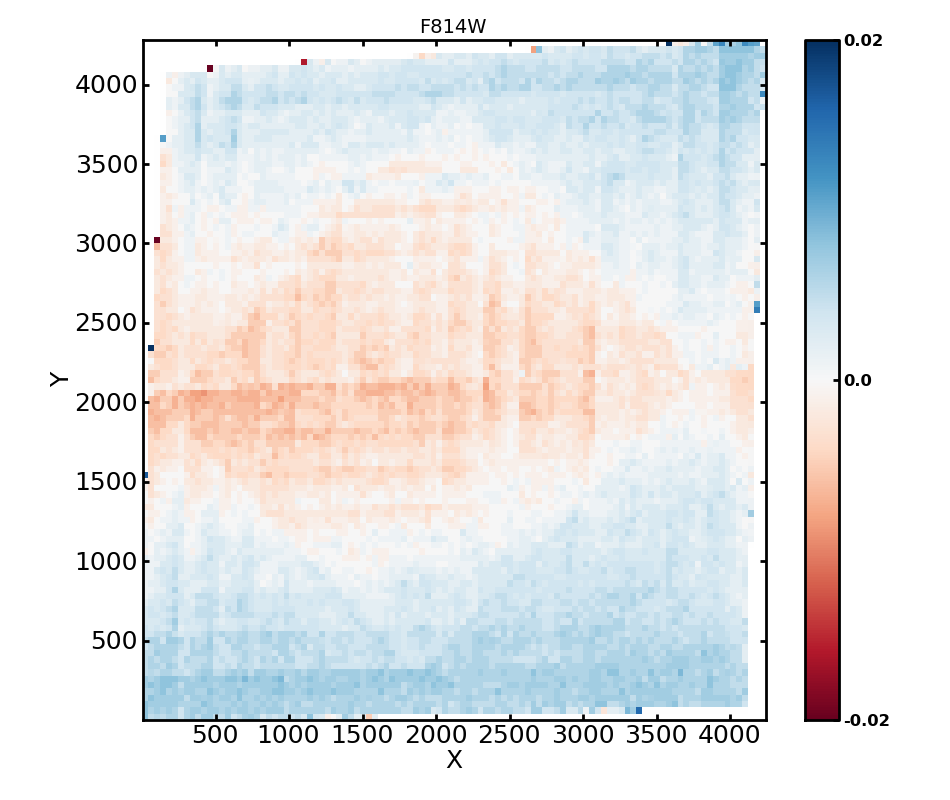
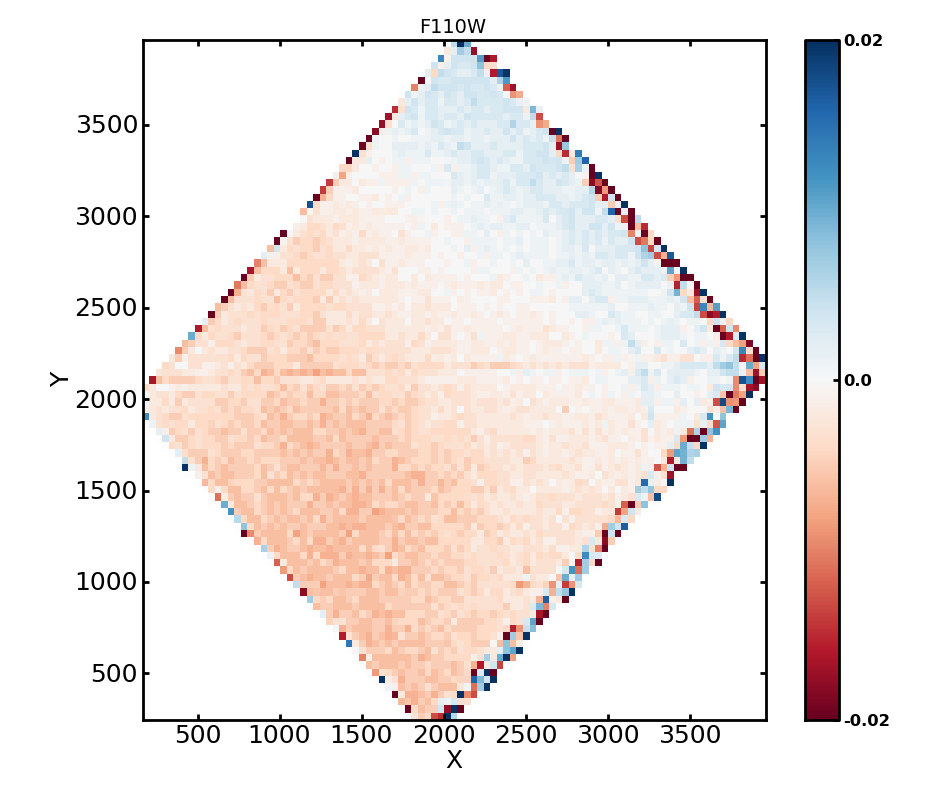
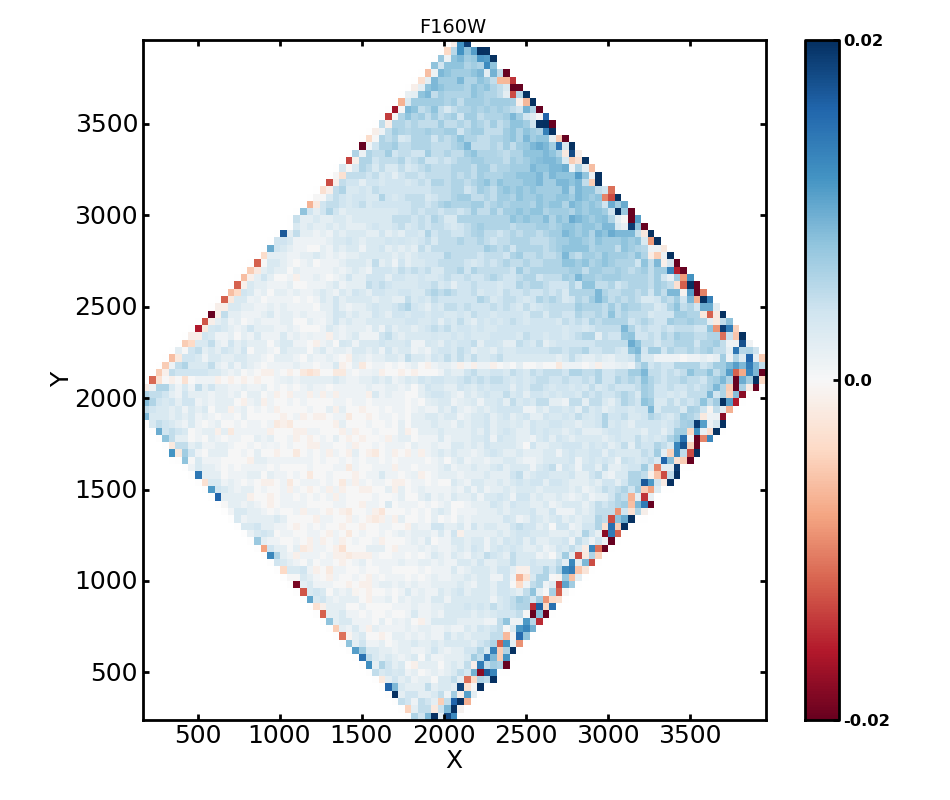
As shown in Figure 24, we find patterns in photometry at RMS levels of 0.02–0.05 mag in F475W, F814W, F110W, and F160W, depending on stellar brightness (see Table 6). These systematics are most likely due to a combination of flat-fielding, point spread function, and charge transfer efficiency. As the patterns are similar in F475W and F814W, the colors of stars are only affected at the 0.02 mag level (the difference in amplitude of the two filters). We also note that the footprint of the IR camera is visible in these consistency tests at a low level because bins that contain the detector edge often contain fewer stars. In any case, these edges are trimmed from the photometry catalogs (see Section 2.4) and are therefore our final photometry is not affected by any IR edge effects.
The magnitude of the true systematic errors due to detector position is likely exaggerated in these maps because our survey strategy results in a constant overlap pattern. This pattern results in the same locations on the detector being paired many times. Thus each pixel is not typically being compared with many other pixels around the detector, but with the same area on the opposite side of the detector. Therefore, if a star is too bright by 0.02 mag on one side, and too faint by 0.02 mag on the other, these Figures will show an offset of 0.04 on one side and -0.04 on the other, exaggerating the effect by a factor of 2. The overlaps aren’t exactly the same across the survey, but they are similar enough that this effect will be included in the comparison. As a result, the values for systematic errors we report should be considered upper limits.
In addition, our systematic error map for F475W and F814W shows a grid pattern on a scale of 256256 ACS pixels, at a level smaller than the large scale 0.05 and 0.03 level of the systematic errors in both bands. This grid pattern provides a clue as to the dominant source of our systematic errors because DOLPHOT uses a grid of this size to define the PSF used for photometry. In short, the Anderson (ACS ISR 2006-01) PSFs are binned into a 1616 grid when fitted to the data, making small errors in the the PSF models a likely cause of the grid pattern.
To further investigate the PSFs as the dominant source of systematic error, we produced maps of our median sharpness values as a function of instrumental position. Negative sharpness means that the PSF underestimates the peak of the light distribution, causing an underestimate of the flux, which corresponds to a systematically high magnitude. The maps for F475W and F814W are shown in Figure 25, and clearly show not only the same grid pattern seen in the systematic magnitude errors, but also the large scale pattern seen in the systematic magnitude errors. Furthermore, the regions with systematically negative sharpness values correspond to areas with systematically positive magnitude errors, in agreement with expectation if the PSF is responsible for the errors. The amplitude of the effect is larger in F475W than in F814W, also in agreement with the magnitude errors. Future DOLPHOT versions will not bin the PSF models as coarsely, which should eliminate the grid pattern. However, only improved PSF models will reduce the larger scale variations.
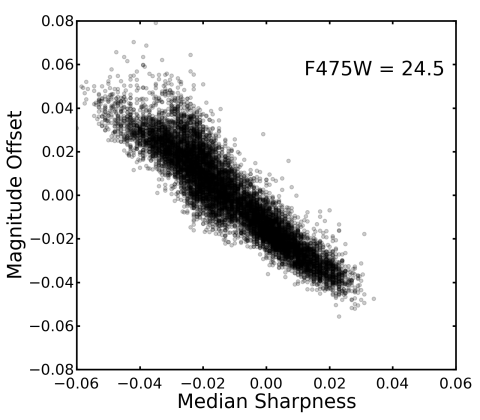
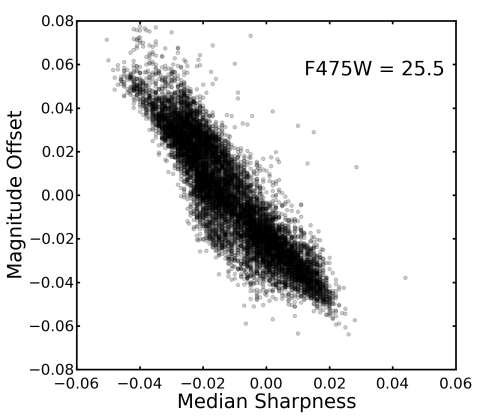
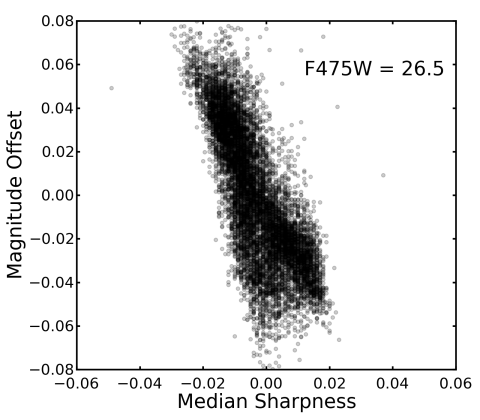
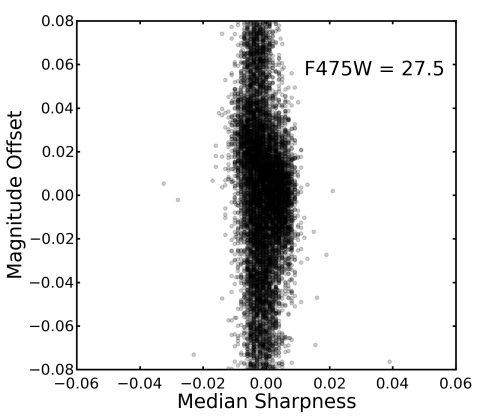
Systematic uncertainties related to the model PSF are expected to be magnitude-dependent. Unlike aperture photometry, PSF-fitting photometry applies optimal position-based weighting to the data contained in each pixel. Weights are higher at a star’s center, so the star will appear fainter if the model PSF is sharper than the actual PSF (and vice versa). We investigated the magnitude dependence by producing -mag detector maps like those in Figure 24 for a series of magnitude bins. The standard deviation of these maps in each filter are provided in Table 6, and provide a quantitative measure of the level of systematic errors in our catalogs. We also made detector maps of sharpness (like Figure 25) in the same magnitude bins, and we report the standard deviation of those maps in Table 6 as well. In Figure 26, we plot the median sharpness value vs. the measured magnitude offset in each location on the detector in four bins of magnitude. At bright magnitudes (top row), the magnitude difference correlates strongly with sharpness, as expected for magnitude errors driven by the PSF model. At faint magnitudes, the magnitude difference and sharpness are uncorrelated suggesting that something other than the PSF is causing the magnitude offsets at the faint end.
We explore the faint end systematic differences in magnitude in Figure 27, generating the same map of magnitude offset vs position as in Figure 24, but for faint stars (¿28) alone. These maps show that at that the systematic magnitude differences at the faint end are symmetric about the chip gap, and completely different from those at the bright end. Furthermore, the amplitude of the magnitude offset variations increases as stellar brightness decreases, while the amplitude of the sharpness variations decreases as stellar brightness decreases. These patterns suggest that the magnitude offsets at the faint end are dominated not by PSF model problems but instead by CTE effects. If so, the systematic errors at the faint end may improve significantly in the next generation of photometry, when CTE-corrected images are employed instead of post facto CTE corrections.
In Figures 24–26, it is clear that the PSF library alone is not to blame for all off the systematic errors at the bright end. The 1616 grid in the ACS maps is clearly due to the PSF binning used by DOLPHOT; however, some of the large scale patterns are slightly different, causing the scatter in the anti-correlation between sharpness and magnitude offset. For example, the upper-right corner of the F475W sharpness map shows a somewhat different pattern than that of the corresponding magnitude map, and the upper-left corner of the F814W sharpness map is different than the corresponding magnitude map.
Finally, there is no grid pattern and little, if any, correlation between sharpness and magnitude offset in the F110W and F160W, suggesting some other source for the systematic errors in the IR. However, the PSF model used by DOLPHOT in the IR contains no variations with position on the detector, and perhaps a spatially-varying PSF could improve the systematics there. In addition, some of these less severe magnitude offsets may be due to flat-fielding (Dalcanton et al., 2012a).
5.3. CMD Feature Consistency
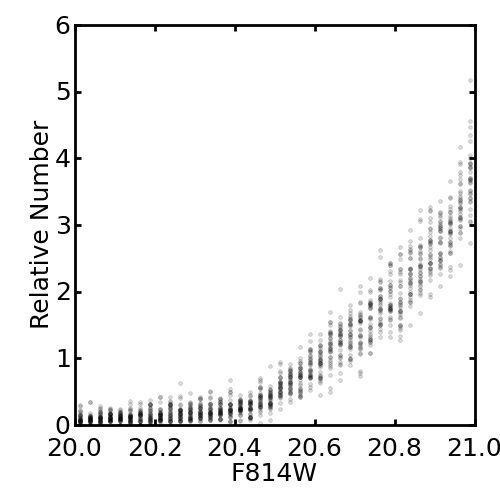
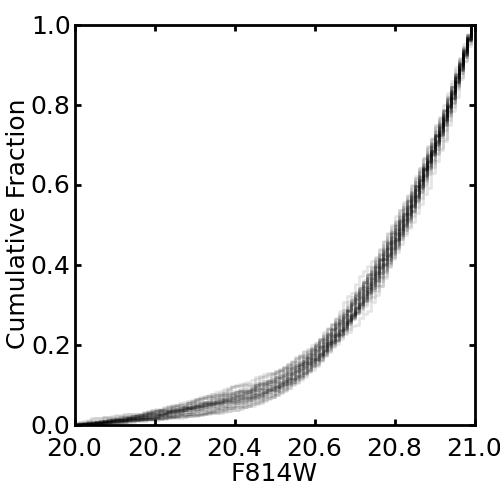
Beyond cross-checking multiple measurements of individual stars, we can also check the consistency of features in the color-magnitude diagrams. In Figure 28, we overplot the F814W luminosity function (left) and cumulative luminosity function (right) in a color slice of 3F475W-F814W3.5 for 34 regions of the survey. The histograms have all been normalized to have the same integral over the plotted range. The luminosity functions of all of these regions agree, showing that the photometry is exceptionally consistent across the survey. From these histograms, there is a clear change in the slope of the luminosity function just brightward of F814W20.5.
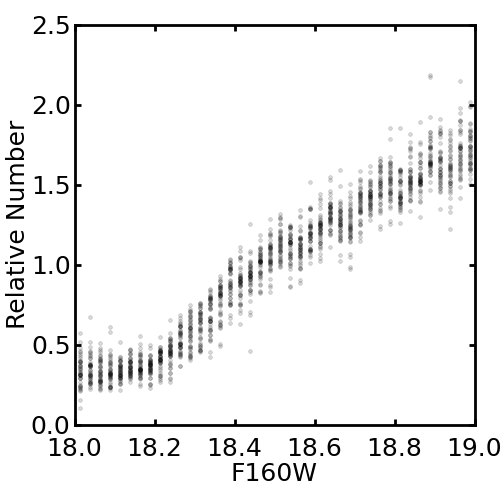
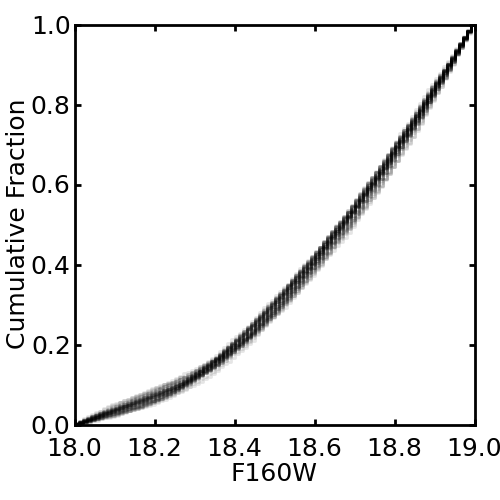
To check the consistency of the IR photometry across the survey, in Figure 29 we show histograms in the 0.9F110W-F160W1.2 color interval, looking at the F160W luminosity function for 40 regions of the survey. We find the same exquisite agreement as in the optical, but with a slope change just fainter than F160W18.2. Determining the precise TRGB magnitude requires sophisticated modeling of the reddening across the survey, so that looking at these histograms is likely accurate to only 0.1 mag. However, we note that this magnitude for the TRGB, which appears consistently across our survey, is consistent with the distance modulus we assume for M31 (24.47; McConnachie et al., 2005) and the typical M31 foreground extinction of (Schlafly & Finkbeiner, 2011).
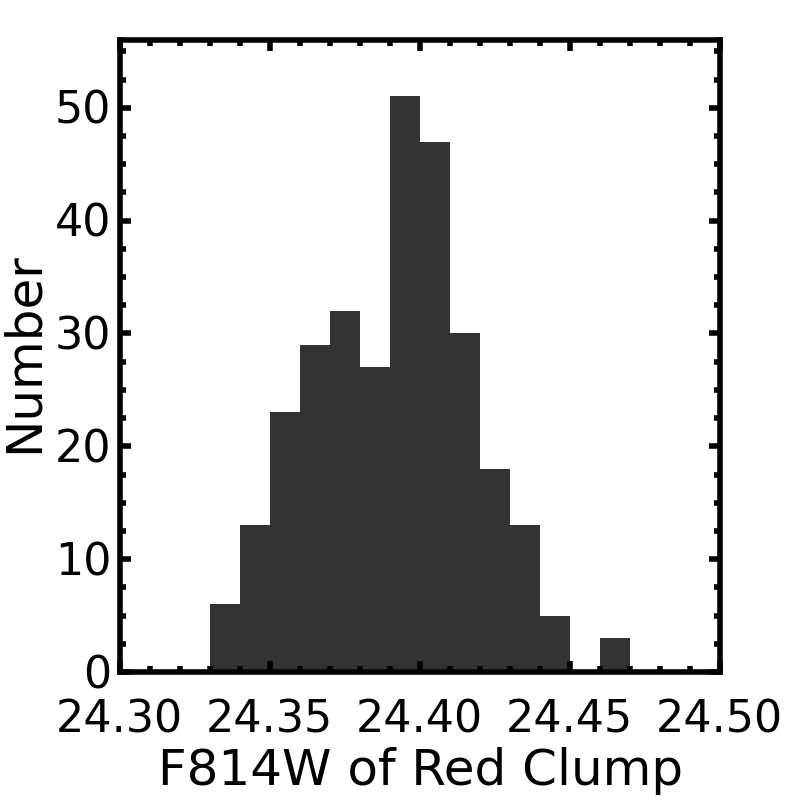
In addition to looking at the TRGB feature, we measured the F814W magnitude of the red clump across the survey. This feature is sufficiently well-populated to obtain a precise measure of its peak. In Figure 30, we show a histogram of the F814W values of the peak magnitudes in the color range 1.52.0 for 298 regions in our survey, which corresponds to the blue end, or least reddened, portion of the red clump. The values agree to within 0.05 mag, even at this much fainter level in the photometry, slightly larger than the systematics measured by comparing multiple F814W measurements of individual stars (0.03, see Figure 24). Some of the additional scatter is likely attributable to real changes in the stellar populations, since the red clump does change somewhat in brightness with metallicity, age, and He content (e.g., Cole, 1998; Girardi & Salaris, 2001). A detailed study of the red clump and AGB bump will be presented in a future paper (Byler et al., in prep.) However, even if this entire scatter is due to photometric errors, our catalog is remarkably homogeneous and clearly equidistant.
6. Comparison with First Generation Photometry
We found that optimizing the DOLPHOT parameters and including data from all 6 bands significantly affected the resulting photometry catalogs. The 6-band catalogs have improved matching between bands over any matched photometry from the individual cameras. In addition, the process provides a measurement of every source in every band, so that upper limits can be used for bands where the source was not detected at sufficient signal to noise. Furthermore, completeness of any combination of filters can be measured, whereas previously there was no way to assess the completeness for colors that included data from 2 cameras (such as F336W-F475W or F814W-F160W).
In addition to the cross-matching advantages, our optimization of DOLPHOT parameters for our data set and including data from multiple cameras in the DOLPHOT stack dramatically improved the depth and quality of the IR photometry. While we expected that the crowding limit of the IR data may improve with the addition of the optical data to the stack, we did not expect the improvement to be as remarkable as it was. Figure 31 shows side-by-side the old photometry of Brick 1, Field 5 (with old parameters and including only the IR data), a re-reduction of this field using improved photometry parameters alone, and our new photometry, which includes both the new optimized parameters and the UV and optical data in the stack. With the new parameters and the addition of higher resolution optical data to the stack to separate discrete objects, the photometry extends more than 2 magnitudes farther down the RGB.
In addition to the vastly improved IR photometry, fewer faint sources were detected in the optical when the IR data were included. To understand the reason for the lower number, we looked at the CMD of discrete sources that were measured in stacks with and without the IR data. The comparison is shown in Figure 32. The plots show the fraction of optical measurements lost when including the IR data as a function of optical color and magnitude. We found 5% of detections were lost brightward of F814W25, but a significantly higher percentage (up to 30%) were lost in the highly-uncertain and relatively amorphous faint points at the bottom of the CMD. Furthermore, including the IR data into the DOLPHOT stack decreases the number of low-quality measurements in the most crowded regions at the faintest flux levels (clusters and the inner disk).
Overall, the addition of the IR data appears to improve the fidelity of the catalogs, working as another assessment of the quality of a measurement. Essentially, the IR data helped remove many low-quality measurements in a similar way that our quality cuts do. Thus while including the IR data may result in lower numbers of optical detections at the faint end, it also results in higher reliability of measurements that remain.
As shown in Figure 4, the portions of a Field’s catalog outside of the IR footprint do not contain any IR data. Therefore, as described above, these areas will have higher densities of optical detections. Thus, one feature of merging neighboring ACS and WFC3 catalogs is higher detection densities in the ACS chip gap. We show this effect in Figure 33. This feature only occurs at the faint magnitudes where crowding has the largest impact on the quality of the photometry as shown in Figures 34 and 35. In the outer bricks, the feature is hardly noticeable. Future reductions of the data on machines with significantly more memory will allow the full collection of overlapping fields to be measured in the same DOLPHOT run, eliminating the need for this merging and greatly reducing the severity of this feature.
7. Fields with Caveats
7.1. Poor UV alignment
As described in Section 2.2, some the some UVIS exposures were not able to be reliably aligned due to a lack of bright stars. The UV photometry for these fields may be strongly affected, as no UV exposures have low weighting. Thus, UV photometry of the six fields with fewest UV detections is not reliable. These include the following fields: Brick 2, Field 1; Brick 6, Field 13; Brick 12, Field 7; Brick 20, Field 13; Brick 22, Field 13; Brick 23, Field 2.
7.2. High IR Background
Some of our fields had strong effects from Earthlimb glow in an IR exposure (Dalcanton et al., 2012b), which can cause problems with PSF fitting and background subtraction. These fields with elevated IR background levels are listed in Table 10. In all but one case, the resulting photometry was of similar quality to the rest of the survey. That is, DOLPHOT was able to measure the local background to the stars and provide CMDs and detection densities similar to surrounding fields. In one case, this background issue caused the IR photometry to be significantly worse than the neighboring fields. This field was Brick 22, Field 8, where the IR photometry should be used with extra caution.
7.3. Fields with Altered Observing Setup
There were 3 fields that could not be observed at our standard orientation angles due to a lack of guide stars. For these fields, the ACS and UVIS data were taken with different parts of the detector overlapping than the rest of the survey. In order to obtain 6-band coverage for these fields, we needed to have 6 additional orbits. These orbits were taken at the expense of the southwestern edge of Brick 11 (Fields 15, 17, and 18 in WFC3, and Fields 13, 14, and 18 in ACS), because this location was covered almost completely by the northern edge of Brick 9.
The ACS data for 3 fields were obtained at different orientations than our standard, because the necessary orientation to have the proper ACS parallel location did not have available guide stars. In these cases, the orientation of the original (WFC3 primary) observation was changed to provide guide stars, and the ACS data for the optical coverage was obtained in a separate observation with ACS as the primary instrument, also with a non-standard orientation.
In detail, the ACS data of Field 12, Brick 3 was observed with in ACS as primary instrument, and with an orient of 159. In all other bricks south of the survey bend, the ACS data for Field 12 were taken as the parallel for Field 9 at an orient of 54, but in this case the WFC3 data for Field 9 were taken at an orient of 249 (instead of the usual orient of 69) to make guide stars available.
Brick 10 Field 17 was taken at an orient of 249 with ACS as the primary instrument. In all other bricks, the ACS data for Field 17 was taken as the parallel for Field 14 at an orient of 69 degrees, but in this case, the WFC3 data for Field 14 was observed at an orient of 249 to make guide stars available.
The ACS data for Field 14 of Brick 16 was observed at orient 54 with ACS as the primary instrument. In all other bricks north of the survey bend, the ACS data for Field 14 was taken as the parallel for Field 17 at an orient of 234, but in this case, the WFC3 data for Field 17 was observed at an orient of 54 degrees to make guide stars available.
These 6 observations with non-standard orientations resulted in additional parallel observations which were not included in this release of the survey data as they were not needed to produce 6-band coverage of the PHAT footprint. They did result in a different structure of the overlap between the different cameras, but this difference appeared to have no effect on the resulting photometry.
After the changes for guide star acquisition were finished, we had one 0.1 arcmin2 triangle at the boundary between bricks 9 and 11 without 6-filter coverage (where Brick 11, Field 13 meets Brick 9, Field 1).
8. Data Products
In addition to the machine readable photometry and fake star tables available through this publication, we are releasing several data products through the MAST high level science products (HLSP). These include, for each field, a fits format table of the original 6-filter photometry output as returned from DOLPHOT, as well as ST and GST filtered versions of this table. We also include drizzled images in all filters for each field with the correct astrometric solution to our survey precision of 5 milliarcseconds.
We also provide brickwide catalogs trimmed so that they contain only unique measurements at each location on the sky. Each brick has its own catalog. These catalogs contain all of the unique measurements from each ST single-field catalog as described in Section 2.4, along with a GST column for each filter that has a value of 1 if the measurement passes the GST criteria in that bandpass.
9. Conclusions
We have produced the largest, highest-fidelity, and most homogeneous UV to IR photometric catalog of equidistant stars ever assembled. Using the ACS and WFC3 cameras aboard HST, we have photometered 414 contiguous WFC3/IR footprints covering 0.5 square degrees of the M31 star-forming disk. The resulting catalog contains 6-band photometry of over 100 million stars, with very little (1%) contamination from the Milky Way foreground or background galaxies. Our photometric quality as a function of stellar density is homogeneous throughout the survey; however, the stellar density covers 2.5 orders of magnitude in the I-band, causing our limiting magnitude in the optical and IR to vary by 4-5 magnitudes over the full extent of the survey, and causing the photometric bias to brighter magnitudes to increase with decreasing radius.
Photometry of artificial stars shows that our UV photometry tends to measure stars fainter than their true brightness, while all other bands tend to measure stars brighter than their true brightness due to crowding effects. These tests also show that the DOLPHOT uncertainties, which account only for photon noise, are dominated by other effects except in the UV at the faint end. In some cases, the photon noise error accounts for only 1% of the total photometric error, such as for IR measurements of stars in areas of high stellar density.
Analysis of the systematic magnitude offsets as a function of detector position suggests that our systematics are largest in F475W (0.04 mag) and less than 2% in redder bands. The spatial pattern of our magnitude offsets, as well as its magnitude dependence, suggests that most of our systematic error from ACS photometry is due to the model PSFs for all but the faintest stars in our catalog. At the faint end, however, the systematic errors with position are symmetric about the chip gap, suggesting that they are dominated by CTE effects. These errors at the faint end attributable to CTE are as large as 0.1 mag.
Support for this work was provided by NASA through grant GO-12055 from the Space Telescope Science Institute, which is operated by the Association of Universities for Research in Astronomy, Incorporated, under NASA contract NAS5-26555. Support for DRW is provided by NASA through Hubble Fellowship grants HST-HF-51331.01 awarded by the Space Telescope Science Institute. We thank D. Pirone and K. Rosema for their help in engineering the data reduction pipeline. We thank Amazon cloud services, for donating some of the computing time necessary to make these measurements. We thank Alison Vick, for all of her help in carrying out these complex observations, S. Casertano for supplying the code to make exposure maps from our Astronomer’s Proposal Tool (APT) files, and J. Anderson for the model PSFs. IDL PyRAF, STSDAS, STSCI_PYTHON, and PyFITS are products of the Space Telescope Science Institute, which is operated by AURA for NASA. If using the PHAT photometry for future science projects, please reference this work and Dalcanton et al. (2012a) and acknowledge grant GO-12055 in their publications.
References
- Agar & Barmby (2013) Agar, J. R. R., & Barmby, P. 2013, AJ, 146, 135
- Allard et al. (2000) Allard, F., Hauschildt, P. H., & Schwenke, D. 2000, ApJ, 540, 1005
- Anderson & Bedin (2010) Anderson, J., & Bedin, L. R. 2010, PASP, 122, 1035
- Barmby et al. (2002) Barmby, P., Holland, S., & Huchra, J. P. 2002, AJ, 123, 1937
- Barmby et al. (2000) Barmby, P., Huchra, J. P., Brodie, J. P., Forbes, D. A., Schroder, L. L., & Grillmair, C. J. 2000, AJ, 119, 727
- Barmby et al. (2009) Barmby, P., et al. 2009, AJ, 138, 1667
- Beerman et al. (2012) Beerman, L. C., et al. 2012, ApJ, 760, 104
- Bellazzini et al. (2003) Bellazzini, M., Cacciari, C., Federici, L., Fusi Pecci, F., & Rich, M. 2003, A&A, 405, 867
- Bertola et al. (1995) Bertola, F., Bressan, A., Burstein, D., Buson, L. M., Chiosi, C., & di Serego Alighieri, S. 1995, ApJ, 438, 680
- Bianchi et al. (2012) Bianchi, L., Efremova, B., Hodge, P., & Kang, Y. 2012, AJ, 144, 142
- Boyer et al. (2013) Boyer, M. L., et al. 2013, ApJ, 774, 83
- Brown et al. (2008) Brown, T. M., et al. 2008, ApJ, 685, L121
- Brown et al. (2003) Brown, T. M., Ferguson, H. C., Smith, E., Kimble, R. A., Sweigart, A. V., Renzini, A., Rich, R. M., & VandenBerg, D. A. 2003, ApJ, 592, L17
- Brown et al. (2009) Brown, T. M., et al. 2009, ApJS, 184, 152
- Brown et al. (2007) Brown, T. M., et al. 2007, ApJ, 658, L95
- Brown et al. (2006) Brown, T. M., Smith, E., Ferguson, H. C., Rich, R. M., Guhathakurta, P., Renzini, A., Sweigart, A. V., & Kimble, R. A. 2006, ApJ, 652, 323
- Cole (1998) Cole, A. A. 1998, ApJ, 500, L137
- Dalcanton et al. (2012a) Dalcanton, J. J., et al. 2012a, ApJS, 200, 18
- Dalcanton et al. (2012b) Dalcanton, J. J., Williams, B. F., Melbourne, J. L., et al. 2012b, ApJS, 198, 6
- Dalcanton et al. (2009) Dalcanton, J. J., et al. 2009, ApJS, 183, 67
- Davidge (1993) Davidge, T. J. 1993, ApJ, 409, 190
- de Vaucouleurs et al. (1991) de Vaucouleurs, G., de Vaucouleurs, A., Corwin, H. G., Jr., Buta, R. J., Paturel, G., & Fouqué, P. 1991, Third Reference Catalogue of Bright Galaxies. Volume I: Explanations and references. Volume II: Data for galaxies between 0h and 12h. Volume III: Data for galaxies between 12h and 24h. (Springer, New York, NY (USA))
- Dolphin (2000) Dolphin, A. E. 2000, PASP, 112, 1383
- Dorman et al. (2013) Dorman, C. E., et al. 2013, ApJ, 779, 103
- Driver et al. (2007) Driver, S. P., Allen, P. D., Liske, J., & Graham, A. W. 2007, ApJ, 657, L85
- Durrell et al. (1994) Durrell, P. R., Harris, W. E., & Pritchet, C. J. 1994, AJ, 108, 2114
- Durrell et al. (2001) Durrell, P. R., Harris, W. E., & Pritchet, C. J. 2001, AJ, 121, 2557
- Ferguson et al. (2002) Ferguson, A. M. N., Irwin, M. J., Ibata, R. A., Lewis, G. F., & Tanvir, N. R. 2002, AJ, 124, 1452
- Ferguson et al. (2005) Ferguson, A. M. N., Johnson, R. A., Faria, D. C., Irwin, M. J., Ibata, R. A., Johnston, K. V., Lewis, G. F., & Tanvir, N. R. 2005, ApJ, 622, L109
- Fouesneau et al. (2014) Fouesneau, M., et al. 2014, ArXiv e-prints
- Gallazzi et al. (2008) Gallazzi, A., Brinchmann, J., Charlot, S., & White, S. D. M. 2008, MNRAS, 383, 1439
- Gilbert et al. (2012) Gilbert, K. M., et al. 2012, ApJ, 760, 76
- Girardi (1999) Girardi, L. 1999, MNRAS, 308, 818
- Girardi et al. (2012) Girardi, L., et al. 2012, TRILEGAL, a TRIdimensional modeL of thE GALaxy: Status and Future, ed. A. Miglio, J. Montalbán, & A. Noels (Springer-Verlag Berlin Heidelberg), 165
- Girardi et al. (2005) Girardi, L., Groenewegen, M. A. T., Hatziminaoglou, E., & da Costa, L. 2005, A&A, 436, 895
- Girardi & Salaris (2001) Girardi, L., & Salaris, M. 2001, MNRAS, 323, 109
- Gonzaga (2012) Gonzaga, S. e. 2012, The DrizzlePac Handbook (STScI, Baltimore, MD (USA))
- Haiman et al. (1994) Haiman, Z., et al. 1994, A&A, 290, 371
- Hodge et al. (2010) Hodge, P., Krienke, O. K., Bianchi, L., Massey, P., & Olsen, K. 2010, PASP, 122, 745
- Holland et al. (1997) Holland, S., Fahlman, G. G., & Richer, H. B. 1997, AJ, 114, 1488
- Ibata et al. (2001) Ibata, R., Irwin, M., Lewis, G., Ferguson, A. M. N., & Tanvir, N. 2001, Nature, 412, 49
- Johnson et al. (2012) Johnson, L. C., et al. 2012, ApJ, 752, 95
- Krienke & Hodge (2008) Krienke, O. K., & Hodge, P. W. 2008, PASP, 120, 1
- Kurucz (1979) Kurucz, R. L. 1979, ApJS, 40, 1
- Magnier et al. (1992) Magnier, E. A., Lewin, W. H. G., van Paradijs, J., Hasinger, G., Jain, A., Pietsch, W., & Truemper, J. 1992, A&AS, 96, 379
- Massey et al. (1986) Massey, P., Armandroff, T. E., & Conti, P. S. 1986, AJ, 92, 1303
- Massey et al. (2006) Massey, P., Olsen, K. A. G., Hodge, P. W., Strong, S. B., Jacoby, G. H., Schlingman, W., & Smith, R. C. 2006, AJ, 131, 2478
- McConnachie et al. (2005) McConnachie, A. W., Irwin, M. J., Ferguson, A. M. N., Ibata, R. A., Lewis, G. F., & Tanvir, N. 2005, MNRAS, 356, 979
- McConnachie et al. (2009) McConnachie, A. W., et al. 2009, Nature, 461, 66
- Mould & Kristian (1986) Mould, J., & Kristian, J. 1986, ApJ, 305, 591
- Perina et al. (2010) Perina, S., et al. 2010, A&A, 511, A23
- Pritchet & van den Bergh (1988) Pritchet, C. J., & van den Bergh, S. 1988, ApJ, 331, 135
- Rich et al. (1996) Rich, R. M., Mighell, K. J., & Neill, J. D. 1996, in Astronomical Society of the Pacific Conference Series, Vol. 92, Formation of the Galactic Halo…Inside and Out, ed. H. L. Morrison & A. Sarajedini, 544
- Robin et al. (2003) Robin, A. C., Reylé, C., Derrière, S., & Picaud, S. 2003, A&A, 409, 523
- Rosenfield et al. (2012) Rosenfield, P., et al. 2012, ApJ, 755, 131
- Sarajedini & Van Duyne (2001) Sarajedini, A., & Van Duyne, J. 2001, AJ, 122, 2444
- Schlafly & Finkbeiner (2011) Schlafly, E. F., & Finkbeiner, D. P. 2011, ApJ, 737, 103
- Stephens et al. (2003) Stephens, A. W., et al. 2003, AJ, 125, 2473
- Tanvir et al. (2012) Tanvir, N. R., et al. 2012, MNRAS, 422, 162
- Wang & Ma (2013) Wang, S., & Ma, J. 2013, AJ, 146, 20
- Weisz et al. (2013) Weisz, D. R., et al. 2013, ApJ, 762, 123
- Williams (2002) Williams, B. F. 2002, MNRAS, 331, 293
- Williams (2003) Williams, B. F. 2003, AJ, 126, 1312
- Williams et al. (2012) Williams, B. F., et al. 2012, ApJ, 759, 46
- Williams & Hodge (2001a) Williams, B. F., & Hodge, P. W. 2001a, ApJ, 559, 851
- Williams & Hodge (2001b) Williams, B. F., & Hodge, P. W. 2001b, ApJ, 548, 190
| Target Name | RA (J2000) | Dec (J2000) | Start Time | Exp. (s) | Inst. | Aper. | Filter | PA-V3 |
|---|---|---|---|---|---|---|---|---|
| M31-B01-F01-IR | 00 43 23.674 | +41 15 17.96 | 2010-12-14 06:05:28 | 1197.694 | WFC3 | IR-FIX | F160W | 249.000 |
| M31-B01-F01-IR | 00 43 23.687 | +41 15 18.10 | 2010-12-14 06:13:09 | 799.232 | WFC3 | IR-FIX | F110W | 249.000 |
| M31-B01-F01-IR | 00 43 23.681 | +41 15 18.15 | 2010-12-14 06:44:46 | 499.232 | WFC3 | IR-FIX | F160W | 249.000 |
| M31-B01-F01-UVIS | 00 43 23.973 | +41 15 18.28 | 2010-12-14 03:24:58 | 1350.000 | WFC3 | UVIS-CENTER | F336W | 249.000 |
| M31-B01-F01-UVIS | 00 43 23.973 | +41 15 18.28 | 2010-12-14 04:29:38 | 1010.000 | WFC3 | UVIS-CENTER | F275W | 249.000 |
| M31-B01-F01-WFC | 00 43 22.717 | +41 15 04.89 | 2010-07-22 21:05:37 | 1520.000 | ACS | WFC | F814W | 69.000 |
| M31-B01-F01-WFC | 00 43 22.717 | +41 15 04.89 | 2010-07-22 22:34:36 | 1720.000 | ACS | WFC | F475W | 69.000 |
| M31-B01-F02-IR | 00 43 14.050 | +41 16 06.28 | 2010-12-16 17:12:31 | 1197.694 | WFC3 | IR-FIX | F160W | 249.000 |
| M31-B01-F02-IR | 00 43 14.063 | +41 16 06.42 | 2010-12-16 17:43:36 | 799.232 | WFC3 | IR-FIX | F110W | 249.000 |
| M31-B01-F02-IR | 00 43 14.057 | +41 16 06.47 | 2010-12-16 19:27:29 | 499.232 | WFC3 | IR-FIX | F160W | 249.000 |
| Detector | Chip | Parameter | Value |
|---|---|---|---|
| IR | 1 | xform | “1 0 0” |
| IR | 1 | raper | 2 |
| IR | 1 | rchi | 1.5 |
| IR | 1 | rsky0 | 8 |
| IR | 1 | rsky1 | 20 |
| IR | 1 | rpsf | 10 |
| IR | 1 | ref2img | 20 Value Array |
| UVIS | 1,2 | raper | 3 |
| UVIS | 1,2 | rchi | 2.0 |
| UVIS | 1,2 | rsky0 | 15 |
| UVIS | 1,2 | rsky1 | 35 |
| UVIS | 1,2 | rpsf | 10 |
| UVIS | 1 | ref2img | 20 Value Array |
| UVIS | 2 | ref2img | 20 Value Array |
| WFC | 1,2 | raper | 3 |
| WFC | 1,2 | rchi | 2.0 |
| WFC | 1,2 | rsky0 | 15 |
| WFC | 1,2 | rsky1 | 35 |
| WFC | 1,2 | rpsf | 10 |
| WFC | 1 | ref2img | 20 Value Array |
| WFC | 2 | ref2img | 20 Value Array |
| All | apsky | “15 25” | |
| All | UseWCS | 1 | |
| All | UseCTE | 1 | |
| All | PSFPhot | 1 | |
| All | FitSky | 2 | |
| All | SkipSky | 2 | |
| All | SkySig | 2.25 | |
| All | SecondPass | 5 | |
| All | SearchMode | 1 | |
| All | SigFind | 3.0 | |
| All | SigFindMult | 0.85 | |
| All | SigFinal | 3.5 | |
| All | MaxIT | 25 | |
| All | NoiseMult | 0.10 | |
| All | FSat | 0.999 | |
| All | FlagMask | 4 | |
| All | ApCor | 1 | |
| All | Force1 | 1 | |
| All | Align | 2 | |
| All | aligntol | 4 | |
| All | alignstep | 2 | |
| All | Rotate | 1 | |
| All | RCentroid | 1 | |
| All | PosStep | 0.1 | |
| All | dPosMax | 2.5 | |
| All | RCombine | 1.415 | |
| All | SigPSF | 3.0 | |
| All | PSFres | 1 | |
| All | psfstars | ||
| All | psfoff | 0.0 | |
| All | DiagPlotType | PNG | |
| WFC | 1,2 | ACSpsfType | 1 |
| IR | 1 | WFC3IRpsfType | 1 |
| UVIS | 1,2 | WFC3UVISpsfType | 1 |
| Camera | Sharpness Squared | Crowding |
|---|---|---|
| UVIS | 0.15 | 1.3 |
| ACS | 0.2 | 2.25 |
| IR | 0.15 | 2.25 |
| Brick | Total | F275W | F336W | F475W | F814W | F110W | F160W |
|---|---|---|---|---|---|---|---|
| 1 | 7739068 | 18310 | 268608 | 6587303 | 7276966 | 5605734 | 4547719 |
| 2 | 5389720 | 32745 | 150598 | 4064105 | 4635696 | 3753250 | 2740961 |
| 3 | 7420074 | 25280 | 126152 | 6296160 | 6969507 | 5327618 | 4161662 |
| 4 | 5699925 | 38868 | 165470 | 4430452 | 4966957 | 3949133 | 2947135 |
| 5 | 7017006 | 27125 | 121143 | 5871771 | 6513479 | 5070041 | 4000621 |
| 6 | 5737431 | 35452 | 154325 | 4413826 | 4969404 | 3928435 | 2898493 |
| 7 | 6548176 | 31481 | 110925 | 5307224 | 5917345 | 4654753 | 3696269 |
| 8 | 5619644 | 33584 | 151109 | 4256729 | 4817534 | 3841721 | 2787050 |
| 9 | 6107219 | 38838 | 144052 | 4589795 | 5361598 | 4255312 | 3282843 |
| 10 | 5286304 | 37461 | 114350 | 3826009 | 4445694 | 3666566 | 2604794 |
| 11 | 2944424 | 16185 | 41962 | 2257404 | 2560174 | 2007530 | 1490975 |
| 12 | 5037810 | 32830 | 130383 | 3715558 | 4286834 | 3433973 | 2421219 |
| 13 | 5701760 | 37060 | 100222 | 4178398 | 4886377 | 3907437 | 2844294 |
| 14 | 5381346 | 37474 | 139786 | 3945878 | 4583746 | 3649396 | 2565388 |
| 15 | 5506459 | 47311 | 201660 | 3579821 | 4638748 | 3876490 | 2831302 |
| 16 | 4978208 | 36893 | 135707 | 3453638 | 4152284 | 3371484 | 2324596 |
| 17 | 4928251 | 35865 | 144164 | 3299131 | 4072788 | 3462695 | 2398277 |
| 18 | 3988686 | 31269 | 87305 | 2588023 | 3199622 | 2691382 | 1724250 |
| 19 | 4030587 | 27500 | 76068 | 2638976 | 3259447 | 2740509 | 1762750 |
| 20 | 3116348 | 38093 | 70767 | 1843219 | 2390934 | 2064556 | 1273885 |
| 21 | 3207788 | 31108 | 90925 | 1897030 | 2535071 | 2228104 | 1414521 |
| 22 | 2718684 | 25772 | 55894 | 1495505 | 2002241 | 1739825 | 1063914 |
| 23 | 2756854 | 22383 | 53262 | 1613141 | 2134913 | 1780956 | 1114743 |
| RA(J2000) | DEC(J2000) | F275W | S/N | GST | F336W | S/N | GST | F475W | S/N | GST | F814W | S/N | GST | F110W | S/N | GST | F160W | S/N | GST |
|---|---|---|---|---|---|---|---|---|---|---|---|---|---|---|---|---|---|---|---|
| 10.580256333 | 41.2441757179 | 26.68 | 1.0 | F | 99.999 | -0 | F | 24.603 | 42.3 | T | 21.85 | 125.7 | T | 20.981 | 117.5 | T | 20.027 | 124.2 | T |
| 10.5802572159 | 41.2457103763 | 23.848 | 8.2 | T | 27.801 | 0.8 | F | 25.392 | 19.4 | T | 23.603 | 35.7 | T | 22.538 | 33.2 | T | 21.777 | 31.8 | F |
| 10.58025753 | 41.245922544 | 99.999 | -0.2 | F | 99.999 | -0.1 | F | 25.573 | 20.7 | T | 23.428 | 40.8 | T | 22.814 | 28.7 | T | 22.279 | 22.2 | T |
| 10.5802579935 | 41.2460588596 | 99.999 | -0.4 | F | 26.706 | 2.2 | F | 25.415 | 24.7 | T | 23.329 | 45.6 | T | 22.106 | 49.5 | T | 21.329 | 48.7 | T |
| 10.5802580564 | 41.2434928097 | 26.553 | 1.1 | F | 99.999 | -1.7 | F | 99.999 | -1.4 | F | 21.861 | 123.8 | T | 20.065 | 235.2 | T | 18.969 | 300.9 | T |
| 10.5802582443 | 41.2474459936 | 99.999 | -1.3 | F | 27.188 | 1.4 | F | 24.931 | 34.0 | T | 21.997 | 108.1 | T | 21.097 | 112.3 | T | 20.149 | 133.1 | T |
| 10.5802583084 | 41.2479862568 | 99.999 | -0.3 | F | 26.528 | 2.5 | F | 25.488 | 21.9 | T | 22.83 | 63.8 | T | 22.022 | 54.5 | T | 21.264 | 51.9 | T |
| 10.5802586378 | 41.2493851795 | 99.999 | -0.3 | F | 99.999 | -1.2 | F | 26.932 | 6.7 | T | 24.43 | 17.2 | T | 23.229 | 19.1 | T | 23.048 | 10.3 | F |
| 10.5802594502 | 41.2488740433 | 99.999 | -1.6 | F | 99.999 | -1.6 | F | 25.714 | 18.5 | T | 23.245 | 48.7 | T | 22.496 | 40.2 | T | 21.367 | 46.5 | T |
| 10.5802601961 | 41.2440702789 | 99.999 | -0.5 | F | 27.688 | 0.9 | F | 26.722 | 7.4 | T | 25.029 | 10.0 | T | 99.999 | -1.5 | F | 99.999 | -0.7 | F |
| 10.580261801 | 41.2473107079 | 99.999 | -0.3 | F | 27.534 | 1.0 | F | 25.032 | 30.4 | T | 22.741 | 59.8 | T | 21.947 | 53.0 | T | 21.201 | 49.9 | T |
| … | … | … | … | … | … | … | … | … | … | … | … | … | … | … | … | … | … | … | … |
| Mag | F475W Offset | F475W Sharp | F814W Offset | F814W Sharp | F110W Offset | F110W Sharp | F160W Offset | F160W Sharp |
|---|---|---|---|---|---|---|---|---|
| 22.5 | 0.016 | 0.010 | 0.013 | 0.006 | 0.014 | 0.006 | ||
| 23.5 | 0.019 | 0.018 | 0.017 | 0.009 | 0.013 | 0.006 | 0.017 | 0.006 |
| 24.5 | 0.022 | 0.017 | 0.018 | 0.007 | 0.023 | 0.006 | 0.049 | 0.009 |
| 25.5 | 0.027 | 0.014 | 0.021 | 0.004 | 0.048 | 0.007 | 0.051 | 0.016 |
| 26.5 | 0.031 | 0.010 | 0.044 | 0.003 | 0.041 | 0.012 | ||
| 27.5 | 0.043 | 0.004 | 0.077 | 0.007 | ||||
| 28.5 | 0.113 | 0.012 |
| RA(J2000) | DEC(J2000) | F275WIN | F275WOUT | F336WIN | F336WOUT | F475WIN | F475WOUT | F814WIN | F814WOUT | F110WIN | F110WOUT | F160WIN | F160WOUT |
|---|---|---|---|---|---|---|---|---|---|---|---|---|---|
| 10.86064898 | 41.46919167 | 25.084 | 99.999 | 23.212 | 23.205 | 22.026 | 22.016 | 20.207 | 20.189 | 19.586 | 19.573 | 19.013 | 18.993 |
| 10.86064901 | 41.44335114 | 26.924 | 99.999 | 26.251 | 25.919 | 25.976 | 25.77 | 24.465 | 24.192 | 23.986 | 24.018 | 23.658 | 99.999 |
| 10.86065098 | 41.46782277 | 28.915 | 99.999 | 26.728 | 99.999 | 22.813 | 22.839 | 19.456 | 19.475 | 18.288 | 18.296 | 17.202 | 17.214 |
| 10.86065183 | 41.45522179 | 31.883 | 99.999 | 29.876 | 99.999 | 26.091 | 26.198 | 22.439 | 22.445 | 21.091 | 21.11 | 19.9 | 19.913 |
| 10.86065268 | 41.43842322 | 22.525 | 22.616 | 22.362 | 22.359 | 22.729 | 22.704 | 22.114 | 22.021 | 21.965 | 21.865 | 21.827 | 21.585 |
| 10.860653 | 41.43563822 | 28.765 | 99.999 | 26.253 | 99.999 | 22.481 | 22.427 | 19.303 | 19.308 | 18.169 | 18.175 | 17.086 | 17.099 |
| 10.86065355 | 41.44038206 | 31.363 | 99.999 | 31.311 | 99.999 | 26.655 | 26.603 | 22.013 | 22.006 | 20.306 | 20.306 | 18.973 | 18.988 |
| 10.86065372 | 41.43920687 | 26.731 | 99.999 | 26.185 | 99.999 | 25.609 | 25.802 | 24.889 | 25.148 | 24.625 | 99.999 | 24.457 | 99.999 |
| 10.86065452 | 41.43584972 | 28.891 | 99.999 | 26.218 | 99.999 | 24.649 | 24.703 | 22.634 | 22.649 | 21.929 | 22.029 | 21.152 | 21.145 |
| 10.86065506 | 41.44638759 | 30.342 | 99.999 | 28.582 | 99.999 | 24.538 | 24.628 | 20.886 | 20.891 | 19.591 | 19.584 | 18.445 | 18.454 |
| 10.86065509 | 41.45877434 | 30.293 | 99.999 | 27.207 | 99.999 | 25.15 | 24.777 | 22.683 | 22.459 | 21.79 | 21.713 | 20.892 | 20.835 |
| … | … | … | … | … | … | … | … | … | … | … | … | … | … |
| Density | Filter | Magnitude | Bias | RMS | DOLPHOT | Ratio |
|---|---|---|---|---|---|---|
| 0.04 | F275W | 16.0 | 0.005 | 0.015 | 0.002 | 7.4 |
| 0.04 | F275W | 16.5 | 0.005 | 0.012 | 0.003 | 4.0 |
| 0.04 | F275W | 17.0 | 0.006 | 0.012 | 0.004 | 3.1 |
| 0.04 | F275W | 17.5 | 0.007 | 0.011 | 0.005 | 2.3 |
| 0.04 | F275W | 18.0 | 0.009 | 0.012 | 0.006 | 2.0 |
| 0.04 | F275W | 18.5 | 0.011 | 0.016 | 0.008 | 1.9 |
| 0.04 | F275W | 19.0 | 0.013 | 0.018 | 0.010 | 1.8 |
| 0.04 | F275W | 19.5 | 0.015 | 0.023 | 0.013 | 1.7 |
| 0.04 | F275W | 20.0 | 0.018 | 0.029 | 0.017 | 1.7 |
| 0.04 | F275W | 20.5 | 0.022 | 0.037 | 0.022 | 1.7 |
| … | … | … | … | … | … | … |
| Brick | Field | Stellar DensityaaDensity of stars with 18.5F160W19.5 per arcsec2. | F275Wlim | F336Wlim | F475Wlim | F814Wlim | F110Wlim | F160Wlim |
|---|---|---|---|---|---|---|---|---|
| 21 | 15 | 0.041 | 25.06 | 26.04 | 27.97 | 26.85 | 26.11 | 25.16 |
| 9 | 2 | 0.185 | 24.96 | 25.95 | 27.60 | 26.03 | 24.99 | 23.99 |
| 5 | 10 | 0.516 | 24.83 | 25.90 | 27.34 | 25.17 | 23.80 | 22.88 |
| 3 | 5 | 1.549 | 24.81 | 25.87 | 26.25 | 23.89 | 22.72 | 21.70 |
| 1 | 5 | 4.304 | 24.64 | 25.34 | 25.41 | 23.05 | 21.89 | 20.68 |
| 1 | 10 | 7.532 | 24.41 | 25.08 | 24.72 | 22.39 | 21.07 | 19.99 |
| Brick | Field | Filter |
|---|---|---|
| 2 | 7 | F110W |
| 4 | 2 | F110W |
| 4 | 13 | F110W |
| 7 | 16 | F110W |
| 7 | 17 | F110W |
| 8 | 7 | F110W |
| 8 | 9 | F110W |
| 10 | 17 | F110W |
| 13 | 7 | F110W |
| 16 | 2 | F160W |
| 16 | 15 | F110W |
| 17 | 4 | F110W |
| 17 | 18 | F110W |
| 18 | 3 | F110W |
| 18 | 7 | F110W |
| 18 | 13 | F110W |
| 18 | 14 | F110W |
| 18 | 15 | F110W |
| 21 | 6 | F110W |
| 22 | 2 | F160W |
| 22 | 3 | F160W |
| 22 | 7 | F160W |
| 22 | 8 | F110W |
| 22 | 13 | F160W |
| 22 | 14 | F110W |
| 23 | 11 | F110W |
| 23 | 13 | F110W |
| 23 | 14 | F110W |
| 23 | 14 | F110W |
| 23 | 15 | F110W |
| 23 | 15 | F160W |


