HST FUV monitoring of TW Hya
Abstract
Classical T Tauri stars (CTTS) are young ( Myr), cool stars that actively accrete matter from a disk. They show strong, broad and asymmetric, atomic FUV emission lines. Neither the width, nor the line profile is understood. Likely, different mechanisms influence the line profile; the best candidates are accretion, winds and stellar activity. We monitored the C iv 1548/1550 Å doublet in the nearby, bright CTTS TW Hya with the Hubble Space Telescope Cosmic Origin Spectrograph (HST/COS) to correlate it with i) the cool wind, as seen in COS NUV Mg II line profiles, ii) the photometric period from joint ground-based monitoring, iii) the accretion rate as determined from the UV continuum, and iv) the H line profile from independent ground-based observations. The observations span 10 orbits distributed over a few weeks to cover the typical time scales of stellar rotation, accretion and winds. Here we describe a model with intrinsically asymmetric C IV lines.
1Harvard-Smithsonian Center for Astrophsics, 60 Garden St, Cambridge, MA 02138,USA
2Hamburger Sternwarte, Gojenbergsweg 112, 21029 Hamburg, Germany
3IAFE/Conicet, Casilla de Correo 67, Buenos Aires, Argentina
1. Introduction
Young cool stars are surrounded by a circumstellar disk. As long as they actively accrete from the disk, they are called classical T Tauri star (CTTS). For a general review about CTTS see Günther (2013) in the proceeding of the previous Cool Stars workshop. Here we present new data on the closest CTTS known to date, the star TW Hya (57 pc, Wichmann et al., 1998). In CTTS, the disk does not reach down to the stellar surface but it is truncated at a few stellar radii. From that point on, material is funneled along the lines of the stellar magnetic fields. TW Hya is one of the oldest known CTTS, and thus the accretion rate from the disk onto the star is low. Still, the mass is accelerated almost to free-fall velocities (about 500 km s-1) and when it hits the stellar surface a strong accretion shock forms. This shock is the energy source for a range of phenomena that distinguish a CTTS spectrum from a main-sequence star.
2. The accretion shock in CTTS
The temperature of the accretion shock is high enough to cause X-ray emission. Kastner et al. (2002) noticed unusual line ratios in the He-like oxygen triplet of O vii, that indicate the region where the X-rays are formed is much denser than typical stellar coronae. Günther et al. (2007) performed numerical simulations and matched a model that mixed an accretion shock with a stellar corona to the observed X-ray spectrum. Yet, Brickhouse et al. (2010) could show that the densities observed in Ne ix are higher than in O vii, contrary to the expectation of shock models. This led them to propose that only the Ne ix emission is really formed in the post-shock region that extends from the shock front down into the stellar atmosphere, while the O vii emission comes from material that is heated in the shock front but then escapes “sideways” into the transition region and lower corona. Because material in the transition region experiences lower pressures than material deeper in the stellar atmosphere, its density will be lower.
Here, we will show how the same scenario might also explain the line profiles observed in atomic FUV emission lines. From the FUV to the IR, the accretion shock also powers an additional continuum, the so-called “veiling” that reduces the relative strength of the absorption lines. According to the model of Calvet & Gullbring (1998) this component originates in regions close to the cooling zone that are heated by the energetic radiation of the hot, post-shock layers. This component is often fitted as a black-body of a few thousand K, but recently Dodin & Lamzin (2012, 2013) have argued that it fills up stellar absorption lines, too.
3. Observations
We monitored the C iv 1548/1550 Å doublet in the TW Hya with the Hubble Space Telescope Cosmic Origin Spectrograph (HST/COS) for 10 orbits distributed over a few weeks to cover the typical time scales of stellar rotation, accretion and winds. The ObsID is 12315 and all automatic data processing worked normally. Data were retrieved from the archive and processed using custom python scripts. We measured the radial velocities of molecular hydrogen lines and interstellar absorption lines and found a velocity precision better than 6 km s-1 for the FUV channel and better than 15 km s-1 for the NUV channel. For the purposes of this contribution, this is sufficient; we will correct the velocity scale using this measurement in our paper (in prep.).
4. Results
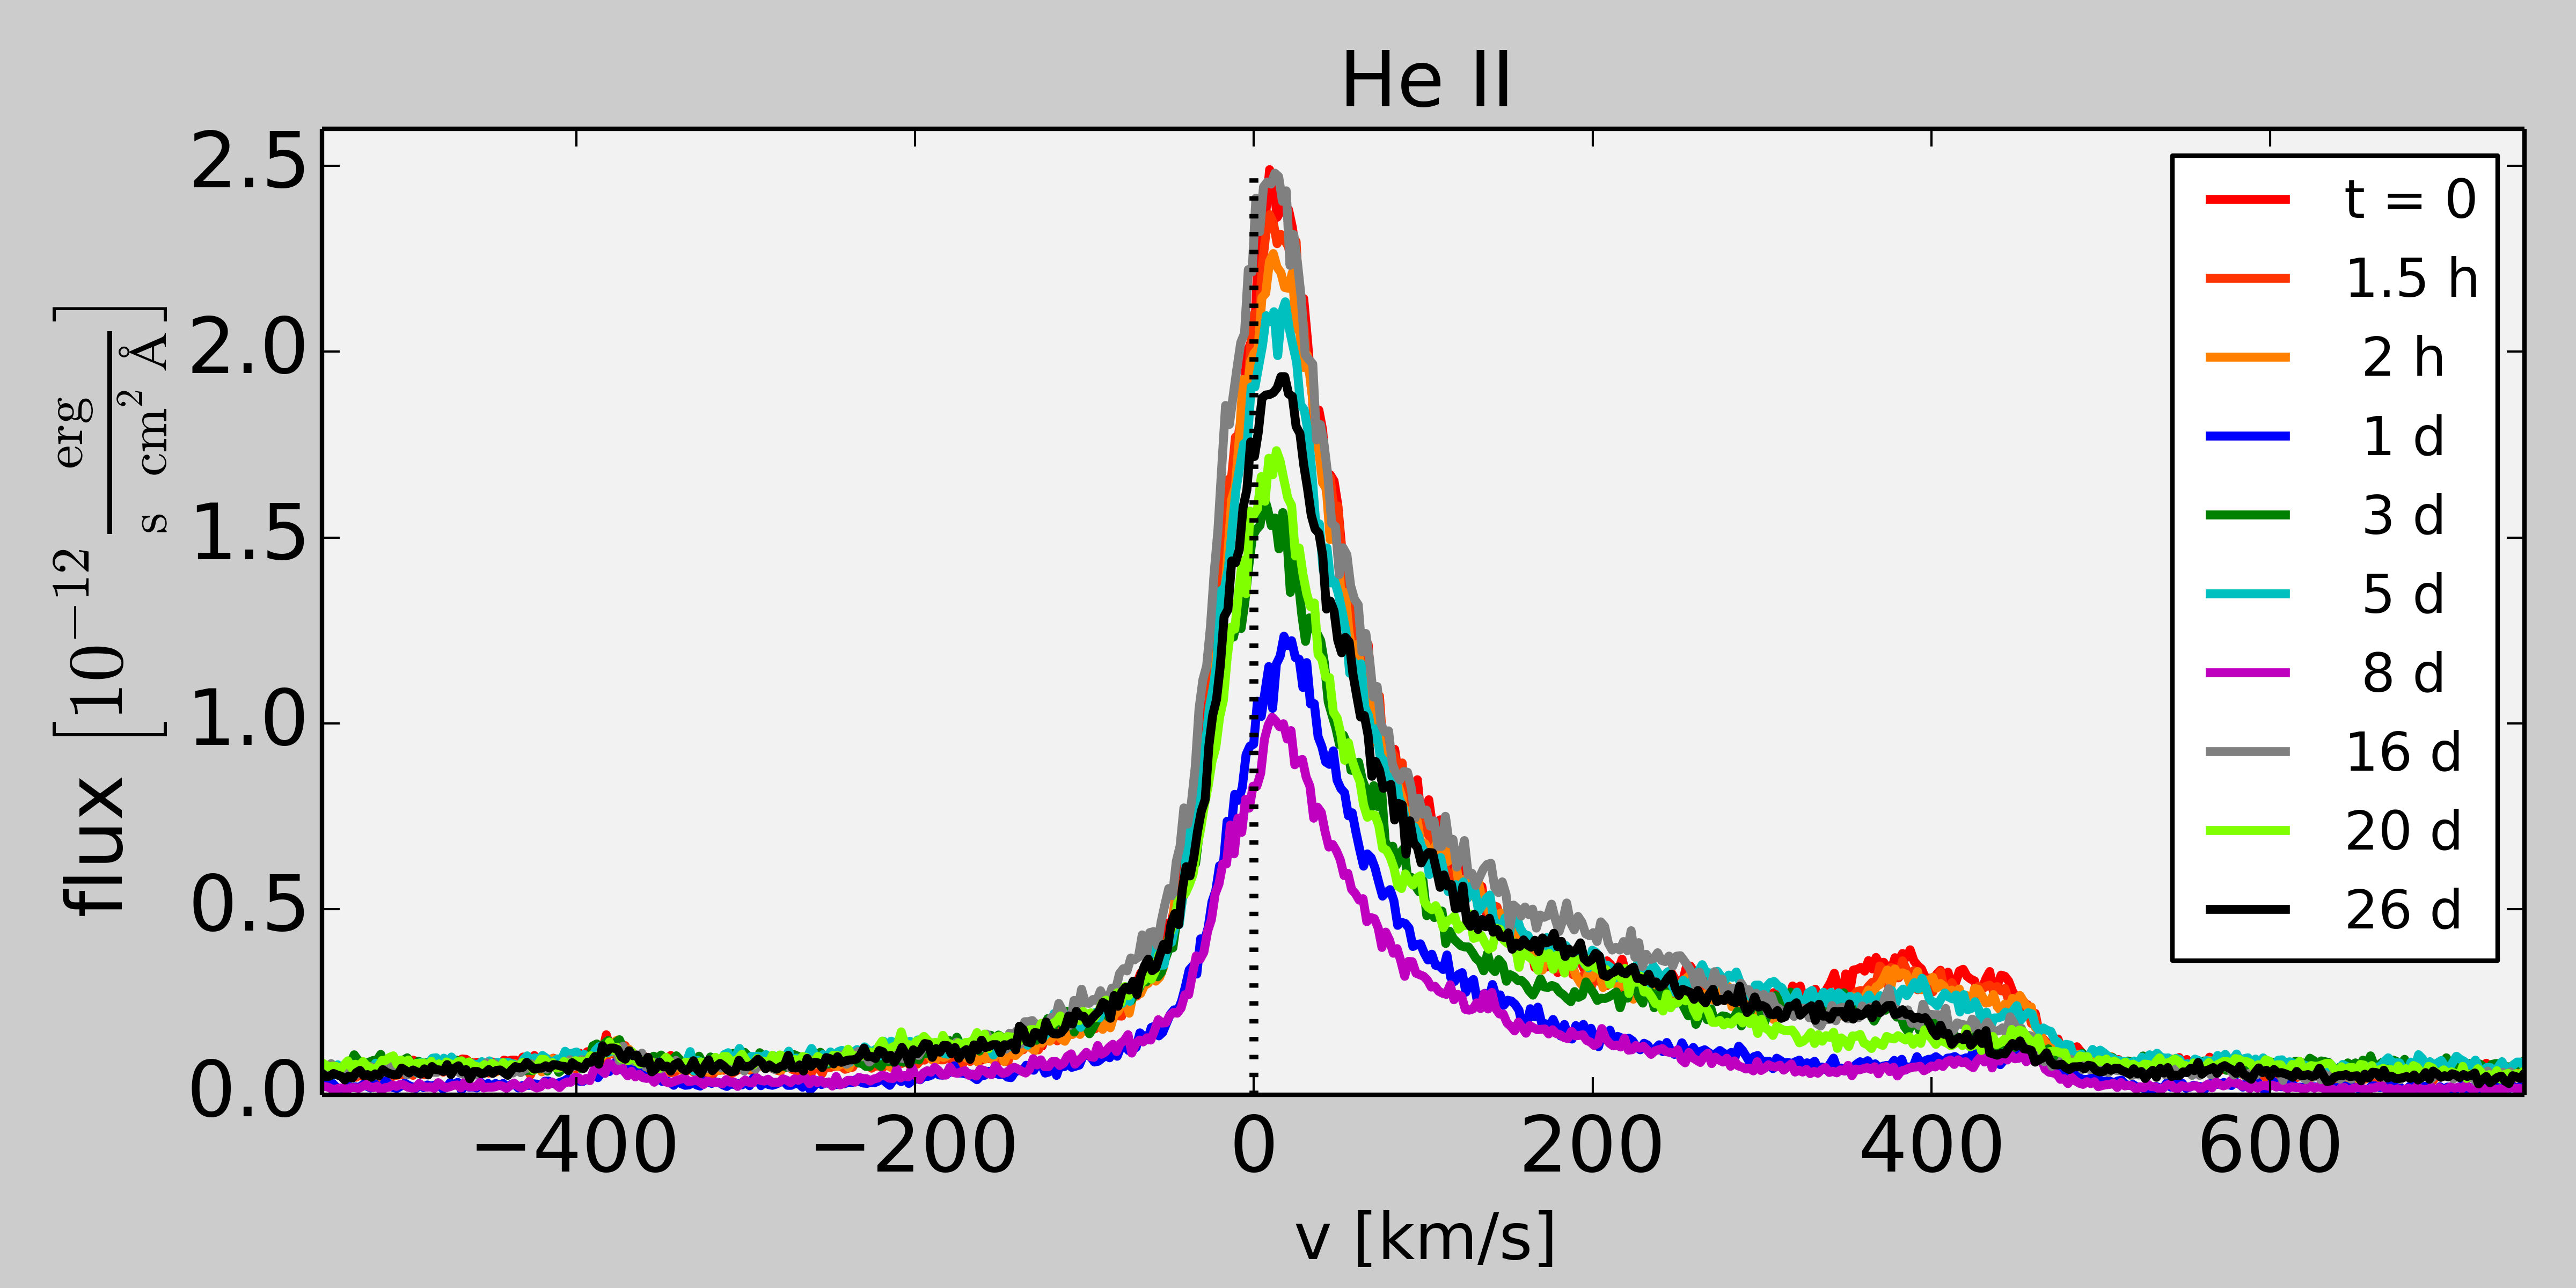
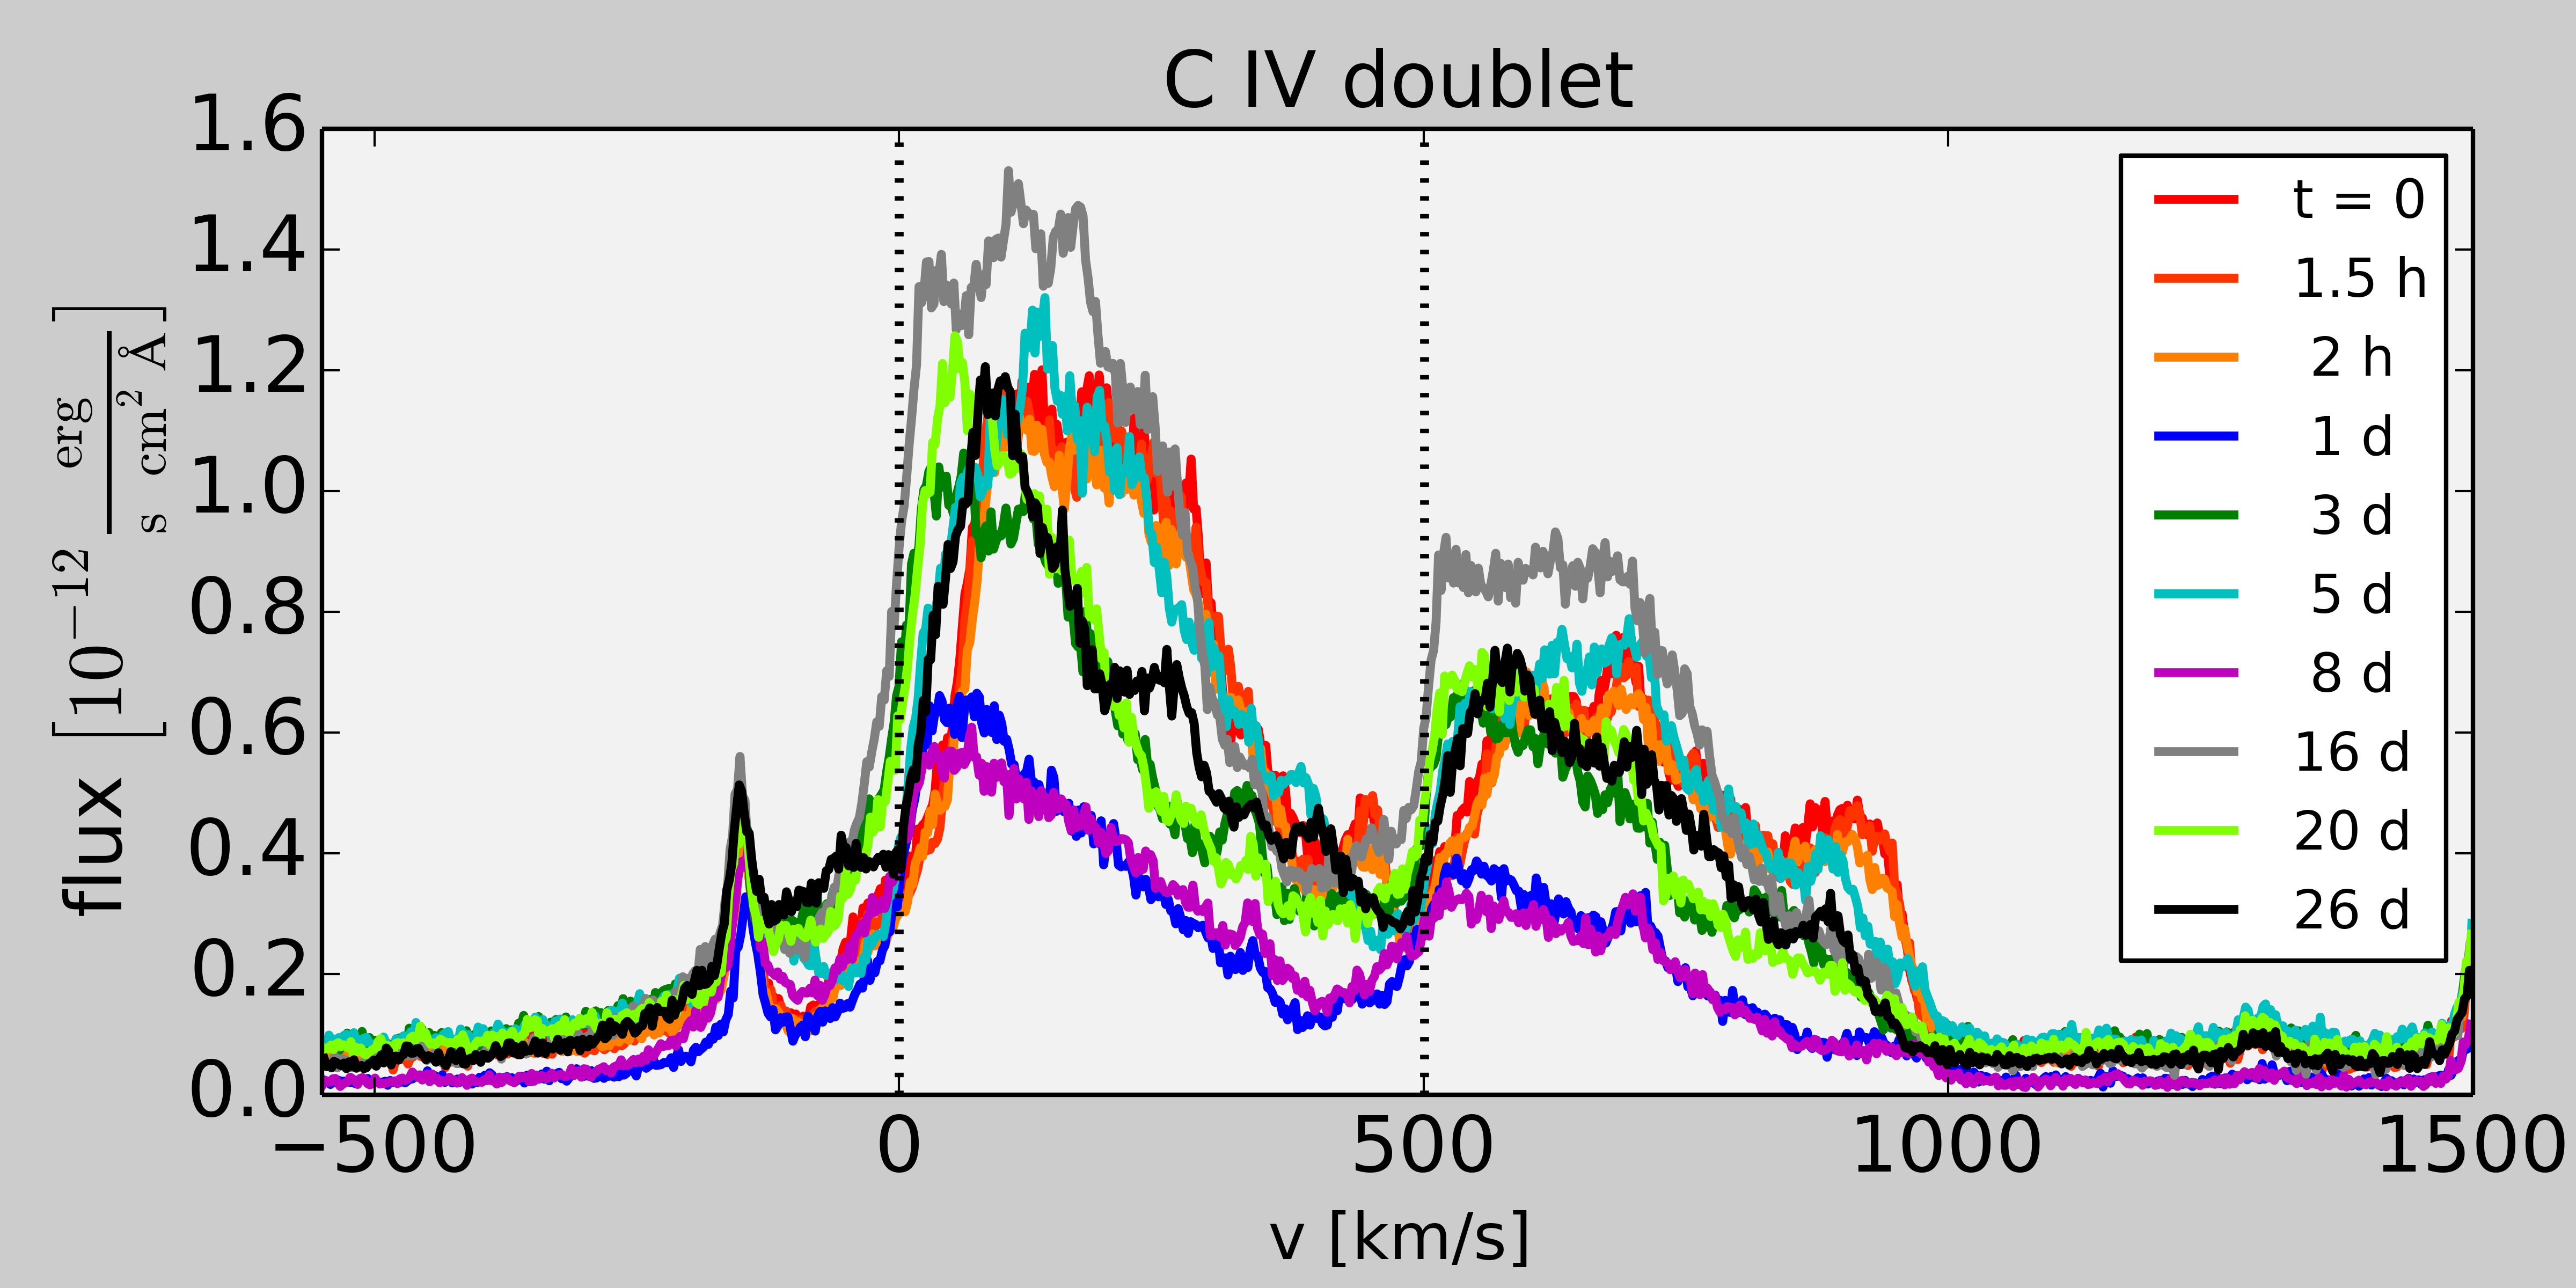
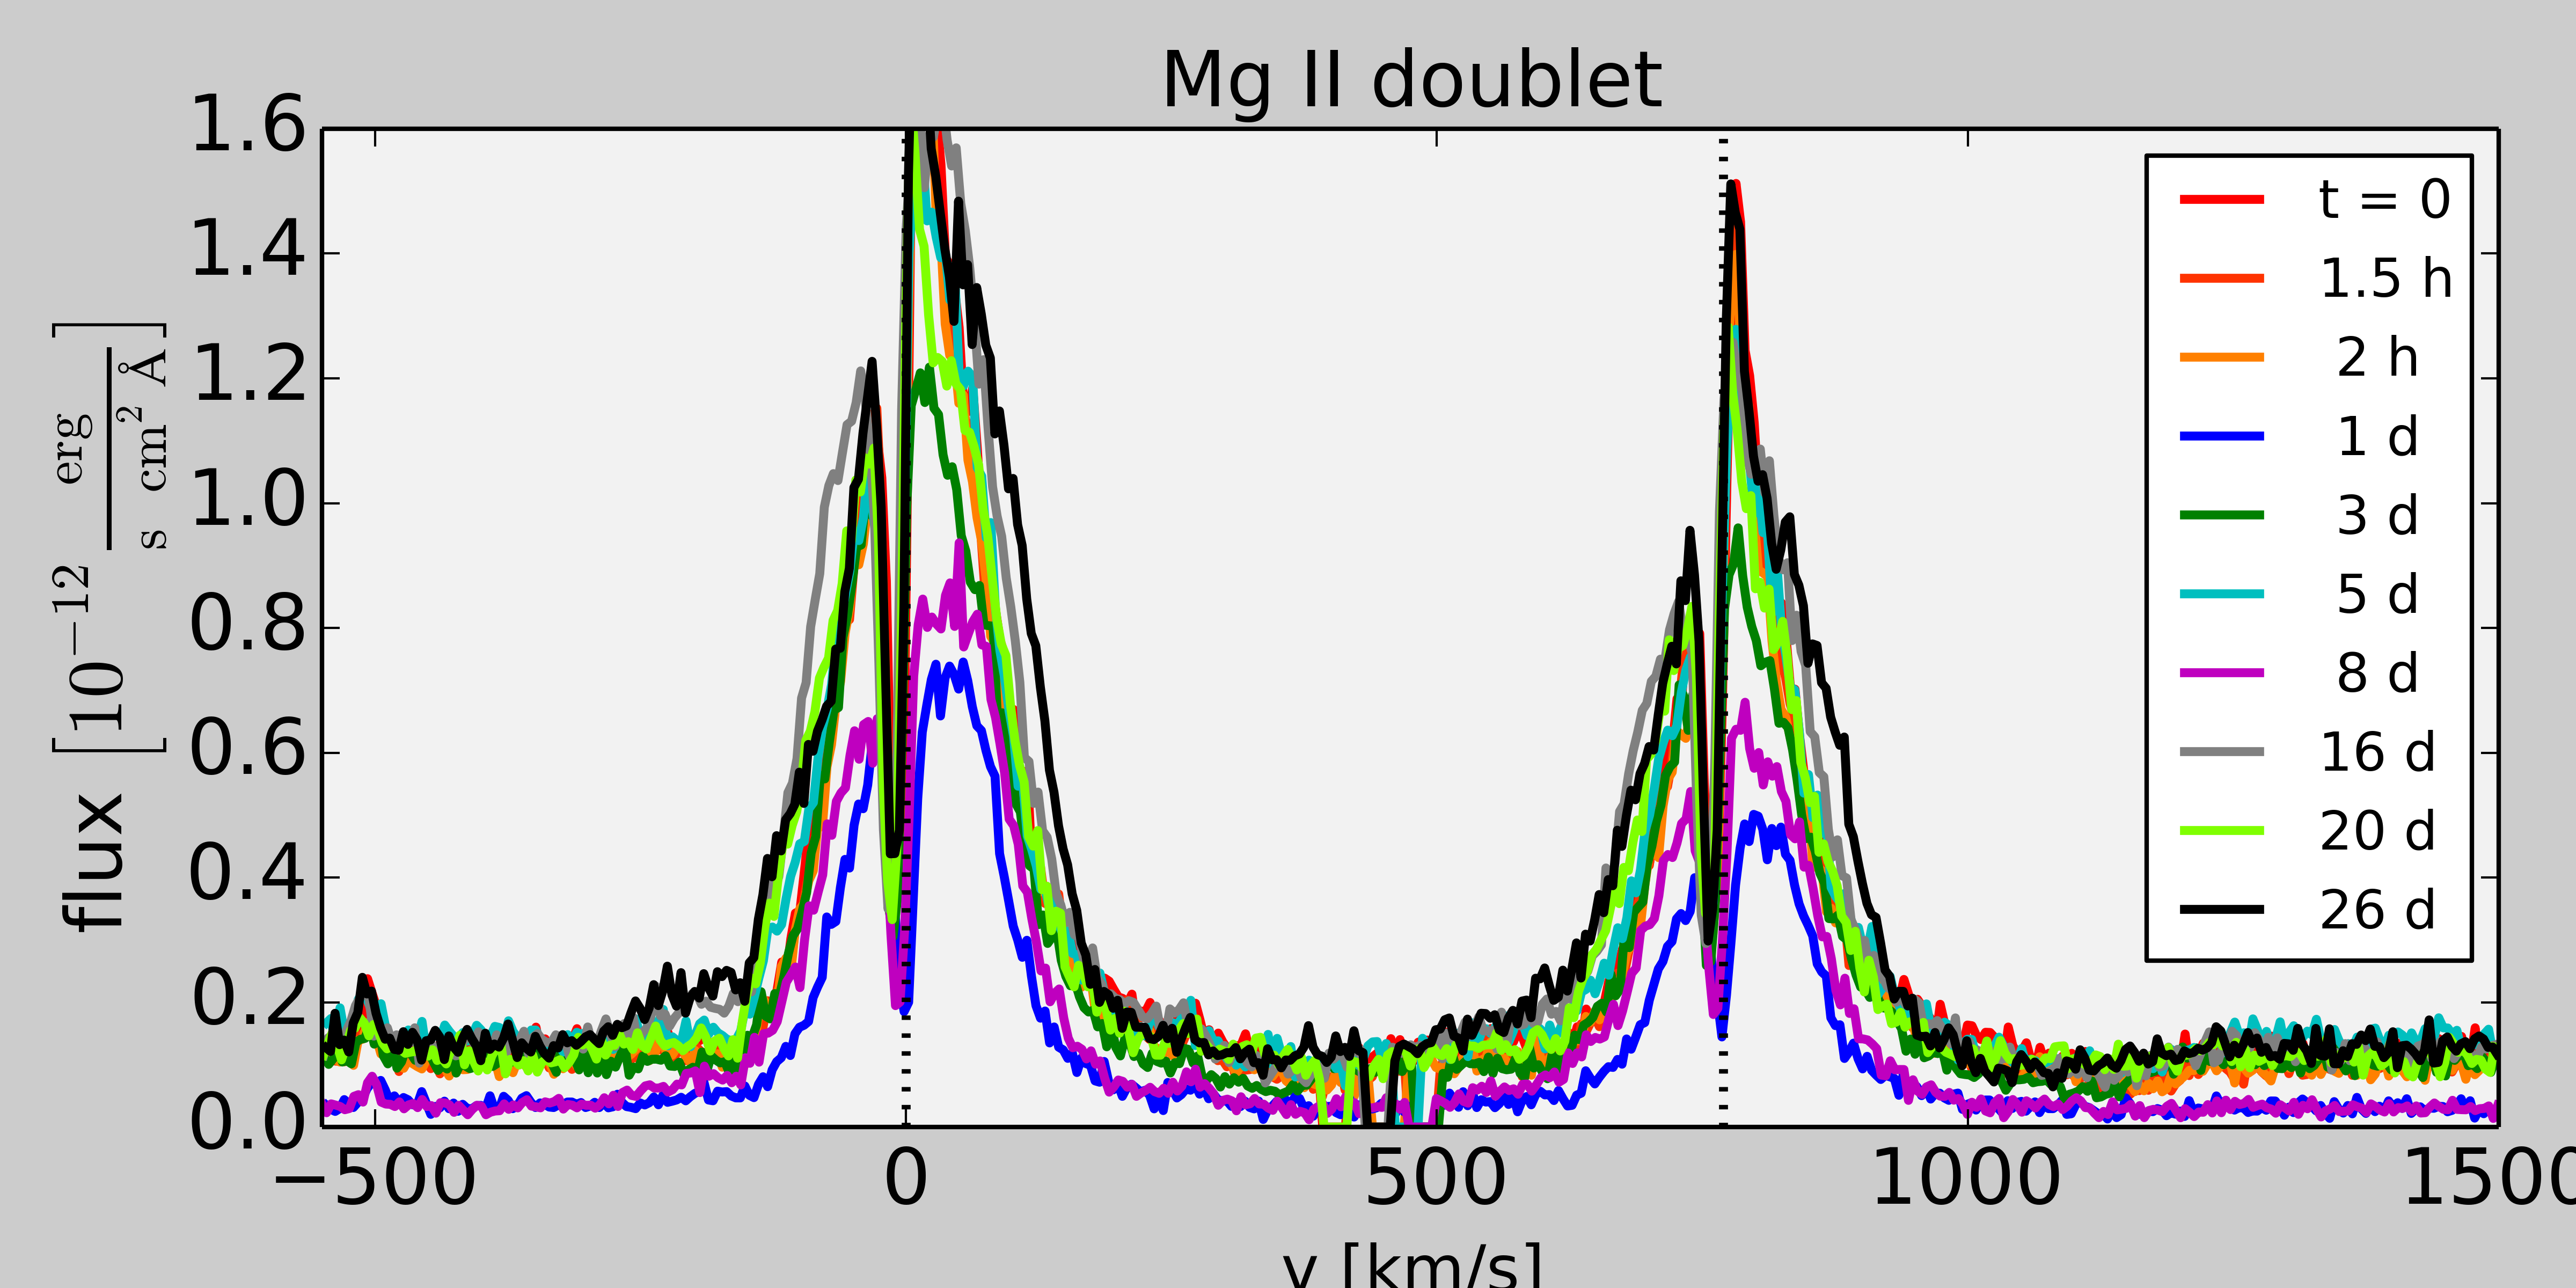
Figure 1 to 3 show the line profiles of the strongest FUV emission lines. In addition to these atomic lines, there are a large number of ro-vibrational molecular hydrogen lines. These lines are formed in the inner disk through photo-excitation by strong FUV emission lines (Herczeg et al., 2002, 2004). Their variability will be analyzed in a forthcoming publication.


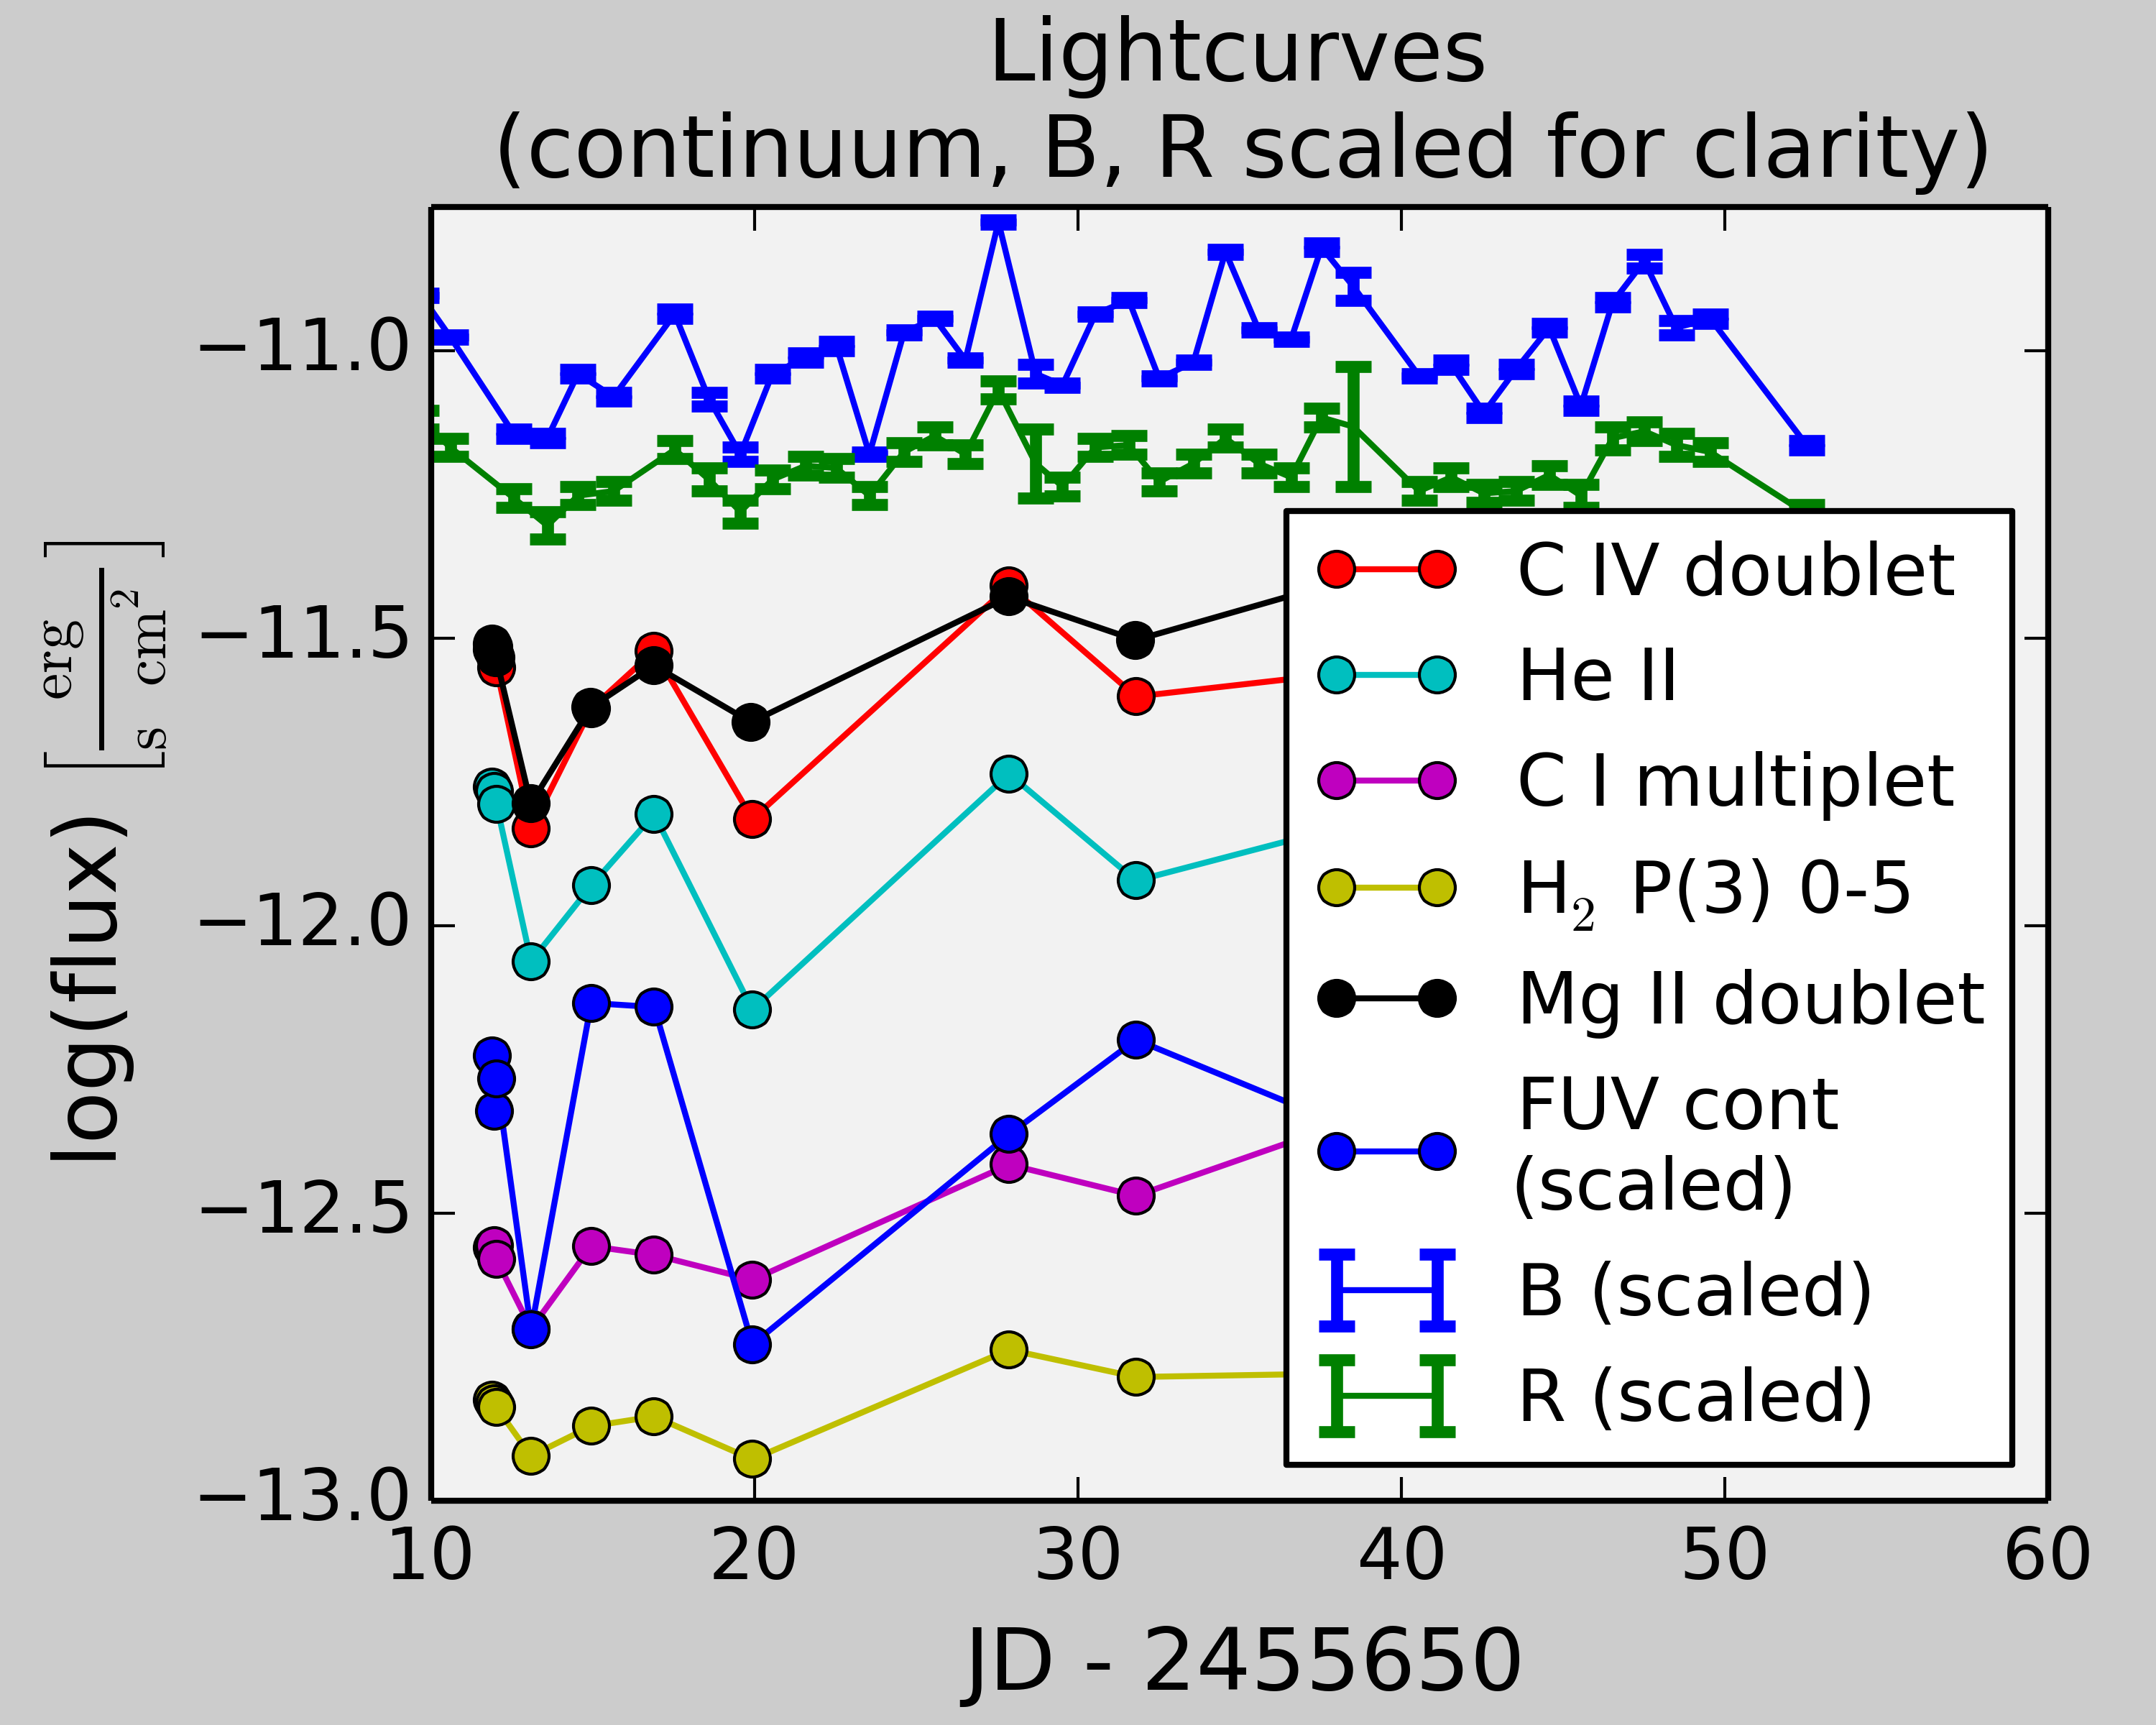
In all three figures there is clearly a continuum. We have performed a number of tests (e.g. we have extracted only the time in the earth shadow and compared that to the day-time data) and found no hint for an instrumental origin, we thus conclude that the continuum comes from TW Hya. It varies in phase with the emission lines. When the emission lines are stronger, so is the continuum (Fig. 4); the amplitude of the continuum variation is about a factor of three.
Figure 1 shows the He ii line profile, which is the simplest of the strong FUV lines. It peaks close to the rest wavelength and its peak position is virtually constant in all observations as is the shape of the line. The only exception is an emission bump around 400 km/s that appears in the first three spectra.
A similar bump is seen in the C iv line in figure 2 for the same spectra at the same velocity. C iv is a doublet, where the blue line should be twice as strong as the red line if there is no optical depth. In the figure, the velocity scale is calculated with respect to the blue line. There is little flux on the blue side of the line. The flux then rises sharply close to the rest wavelength (the exact value varies between 0 and 100 km/s). The shape of the blue side of the line is highly variable, but in all cases the line extends to about 500 km/s.
The Mg ii doublet in figure 3 has a simple shape again. It is almost symmetric, centered on the rest wavelength and has a very narrow interstellar absorption line superposed.
In the following we concentrate on the interpretation of the C iv line.

5. Interpretation
If we want to interpret the C iv line in the context of an accretion shock emission model, then we expect a line that has no blue wing (since all material moves away from us into the star and the far side of the star is hidden from view), has a first peak close to the rest wavelength and a second peak close to the pre-shock velocity (Lamzin, 2003). We can make three important observations from the line profile:
-
1.
The line rises always at slightly red-shifted velocities between 0 and +100 km/s. We do not have enough points in time to find a pattern. We conclude that absorption happens between the accretion spot and us.
-
2.
The emission line at -100 km/s is not absorbed (Johns-Krull & Herczeg, 2007), thus there can be no hot wind which contains C iv between the disk and us. A full discussion of a hot wind model is beyond the scope of this contribution, but hot winds might still be possible, if they have the right temperature profile.
-
3.
We see no absorption below the continuum (e.g. a P-Cyg profile), thus there is no hot outflow with C iv between the continuum emission (presumably the accretion shock) and us.
6. Model
We think that a model with five components can explain the observed profiles. At first sight that might seems like a very complicated model, but all of the five components are already well established from observations in other wavelength bands.
- Transition region
-
Ardila et al. (2013) observed that even non-accreting T Tauri stars show some C iv emission, presumably from active regions and the transition region. However, this component is negligibly weak for TW Hya.
- Pre-shock accretion column
-
Gas just before the impact on the stellar surface moves with the free-fall velocity (about 400 km/s for TW Hya) and is already ionized due to the radiation field in this region (Lamzin, 2003).
- Post-shock cooling zone
-
Most of the emission comes from this region. After the shock front the material slows down, but continues to move deeper into the star. Thus, the peak of the emission is redshifted by a small velocity only (Lamzin, 2003). In this region, the flow becomes turbulent and the line width exceeds 200 km/s.
- Mass spill-up
-
Some post-shock gas can escape from the accretion funnel into the transition region according to simulations (Orlando et al., 2010). This mass is clearly hot enough to contain C iv and will cause line absorption. Its velocity is uncertain, but must be lower than the free-fall velocity. If this flow is time variable (because the material escapes from a turbulent region), then the absorption can switch on and off, depending on the amount of material in the line-of-sight and thus the point where the observed flux rises can change between 0 and 100 km/s.
- Heated photosphere
-
Last, the heated photosphere around the accretion shock will emit as a blackbody as discussed above. This can explain the continuum. Since this is a large emission region, it is not affected by the absorption due to the previous component.
7. Summary
TW Hya is an accreting CTTS. We present the first results of our analysis of ten COS spectra, taken in the FUV and NUV. Atomic lines are strong and highly variable in the observation. We show that accretion shock emission is one possible model for the observed line variability.
References
- Ardila et al. (2013) Ardila, D. R., et al. 2013, ApJS, 207, 1
- Astropy Collaboration et al. (2013) Astropy Collaboration et al. 2013, A&A, 558, A33
- Brickhouse et al. (2010) Brickhouse, N. S., Cranmer, S. R., Dupree, A. K., Luna, G. J. M., & Wolk, S. 2010, ApJ, 710, 1835
- Calvet & Gullbring (1998) Calvet, N., & Gullbring, E. 1998, ApJ, 509, 802
- Dodin & Lamzin (2012) Dodin, A. V., & Lamzin, S. A. 2012, Astronomy Letters, 38, 649
- Dodin & Lamzin (2013) —. 2013, Astronomy Letters, 39, 389
- Dupree et al. (2014) Dupree, A. K., Brickhouse, N. S., Cranmer, S. R., Berlind, P., Strader, J., & Smith, G. H. 2014, ApJ, 789, 27
- Dupree et al. (2005) Dupree, A. K., Brickhouse, N. S., Smith, G. H., & Strader, J. 2005, ApJ, 625, L131
- Günther (2013) Günther, H. M. 2013, Astronomische Nachrichten, 334, 67
- Günther et al. (2007) Günther, H. M., Schmitt, J. H. M. M., Robrade, J., & Liefke, C. 2007, A&A, 466, 1111
- Herczeg et al. (2002) Herczeg, G. J., Linsky, J. L., Valenti, J. A., Johns-Krull, C. M., & Wood, B. E. 2002, ApJ, 572, 310
- Herczeg et al. (2004) Herczeg, G. J., Wood, B. E., Linsky, J. L., Valenti, J. A., & Johns-Krull, C. M. 2004, ApJ, 607, 369
- Johns-Krull & Herczeg (2007) Johns-Krull, C. M., & Herczeg, G. J. 2007, ApJ, 655, 345
- Kastner et al. (2002) Kastner, J. H., Huenemoerder, D. P., Schulz, N. S., Canizares, C. R., & Weintraub, D. A. 2002, ApJ, 567, 434
- Lamzin (2003) Lamzin, S. A. 2003, Astronomy Reports, 47, 540
- Orlando et al. (2010) Orlando, S., Sacco, G. G., Argiroffi, C., Reale, F., Peres, G., & Maggio, A. 2010, A&A, 510, A71+
- Pérez & Granger (2007) Pérez, F., & Granger, B. E. 2007, Computing in Science and Engineering, 9, 21
- Wichmann et al. (1998) Wichmann, R., Bastian, U., Krautter, J., Jankovics, I., & Rucinski, S. M. 1998, MNRAS, 301, L39+