Lower-Luminosity Galaxies could reionize the Universe: Very Steep Faint-End Slopes to the Luminosity Functions at -8 from the HUDF09 WFC3/IR Observations11affiliation: Based on observations made with the NASA/ESA Hubble Space Telescope, which is operated by the Association of Universities for Research in Astronomy, Inc., under NASA contract NAS 5-26555.
Abstract
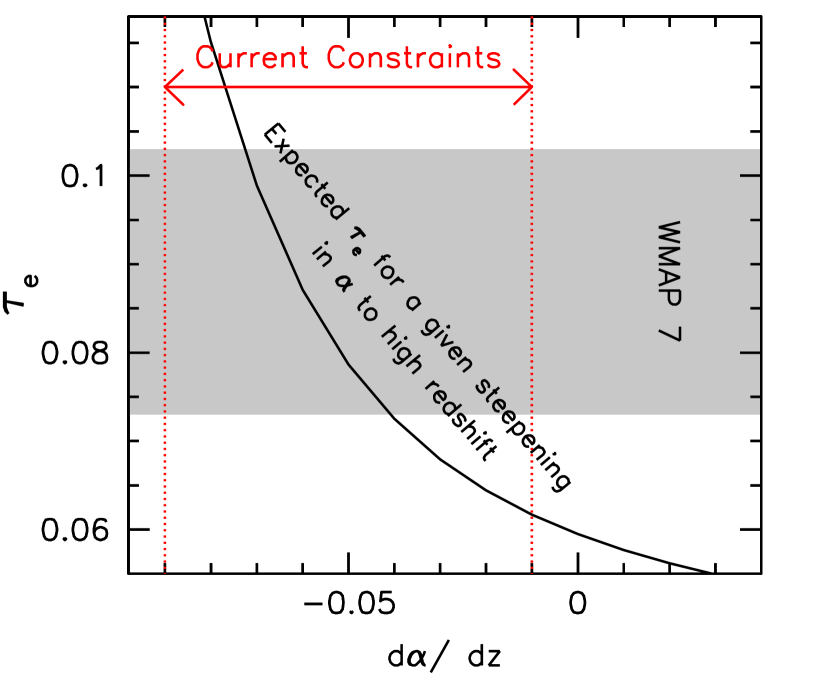
The HUDF09 data are the deepest near-IR observations ever, reaching to 29.5 mag. Luminosity functions (LF) from these new HUDF09 data for 132 and galaxies are combined with new LFs for -6 galaxies and the earlier LF to reach to very faint limits (). The faint-end slopes are steep: (), (), (), and (). Slopes lead to formally divergent UV fluxes, though galaxies are not expected to form below AB mag. These results have important implications for reionization. The weighted mean slope at -8 is 1.870.13. For such steep slopes, and a faint-end limit of AB mag, galaxies provide a very large UV ionizing photon flux. While current results show that galaxies can reionize the universe by , matching the Thomson optical depths is more challenging. Extrapolating the current LF evolution to , taking to be 1.870.13 (the mean value at -8), and adopting typical parameters, we derive Thomson optical depths of . However, this result will change if the faint-end slope is not constant with redshift. We test this hypothesis and find a weak, though uncertain, trend to steeper slopes at earlier times (), that would increase the Thomson optical depths to , consistent with recent WMAP estimates (). It may thus not be necessary to resort to extreme assumptions about the escape fraction or clumping factor. Nevertheless, the uncertainties remain large. Deeper WFC3/IR+ACS observations can further constrain the ionizing flux from galaxies.
Subject headings:
galaxies: evolution — galaxies: high-redshift1. Introduction
One of the most important questions in observational cosmology regards the reionization of the neutral hydrogen in the universe. How did reionization occur and which sources caused it? Observationally, we have constraints on reionization from the Gunn-Peterson trough in luminous high-redshift quasars (Fan et al. 2002), the Thomson optical depths observed in the Microwave background radiation (Komatsu et al. 2011), and the luminosity function and clustering properties of Ly emitters (e.g., Ouchi et al. 2010). Reionization appears to have begun at least as soon as (e.g., Komatsu et al. 2011) and finished no later than (e.g., Fan et al. 2007; Ouchi et al. 2010).
Due to the very low volume densities of QSOs at high redshift (e.g., Willott et al. 2010) and the lack of evidence for other ionizing sources (e.g., self-annihilating dark matter), star-forming galaxies represent the most obvious source of ionizing photons. However, given the low volume densities of galaxies at high luminosities, the central question at present is whether reionization can be accomplished through a substantial population of very faint galaxies. Such a population is expected in many theoretical models (e.g., Trenti et al. 2010; Salvaterra et al. 2011) and could, in principle, be identified directly through extraordinarily deep observations (beyond what is practical) or indirectly through the measurement of the faint-end slope of the luminosity function and extrapolation to fainter limits.
The availability of the recently-obtained and deepest-ever near-IR WFC3/IR observations over the Hubble Ultra Deep Field (HUDF: Beckwith et al. 2006) with the HUDF09 program (GO 11563: PI Illingworth) provide us with our best opportunity yet to quantify the prevalence of very low-luminosity galaxies and the faint-end slope. These observations reach to 29.4-29.8 mag at (2.5 mag beyond at -8), 0.4 mag deeper than the WFC3/IR observations available from the first year of the HUDF09 program (Bouwens et al. 2010; Oesch et al. 2010a).
Here we take advantage of these new observations to quantify the prevalence of extremely faint galaxies at and explore their likely role in the reionization of the universe. Our LFs at -6 expand on the results of Bouwens et al. (2007) and take advantage of the deep WFC3/IR observations. These data reach 0.5 mag deeper than the existing -band observations over the HUDF and two HUDF05 fields. The -8 LFs we utilize also rely on the full two-year HUDF09 data and were recently described in Bouwens et al. (2011b). We use these LFs to quantify how the UV LFs and in particular the faint-end slope depends on cosmic time. We then calculate the flux in ionizing photons and the filling factor of ionized hydrogen as a function of redshift and discuss the impact that the faint galaxy population has on reionization. The challenge will be to match the large Thomson optical depths observed; recent results (Oesch et al. 2009; see also Figure 3 here) have already shown that observed galaxies can reionize the universe by . For ease of comparison with previous studies, we adopt the concordance cosmology , , and km s-1Mpc-3. AB magnitudes (Oke & Gunn 1983) are adopted throughout.
2. Observations
Table 1 summarizes the search fields used for the -8 LF determinations and the approximate depths of the available ACS+WFC3/IR observations. Our primary data set consists of the full two-year WFC3/IR observations of the HUDF and two flanking fields obtained with the 192-orbit HUDF09 program (PI Illingworth: GO 11563). Our second data set is the 145 arcmin2 ACS+WFC3/IR observations over the wide-area Early Release Science (Windhorst et al. 2011) and CDF-South CANDELS (Grogin et al. 2011; Koekemoer et al. 2011) observations. We do not use the CANDELS observations for the -8 LFs since it is difficult to cleanly separate and galaxies without /-band observations. Such observations are still lacking over most of the area.111While the -band observations were not available over the CDF-South CANDELS field when we derived the LFs described here, they are now available and have been used to improve the LF constraints at (e.g., Oesch et al. 2012b).
3. Results
3.1. Sample Selection and Possible Contamination
The new and galaxy samples are identified to be 5 sources in small -diameter apertures, after first PSF-matching the ACS+WFC3/IR data to the WFC3/IR -band observations. Our selection criteria for our sample is identical to the -dropout selection used by Bouwens et al. (2007) and the selection uses the two-color criteria (also similar to the Bouwens et al. 2007 criterion). Sources must be undetected at 2 in any band blueward of the Lyman break, at in two such bands, or in the image constructed from all data blueward of the break (Bouwens et al. 2011b).
Applying these criteria to our five search fields (HUDF09, HUDF09-1, HUDF09-2, ERS, and CDF-S CANDELS), we find 507 -dropout galaxies and 203 -dropout galaxies (Table 1).
The only substantial source of contamination for our -6 samples is from noise in our photometry and is estimated using the same simulation techniques described in §3.5.5 of Bouwens et al. (2011b) for our -8 samples. These simulations suggest a 10% contamination rate overall, with less contamination (%) at brighter magnitudes and more contamination (10-20%) at fainter magnitudes; we have corrected the observed numbers accordingly. Other possible sources of contamination include low-mass stars, spurious sources, and transient sources (SNe), but we estimate their contribution to be small (1%: see Bouwens et al. 2011b). For more details on the selection, we refer readers to R.J. Bouwens et al. (2012, in prep).
3.2. Luminosity Functions
The present samples of and galaxies allow us to extend current determinations of the -6 LF to even fainter magnitudes. In deriving the LFs, we utilize the same maximum-likelihood procedures as described in Bouwens et al. (2007) and Bouwens et al. (2011b: similar to those used by Sandage et al. 1979 and Efstathiou et al. 1988). As in Bouwens et al (2011b) we derive the LFs by two approaches: (1) with a stepwise determination that allows for a relatively model-independent determination of the shape of the LF and (2) assuming the Schechter form and deriving the best-fit parameters.
Selection volumes are estimated by adding model galaxies to the observations and selecting them using the same procedure as with real sources. The model galaxy images are created by artificially redshifting similar-luminosity -dropout galaxies from the HUDF (our deepest data set), scaling their sizes as to match the observed size-redshift scalings (e.g., Oesch et al. 2010b). We assume the colors of the sources are distributed as found by Bouwens et al. (2011c).
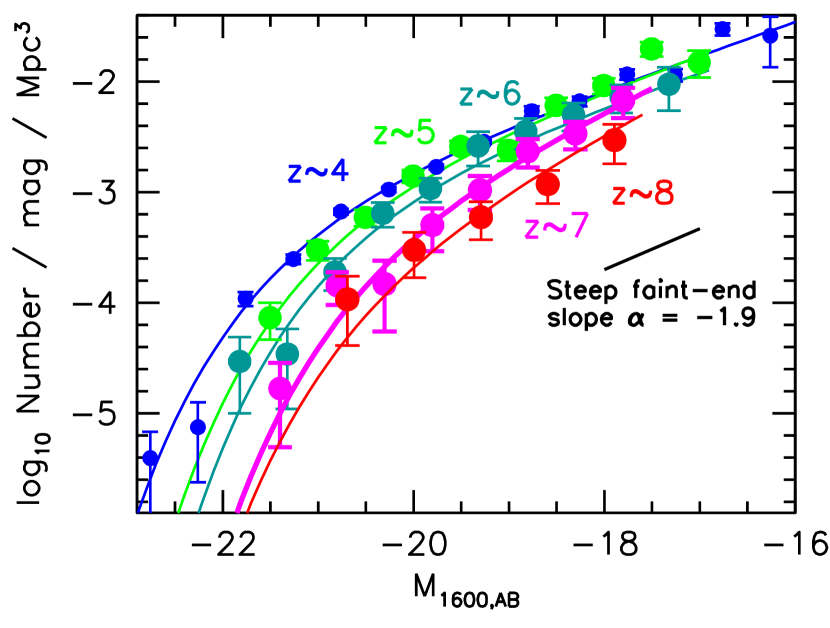
Our stepwise LFs and separately-established Schechter functions are presented in Figure 1 as the solid points and dashed lines, respectively. Encouragingly, the Schechter form appears to be generally well-matched to the stepwise determination (solid points), with the possible exception of the LF where the stepwise LF appears to be shallower. However, as discussed in Bouwens et al. (2011), this is due to differences in the way our two fitting procedures cope with large-scale structure and two bright sources in the HUDF09-2 field. The best-fit Schechter parameters are provided in Table 1.
The faint-end slopes we determine for the LF at and are and , respectively, consistent with our previous determination (e.g., Bouwens et al. 2007) and a recent determination at by Su et al. (2011) given the large uncertainties. Despite similar formal uncertainties, the slopes are better determined, as they are less impacted by systematics uncertainties from the use of (1) deeper data and (2) a two-band LBG selection at . The quoted uncertainties include the large-scale structure variance (20% at -6: Trenti & Stiavelli 2008; Robertson 2010a).
4. The Faint-end Slope of the LF at and Best-Fit Evolution
These recent, new luminosity functions at z5, 6, 7 and 8, when combined with the existing deep z4 LF (Bouwens et al. 2007), provide our best opportunity yet to constrain the evolution of their faint-end slopes with redshift.
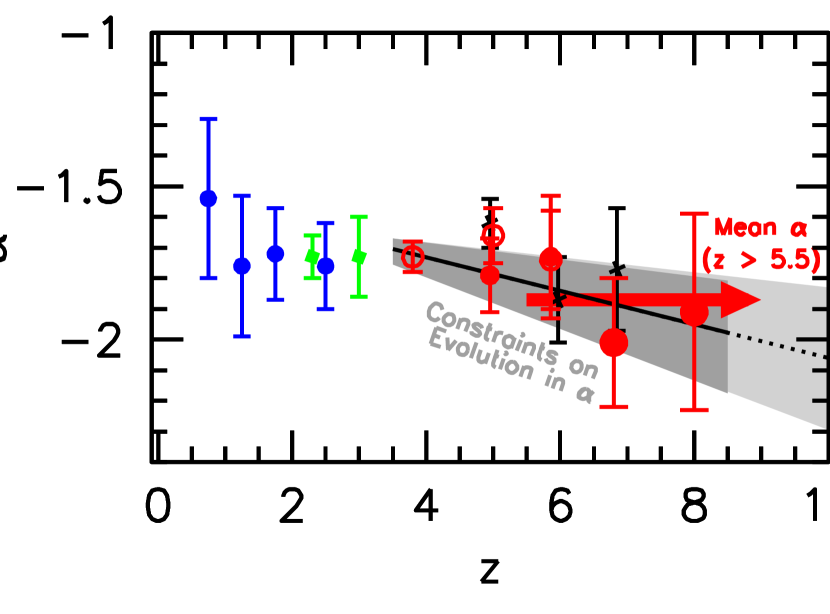
Figure 2 shows the derived values of the faint-end slope versus redshift. While the uncertainties are large, the faint-end slopes at appear to be slightly steeper than at lower redshifts. A simple averaging of our results at , 7, 8 yields 1.870.13. This is the best estimate of the faint-end slope that we have in the reionization epoch. However, we can also ask whether the data suggest some trend with cosmic time. Using LFs, we find the following best-fit trend in with redshift (taking into account the multi-variate distribution):
| (1) |
(see also Table 1). The faint-end slope is steeper at earlier times, but this of course is only of marginal significance (). Steepening of the faint-end slope would be consistent with various theoretical model predictions (e.g., Trenti et al. 2010; Salvaterra et al. 2011; Jaacks et al. 2012). While current evidence for evolution in is weak, this is an important first step in quantifying this evolution and assessing the impact of an evolving on reionization.
5. Implications for Reionization
The very steep faint-end slopes determined for the LFs at -8 have important implications for the role galaxies might play in the reionization of the universe. To investigate this, we consider an evolving LF with the faint-end slope equal to mean value found at -8 (Figure 1 and 2). The values of the and for our evolving LF are taken from our empirical fitting formula to the -8 LF results (see Table 1: derived as in Bouwens et al. 2008).
We compute the time evolution of the filling factor of ionized hydrogen using the following relation we adapted from Madau et al. (1999):
| (2) |
where is the escape fraction of Lyman-continuum photons into the IGM, corresponds to the comoving volume density of neutral hydrogen in the universe, corresponds to the recombination time for neutral hydrogen, and is the SFR density uncorrected for dust extinction. In deriving the SFR density, we integrate the LF down to mag, given the likely supression of galaxy formation at smaller scales from the UV background, SNe feedback, and inefficient gas cooling (e.g., Read et al. 2006; Dijkstra et al. 2004).
To account for the increased ionizing efficiency (by up to 30%) of low metallicity stars expected to make up galaxies in the early universe, we assume photons s-1 per yr-1 (Schaerer 2003). We take to be 20% motivated by the observations of Shapley et al. (2006) and Iwata et al. (2008), but acknowledge that is still very poorly determined at -3 and has not been determined at all at . The recombination time is taken to equal
| (3) |
where is the clumping factor of neutral hydrogen /3. Motivated by Bolton & Haehnelt (2007) and Pawlik et al. (2009), we adopt a clumping factor of 3.
These equations were derived from Eq. (11), Eq. (27), and Eq. (28) of Madau et al. (1999). We adopt only one free electron as appropriate for single-ionized helium (e.g., Chary 2008) and take (Komatsu et al. 2011). The above equation also assumes an IGM temperature of K around the time of reionization instead of the K assumed by Madau et al. (1999). This is to account for the substantial heating of the IGM due to the reionization process itself (Hui & Haiman 2003). The higher temperatures effectively double the time it takes atomic hydrogen to recombine (Stiavelli et al. 2004).
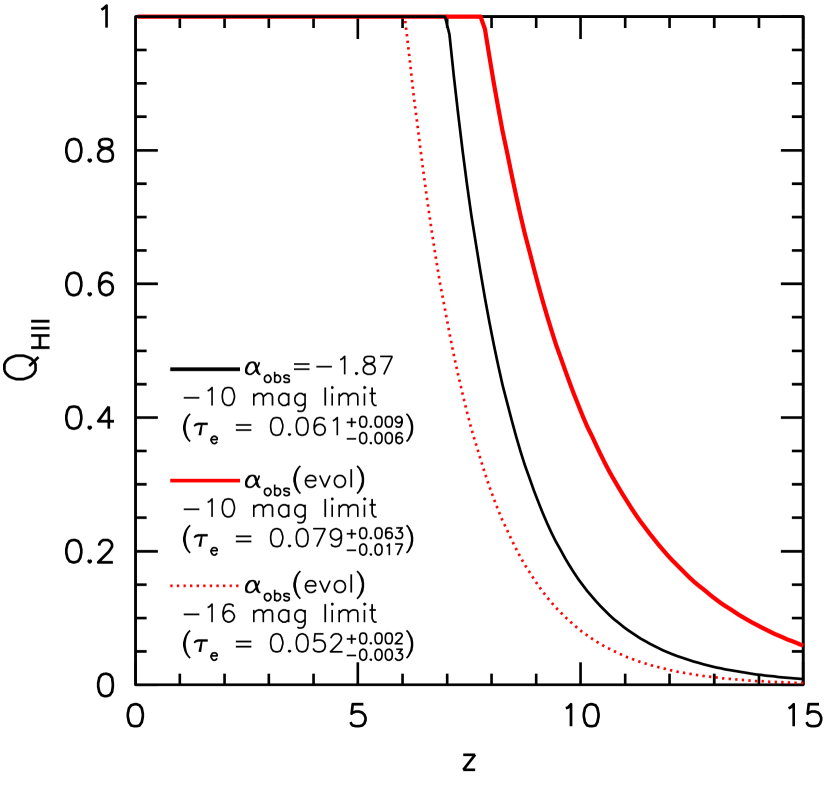
With these assumptions, our mean faint-end slope at -8, and parametrized evolution for and at (Table 1), we calculate the Thomson optical depth and the filling factor of ionized hydrogen versus redshift. These are shown in Figure 3. The filling factor of ionized hydrogen approaches unity at z7 and the Thomson optical depth is . This is short of the measured for the WMAP seven-year data set (Komatsu et al. 2011).
Our strongest result is based on the best estimate of the slope at -8. Of course, if the faint-end slope steepens at earlier times (as has been suggested by theory: Trenti et al. 2010), the impact of galaxies would be more substantial. Assuming that follows the best-fit evolution with redshift (Eq. 1), we repeat the calculations shown in Figure 3; we find that the universe is reionized by and the Thomson optical depth is (propagating the uncertainties on ). The derived optical depth extends to much larger values than using a fixed and is easily consistent with the values measured in the seven-year WMAP data. However the large uncertainties in the derived optical depths here point to the need to quantify the trend in vs. redshift, , at much greater precision.
The present estimates of the Thomson optical depths and contribution of galaxies to reionization are higher than in many purely observationally-based discussions (e.g., Bouwens et al. 2011a; Stark et al. 2007; Chary 2008; Oesch et al. 2009; Ouchi et al. 2009; Pawlik et al. 2009; Bunker et al. 2010; Labbé et al. 2010; Robertson et al. 2010b). This is a direct result of the very steep faint-end slopes we find at -8 and our allowing for a steepening of these slopes to higher redshifts (based on the observed, albeit uncertain trend).
The rapid increase in the numbers of galaxies at faint-end slopes of 2 is very important. At such steep slopes virtually all the UV flux from galaxies is output by very low luminosity galaxies below 16 AB mag, even with a cutoff at mag. The adopted limit at mag is well-motivated by theoretical expectations (e.g., Read et al. 2006) but remains a key assumption (see Muñoz & Loeb 2011).
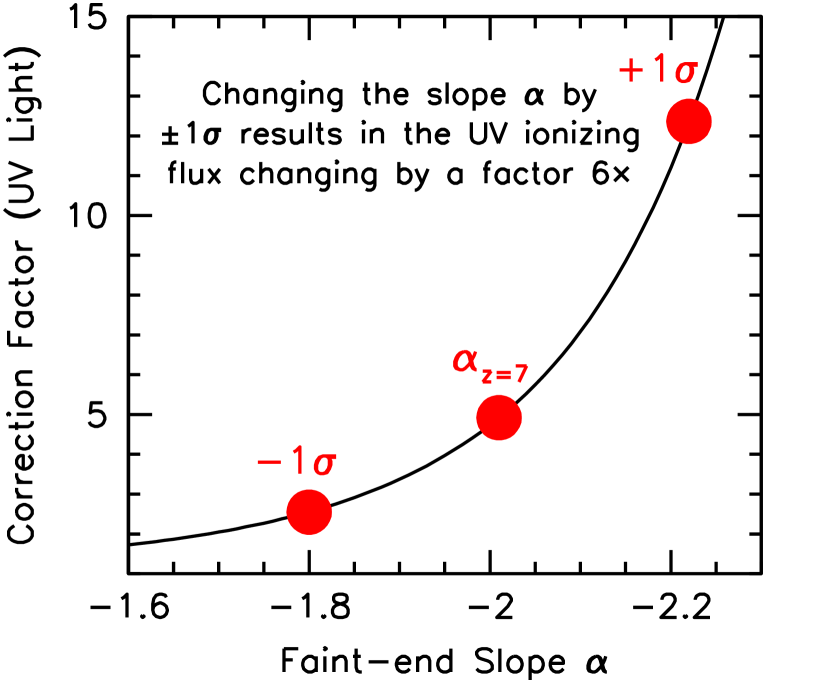
Figure 4a illustrates how sensitive the ionizing flux densities are to the faint-end slope (integrated to a faint-end limit of mag). Faint-end slopes of 2.2, 2.0, 1.8 produce 7, 2.5, and 1.5 larger luminosity densities, respectively, than do slopes of 1.7 (observed at .) Changing the faint-end slope by just 0.2 at (relative to our evolving faint-end slope scenario) yields Thomson optical depths ranging from 0.059 to 0.107. Changes in the adopted cosmology will also affect the derived ; the standard cosmology adopted here results in somewhat lower values of than the WMAP7 cosmology.
One caveat in the above discussion is that our LF-fitting formula overproduces the number of bright galaxies found in recent searches (Bouwens et al. 2011a; Oesch et al. 2011). Our fitting formula would then overpredict the total ionizing UV flux from galaxies. For example, a 20% decrease in the ionizing flux from galaxies (at the bright end of the LF) would lower the Thomson optical depths by 0.005.
Of course, other ingredients may also play an important role in generating the high Thomson optical depths measured by WMAP. These include an even smaller clumping factor (e.g., Bolton & Haehnelt 2007; Pawlik et al. 2009) and perhaps a contribution from early population III stars to the UV photon flux (e.g., Cen 2003; Ricotti & Ostriker 2004).
6. Implications for Future Observations
Can these new and intriguing results be improved? Key issues are how well the faint-end slope can be determined at and what constraints (most-likely theoretical) can be placed on the low-luminosity cutoff of the galaxy LF. As shown in Figures 3-4, both the Thomson optical depths and the filling factors for ionized hydrogen inferred from recent measurements of the LFs are very sensitive to their faint-end slopes.
The current uncertainty in the integrated luminosity density is 0.8 dex, i.e., a factor of 6 (Figure 4a). To determine the total luminosity density within 0.3 dex, the faint-end slope needs to be constrained to 0.1. Fortunately, this is now practical with the new WFC3/IR camera on HST, by extending current observations to 30 mag over 10 arcmin2 and leveraging deep wide-area data (e.g., from CANDELS and BORG/HIPPIES: Trenti et al. 2011).
To provide robustness to the results, measurements of the faint-end slope will be necessary at several different redshifts, i.e., at , , , and , and not simply at -8. By making this measurement at multiple redshifts, can be determined more precisely. Furthermore, the evolution of with cosmic time (Figures 2, 4) allows for a plausible extrapolation to where the uncertainties from direct measurement will remain large.
Deep WFC3/IR data from the HUDF09 program indicate that lower-luminosity galaxies are likely to be the primary source of UV photons needed to reionize the universe. More definitive results on this important and long-standing problem are now within reach with HST.
References
- Beckwith et al. (2006) Beckwith, S. V. W., et al. 2006, AJ, 132, 1729
- Bolton & Haehnelt (2007) Bolton, J. S., & Haehnelt, M. G. 2007, MNRAS, 382, 325
- Bouwens et al. (2007) Bouwens, R. J., Illingworth, G. D., Franx, M., & Ford, H. 2007, ApJ, 670, 928
- Bouwens et al. (2008) Bouwens, R. J., Illingworth, G. D., Franx, M., & Ford, H. 2008, ApJ, 686, 230
- Bouwens et al. (2010b) Bouwens, R.J., et al. 2010b, ApJ, 709, L133
- Bouwens et al. (2011) Bouwens, R. J., et al. 2011a, Nature, 469, 504
- Bouwens et al. (2011) Bouwens, R. J., Illingworth, G. D., Oesch, P. A., et al. 2011b, ApJ, 737, 90
- Bouwens et al. (2011) Bouwens, R. J., Illingworth, G. D., Oesch, P. A., et al. 2011c, ApJ, submitted, arXiv:1109.0994
- Bunker et al. (2010) Bunker, A. J., et al. 2010, MNRAS, 409, 855
- Cen (2003) Cen, R. 2003, ApJ, 591, 12
- Chary (2008) Chary, R.-R. 2008, ApJ, 680, 32
- Dijkstra et al. (2004) Dijkstra, M., Haiman, Z., Rees, M. J., & Weinberg, D. H. 2004, ApJ, 601, 666
- Efstathiou et al. (1988) Efstathiou, G., Ellis, R. S., & Peterson, B. A. 1988, MNRAS, 232, 431
- Fan et al. (2002) Fan, X., Narayanan, V. K., Strauss, M. A., White, R. L., Becker, R. H., Pentericci, L., & Rix, H.-W. 2002, AJ, 123, 1247
- Grogin et al. (2011) Grogin, N. A., Kocevski, D. D., Faber, S. M., et al. 2011, ApJS, 197, 35
- Hathi et al. (2010) Hathi, N. P., et al. 2010, ApJ, 720, 1708
- Hui & Haiman (2003) Hui, L., & Haiman, Z. 2003, ApJ, 596, 9
- Iwata et al. (2009) Iwata, I., et al. 2009, ApJ, 692, 1287
- Jaacks et al. (2012) Jaacks, J., Choi, J.-H., Nagamine, K., Thompson, R., & Varghese, S. 2012, MNRAS, 420, 1606
- Koekemoer et al. (2011) Koekemoer, A. M., Faber, S. M., Ferguson, H. C., et al. 2011, ApJS, 197, 36
- Komatsu et al. (2011) Komatsu, E., et al. 2011, ApJS, 192, 18
- Labbe et al. (2010) Labbé, I., et al. 2010, ApJ, 716, L103
- Madau, Haardt, & Rees (1999) Madau, P., Haardt, F., & Rees, M. J. 1999, ApJ, 514, 648
- Muñoz & Loeb (2011) Muñoz, J. A., & Loeb, A. 2011, ApJ, 729, 99
- Oesch et al. (2007) Oesch, P. A., et al. 2007, ApJ, 671, 1212
- Oesch et al. (2009) Oesch, P. A., et al. 2009, ApJ, 690, 1350
- Oesch et al. (2010) Oesch, P.A., et al. 2010a, ApJ, 709, L16
- Oesch et al. (2010b) Oesch, P.A., et al. 2010b, ApJ, 709, L21
- Oesch et al. (2010) Oesch, P. A., et al. 2010c, ApJ, 725, L150
- Oesch et al. (2012) Oesch, P. A., Bouwens, R. J., Illingworth, G. D., et al. 2012a, ApJ, 745, 110
- Oesch et al. (2012) Oesch, P. A., Bouwens, R. J., Illingworth, G. D., et al. 2012b, ApJ, submitted, arXiv:1201.0755
- Oke & Gunn (1983) Oke, J. B., & Gunn, J. E. 1983, ApJ, 266, 713
- Ouchi et al. (2009) Ouchi, M., et al. 2009, ApJ, 706, 1136
- Ouchi et al. (2010) Ouchi, M., et al. 2010, ApJ, 723, 869
- Pawlik et al. (2009) Pawlik, A. H., Schaye, J., & van Scherpenzeel, E. 2009, MNRAS, 394, 1812
- Read et al. (2006) Read, J. I., Pontzen, A. P., & Viel, M. 2006, MNRAS, 371, 885
- Reddy & Steidel (2009) Reddy, N. A., & Steidel, C. C. 2009, ApJ, 692, 778
- Ricotti & Ostriker (2004) Ricotti, M., & Ostriker, J. P. 2004, MNRAS, 350, 539
- Robertson (2010) Robertson, B. E. 2010a, ApJ, 713, 1266
- Robertson et al. (2010) Robertson, B. E., Ellis, R. S., Dunlop, J. S., McLure, R. J., & Stark, D. P. 2010b, Nature, 468, 49
- Salvaterra et al. (2011) Salvaterra, R., Ferrara, A., & Dayal, P. 2011, MNRAS, 414, 847
- Sandage, Tammann, & Yahil (1979) Sandage, A., Tammann, G. A., & Yahil, A. 1979, ApJ, 232, 352
- Schaerer (2003) Schaerer, D. 2003, A&A, 397, 527
- Shapley et al. (2006) Shapley, A. E., Steidel, C. C., Pettini, M., Adelberger, K. L., & Erb, D. K. 2006, ApJ, 651, 688
- Stark et al. (2007) Stark, D. P., Bunker, A. J., Ellis, R. S., Eyles, L. P., & Lacy, M. 2007, ApJ, 659, 84
- Stiavelli et al. (2004) Stiavelli, M., Fall, S. M., & Panagia, N. 2004, ApJ, 610, L1
- Su et al. (2011) Su, J., Stiavelli, M., Oesch, P., et al. 2011, ApJ, 738, 123
- Trenti & Stiavelli (2008) Trenti, M., & Stiavelli, M. 2008, ApJ, 676, 767
- Trenti et al. (2010) Trenti, M., Stiavelli, M., Bouwens, R. J., Oesch, P., Shull, J. M., Illingworth, G. D., Bradley, L. D., & Carollo, C. M. 2010, ApJ, 714, L202
- Trenti et al. (2011) Trenti, M., Bradley, L. D., Stiavelli, M., et al. 2011, ApJ, 727, L39
- Willott et al. (2010) Willott, C. J., Delorme, P., Reylé, C., et al. 2010, AJ, 139, 906
- Windhorst et al. (2011) Windhorst, R. A., et al. 2011, ApJS, 193, 27
| Observational Data | ||||||||
| Area | Depth () | |||||||
| Field | (arcmin2) | |||||||
| HUDF09 | 4.7 | 29.7 | 30.1 | 29.9 | 29.4 | 29.6 | 29.9 | 29.9 |
| HUDF09-1 | 4.7 | — | 29.0 | 29.0 | 29.0 | 29.0 | 29.3 | 29.1 |
| HUDF09-2 | 4.7 | 28.8 | 29.9 | 29.3 | 29.2 | 29.2 | 29.5 | 29.3 |
| ERS | 39.2 | 28.2 | 28.5 | 28.0 | 28.0 | 27.9 | 28.4 | 28.1 |
| CANDELS-DEEP | 63.1 | 28.2 | 28.5 | 28.0 | 28.0 | — | 28.1 | 27.8 |
| CANDELS-WIDE | 41.9 | 28.2 | 28.5 | 28.0 | 28.0 | — | 27.8 | 27.5 |
| High-Redshift Samples | ||||||||
| Ultra-Deep (HUDF09) | Ultra-Deep (HUDF09-1) | Ultra-Deep (HUDF09-2) | Wide (ERS+CANDELS) | |||||
| Redshift | # | Limit | # | Limit | # | Limit | # | Limit |
| 57 | 85 | 101 | 264 | |||||
| 56 | 27 | 23 | 97 | |||||
| 29 | 17 | 14 | 13 | |||||
| 24 | 14 | 15 | 6 | |||||
| Best-Fit Schechter Parameters | ||||||||
| Redshift | ReferenceaaReferences: [1] Bouwens et al. 2007, [2] Bouwens et al. 2011 | LF Fitting Formula at | ||||||
| 20.980.10 | 1.30.2 | 1.730.05 | [1] | |||||
| 20.600.23 | 1.4 | 1.790.12 | This Work | |||||
| 20.370.30 | 1.4 | 1.730.20 | This Work | |||||
| 20.140.26 | 0.86 | 2.010.21 | [2] | |||||
| 20.100.52 | 0.59 | 1.910.32 | [2] | |||||