The Stabilization of Superconductivity by Magnetic Field in Out-of-Equilibrium Nanowires
Abstract
A systematic study has been carried out on the previously reported “magnetic-field-induced superconductivity” of Zn nanowires. By varying parameters such as magnetic field orientation and wire length, the results provide evidence that the phenomenon is a nonequilibrium effect associated with the boundary electrodes. They also suggest there are two length scales involved, the superconducting coherence length and quasiparticle relaxation length. As wire lengths approach either of these length scales, the effect weakens. We demonstrate that it is appropriate to consider the effect to be a stabilization of superconductivity, that has been suppressed by an applied current.
pacs:
PACS number2009 number number identifier
[Date text]date Received text]dateRevised text]dateAccepted text]datePublished text]date
I Introduction
Superconducting wires have potential for utilization in integrated circuits, as a consequence of their dissipationless nature. Upon scaling their sizes down below the coherence length, this characteristic can be lost due to the destruction of superconducting long-range order by either thermal or quantum fluctuations. Superconductors in this quasi-one dimensional limit have nonzero resistances produced by phase slip processes. This has been the focus of much research on superconducting nanowires.Little1967 ; Langer1967 ; McCumber1970 ; Giordano1988 ; Zaikin1997 ; Newbower1972 ; Lau2001 ; Zgirski2005 ; Altomare2006 The superconductivity of nanowires may be significantly influenced by the state of their boundary electrodes. Because of the proximity effect, one would expect an enhancement of superconductivity when a wire is connected to superconducting electrodes, and a suppression when connected to normal electrodes. These manifest themselves as enhanced critical currents in superconducting microbridgesOctavio1978 and suppressed critical temperatures in Al nanowires with Cu-coated Al electrodes.Boogaard2004 In addition, theoretical studies have shown that a finite-length wire can undergo a superconductor-insulator transition through its coupling to the external environment.Buchler2004 ; Fu2006 Experimentally, a recent study of electro-deposited Zn nanowires found that their coupling to bulk superconductors of other materials can cause the so-called “anti-proximity effect”.Tian2005 ; Tian2006 In contrast with the usual proximity effect, at certain temperatures wires were found to enter the superconducting state from the normal state when the electrodes were driven normal by a magnetic field.
A similar magneto-response was reported in a recent letter.Chen2009 Lithographically-made Zn nanowires with Zn electrodes were found to reenter the superconducting state upon the application of small magnetic fields after being driven resistive by current at low temperatures. Here, we report a systematic study of this effect, involving the variation of several parameters. The results provide solid evidence that the phenomenon is a nonequilibrium effect associated with the coupling to the boundary electrodes. In addition, it is more appropriate to treat it as a stabilization, or recovery, of superconductivity, which was suppressed by the applied current.
The paper is structured in the following manner: previously reported work on field enhanced superconductivity is reviewed in Section II. Experiments on the field-orientation dependence of the effect are presented in Section III. The wire length dependence is presented in Section IV. Arguments that attribute the effect to the stabilization of superconductivity are contained in Section V. Sections VI and VII contain discussions of theories and conclusions, respectively.
II Field-enhanced superconductivity
As described in detail in Ref. 16, samples in the configuration of a single Zn nanowire with wide Zn electrodes were prepared using a combination of multi-layered photolithgraphy, electron-beam lithography and vapor deposition. The last step of the fabrication process involves evaporating Zn at a rate , with both the sample and crucible shroud cooled to . This approach to wire fabrication has the advantage of forming wires and electrodes simultaneously in the same writing and deposition steps. It ensures a transparent interface between the wire and the electrodes thereby maximizing the transport of quasiparticles and Cooper pairs across the interface. After liftoff, the samples were immediately transferred to a high-vacuum 3He refrigerator where measurements were carried out using conventional DC four-probe methods. Even though characteristics of wires are non-linear except in their normal state, the resistance is calculated as , by averaging 25 measurements. This facilitates identification of the three states of the wire that will be discussed subsequently.
| Sample | Width () | Height () | Length () | (K) | (μΩ-cm) | Theo. (μA) | |
|---|---|---|---|---|---|---|---|
| A | 85 | 150 | 1.5 | 0.85 | 0.17 | 11 | 120 |
| B | 80 | 90 | 1.5 | 0.83 | 0.15 | 14 | 56 |
| C | 60 | 100 | 1 | 0.76 | 0.26 | 8.4 | 53 |
| D | 60 | 100 | 2 | 0.76 | 0.28 | 7.8 | 55 |
| E | 60 | 100 | 4 | 0.76 | 0.31 | 6.3 | 61 |
| F | 60 | 75 | 10 | 0.76 | 0.21 | 11 | 35 |
| G | 65 | 100 | 1.5 | 0.78 | 0.31 | 7.6 | 63 |
The effect is robust and has been observed consistently in more than twenty samples. In Table 1, we list some key parameters for several representative samples, which will be discussed here. The wire widths and heights were determined by microscopy measurements. The transition temperature was taken as the temperature of the half-normal resistance at a low applied current of 0.1. The zero-temperature dirty limit coherence length was estimated as , where is the BCS coherence length, and is the mean free path that is obtained from the product at 4.2 K. The value of used is from studies on single crystal Zn nanowires.Schulz For the wires of finite lengths used in the current study, the conventional way of extracting the coherence length from near cannot be used, due to the complications associated with the alteration of the boundary conditions by the magnetic field.
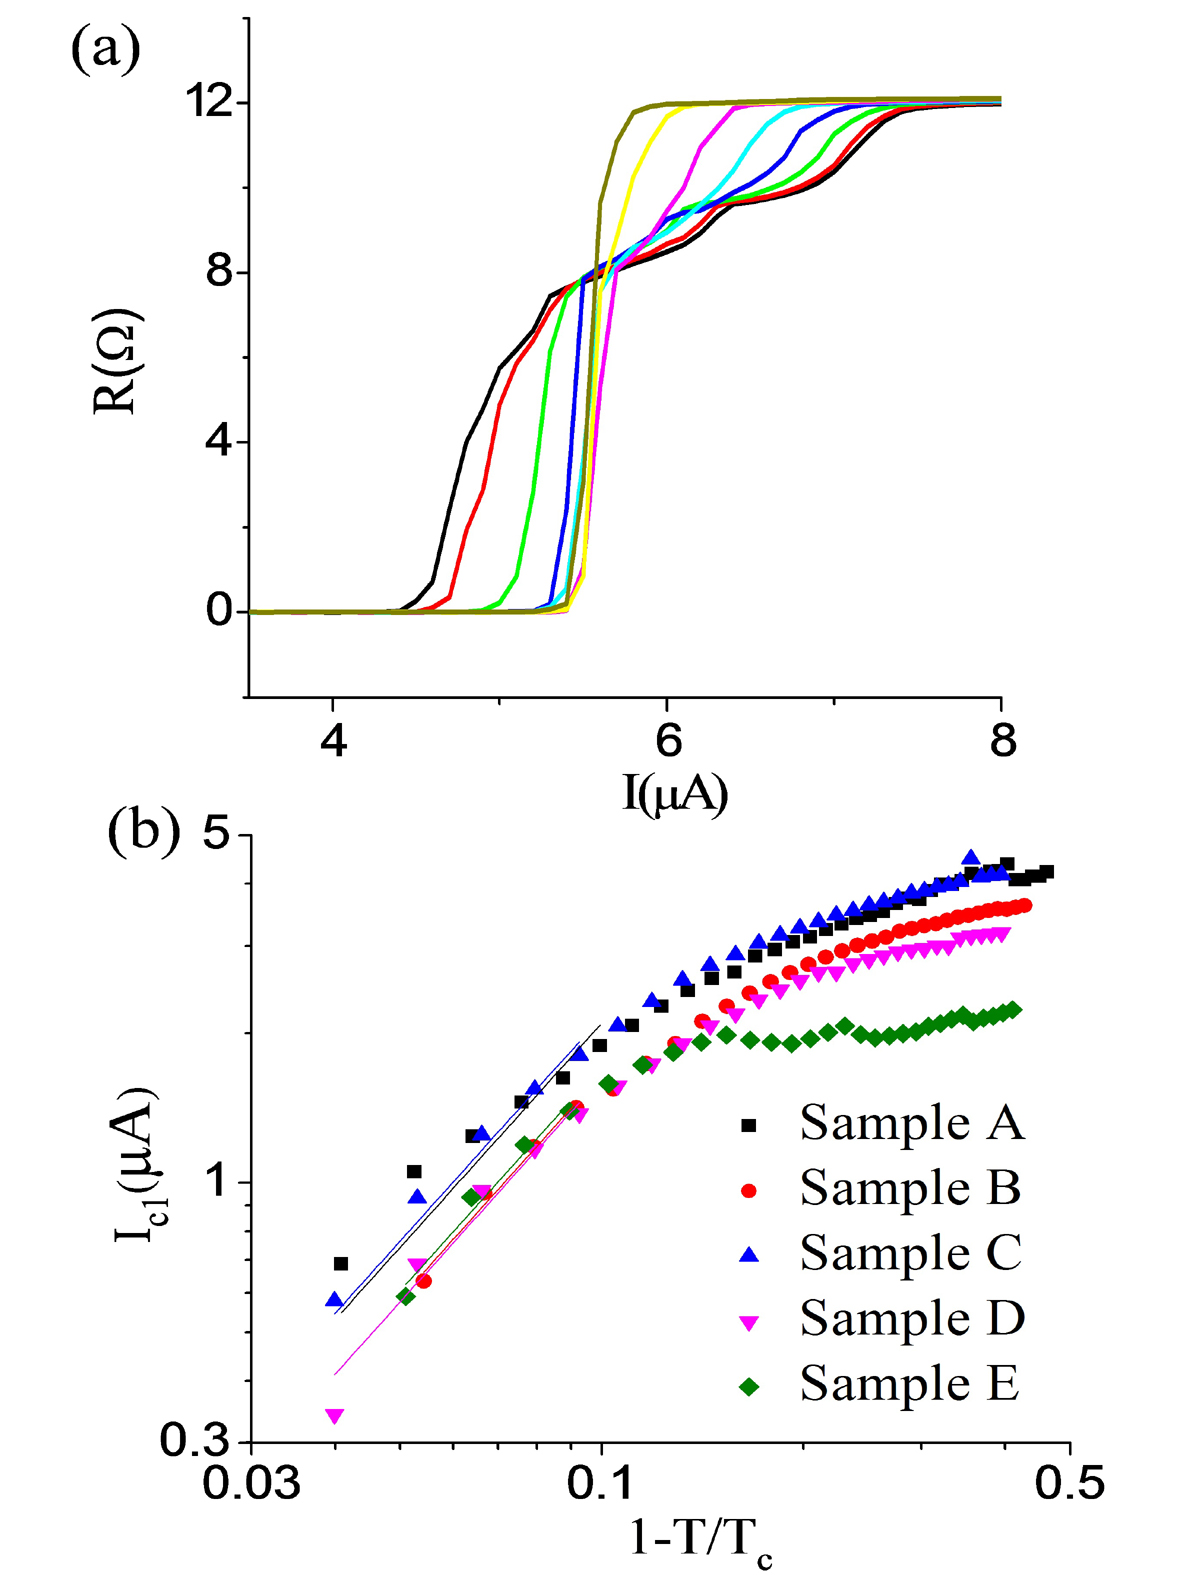
At low temperatures, the current-driven transition of the wire is broad, associated with several characteristic currents. In the case of a long sample (Sample A in Table I) shown in Fig. 1(a), at , the transition starts at with the onset of the non-zero resistance, stops at with the return to the normal resistance. In the transition regime, there exists a shoulder-like structure developed around . (The other shoulder structure around is not a universal feature and therefore will not be discussed here.) has been defined by the current at which and is graphed as a function of temperature in Fig.1(b). As one can see, there is agreement between the behavior of and the prediction of the Ginsburg-Landau (GL) theory for points with , but not over the entire temperature range.TinkhamBook
| (1) |
However, there is not agreement between this data and the Bardeen expression
| (2) |
or Kupriyanov-Lukichev theory over the entire temperature window available.Bardeen1962 ; Romijn 1982 Note that is suppressed relative to either of these predictions and that the transition in the vs curves is quite sharpe near which makes , and almost indistinguishable. An attempt to extract the temperature dependence of has been much more difficult as it is harder to define, especially near . In addition, , and deviate strongly from the theoretical predicted GL critical pair-breaking current for isolated superconducting wires (see Table 1).Romijn 1982
| (3) |
A part of the deviation may be associated with utilizing parameters such as Fermi velocity of free electron model. The wires are also appear granular under SEM and AFM scans which could lead to a system of high disorder. This could explain the low critical currents.TinkhamBook Another explanation could be the oxidation layer at the surface of the nanowires which could make the crossectional area smaller than our AFM and SEM measurements or perhaps quantum confinement could explain it, but it is all just speculation at this point.
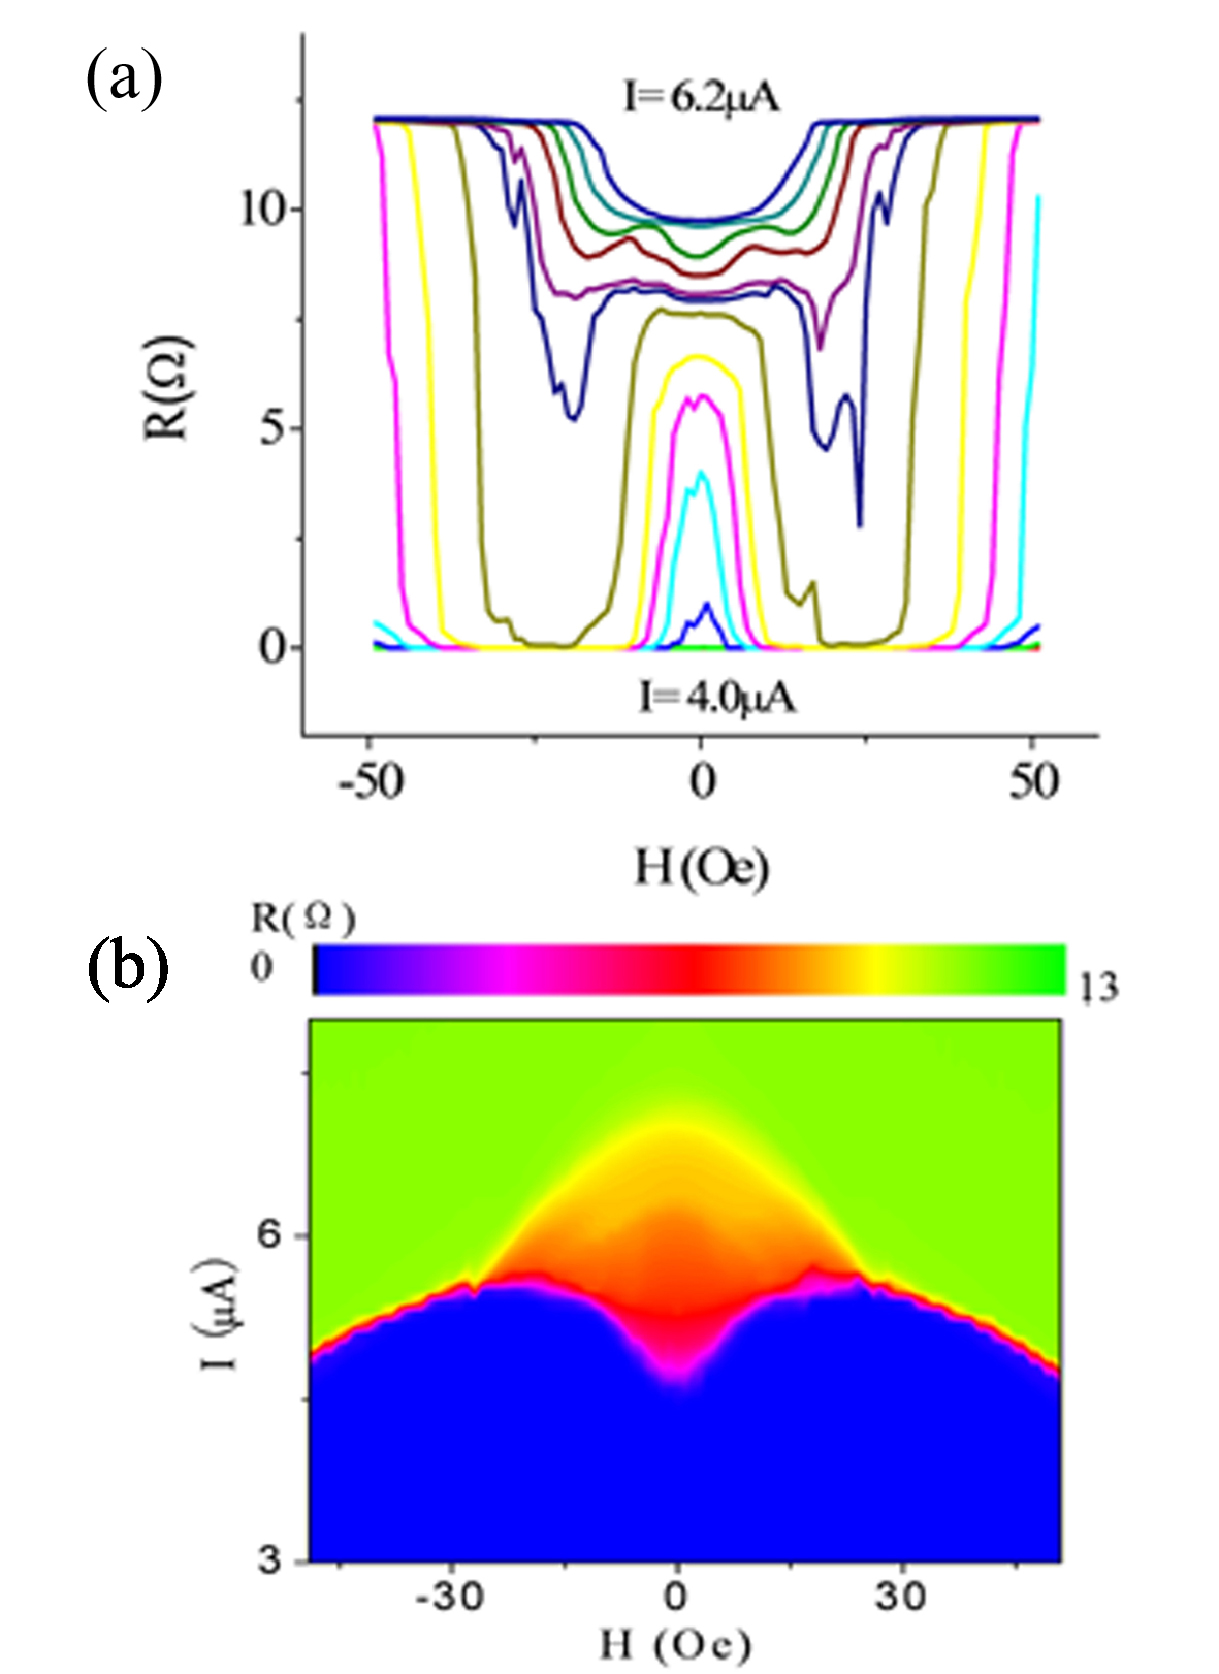
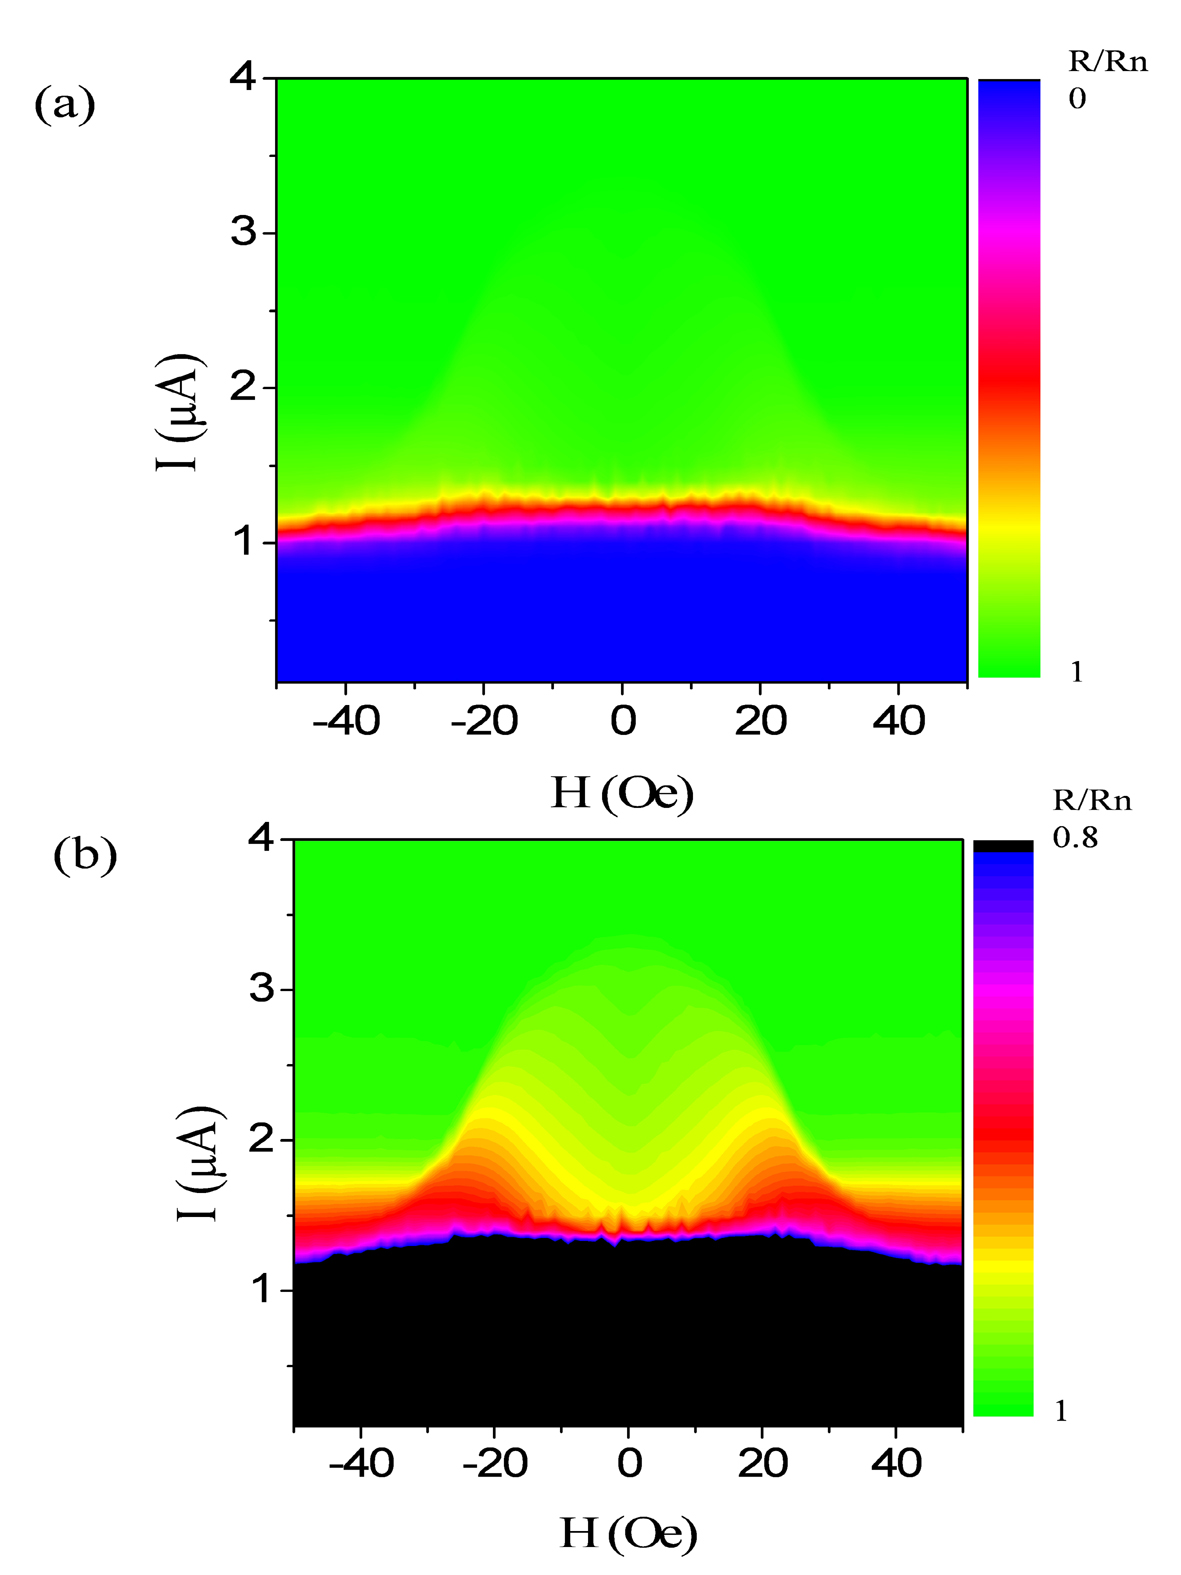
When a magnetic field is applied, different parts of the transition regime respond differently. Above the shoulder, the critical current decreases with increasing magnetic field. Below the shoulder, the critical current increases with increasing magnetic field, until reaching a maximum of value equal . As a consequence, over a range of currents, as shown in Fig. 2(a), the wire can re-enter its zero-resistance state from a current-driven resistive state, upon the application of a small magnetic field. As discussed in Ref. 16, a false color phase diagram of the wire can be produced by graphing the wire resistance as a function of current and magnetic field, as shown in Fig. 2(b). The blue region represents the zero-resistance state, the green region represents the normal state and the colors other than these two represent the intermediate resistive states of the transition region. In this phase diagram, the enhancement of superconductivity is exhibited as the V-shaped structure in the zero-resistance region, suggesting an increase of the critical current upon the application of a magnetic field. These false color phase diagrams can also be created with a temperature axis as opposed to a current axis. This was done in Ref. 16 and for two samples in this paper. Most of these plots are omitted because it is rather redundant with the current data. One more experimental observation worthy of mention is that the standard deviation of measured resistances is much higher for those below the shoulder compared with those above. Its origin remains unknown and is currently under investigation.
III Field orientation dependence: Boundary effects
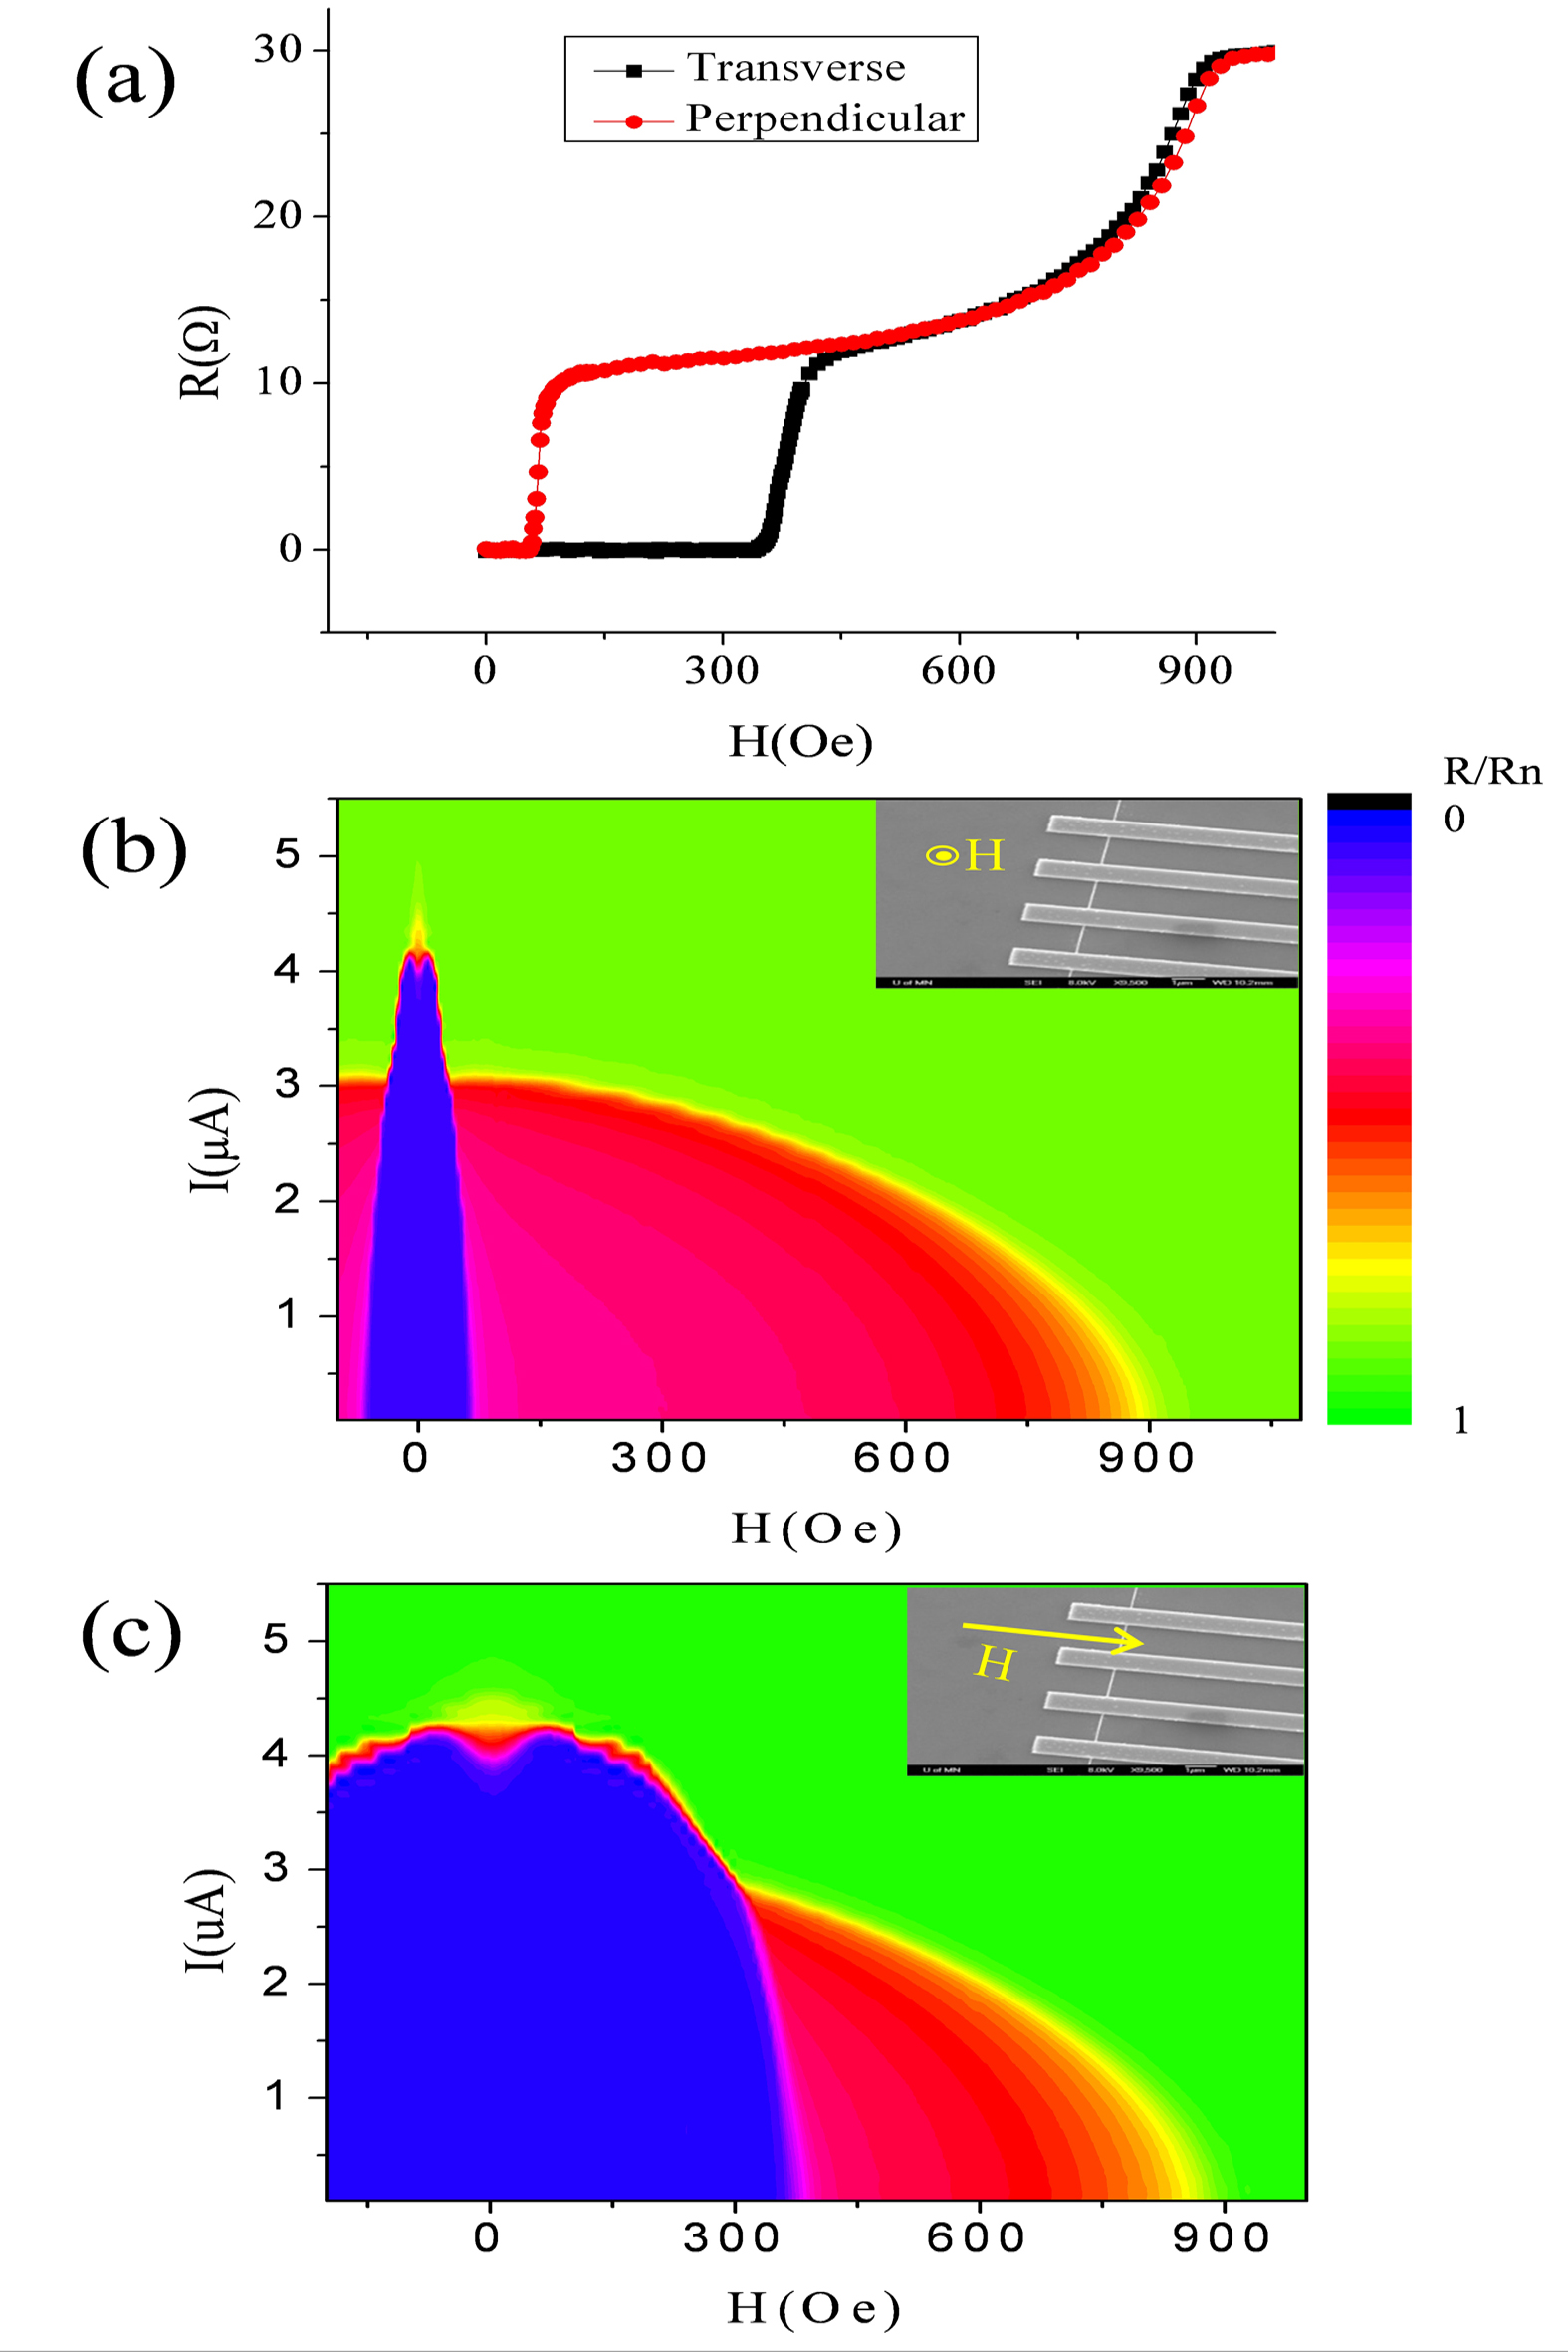
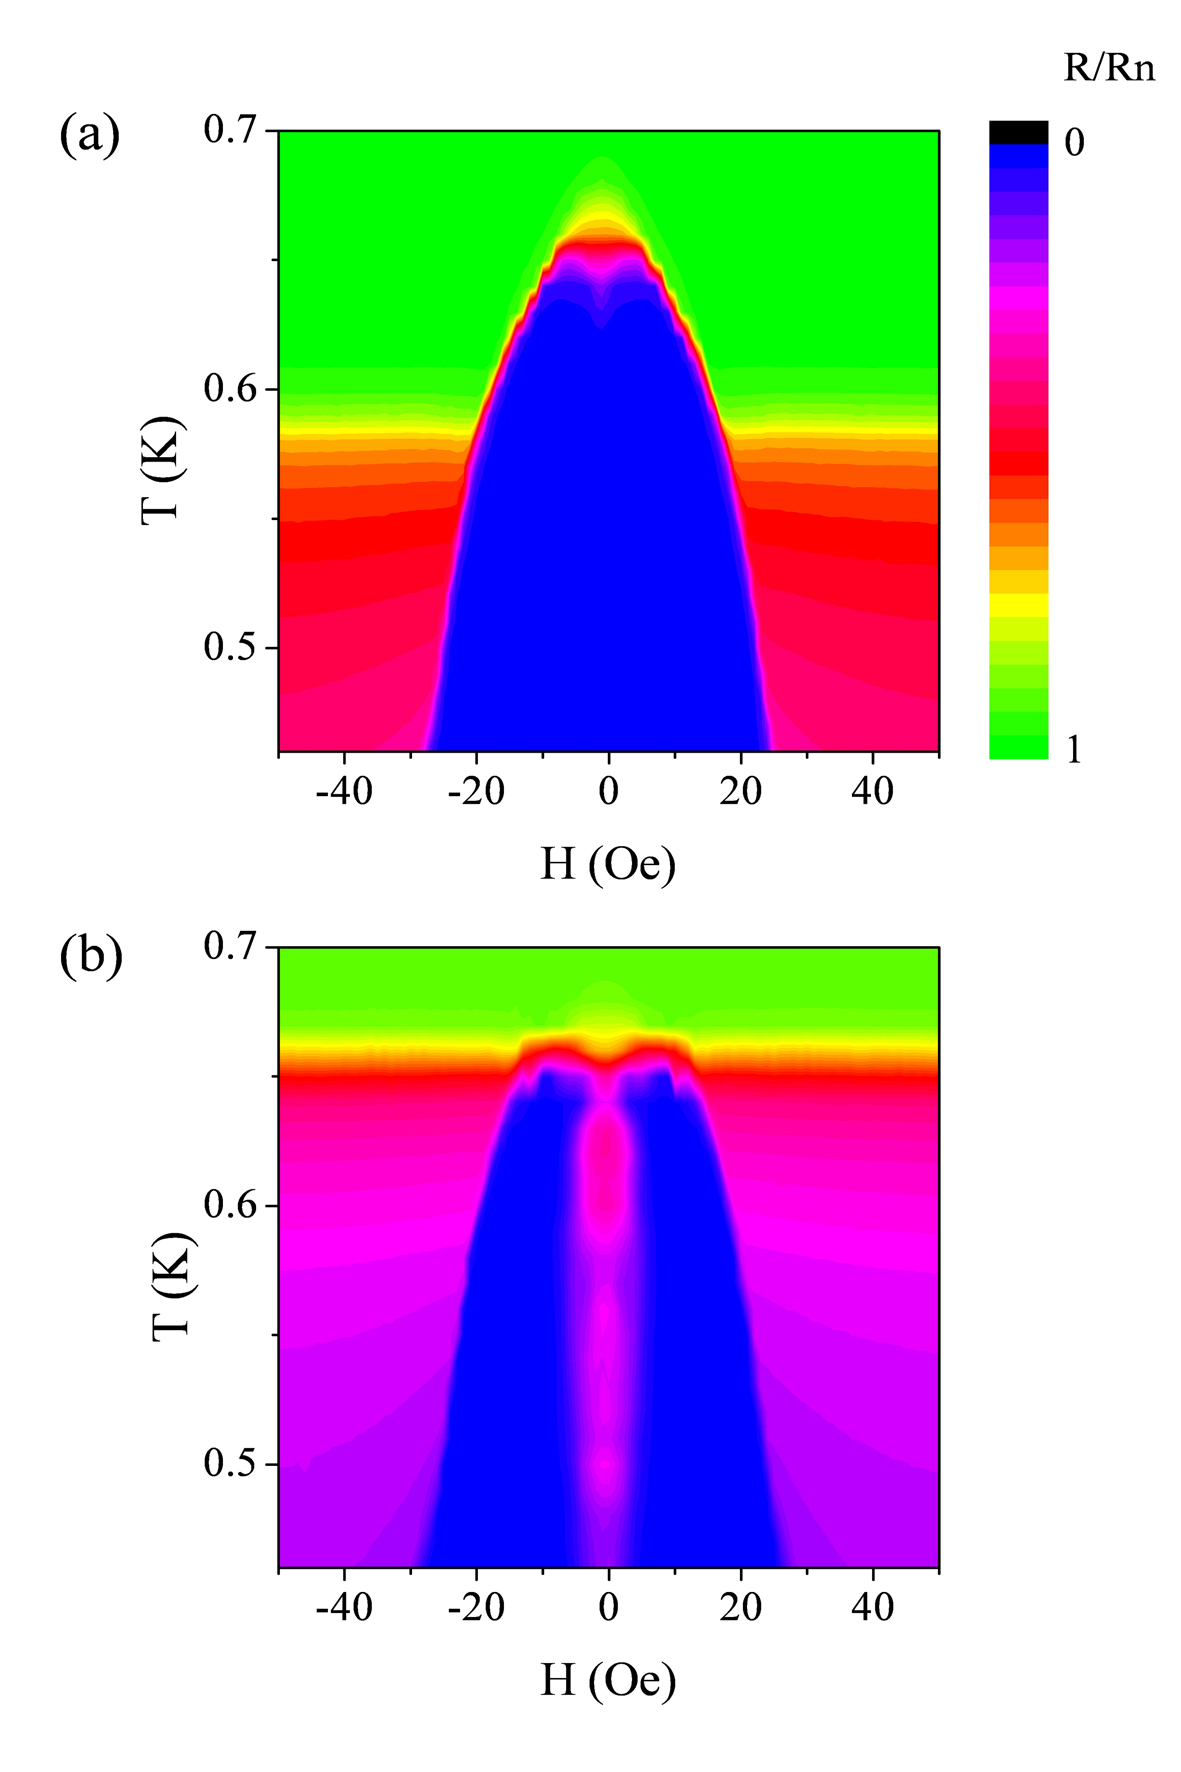
One of the most important issues that needs to be addressed is whether or not these observations represent intrinsic properties of wires, independent of the boundary electrodes. To this end, measurements were carried out with different orientations of the applied field relative to samples, from perpendicular to both the wire and the plane of the substrate, that was used in the measurements in Fig. 2, to in the plane of the substrate and transverse to the wire. As labeled in the inset of Fig. 3(b), the perpendicular direction refers to a direction in which the magnetic field is perpendicular to the plane of the substrate and the transverse direction refers to field oriented transverse to the wire and in the plane of the substrate. The false-color phase diagram of a sample (Sample B) in this magnetic field direction is shown in Fig. 3(b). In this phase diagram, the regime of magnetic field enhanced superconductivity corresponds to that of high currents (), and low magnetic fields (). At relative low currents (), the wire does not exhibit any sign of an enhancement of superconductivity. The wire goes through a wide transition region up to 900 Oe, from the zero-resistance state to the normal state. This represents a two-step transition tuned by magnetic field. As shown in Fig. 3(a), the first step of the transition actually corresponds to the magnetic field reaching the critical field of the electrodes.
The associated resistance change corresponds to a resistance originating from the proximity effect between the superconducting wire and the normal electrodes. In addition, it also provides evidence that the electrodes remain superconducting over the whole regime of re-entrance. This can be seen by comparing the boundaries of this regime with the phase boundary associated with the first transition (between the blue and red regions). Above this field, the system becomes a junction. The wire resistance increases slowly over a wide a range of magnetic fields, until it reaches the second step of the transition. At low temperatures, the magnetic field at this transition is roughly the critical field of the wire.
The magnetic field can be switched into the plane of the substrate and transverse to the wire axis by a rotation, as labeled in the inset of Fig. 3(c). The height-to-width ratios are close to unity for the wire but are only around 0.1 for the electrodes. As a consequence, when the field changes direction from perpendicular to transverse, it is is always effectively perpendicular to the wire. For the electrodes, the change of the field orientation is significant, since the field goes from out-of-plane to in-plane. To see this, one can compare the previously discussed two-step transition of the magnetoresistance measurements in both field directions at a low current, shown in Fig. 3(a). The critical field of the electrodes increases by a factor of 5 when the magnetic field is switched from perpendicular to transverse, while the critical field of the wire basically remains unchanged. Note that to do this the sample was brought to room temperature and attached to a different sample puck in atmosphere. This is responsible for the slight change in the value of the critical field of the wire at low current between Fig. 3(b) and Fig.3(c). Now, focusing on the enhancement regimes in the phase diagrams shown in Figs. 3(b) and (c), one can immediately recognize the expansion of the regime of magnetic field enhanced superconductivity, when the magnetic field is switched from perpendicular to transverse. In other words, a higher magnetic field is needed in the transverse direction to induce reentrance into the superconducting state, compared with the perpendicular direction. Because the magnetic field remains perpendicular to the wire, this difference suggests that the observed enhancement of superconductivity is controlled by processes taking place in the electrodes in response to the applied magnetic field. However, what is unchanged is the amplitude of the enhancement, which can be taken as the increase of the critical current . This should be expected since the response of the wire to magnetic field is the same in both directions, and the field here is much smaller than the critical field of the wire itself.
IV Wire length dependence: Two length scales
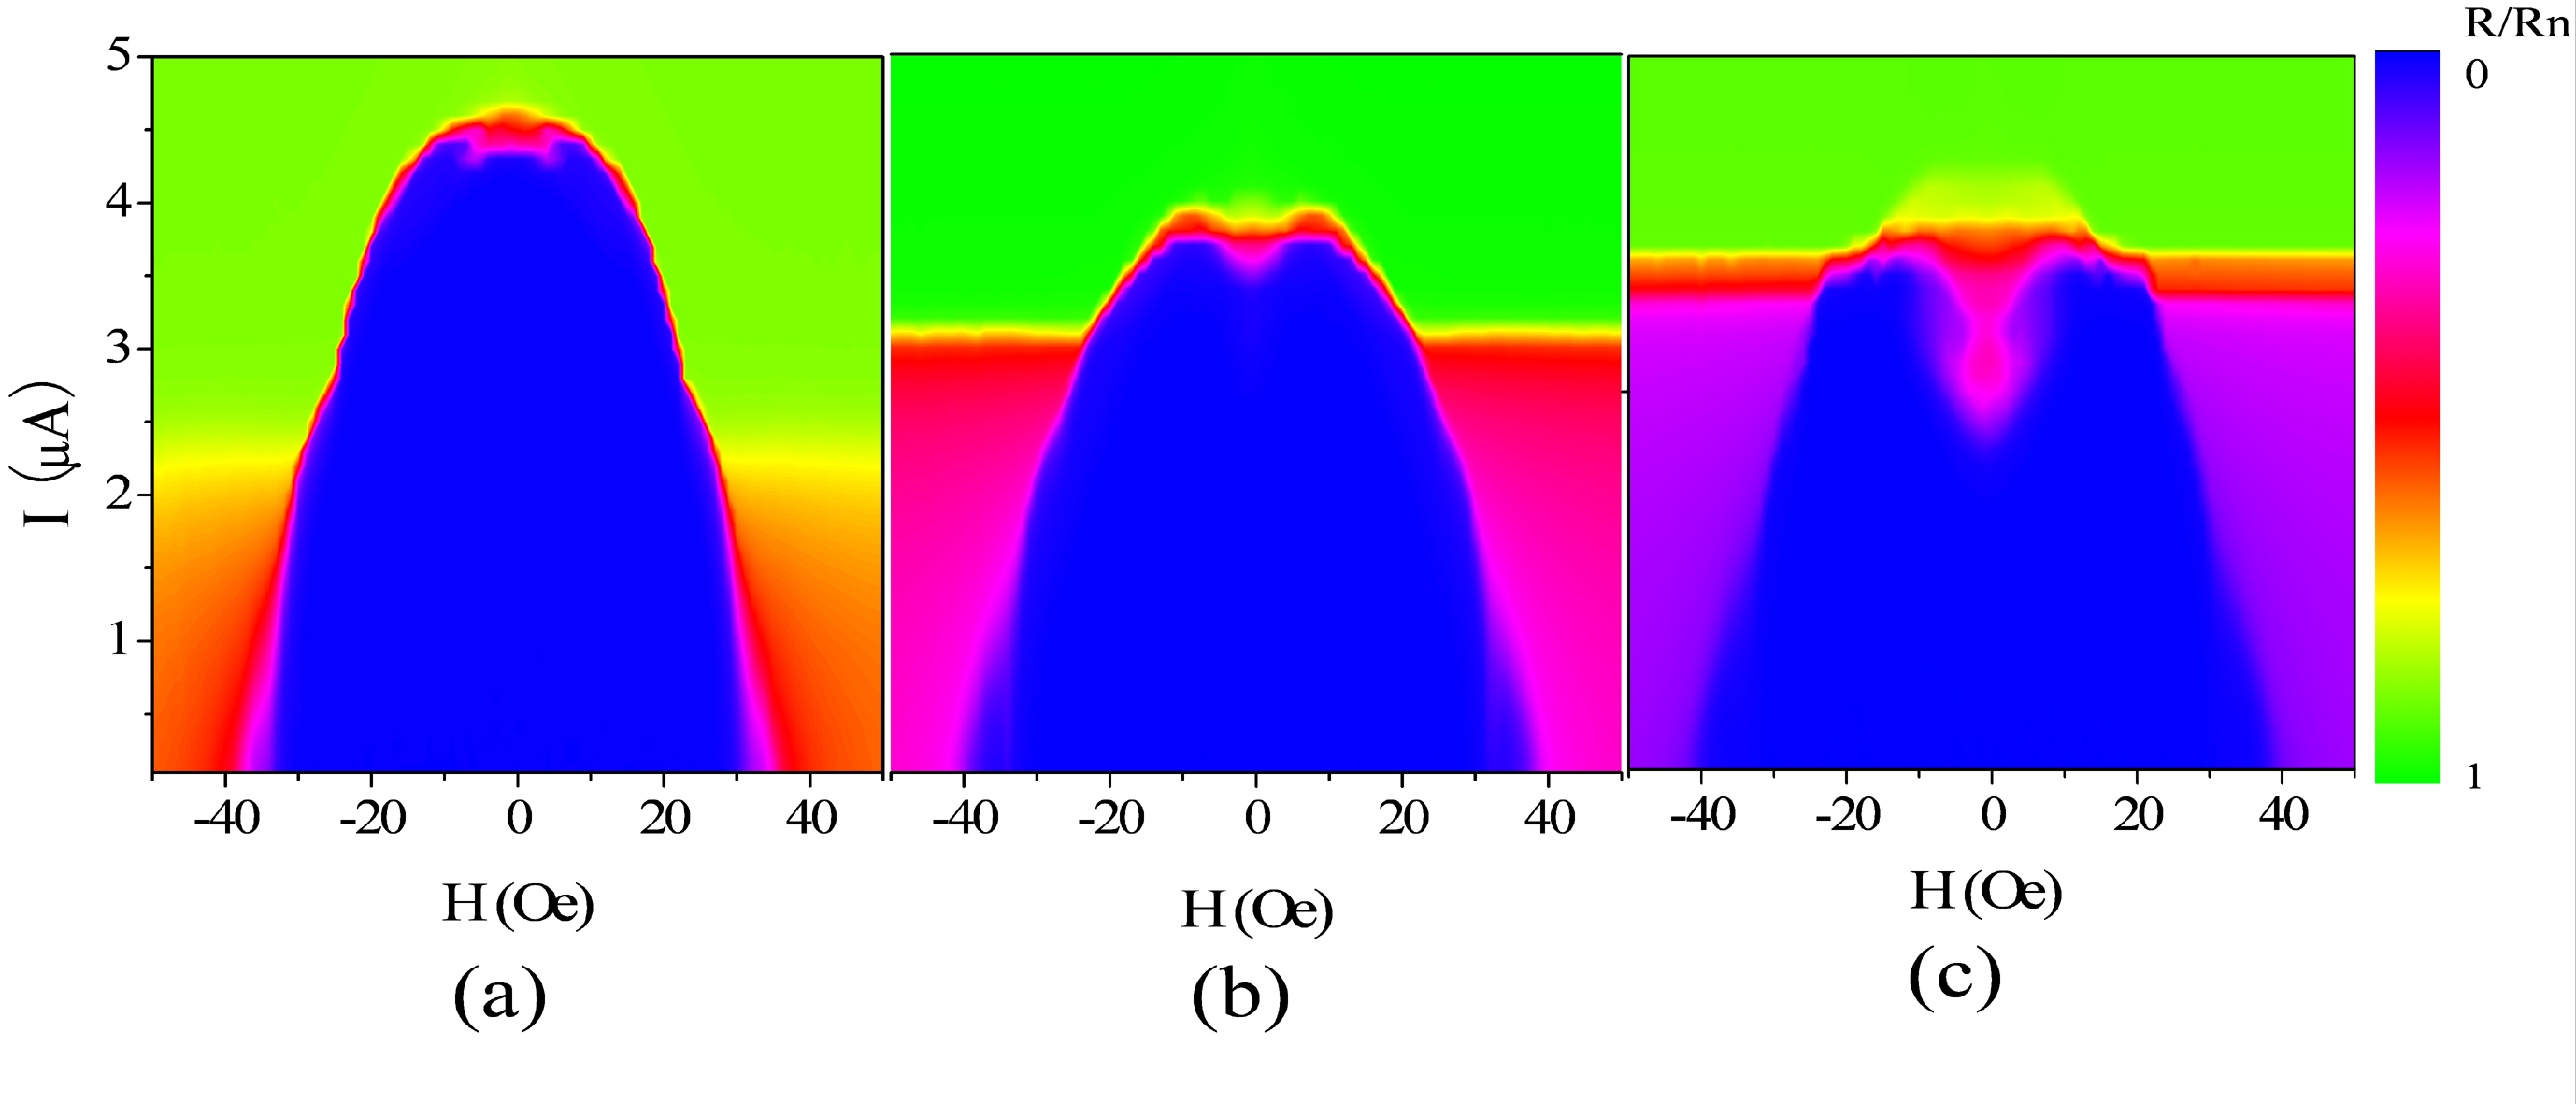
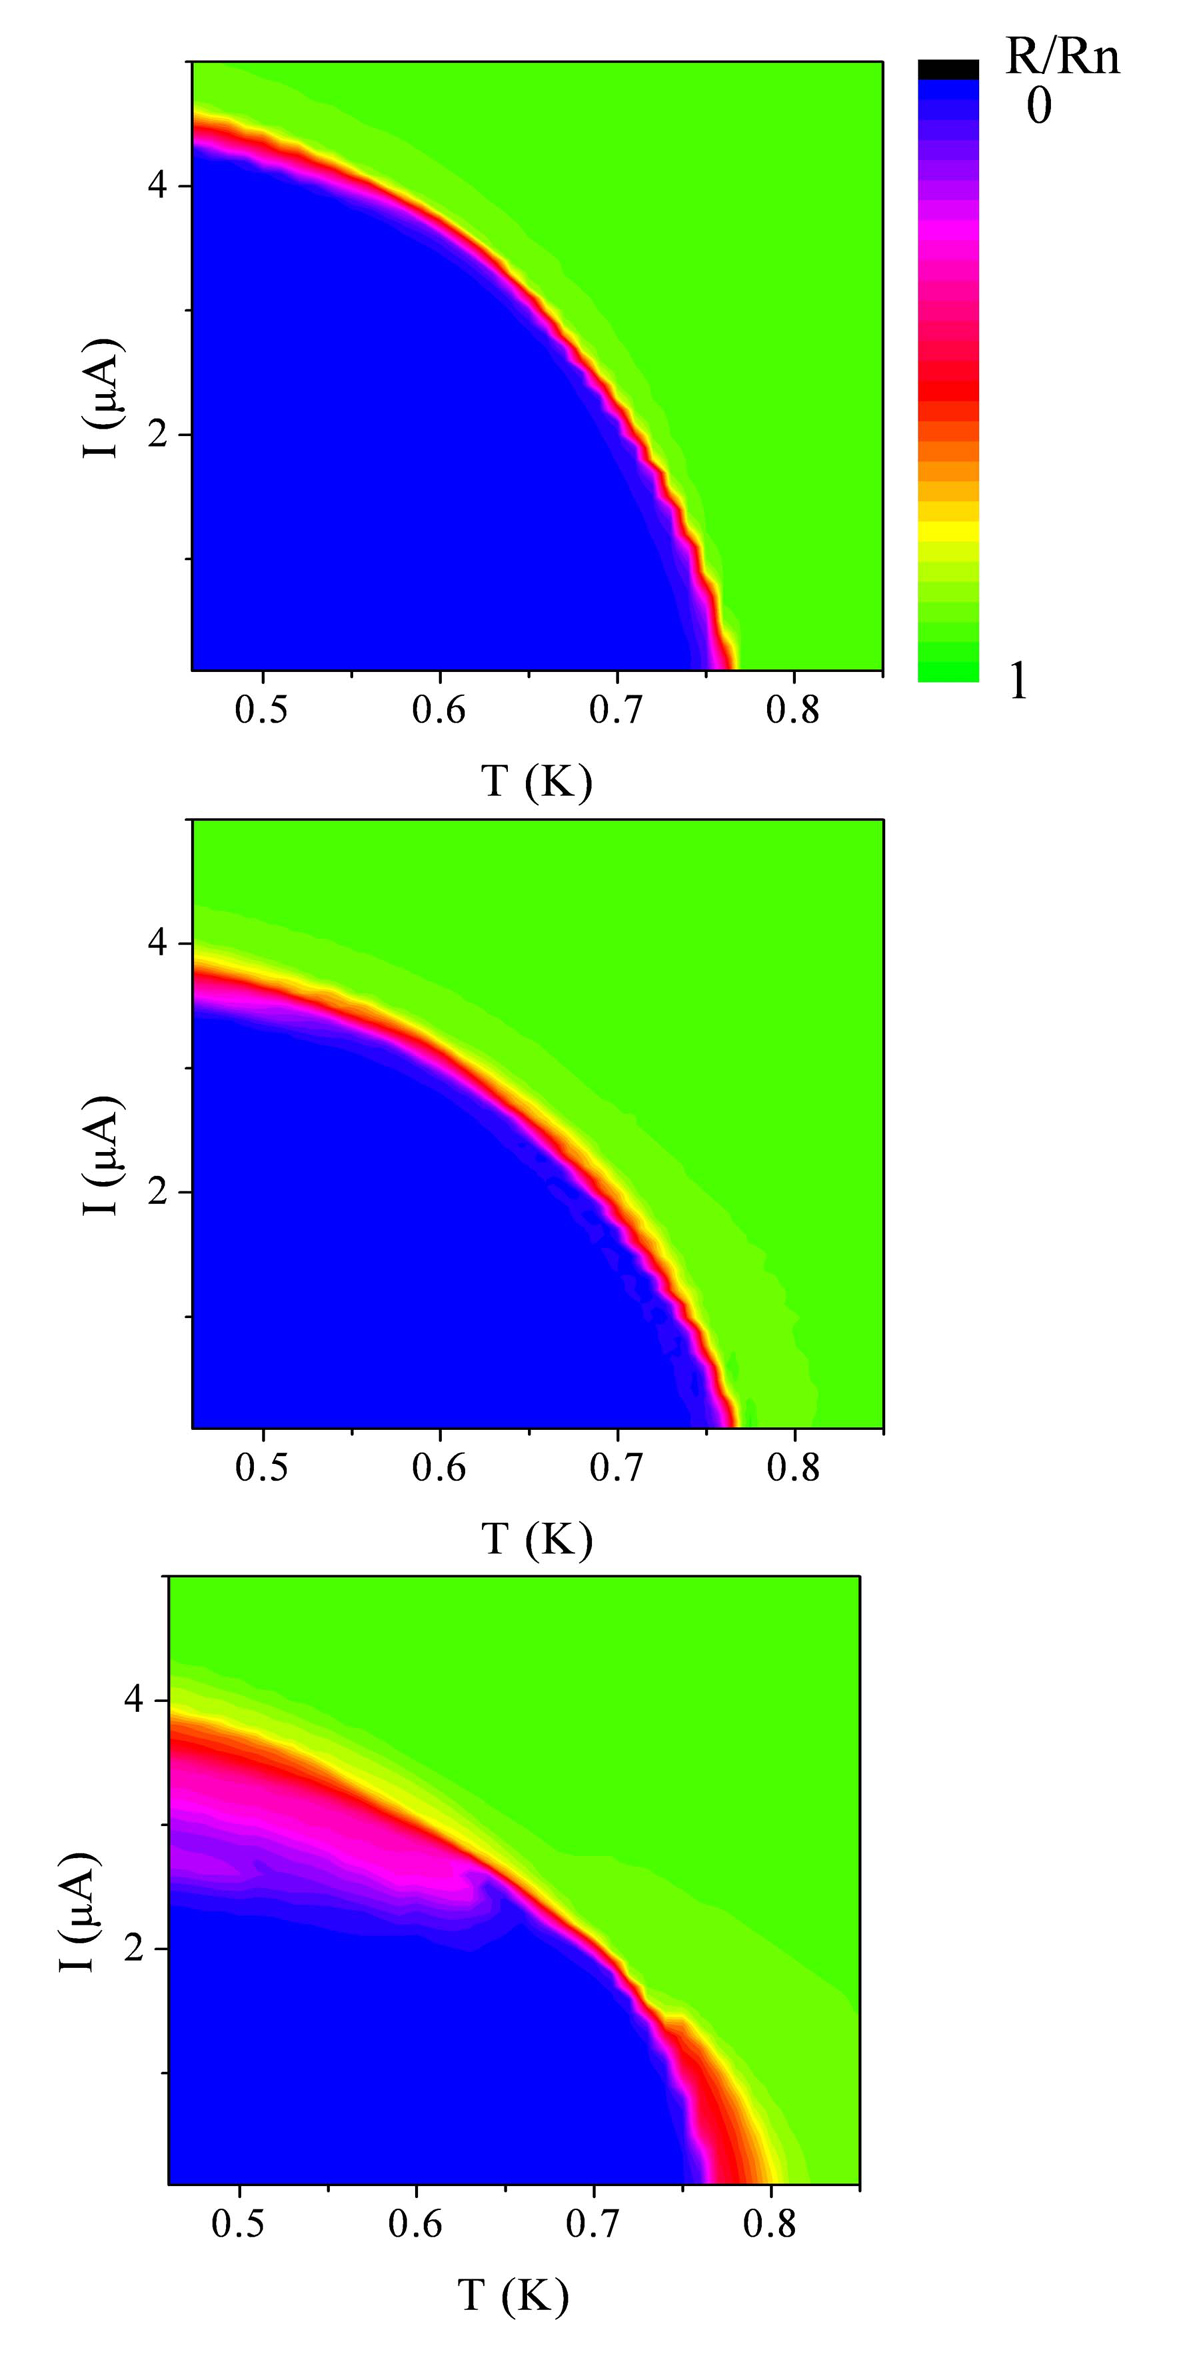
After establishing that the effect is associated with the boundary electrodes, we carried out measurements on wires of different lengths (Sample C: , D: and E: ). In order to minimize variations associated with fabrication, the wires were produced in the same process and on the same substrate. The phase diagrams at 460 mK as a function of current and magnetic field are shown for each wire in Fig. 4. By comparing the enhancement regimes of the three diagrams, the most remarkable feature is that longer wires exhibit a stronger effect, a larger increase of the critical current . This observation is seemingly counterintuitive since the enhancement effect has been shown to be a boundary effect. Naively thinking, the greater the distance to the boundaries, the less influence they should be expected to exert. One might therefore expect a longer wire to exhibit a weaker enhancement and eventually the effect should become negligible for an infinitely long wire.
Further measurements of an even longer wire (Sample F: ), helped to resolve this issue (this wire was prepared in a separate process and was thinner than the other three). In its phase diagram at 460 mK, as shown in Fig. 5(a), the enhancement effect does seem to disappear. However, as is still a finite length, the segments of the wire near the boundary electrodes should still be influenced by them, and therefore there should be some remnant of the enhancement effect in this wire. This can be seen by re-plotting the phase diagram. Instead of having the colors scale to the full range of resistances, a new false color plot was generated with the color scale starting from 80% of the normal resistance, as shown in Fig. 5(b). Immediately, the enhancement can be recognized as the familiar V-shaped structure. However, this structure can no longer be understood as an increase of the lower critical current . Instead, it is a negative magnetoresistance that is only a small fraction of the zero field resistance.
Summarizing the various observations, it is clear that the enhancement effect becomes weaker in the short wire limit, but also becomes weaker in the long wire limit. The existence of these two limits strongly suggests that there are two characteristic length scales that determine the effect. As we will argue in the following, these should be the superconducting coherence length and the quasiparticle relaxation length, two most important length scales for a superconducting system out of equilibrium.TinkhamBook
V Suppression and stabilization of superconductivity
Before discussing the underlying physical mechanism, there is a fundamental question that needs to be addressed: Is this effect a true enhancement of superconductivity by a magnetic field? It has been demonstrated that applying a small magnetic field can cause an increase in the values of currents or temperatures at which the wire leaves its zero resistance state. According to conventional theories of superconductivity, these currents and temperatures directly relate to the amplitude of the order parameter.TinkhamBook Then, the question becomes whether or not applying a magnetic field can increase the amplitude of the order parameter. The answer can be obtained by re-examining the phase diagrams of wires of different lengths, shown in Fig. 4. As mentioned above, these wires were made in the same fabrication process and on the same substrate. Therefore, they are expected to have the same amplitude of the order parameter when at the same temperature, current and magnetic field. Having the superconducting boundaries included, one would expect the argument above to be valid only for wires exceeding the superconducting coherence length , since it is the characteristic length scale to which Cooper pairs can coherently diffuse along the wire. For this reason, we temporarily exclude the wire from the discussion, since its length is on the order of twice the coherence length.
A comparison of the phase diagrams of the and the sample can be made. We first consider the values of at which the wires leave their superconducting states in zero field. It is for the wire and for the wire, a difference of approximately . On the other hand, if one compares the maximum value of in a small magnetic field, one can see that the two wires share almost the same value . This is more evident from a similar comparison of the critical temperatures at which wires leave the zero resistance state at a certain current. The phase diagrams of these two wires at , as a function of temperature and magnetic field, are shown in Fig. 6. Once again, one can see that the maximum values of are almost the same for both wires, but in zero field differs by ( for the wire and for the wire).
Combining the arguments regarding similar superconducting properties between the two samples, it is therefore more appropriate to treat the effect in two steps. First, superconductivity, or more accurately the zero resistance state of the wire is suppressed in zero magnetic field by the applied current. Second, a small magnetic field can induce a recovery or stabilization of the suppressed superconductivity.
It is therefore useful to examine the phase diagrams for these three wires in zero field, shown in Fig. 7.
The suppression is exhibited as broadened transition regions. Cutting slices out of zero-field phase diagrams at for example, one can now understand the phase diagrams of Fig. 4, from the point of view of a recovery of the suppressed zero resistance state when applying a magnetic field. A longer wire would be expected to have a stronger “enhancement” effect since it would exhibit a stronger suppression by current in zero field. A similar argument applies to differences between the diagrams in Fig. 6, for the increase of at in fields.
VI Discussion
Even though it is evident that the observed effect is a recovery of the suppressed superconductivity, its actual physical mechanism remains unclear. In the following, we will present some phenomenological explanations. Following the two-step interpretation, we first consider the suppression of the superconductivity of the wire. At zero field, the suppression of the superconductivity is exhibited as a resistive state over a wide range of applied currents. It is therefore essential to understand the origin of the resistance in the transition regime, as well as the shoulder-like structure. A superconducting wire with non-zero order parameter can acquire a non-zero resistance through several mechanisms. The first one is associated with the penetration of the electric field, when the wire is connected to normal electrodes. This mechanism apparently does not apply here since the electrodes remain superconducting over the whole range of reentrance, as discussed in Section III.
The second mechanism is associated with the formation of phase slip centers. In this case, instead of abruptly transitioning from the superconducting to the normal state at the depairing current, the wire remains resistive over a range of currents. A theory of the current-driven destruction of superconductivity of wires in the quasi-one-dimensional limit was was developed by Kramer and Baratoff.Kramer1977 Their numerical calculations, based on the time-dependent GL equations, demonstrated that the current-driven destruction of superconductivity in one dimension is associated with two currents and . For , the superconducting state is stable. For , the normal state is stable. For , the system remains superconducting while becoming resistive due to phase slip processes. This region corresponds to the transition regime. Since can be roughly taken as the depairing current, this calculation suggests that quasi-one-dimensional superconductors can lose their zero resistance state at currents lower than the depairing current. This resembles the suppression of superconductivity discussed here. Accordingly, and correspond to and in the present study.
For wires of lengths less than the quasiparticle relaxation length and connected to superconducting electrodes, the location of the phase slip center would most likely be at the midpoint of the wire. The observation that shorter wires have a weaker suppression can therefore be explained as coming from their superconductivity being more strongly supported, or the phase slip processes being more strongly suppressed, by the superconducting boundaries. This has been treated in a theoretical study of the conditions for the occurrence of phase slip centers.Michotte2004 The critical current at which phase slips start to occur is obtained by comparing the relaxation rates of the amplitude and phase of the order parameter. With superconducting boundaries,
| (4) |
Here is the quasiparticle relaxation length and (the GL critical current ). One therefore can see that decreases until saturating when the wire length exceeds a certain value. This corresponds to the case in which the phase slip center is out of the range of the boundary, with respect to the exchange of quasiparticles and Cooper pairs. For wires of lengths approaching the coherence length, it is more appropriate to treat the system as a S-c-S junction (S stands for superconductor, c stands for constriction). In this case, the system will have a higher critical current since it now can withstand a higher phase gradient instead of for longer wires. This has been observed as a high critical current for the wire in our study, as shown in Fig. 4(a).TinkhamBook
The coupling between the wire and superconducting electrodes can also help us to understand the shoulder-like structure in curves. This structure suggests a crossover between two different mechanisms associated with resistance in the transition region. In the lower part, the wire is superconducting and the voltage originates from the phase fluctuations at phase slip centers as discussed previously. In the upper part, the wire has been driven normal, and the reduction relative to the normal resistance comes from the proximity effect with the superconducting electrodes. Accordingly, the lower critical current, , is the current at which the order parameter at the midpoint of the wire has become weak enough to be destroyed by the fluctuations.
The second issue is how the application of a magnetic field can lead to the recovery of the suppressed superconductivity. The existing theoretical models are associated with the polarization of spin fluctuations, negative Josephson coupling, reduction of quasiparticle relaxation lengths and the dissipation dampening of phase slips.Rogachev2006 ; Spivak1991 ; Arutyunov2008 ; Vodolazov2007 ; Zaikin1998 As discussed in Ref.16, the first two models cannot be applied to our results. In the following, our discussion will focus on the last two.
is known to be reduced upon the application of a magnetic field.Clarke As phase slips are accompanied by quasiparticle relaxation processes, theoretical studies have shown that this reduction can effectively lead to “enhancements” of superconductivity in one dimension, either as a negative magnetoresistanceArutyunov2008 or as an increase of the critical current.Vodolazov2007 In particular, the critical current has been predicted to increase upon the application of a small magnetic field, and it is especially pronounced for weak superconductors such as Al and Zn. Larger fields, on the other hand, will lead to a decrease of . These increases and decreases originate from the fact that magnetic fields not only reduce but the order parameter as well.Vodolazov2007 This prediction is in good agreement with the observations in the present work, however, several problems still exist with the application of the model to the experimental results. The discussion of the behavior of the relaxation length only considers its variation with field due to changes of the order parameter of the wire. In contrast, the dependence of the observed effect on field orientation demonstrates that the superconducting boundary electrodes play a major role. In addition, the model is based on the time-dependent GL equation, which is not valid in the low temperature regime.
It has also been suggested recently that the small magnetic fields used here cannot appreciably change the value of . However, this does not rule out the possibility of changes in the order parameter in the leads being the cause of the effect. When the order parameter in the leads is suppressed the diffusion of quasiparticles into the wire can become stronger. This could help explain the results seen here and should be pursued further.Vodolazov2010 (29)
As discussed above, the wire resistance in the transition regime below the shoulder is associated with phase slips driven by fluctuations. However, the nature of these fluctuations is unclear for the nanowires studied in the present work. Numerical fits of various models of the temperature dependence of the wire resistance have been carried out. In the low current limit, reasonable fits of thermal activated phase slip models can be obtained.Langer1967 ; McCumber1970
| (5) |
Here, is the quantum resistance for Cooper pairs, is the attempt frequency, and is the energy cost of nucleating a phase slip:
| (6) |
| (7) |
Here is the thermodynamic critical field and is the GL coherence length. Increasing current induces a broadening of the transition such that all the existing models, including those which treat quantum phase slips,Giordano1988 ; Zaikin1997 fail to fit the data. This does not exclude the possibility of quantum phase slips.
In Fig.8, we demonstrate a zero-field phase diagram of a wire (Sample G), with the position of the shoulder in the data labeled as the white line.
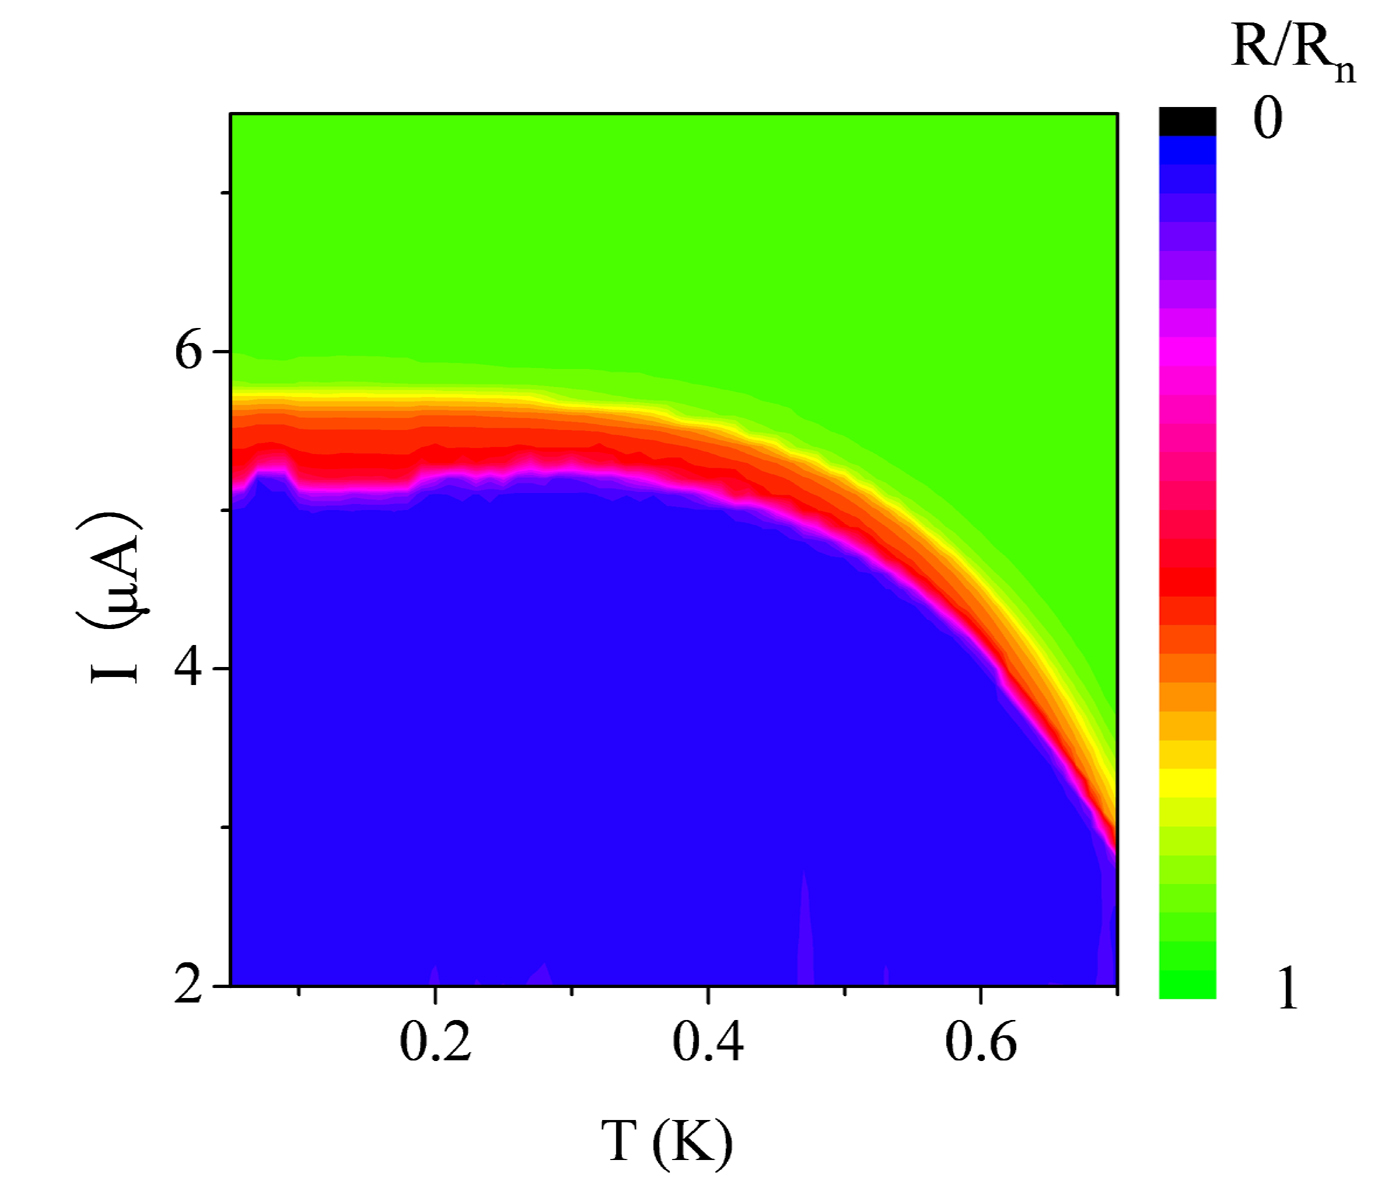
It is clear that the transition region below the shoulder becomes more pronounced at lower temperature, and persists towards zero temperature. As thermal fluctuations are negligible in this temperature range, the result suggests that phase slips in this case might be driven by quantum fluctuations, even though the data cannot fit by existing quantum phase slip (QPS) models.
If the resistance seen in the transition region is driven by QPSs, the field-enhanced superconductivity could then be explained through the interplay between quantum fluctuations and dissipation associated with the increased population of quasiparticles generated upon the application of a magnetic field. Theories of the interplay between dissipation and phase slips driven by quantum fluctuations in superconducting nanowires have been presented.Zaikin1997 ; Refael2007 (30, ) These exploit analogies between nanowires and Josephson junctions.Schmid1983 (31, 32) Dissipation can dampen QPSs and therefore stabilize superconducting long-range order. For a wire connected to electrodes, theoretical studies have shown that dissipation from the external environment can also dampen phase slips.Buchler2004 ; Fu2006
When a magnetic field is applied, it will affect both the phase slips and the dissipation. This was discussed in a calculation of QPS-induced wire resistances:
| (8) |
Here where is the quasiparticle conductance. The effective fugacity of the interacting QPSs, , is proportional to the rate of QPSs.Zaikin1998 An applied magnetic field suppresses the order parameter and increases the rate of QPSs. This leads to an increase of the wire resistance. On the other hand, it will enhance the dissipative term with an increased density of quasiparticles. This increase can be exponentially large at low temperatures compared with the power-law change of the QPS rate. Therefore, a negative magnetoresistance is expected in the low field regime.
Applying these ideas to the present experiments, a phenomenological scenario can be constructed. Increasing the current results in manifestation of the phase slips, which broaden the resistive transition. When a magnetic field is applied, the suppression of the order parameter of the electrodes results in the generation of a large number of quasiparticles. These quasiparticles, when traversing the wire, dampen the phase slip processes that produce resistance, resulting in the wire recovering its zero resistance state.
It is also important to address the issue of heating. At high currents, heating has been known to strongly modify the transition of superconducting wires. The consequence of heating is that a hot spot will be formed and quickly expand along the wire.Skocpol1974 (33, 34) In this case, the wire will directly jump to its normal state and remain normal unless the current is lowered. In this case, the I-V curves are expected to be hysteretic. However, in the present study, both the current and magnetic field driven transitions are reversible without any hysteresis. It indicates the samples are not only in the overdamped regime, but also are sufficiently cooled by their electrical connections and the substrate. This is possibly associated with the fact that the cross-sectional areas are relatively large and resistances are small in the samples. In addition, we exclude the possibility that the magnetic-field-stabilized superconductivity comes from the enhanced thermal conductivity of both the wire and the electrodes in the magnetic field. This exclusion has been discussed in detail in Ref.16, based on the fact that different parts of the transition regime respond to magnetic field differently.
VII Conclusion
When the wire length is short, with a length on the order of the superconducting coherence length, the suppression of superconductivity by the applied current is weak. In this case, the superconductivity of the wire is strongly supported by the superconducting electrodes. The Cooper pairs can easily propagate coherently over the whole length of the wire and phase slips are rare. In the other limit, when the wire length approaches the quasiparticle relaxation length, the stabilization of superconductivity by magnetic field is weak. In this case, quasiparticles from the electrodes need to diffuse a long distance in order to reach the phase slip center - the midpoint of the wire. As a consequence there is a high probability for them to be converted into Cooper pairs. The effect of quasiparticles in dampening phase slip processes is therefore limited. This is why the observed effect is weak when the wire is too short or too long. The recovery of superconductivity is strongest for wires of intermediate lengths, shorter than the quasiparticle relaxation length, but longer than the coherence length.
Although the above is a phenomenological explanation of the effect, it is developed from a set of inferences based on experimental observations and theories not specific to the detailed experimental configuration. A formal theory that can be compared in detail with the experimental results would be needed to fully understand the observed phenomena.
ACKNOWLEDGMENT
The authors thank Alex Kamenev for useful discussions. This work was supported by the U.S. Department of Energy under Grant No. DE-FG02- 02ER46004 and by the National Science Foundation under Grant No. NSF/DMR-0854752. Part of this work was carried out at the University of Minnesota Characterization Facility and the Nanofabrication Center, which receive partial support from the NSF through the NNIN program.
References
- (1) W. A. Little, Phys. Rev. 156, 396 (1967).
- (2) J. S. Langer and V. Ambegaokar, Phys. Rev. 164, 498(1967).
- (3) D. E. McCumber and B. I. Halperin, Phys. Rev. B 1, 1054(1970).
- (4) N. Giordano, Phys. Rev. Lett. 61, 2137 (1988).
- (5) A. D. Zaikin, D. S. Golubev, A. van Otterlo, and G. T. Zimanyi, Phys. Rev. Lett. 78, 1552 (1997).
- (6) R. S. Newbower, M. R. Beasley, and M. Tinkham, Phys. Rev. B 5, 864 (1972).
- (7) C. N. Lau, N. Markovic, M. Bockrath, A. Bezryadin, and M. Tinkham, Phys. Rev. Lett. 87, 217003 (2001).
- (8) M. Zgirski, K.-P. Riikonen, V. Touboltsev, and K. Arutyunov, Nano Letters 5, 1029 (2005).
- (9) F. Altomare, A. M. Chang, M. R. Melloch, Y. Hong, and C. W. Tu, Phys. Rev. Lett. 97, 017001 (2006).
- (10) M. Octavio, W. J. Skocpol, and M. Tinkham, Phys. Rev. B 17, 159 (1978).
- (11) G. R. Boogaard, A. H. Verbruggen, W. Belzig, and T. M. Klapwijk, Phys. Rev. B 69, 220503 (2004).
- (12) H. P. Buchler, V. B. Geshkenbein, and G. Blatter, Phys. Rev. Lett. 92, 067007 (2004).
- (13) H. C. Fu, A. Seidel, J. Clarke, and D.-H. Lee, Phys. Rev. Lett. 96, 157005 (2006).
- (14) M. Tian, N. Kumar, S. Xu, J. Wang, J. S. Kurtz, and M. H. W. Chan, Phys. Rev. Lett. 95, 076802 (2005).
- (15) M. Tian, N. Kumar, J. Wang, S. Xu, and M. H. W. Chan, Phys. Rev. B 74, 014515 (2006).
- (16) Y. Chen, S. D. Snyder, and A. M. Goldman, Phys. Rev. Lett. 103, 127002 (2009).
- (17) U. Schulz et al., J. Low Temp. Phys. 71, 151 (1988); B. N. Aleksandrov, Sov. Phys. JETP 16, 286 (1963).
- (18) M. Tinkham, Introduction to Superconductivity: 2nd ed. (Dover Publication, Inc., 1996).
- (19) J. Bardeen, Rev. Mod. Phys. 34, 667 (1962).
- (20) J. Romijn, T. M. Klapwijk, M. J. Renne, and J. E. Mooij, Phys. Rev. B 26, 3648 (1982).
- (21) L. Kramer and A. Baratoff, Phys. Rev. Lett. 38, 518 (1977).
- (22) S. Michotte, S. Matefi-Tempfli, L. Piraux, D. Y. Vodolazov, and F. M. Peeters, Phys. Rev. B 69, 094512 (2004).
- (23) A. Rogachev, T.-C. Wei, D. Pekker, A. T. Bollinger, P. M. Goldbart, and A. Bezryadin, Phys. Rev. Lett. 97, 137001 (2006).
- (24) B. I. Spivak and S. A. Kivelson, Phys. Rev. B 43, 3740 (1991).
- (25) K. Arutyunov, Physica C: Superconductivity 468, 272(2008).
- (26) D. Y. Vodolazov, Phys. Rev. B 75, 184517 (2007).
- (27) A. D. Zaikin, D. S. Golubev, A. van Otterlo, and G. T. Zimanyi, Physics-Uspekhi 41, 226 (1998).
- (28) J. Clarke, in Nonequilibrium Superconductivity, Phonons, and Kapitza Boundaries, edited by K. E. Gray (Plenum,New York, 1981).
- (29) Vodolazov, D. Y. and Peeters, F. M. Phys. Rev. B 81, 184521 (2010).
- (30) G. Refael, E. Demler, Y. Oreg, and D. S. Fisher, Phys. Rev. B 75, 014522 (2007).
- (31) A. Schmid, Phys. Rev. Lett. 51, 1506 (1983).
- (32) S. Chakravarty, Phys. Rev. Lett. 49, 681 (1982).
- (33) W. J. Skocpol, M. R. Beasley, and M. Tinkham, J. Appl. Phys. 45, 4054 (1974).
- (34) M. Tinkham, J. U. Free, C. N. Lau, and N. Markovic Phys. Rev. B 68, 134515 (2003).