Local superfluid densities probed via current-induced superconducting phase gradients
Abstract
We have developed a superconducting phase gradiometer consisting of two parallel DNA-templated nanowires connecting two thin-film leads. We have ramped the cross current flowing perpendicular to the nanowires, and observed oscillations in the lead-to-lead resistance due to cross-current-induced phase differences. By using this gradiometer we have measured the temperature and magnetic field dependence of the superfluid density and observed an amplification of phase gradients caused by elastic vortex displacements. We examine our data in light of Miller-Bardeen theory of dirty superconductors and a microscale version of Campbell’s model of field penetration.
pacs:
74.50.+r, 74.78.-wGradients in the phase of the superconducting order parameter can be generated by external magnetic fields and sensed using a superconducting quantum interference device (SQUID), invented by Jaklevic et al. REF:Jaklevic1964 . Applications of SQUIDS are numerous SQUIDHB . As demonstrated by Clarke and others, SQUIDS may be used as magnetometers to detect remarkably small magnetic fields, e.g., magnetic fields occuring in living organisms ClarkeSA . A voltmeter based on the SQUID, also developed by Clarke, is capable of measuring 10 fV, i.e. it is times more sensitive than a conventional semiconductor voltmeter SLUG . Micro- and nano-scale realizations of SQUIDs have been fabricated, e.g., in shunted Nb nanojunctions having a sub-micron hole Lam and, more recently, using nanotubes Grenoble . SQUIDs have also been used to study macroscopic quantum phenomena and devices, such as magnetization tunneling Wernsdorfer97 ; Wernsdorfer99 and phase qubits Chiorescu03 .
In this Letter we report on a molecular-templated version of the Jaklevic et al. phase-sensing experiment, in which DNA-templated superconducting nanowires are used instead of Josephson junctions to make a nanowire version of a SQUID (i.e. an N-SQUID). Our main accomplishments are as follows. (1) By measuring the period of the resistance oscillations driven by an externally injected supercurrent, we have performed a direct, local measurement of the superfluid density and its dependence on temperature in the vortex-free regime. Our results cannot be consistently described by the phenomenological Gorter-Casimir and Ginzburg-Landau models. However, we do find good agreement with Miller-Bardeen’s dirty limit of the microscopic BCS theory REF:Bardeen1962 , which was previously examined for MoGe via a different method by the Lemberger group REF:LembergerPRL . (2) We have observed and investigated the amplification of the current-induced phase gradient that occurs when pinned vortices are present in the cross-current-carrying lead. This amplification is brought about by a Lorentz force, which acts on randomly pinned vortices and results in their reversible displacement. In macroscopic settings, this physical phenomenon is the origin of the Campbell law, i.e. the dependence of the magnetic-field penetration depth on the concentration of vortices REF:Prozorov2003 ; Campbell (1969, 1971); Labusch (1968). Our measurements provide a verification of the physics behind the Campbell law, but now at the microscale, as well as the capability of obtaining the Labusch parameter, i.e. the average stiffness of the vortex pinning potential.

Figure 1 shows the fabricated device. First, two MoGe nanowires are created by metal-coating a pair of suspended DNA molecules REF:Hopkins2005 . Then, a focused ion beam is used to cut one of the leads into a horseshoe shape, and thus define a narrow strip through which a cross current () can be applied. Independently, a bias current () can be applied through the nanowires, via which the lead-to-lead resistance is measured Hopkins (2007). The typical width of the cross-current strip is of the order of (e.g., for sample # 2), which is much smaller than the estimated zero-temperature perpendicular magnetic field penetration depth . Thus, the analyses of the results will be carried out under the assumption that the cross current flows uniformly in the cross-current strip. The width of the larger of the two leads, is smaller than , and thus any external field will penetrate both leads without significant attenuation. Moreover, we estimate that the effects of the magnetic field generated by the cross current are negligible. The length of the nanowires, denoted by , is for sample # 2, and the distance between them, denoted by , which determines the spatial resolution of the device, is for this sample. Devices with a better spatial resolution (e.g. with ) were demonstrated in a different setup REF:Hopkins2005 .

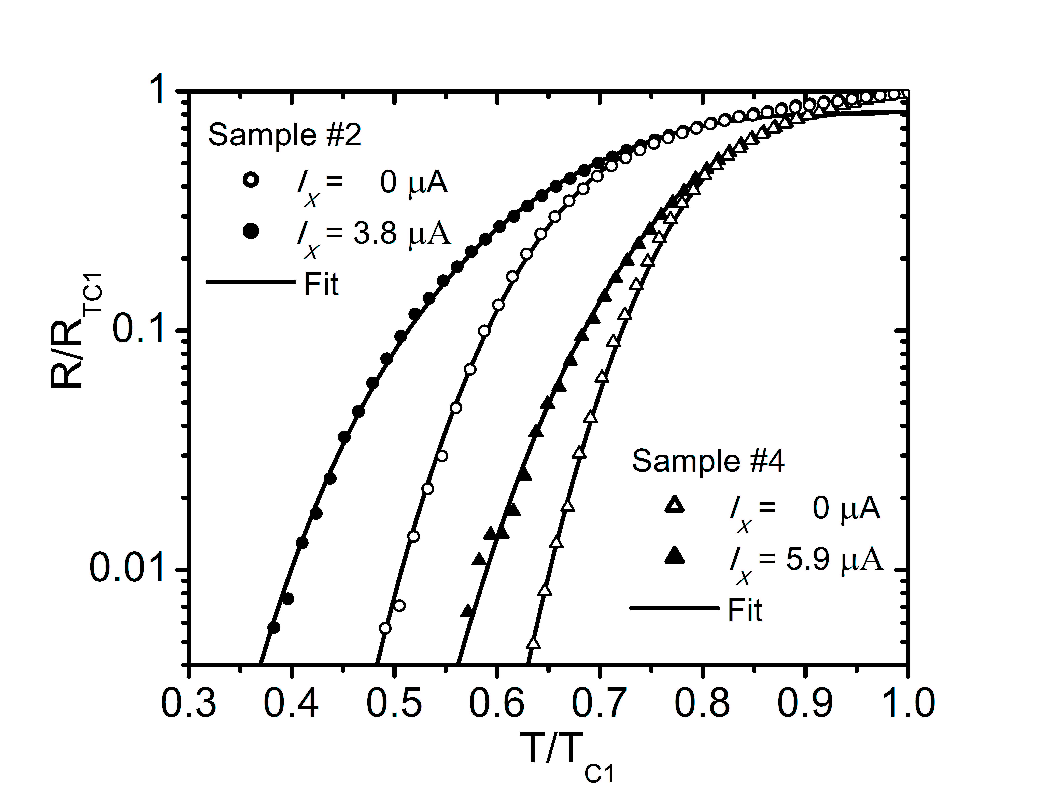
At we observe a broad resistive transition in the nanowires, as the temperature is decreased. Moreover, as is increased, this transition periodically broadens and narrows back to its breadth. We show this transition in Fig. 2 for two samples, each measured at two distinct values of that correspond almost exactly to the minimum and maximum observed transition breadths. The dependence of the resistance follows the theory of thermally activated phase slips (TAPS) Little (1967); Langer and Ambegaokar (1967); McCumber and Halperin (1970), extended to the two-wire case REF:Hopkins2005 ; REF:Pekker2005 . This extended theory involves a modified free-energy barrier for phase slips, which accounts for the inter-wire coupling mediated through the leads. In the short-wire limit, the two-wire device has the current-phase relation of a single Josephson junction with an effective critical current
tuned by the phase gain between the ends of the two nanowires (see Fig. 1). For the cross-current experiment, , where is the phase of the superconducting order parameter and the integral runs between the nanowire ends via the horseshoe lead. We note that the oscillation period, which is the main focus of this Letter, is independent of whether the nanowires are operating in the short wire limit or not. Moreover, and are the critical currents for the nanowires, and are given by Tinkham and Lau (2002). We obtain the device resistance from the damped Josephson junction formula Ivanchenko and Zil’berman (1968); Ambegaokar and Halperin (1969) (Eq. (9) in Ref. Ambegaokar and Halperin (1969)), where we have used the normal-state resistance of the two parallel nanowires for the effective shunt resistance of the junction. Choosing and , we fit the lower and upper curves in Fig. 2.

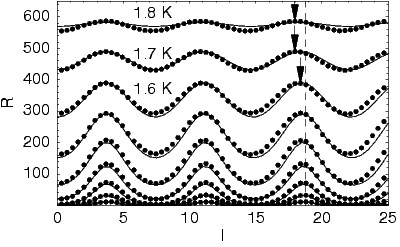
As shown in Fig. 3, the resistance oscillates as a function of , having a period on the order of and an amplitude that is maximal in the middle of the resistive transition. As the arrows in Fig. 3 indicate, the period of the resistance oscillation is temperature-dependent, in contrast with the case of magnetic-field-induced oscillations, which appear to be temperature independent REF:Hopkins2005 . Thus, we have direct proof that the oscillation is not due to a magnetic field induced by the cross current.
The period of the resistance oscillation is determined by the condition that the phase gain be an integer multiple of . For the case of a uniform cross current in a thin-film strip of width and thickness , is related to through the superfluid density : , where and are the electron mass and charge. Thus, by measuring the period of the resistance oscillation vs. , we obtain the superfluid density in the strip carrying the cross current via
| (1) |
The normalized period of the resistance oscillation (and hence the normalized superfluid density) vs. is shown in Fig. 4. To make the fits we have used Miller-Bardeen’s result, applicable to the dirty superconductor case REF:Bardeen1962 ,
| (2) |
where is the critical temperature, is the zero-temperature superfluid density, and is the universal BCS gap relation Tinkham (1996). The fit to Miller-Bardeen’s formula was performed by allowing (and hence ) to be an adjustable scaling parameter. It gives better agreement than do the alternative theories, such as Gorter-Casimir and Ginzburg-Landau. In fact, the fit to Miller-Bardeen’s theory can be further improved by slightly varying . Almost perfect Miller-Bardeen-type fits are obtained with for samples #2, #4, and #6, respectively. Combining the obtained fitting parameters , , , , and , we produce the theoretical curves in Fig. 3 without any additional adjustable parameters.

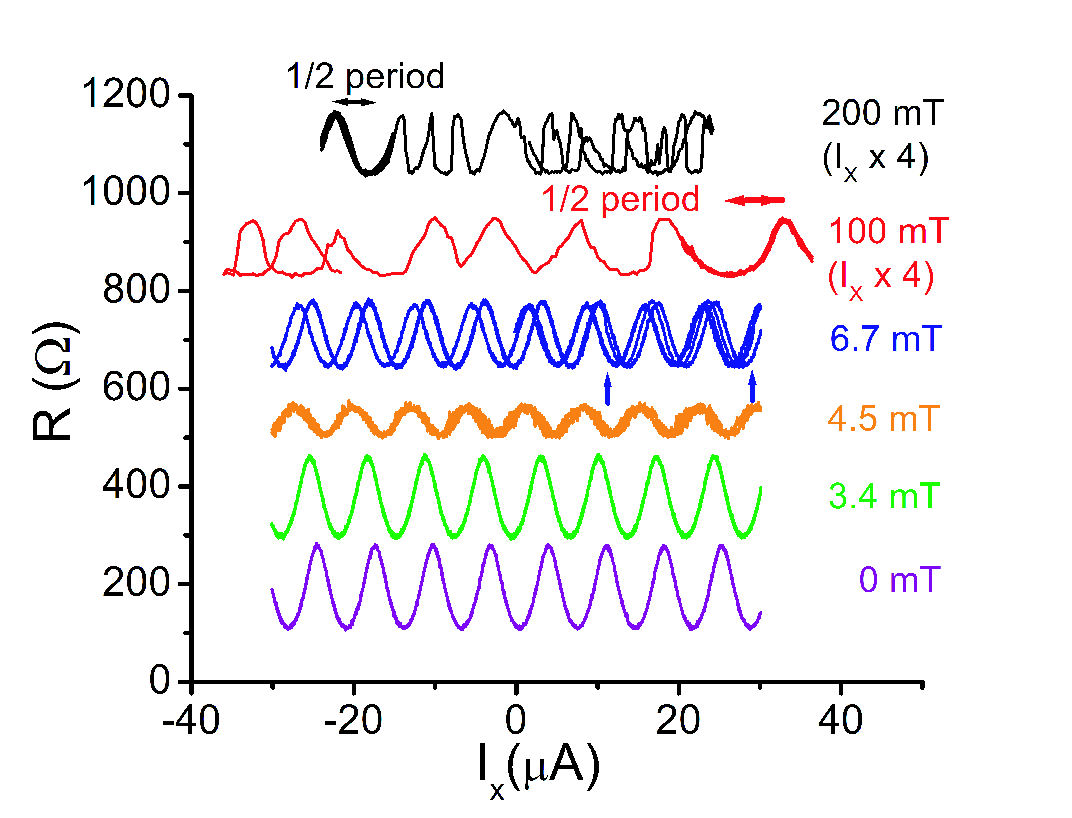
Having shown that our device is capable of sensing resistance oscillations due to phase gradients created by external supercurrents, we now turn our attention to the application of magnetic fields , which induce vortices in the thin-film leads and thus create additional phase gradients. The penetration of vortices into mesoscopic samples was studied previously using other methods (see, e.g. Refs. REF:Martinis ; REF:Baelus2005 ; REF:Arutunov ). All the measurements presented in the following were performed on sample #2. Figure 5 shows the resistance as a function of cross current at several values of applied magnetic field. At low fields, when vortices are absent, the cross-current-induced oscillations are phase shifted with respect to one another for distinct magnetic fields but with no detectable difference in the oscillation period (see curves labeled mT and mT). This shift is due to the additional phase gradient caused by the Meissner currents associated with the applied magnetic field. At fields slightly above for the wider lead (i.e. not the cross-current lead), it is possible to see one of two types of resistance traces. Sometimes, we observe noisy oscillations with a smaller than expected amplitude (e.g. mT) but with the same period as that at . We believe that this is due to one or more vortices that are rapidly wandering near one or both of the nanowires, i.e. a version of motional narrowing. At other times, we observe the type of oscillation as observed below , but with occasional jumps ( mT) which become more frequent when the field is larger. At fields above for the cross-current carrying lead (i.e. the lead with the larger ), the period begins to decrease, as shown by the highlighted segments for the mT and mT traces in Fig. 5. As vortex jumps are prevalent at these fields, and our goal is to measure the period for a given vortex configuration, we determine the period by measuring it within “quiet regions” (i.e. current intervals exhibiting no jumps). Examples of such regions are indicated in Fig. 5 by horizontal arrows for the and mT traces.

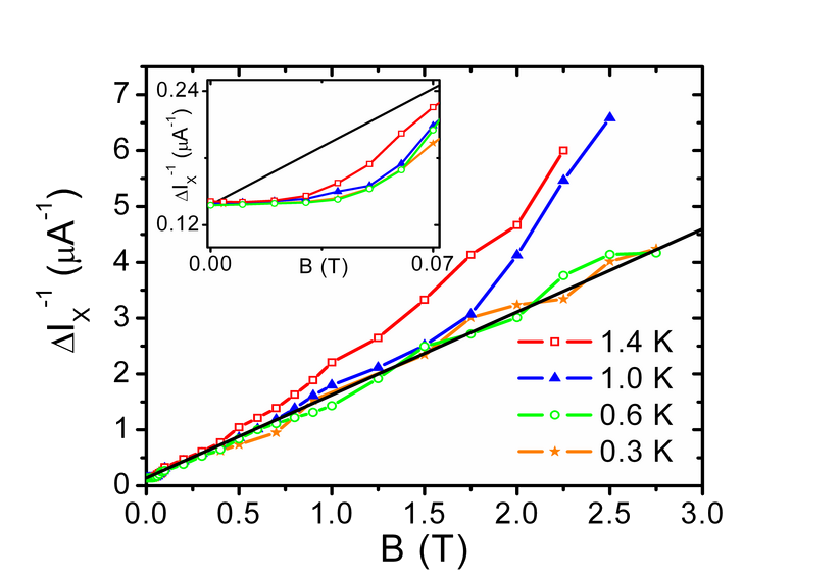
We have investigated the resistance oscillation period as a function of magnetic field at four temperatures by making several scans of in “quiet regions,” in which it was possible to observe at least one peak and one valley several times before a vortex jump occurred. At temperatures below mK, at which the device has an undetectably small zero-bias resistance, we obtained the period from large bias-current resistance measurements (i.e. beyond the linear response regime). At each field and temperature, several measurements of the period were recorded and averaged. Smoothed curves of the inverse period, obtained via a moving average, are shown as functions of magnetic field in Fig. 6. We observe a roughly linear increase of the inverse period; compared to its zero-field value, the period at T is some thirty times smaller. Such behavior is analogous to the linear dependence of the perpendicular penetration depth on applied magnetic field (in the regime in which the vortex density is proportional to the field), i.e. the Campbell formula REF:Prozorov2003 ; Campbell (1969, 1971), adapted for thin films: . Here, is the vortex pinning force constant (i.e. the Labusch parameter Labusch (1968)). In the present setting, the phase fields from the vortices, displaced due to , enhance the phase gradients resulting from the cross current, resulting in a period for resistance oscillations that shortens with . We can therefore tie the Campbell prediction to the measured period by assuming the usual relation . From this and Eq. (1), we expect that the inverse period should increase linearly with magnetic field for our thin-film leads, . We estimate that ; other materials have yielded, e.g., REF:Prozorov2003 and PesetskiLemberger . Furthermore, the inferred value of is consistent with an estimate made using bulk penetration depth and film thickness data footnote:penetration . As Fig. 6 shows, the inverse period does indeed increase linearly, except at higher temperatures and fields. In those regimes, inter-vortex interactions become important and hence, can be effectively reduced. At high temperatures, vortices explore a larger area and are less sharply pinned. For fields below , no vortices exist in the horseshoe lead, and the period does not depend on the field. The deviation from linear field-dependence observed slightly above (Fig. 6 inset) arises because in this regime the vortex density grows sublinearly with the field.
Regarding the future applications of our N-SQUID gradiometer, we remark that it can be used not only to measure the local superfluid density, e.g., in connection with the fate of the Josephson effect in ultra-thin film systems Hermele , but also to shed light on settings in which local fluctuations of the superfluid density have been predicted, such as highly disordered s-wave 2D superconductors Trivedi and superconductors having magnetic impurities Simons .
Acknowledgments— This work was supported by DOE DEFG02-96ER45434 and DEFG02-91ER45439 and by NSF DMR 0134770. DSH and AB acknowledge the access to the fabrication facilities at the Frederick Seitz Materials Research Laboratory.
References
- (1) R. C. Jaklevic et al., Phys. Rev. Lett. 12, 159 (1964).
- (2) The SQUID Handbook: Vols. I & II, J. Clarke and A. I. Braginski (eds.) Wiley-VCH (2004 & 2006).
- (3) See, e.g., J. Clarke, Scientific American 271, 49 (1994).
- (4) J. Clarke, Phil. Mag. 13, 115 (1966).
- (5) S. K. H. Lam and D. L. Tilbrook, Appl. Phys. Lett. 82, 1078 (2003).
- (6) J.-P. Cleuziou et al., Nature Nanotech. 1, 53 (2006).
- (7) W. Wernsdorfer, et al. Phys. Rev. Lett. 79, 4014 (1997).
- (8) W. Wernsdorfer and R. Sessoli, Science 284, 133(1999).
- (9) I. Chiorescu et al., Science 299, 1869 (2003).
- (10) P. B. Miller, Phys. Rev. 113, 1209 (1959). J. Bardeen, Rev. Mod. Phys. 34, 667 (1962).
- (11) S. J. Turneaure, T. R. Lemberger, and J. M. Graybeal, Phys. Rev. Lett. 84, 987 (2000).
- (12) R. Prozorov et al., Phys. Rev. B 67, 184501 (2003).
- Campbell (1969) A. M. Campbell, J. Phys. C 2, 1492 (1969).
- Campbell (1971) A. M. Campbell, J. Phys. C 4, 3186 (1971).
- Labusch (1968) R. Labusch, Phys. Rev. 170, 470 (1968).
- (16) D. S. Hopkins et al., Science 308, 1762 (2005).
- Hopkins (2007) D. S. Hopkins, Ph.D. thesis, University of Illinois (2007).
- Little (1967) W. A. Little, Phys. Rev. 156, 396 (1967).
- Langer and Ambegaokar (1967) J. S. Langer and V. Ambegaokar, Phys. Rev. 164, 498 (1967).
- McCumber and Halperin (1970) D. E. McCumber and B. I. Halperin, Phys. Rev. B 1, 1054 (1970).
- (21) D. Pekker et al., Phys. Rev. B 72, 104517 (2005).
- Tinkham and Lau (2002) M. Tinkham and C. N. Lau, Appl. Phys. Lett. 80, 2946 (2002).
- Ivanchenko and Zil’berman (1968) Y. M. Ivanchenko and L. A. Zil’berman, Zh. Experim. i Teor. Fiz. 55, 2395 (1968).
- Ambegaokar and Halperin (1969) V. Ambegaokar and B. I. Halperin, Phys. Rev. Lett. 22, 1364 (1969).
- Tinkham (1996) For a review, see M. Tinkham, Introduction to Superconductivity (McGraw-Hill, New-York, 1996), 2nd ed.
- (26) The measured of the nanowires () is smaller than that of the film leads (), due to suppression by disorder and electron-electron interactions. See, e.g., J. M. Graybeal et al., Phys. Rev. Lett. 59, 2697 (1987), and Y. Oreg and A. M. Finkel’stein, Phys. Rev. Lett. 83, 191 (1999).
- (27) G. Stan, S. B. Field, and J. M. Martinis, Phys. Rev. Lett. 92, 097003 (2004).
- (28) B. J. Baelus et al., Phys. Rev. B 71, 140502(R) (2005).
- (29) K. Yu. Arutyunov and T. T. Hongisto, Phys. Rev. B 70, 064514 (2004).
- (30) A. A. Pesetski and T. R. Lemberger, Phys. Rev. B 62, 11826 (2000).
- (31) From the London penetration depth of MoGe [see B. L. T. Plourde et al., Phys. Rev. B 66, 054529, (2002)], we estimate a thickness , compared to the sputtered thickness of . The film can have become oxidized, resulting in thickness, and is also slightly damaged by the focus ion beam.
- (32) M. Hermele et al., Nature Physics 1, 117 (2005).
- (33) A. Ghosal, M. Randeria, and N. Trivedi, Phys. Rev. Lett. 81, 3940 (1998).
- (34) A. Lamacraft and B. D. Simons Phys. Rev. Lett. 85 4783 (2000).