Evidence for particle-hole excitations in the triaxial strongly-deformed well of 163Tm
Abstract
Two interacting, strongly-deformed triaxial (TSD) bands have been identified in the nucleus 163Tm. This is the first time that interacting TSD bands have been observed in an element other than the Lu nuclei, where wobbling bands have been previously identified. The observed TSD bands in 163Tm appear to be associated with particle-hole excitations, rather than wobbling. Tilted-Axis Cranking (TAC) calculations reproduce all experimental observables of these bands reasonably well and also provide an explanation for the presence of wobbling bands in the Lu nuclei, and their absence in the Tm isotopes.
pacs:
21.10.Re; 21.60.Ev; 23.20.Lv; 27.60.+jStable asymmetric shapes have been a longstanding prediction of nuclear structure theory bohr . However, experimental evidence for such triaxial nuclei has proven difficult to establish. Still, triaxial shapes have been invoked to interpret a number of experimentally-observed nuclear structure phenomena such as signature inversion what1 and anomalous signature splittings what2 , chiral twin bands frau1 , and, most recently, the wobbling mode ham . Indeed, it has been generally agreed that the most convincing experimental evidence for stable triaxial shapes is provided by the wobbling mode, recently established in a number of odd-A Lutetium () nuclei wob1 ; wob2 ; wob3 ; wob4 ; wob5 ; wob6 ; wob8 . The nuclear wobbling motion, akin to the motion of an asymmetric top, is indicative of the three-dimensional nature of collective nuclear rotation bohr . In the quantum picture, the low-spin spectrum of such a system corresponds to that of the well-known Davydov asymmetric rotor. However, the low spin data do not allow a clear distinction between a rigid rotor and a system that is soft with respect to triaxial deformation. At high spins, the sequence of levels that can be associated with the excitation of wobbling phonons can be better distinguished from soft vibrations. The mode is evidenced in the Lu nuclei by families of strongly deformed (SD) triaxial rotational bands connected to one another and representing different wobbling phonon quantum numbers ; bands up to have been observed thus far wob3 . However, it has been surprising (and, indeed, somewhat frustrating) that in no other element has this mode been observed so far. Indeed, even though a number of SD bands have been reported in several nearby nuclei (up to 8 in case of 174Hf!), many of which may be grouped into possible families based on similarities of their dynamic moments of inertia, there has been no evidence for connecting transitions between these bands hart1 ; hart2 . Such connecting transitions are a sine qua non condition of wobbling bands and strong , linking transitions between the () and wobbling partners are expected to occur over a large spin range.
We report the observation of two SD bands in the nucleus 163Tm, an isobar of 163Lu, the nucleus with the most extensive experimental evidence for wobbling bands wob3 . We have identified several transitions connecting the two bands; however, these are unlike the characteristic transitions between wobbler bands and, instead, are akin to a “particle-hole excitation”. Still, this is the first time that two triaxial SD bands with interconnecting transitions have been observed in any element other than Lu. The properties of these bands are well reproduced by calculations in the framework of the Tilted-Axis Cranking (TAC) model. Moreover, the calculations provide an explanation of why one observes particl-hole eexcitations in the Tm nuclei, but wobbling in the Lu isotopes.
High spin states in 163Tm were populated via the 130Te(37Cl,4n)163Tm reaction, at a bombarding energy of 170 MeV. The beam was provided by the 88-inch cyclotron facility at the Lawrence Berkeley National Laboratory. A self-supporting, isotopically enriched target-foil of about 0.5 mg/cm2-thickness was used. To prevent contamination and degradation of the target, it was coated with an Aluminum layer, about 0.04 mg/cm2-thick, on both sides. Quintuple- and higher-fold coincidence events were recorded with the Gammasphere array gs ; at the time of the experiment, the array had 98 active Compton-suppressed HPGe detectors. A total of about one billion events was accumulated and stored onto magnetic tapes for further analysis. The data-analysis procedures for developing the level schemes from Gammasphere data, and for assignments of spins and parities based on DCO ratio measurements, are more-or-less standard by now and only the most pertinent details are provided here. The data were sorted into three-dimensional and four-dimensional histograms iucsort ; radware and analyzed by projecting double- and triple-gated coincidence spectra. The analysis has resulted in extensive development of the level scheme of 163Tm; a partial level scheme, relevant to the subject matter of this Letter,
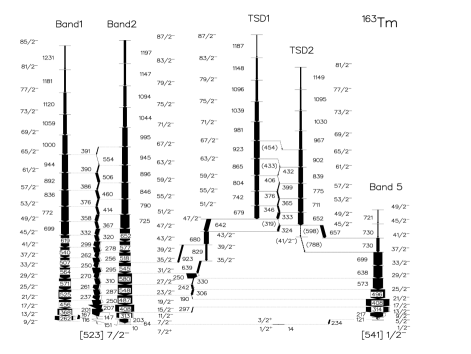
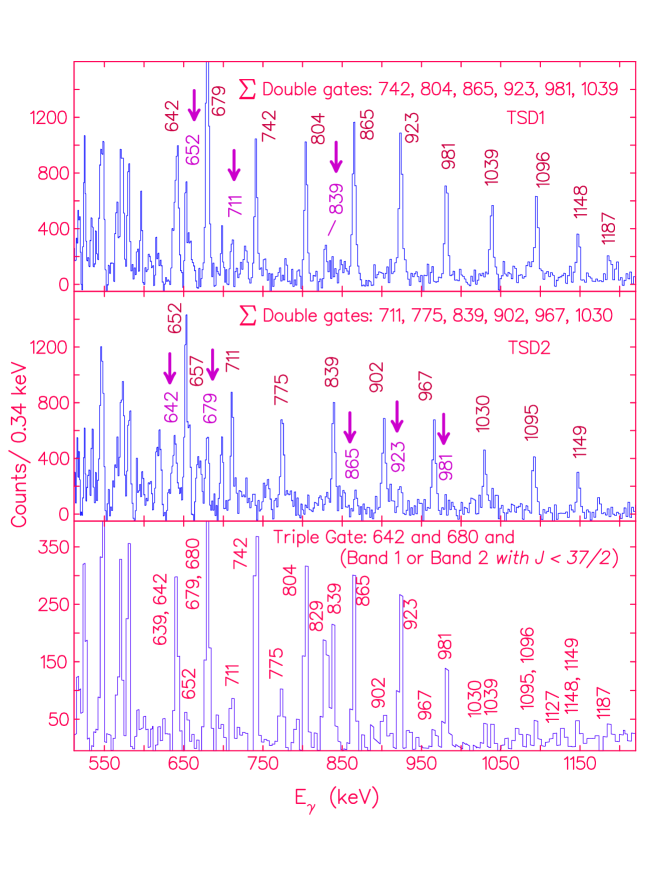
is presented in Fig. 1. Supporting coincidence spectra are illustrated in Fig. 2: the top and middle panels show, respectively, the -ray transitions in the sequences labeled TSD1 and TSD2, with an energy spacing 60 keV; the bottom panel displays many of the “connecting” transitions in coincidence with the bands. Each of these bands is of about 2-3% of the total intensity in 163Tm.
Angular correlation analyses helped in ascertaining the = 2 character of the transitions in these bands; they have all been assigned an multipolarity. The linking transitions are found to be = 1 in character, with small possible admixtures, and have been assumed to be of multipolarity. The spin and parity quantum numbers of the two bands are established on the basis of the multipolarities of the transitions linking them to the previously-known states in this nucleus tmold . With the established level scheme and the proposed multipolarity assignments, the alignments, , and the dynamic moment of inertias, , have been calculated and are plotted as a function of rotational frequency in the Fig. 3. These plots
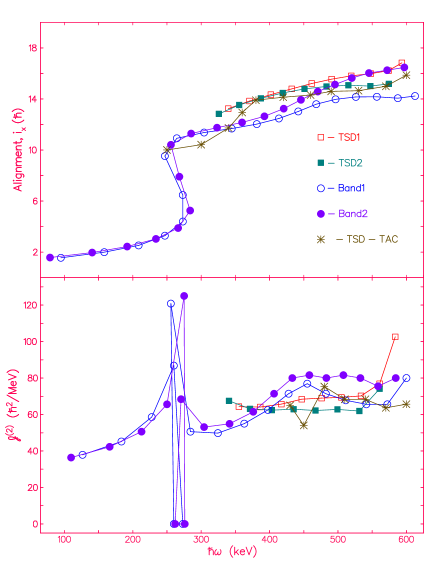
suggest that the properties of these bands are very similar to those of other triaxial strongly-deformed (TSD) bands observed in this region and, thus, have triaxial deformation similarly. Their SD nature has been established in a separate DSAM measurement wang , where the average associated transition quadrupole moments were found to be 8.5 eb in both bands. We note that, although the dynamic moments of inertia associated with the yrast bands (labeled Band1 and Band2 in Figs. 1 and 3) are very similar to those in TSD1 and TSD2, the DSAM measurements wang indicate that their associated moments are significantly smaller ( 6 eb).
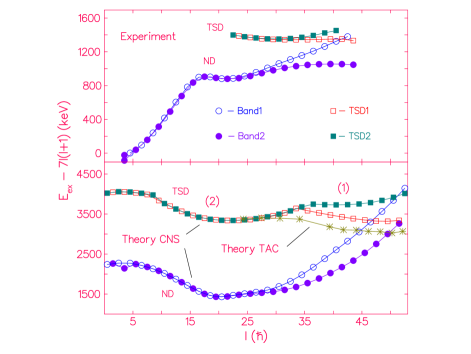
Fig. 4 shows the excitation energies of these TSD bands relative to a rigid rotor reference. The exhibited pattern is quite different from that observed in the case of wobbling bands (see, for example, Fig. 14 in Ref. wob2 ), and is indicative of the very different nuclear structure associated with these bands. Another major difference from the wobbling bands is that the transitions between TSD1 and TSD2 are “interconnecting”, i.e., there are linking transitions going both ways between the two bands, whereas for the wobbler bands the connecting transitions always proceed only from the band with a higher value to that with a lower .
To understand the observed properties of these bands and their distinct differences from the sequences in the Lu nuclei, we have performed calculations in the frameworks of the configuration-dependent Cranked Nilsson-Strutinsky (CNS) model cns and the Tilted-Axis Cranking model (TAC, Shell Correction version SCTAC) tac . The CNS model is a special case of the TAC approach assuming that the axis of rotation is one of the principal axes. If this axis turns out to be stable, CNS calculations provide a solution of the TAC problem. If it is unstable, one has to use the TAC code to find the tilted solution. The technically simpler CNS calculations were carried out first, using the parameters advocated in Ref. cns for the deformed mean field. The same set was subsequently used for the TAC calculations. Pairing was assumed to be zero; CNS calculations without pairing have been successfully applied in numerous cases in the spin range considered here ragnar .
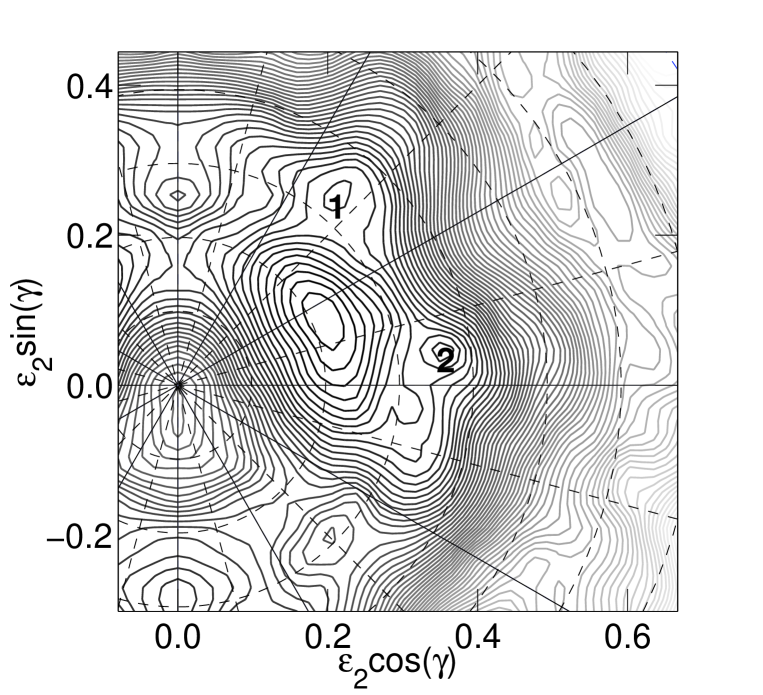
Fig. 5 presents the CNS energy of a configuration with (see details below) as function of the deformation and the triaxility parameter for . Similar to Ultimate Cranker calculations in Refs. wob1 ; wob2 ; wob3 ; wob4 ; wob5 ; wob6 ; wob8 ; bengt , the CNS model gives a prolate minimum at normal deformation (), which we refer to as ND, and two triaxial strongly deformed minima, which we refer to as TSD. It is worth pointing out that, in contrast with previous calculations with and N 94 wob1 ; wob2 ; wob3 ; wob4 ; wob5 ; wob6 ; wob8 , the proton level is empty in 163Tm, which means that this level is not essential in forming the TSD minima. Rather, it is the gap in the neutron spectrum at 0.39, 17∘ which stabilizes the TSD shape (cf. Ref. bengt , Fig. 3).
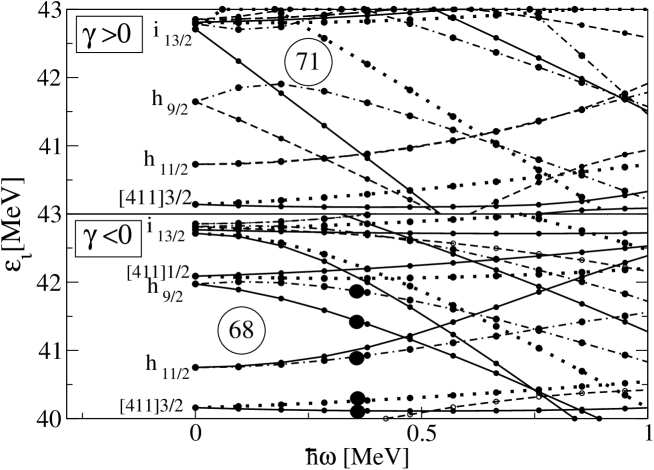
Fig. 6 presents the single proton routhians in both of the TSD minima. The TSD configuration that we assign to the observed band TSD1 is indicated by the large filled circles on the occupied levels. It is the lowest configuration with negative parity and small signature splitting. There are competing configurations with similar energy, which will be discussed below. The single-proton routhians in the ND minimum (not shown) look similar to the ones of Fig. 6, except that the orbital has a larger splitting between the two signatures, as expected for the associated smaller deformation. We interpret bands 1 and 2 after the backbend as the two signatures of the odd proton occupying the level at the Fermi surface. In contrast to the TSD configuration, the proton pair on the routhians is placed on the routhians in the ND configuration. Fig. 4 compares the calculated and experimental energies. The observed substantial signature splitting is consistent with the calculation. The measured transition quadruple moment for ND bands of 6 eb agrees well with the CNS calculation, which gives values around 6.5 eb.
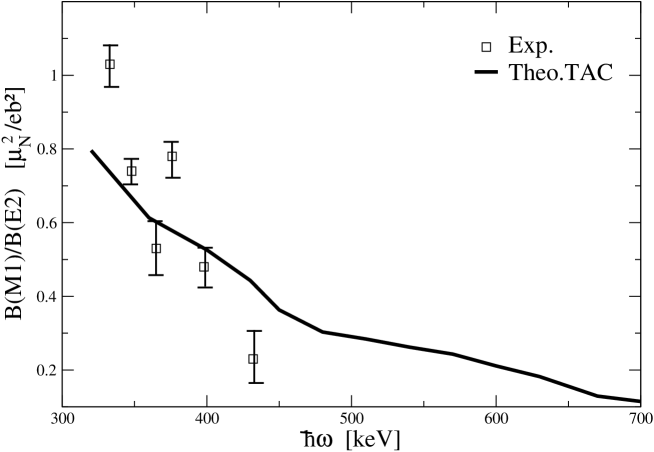
As seen in Fig. 5, the two TSD minima have nearly the same energy. It is clear from the bottom panel of Fig. 4 that minimum 2 is energetically favored at low spin and minimum 1 at high spin. The two minima have almost the same value of and , indicating that both are associated with the same shape. The axis of rotation is the short one in minimum 1 (with ), while it is the intermediate one for minimum 2 (with ). Thus, the CNS calculations suggest that at = 24, where minimum 1 goes below minimum 2, the orientation of the rotational axis flips from the intermediate to the short axis. This sudden flip is caused by the inherent assumption in the CNS model that the rotational axis must be a principal one, and in fact indicates that this assumption of rotation about a principal axis is inappropriate. Therefore, TAC calculations, which do not restrict the orientation of the rotational axis, were carried out. As expected, a tilted solution with lower energy was found, which smoothly connects minimum 2 with minimum 1. For the angular momentum vector moves away from the intermediate axis toward the short axis. It does not quite reach it within the considered spin range. (For , the angle with the intermediate axis is still about 20∘.) This solution is assigned to bands TSD1 and TSD2. In accordance with the experiment, it corresponds to a band without signature splitting. The observed onset of signature splitting at the highest spins is consistent with the calculated approach of the TAC solution to minimum 1 of the CNS result. At large frequency, the calculated TSD bands have a lower energy than the ND ones, which is consistent with the experiment whereby Band 1 crosses TSD1 at the highest spins. The TAC calculations for TSD bands give values of the transition quadruple moment that increase slightly from 8.7 eb at to 9.6 eb for , in agreement with the experimental values 8.5 eb. Furthermore, as seen in Fig. 7, the calculated B(M1)/B(E2) ratios of TSD bands agree well with experimental values. Finally, Fig. 3 demonstrates that the calculations also reproduce the experimental alignments and the dynamic moments of inertia very well. Thus, all experimental observables for the TSD bands are accounted for by the TAC calculations.
The configurations that we assign to the bands TSD1 and TSD2 (indicated by the large filled circles in Fig. 6) are the lowest with negative parity and small signature splitting, in agreement with the experiment. The CNS calculations also predict four other TSD configurations (termed TSD3, TSD4, TSD5, and TSD6 in the discussion below) at somewhat lower energy than TSD1 and TSD2. The positive-parity configurations TSD3 and TSD4 have the odd proton on one of the routhians and have both signatures occupied; they are predicted by the CNS calculations to lie about 500 keV below TSD1 at spin 20 and have a larger energy above spin 50. However, as can be seen in Fig. 10 of Ref. tmold , some residual proton pair correlations in the lower-spin part will disfavor the configurations TSD3 and TSD4 with respect to TSD1 and TSD2. The configurations TSD5 and TSD6, with both signatures of the orbital occupied and the odd proton on one of the two routhians, would correspond to two well-separated sequences with little resemblance to the experiment. The favored signature branch, TSD5, is predicted by the CNS calculations to lie about 500 keV below TSD1 at spin 20 and to have a larger energy than TSD1 above spin 40. We note here that the location of the orbital has been a longstanding open problem in calculations using the modified oscillator potential (cf. the discussion in Ref. tmold ). On the other hand, Ref. witek demonstrated that the Woods-Saxon potential (universal parameters) reproduces the position of this orbital well for normal deformations. A calculation using the hybrid version of TAC dimitrov , which is a good approximation of the Woods-Saxon potential, with = 0.4, =0.04, and = 17∘, all choices close to the self-consistent values, places TSD1 and TSD2 at about the same energy as TSD4 and TSD5 for the low spins, and below them for the higher spins. This points to possible problems with the modified oscillator potential for the TSD shapes which appear to be absent in the Woods-Saxon potential.
The single particle routhians in Fig. 6 provide a natural explanation for the presence of collective wobbling excitations in the Lu isotopes with and their absence in 163Tm with . The TSD configurations of nuclei with belong typically to minimum 1 with bengt . For , the Fermi level is the routhian of parentage in the frequency range 250 keV450 keV. The lowest TSD band is observed in this frequency range and has . The lowest particle-hole (p-h) excitation of the same parity lifts the odd proton on to the other signature, , of this level, which lies at a relatively high energy ( 1 MeV at = 0.4 MeV). This brings the collective wobbling excitation, which has an excitation energy of about 0.3 MeV, well below the lowest p-h excitations. For , however, the two signatures of the h11/2 state are quite close together (cf. Fig. 4). Therefore, the wobbling excitation lies above the p-h excitations, likely too high in excitation energy to be populated with observable strength in the reaction employed in the present study. It is also worth mentioning that the relative energy of the collective wobbling mode and of the p-h excitations in 163Lu has been studied by means of the triaxial particle rotor model, where the p-h excitations have been called the “cranking mode” wob8 . These are found to be located well above the one-phonon wobbling excitation. With the level order suggested in Fig. 6, one expects, for , a band structure similar to the one seen in at somewhat higher energy; it is obtained by lifting the last proton from the into the orbital. For , several TSD bands of both parities with similar energy are expected.
The possibility to experimentally identify a wobbling band is restricted by the competition of this collective excitation with the p-h excitations. If the energy of the p-h excitations is high and the energy of the wobbling band is low, it may become the first excited band above the yrast line. Such a case appears to be realized in the Lu isotopes. The opposite occurs in 163Tm. The energy for the p-h excitations between the signature partners of the orbital is much smaller than the wobbling energy. In the experiment, only the first excited band, which corresponds to a p-h excitation, appears to have received sufficient intensity for observation, As seen in Fig. 6, the proton level density in the frequency range of 300-500 keV is larger for = 72 and 73. Moreover, we find that there is a gap at = 94 in the neutron diagrams, which prevents the neutron p-h excitations to compete with the wobbling mode in the Lu isotopes. Around = 102-104, the density of neutron orbitals is high in the relevant frequency range. This means that, for these nuclides, many low-lying p-h excitations are possible, and it would be difficult to disentangle a collective wobbling structure from these many bands. Moreover, the wobbling mode is expected to be fractionated among the p-h excitations of the same parity. This would account for the presence of many strongly deformed bands in these nuclei hart1 ; hart2 , none of which shows the characteristics of a wobbling mode. Based on this observation, Ref. hart1 suggested that these nuclides might be less triaxial than the Lu isotopes. However, as discussed above, the apparent absence of a wobbling band does not necessarily imply a near-axial shape; indeed, that would be in contradiction with our calculations as well as with earlier ones bengt .
In summary, two interacting strongly-deformed triaxial (TSD) bands have been observed in the =69 nucleus 163Tm. This is the first observation of interacting TDS bands in an element other than Lu where wobbling bands have been identified. The observed TSD bands in 163Tm appear to correspond to particle-hole excitations, rather than to wobbling. Tilted Axis Cranking calculations reproduce all experimental observables for these bands reasonably well. The calculations also provide an explanation for the presence of wobbling bands in the Lu isotopes and their absence in the nearby Tm, Hf, and Ta isotopes ( = 69, 72, 73).
The authors express their gratitude to Drs. D. Ward, R.M. Clark, and P. Fallon for their invaluable assistance with the measurements with Gammasphere. This work has been supported in part by the U.S. National Science Foundation (Grants No. PHY04-57120 and INT-0111536), the Department of Science and Technology, Government of India (Grant No. DST-NSF/RPO-017/98), the U.S. Department of Energy, Office of Nuclear Physics, under contract No. W-31-109-ENG-38 and Grant DE-FG02-95ER40934 and the U.K. Science and Engineering Research Council.
References
- (1) A. Bohr and B. Mottelson, Nuclear Structure, Vol. II (World Scientific, Singapore, 1998).
- (2) R. Bengtsson, H. Frisk, and F.R. May, Nucl. Phys. A415 (1984) 189.
- (3) I. Hamamoto et al., Phys. Lett. B 201 (1988) 415.
- (4) S. Frauendorf, Rev. Mod. Phys. 73 (2001) 463.
- (5) G.B. Hagemann and I. Hamamoto, Nucl. Phys. News 13 (2003) 20.
- (6) S.W. degrd et al., Phys. Rev. Lett. 86 (2001) 5866.
- (7) D.R. Jensen et al., Nucl. Phys. A703 (1990) 3.
- (8) D.R. Jensen et al., Phys. Rev. Lett. 89 (2003) 142503.
- (9) G. Schnwaer et al., Phys. Lett. B 552 (2003) 9.
- (10) H. Amro et al., Phys. Lett. B 553 (2003) 197.
- (11) P. Bringel et al., Eur. Phys. J A 24 (2005) 167.
- (12) D. R. Jenssen et al., Eur. Phys. J A 19 (2004) 173.
- (13) D.J. Hartley et al., Phys. Rev. C 72 (2005) 064325.
- (14) D.J. Hartley et al., in Nuclei at the Limits, T.L. Khoo, D. Sewereniyak, and C. Lister, Editors (IOP Publishing, New York, 2005) pp 15.
- (15) I.-Y. Lee, Nucl. Phys. A520 (1990) 641c.
- (16) N. S. Pattabiraman et al., Nucl. Instr. Methods Phys. Res. A526 (2004) 432; ibid. 439.
- (17) D. C. Radford, Nucl. Instr. and Methods Phys. Res. A361 (1995) 297.
- (18) H.J. Jensen et al., Z. Phys. A 340 (1991) 351.
- (19) X. Wang et al. (to be published).
- (20) T. Bengtsson and I. Ragnarsson, Nucl. Phys. A436 (1985) 14.
- (21) S. Frauendorf, Nucl. Phys. A677 (2000) 115.
- (22) A.V. Afanasjev, D.B. Fossan, G.J. Lane, and I. Ragnarsson, Phys. Rep. 322 (1999) 1.
- (23) R. Bengtsson and H. Ryde, Eur. Phys. J. A 22 (2004) 355.
- (24) W. Nazarewicz, M.A. Riley, and J.D. Garrett, Nucl. Phys. A512 (1990) 61.
- (25) V.I. Dimitrov, F. Donau, and S. Frauendorf, Phys. Rev. C 62 (2000) 024315.