Kinematics of gas and stars in the circumnuclear starforming ring of NGC 3351
Abstract
We have measured gas and stellar velocity dispersions in 5 circumnuclear starforming regions (CNSFRs) and the nucleus of the barred spiral galaxy NGC 3351. The stellar dispersions have been obtained from high resolution spectra of the CaT lines at 8494, 8542, 8662 Å, while the gas velocity dispersions have been measured by Gaussian fits to the H 4861 Å line on high dispersion spectra.
The CNSFRs, with sizes of about 100 to 150 pc in diameter, are seen to be composed of several individual star clusters with sizes between 1.7 and 4.9 pc on an HST image. Using the stellar velocity dispersions, we have derived dynamical masses for the entire starforming complexes and for the individual star clusters. Values of the stellar velocity dispersions are between 39 and 67 km s-1. Dynamical masses for the whole CNSFRs are between 4.9 106 and 4.3 107 M⊙ and between 1.8 and 8.7 106 M⊙ for the individual star clusters.
Stellar and gas velocity dispersions are found to differ by about 20 km s-1 with the H lines being narrower than both the stellar lines and the [Oiii] 5007 Å lines. We have found indications for the presence of two different kinematical components in the ionised gas of the regions. The radial velocity curve shows deviation from circular motions for the ionised hydrogen consistent with its infall towards the central regions of the galaxy at a velocity of about 25 km s-1. To disentangle the origin of these two components it will be necessary to map these regions with high spectral and spatial resolution and much better S/N in particular for the O2+ lines.
keywords:
galaxies: individual (NGC 3351) - galaxies: starburst - galaxies: kinematics and dynamics galaxies: star clusters (ISM:) HII regions1 Introduction
The bulges of some nearby spiral galaxies show intense starforming regions located in a roughly annular pattern around their nuclei. At optical wavelengths, these circumnuclear starforming regions (CNSFRs) are easily observable rings. In the ultraviolet (UV), massive stars dominate the observed circumnuclear emission even in the presence of an active nucleus (González-Delgado et al., 1998; Colina et al., 2002). Cid Fernandes et al. (2001), for a representative sample of 35 Seyfert 2 galaxies, find that about 40 % of them show unambiguous evidence of circumnuclear star formation within 300 pc of the nucleus and that these starforming regions contribute about 30 to 50 % to the H total emission of the central zone.
These CNSFRs, with sizes going from a few tens to a few hundreds of pc (e.g. Díaz & Pérez-Montero, 2000) seem to be made of several Hii regions ionised by luminous compact stellar clusters whose sizes, as measured from high spatial resolution HST images, are seen to be of only a few pc. Their masses, as derived with the use of population synthesis models in circumnuclear regions of different galaxies, suggest that these clusters are gravitationally bound and that they might evolve into globular cluster configurations (Maoz et al., 1996). The luminosities of CNSFRs are rather large with absolute visual magnitudes (Mv) between -12 and -17 and H luminosities between 2 1038 and 7 1040 erg s-1 . These values are comparable to those shown by 30 Dor, the largest Hii region in the LMC, and overlap with those shown by Hii galaxies (Melnick et al., 1988; Díaz et al., 2000; Hoyos & Díaz, 2006, and references therein).
Although these Hii regions are very luminous not much is known about their kinematics or dynamics for both the ionised gas and the stars. It could be said that the worst known parameter of these ionising clusters is their mass. There are different methods to estimate the mass of a stellar cluster. Classically one assumes that the system is virialized and determines the total mass inside a radius by applying the virial theorem to the observed velocity dispersion of the stars (). The stellar velocity dispersion is however hard to measure in young stellar clusters (a few Myr old) due to the shortage of prominent stellar absorption lines. The optical continuum between 3500 and 7000 Å shows very few lines since the light at these wavelengths is dominated by OB stars which have weak absorption lines at the same wavelengths of the nebular emission lines (Balmer H and HeI lines). As pointed out by several authors (e.g. Ho & Filippenko, 1996a), at longer wavelengths ( 8500 Å) the contamination due to nebular lines is much smaller and since red supergiant stars, if present, dominate the near-IR light where the Caii 8498, 8542, 8662 Å triplet lines (CaT) are found, these should be easily observable allowing the determination of (Terlevich et al., 1990; Prada et al., 1994). We have previously detected the CaT lines in CNSFRs but at a spectral resolution that was below that required to measure accurately their velocity dispersions (e.g. Terlevich et al., 1990).
Added interest in the study of CNSFRs comes from the fact that they are in general of high metal abundance (Díaz et al. 2006), therefore they provide clues for the understanding of star formation phenomena at large metallicities, and, being close to the nuclear regions, for the determination of metallicity gradients in spiral galaxies.
NGC 3351 is an SBb(r)II spiral galaxy (Sandage & Tammann, 1987) with coordinates =10h 43m 577, =+11∘ 42′ 127. It was classified as a hot-spot galaxy by Sérsic & Pastoriza (1967). Alloin & Nieto (1982) studied the star formation activity in the nuclear region and along a ring of about 20″ in diameter using broad and narrow band images, concluding that NGC 3351 harbours high-mass star formation in these zones. In fact it can be considered a nuclear starburst galaxy since the star formation rate per unit area in the nuclear region, as estimated from the H emission, compared to that in the disk is significantly increased (Devereux et al., 1992). More recently, near infrared photometry in the J and K bands has been presented by Elmegreen et al. (1997) who derive a circumnuclear star formation rate of 0.38 M⊙ yr-1. From CO emission observations, Planesas et al. (1997) derive a mass of molecular gas of 3.5 108 M⊙.
HST UV images show that the present star formation in NGC 3351 is distributed along a nuclear ring with a major axis of 15″ with starforming regions arranged in complexes of diameters between 1.4 and 2.0″ which are made up of several high surface brightness knots a few pc in size embedded in a more diffuse component (Colina et al., 1997). No signs of activity have been observed in the nucleus of NGC 3351.
There are several values in the literature for the distance to NGC 3351. Here we adopt the distance derived by Graham et al. (1997) from Cepheid variable stars as part of the Hubble Space Telescope (HST) Key Project on the Extragalactic Distance Scale, which is 10.05 Mpc giving a linear scale of 49 pc per arcsec.
In this paper we present high-resolution far red spectra (0.39 Å px-1 13.66 km s-1 px-1 at central wavelength, =8563 Å) and stellar velocity dispersion measurements () along the line of sight, for the five circumnuclear starforming regions and the nucleus of the spiral galaxy NGC 3351. We have also measured the ionised gas velocity dispersions () from high-resolution blue spectra (0.21 Å px-1 12.63 km s-1 px-1 at = 4989 Å) using Balmer H and [Oiii] emission lines. The comparison between and might throw some light on the yet unsolved issue about the validity of the gravitational hypothesis for the origin of the supersonic motions observed in the ionised gas in Giant Hii regions (Melnick, Tenorio-Tagle & Terlevich, 1999).
Section 2 presents the details of the observations and the data reduction. Section 3 presents the results concerning the kinematics of gas and stars in each of the observed regions, as well as the determination of their masses. Section 4 is devoted to the discussion of these results and finally the summary and conclusions of this work are presented in Section 5.
2 Observations and data reduction
2.1 Observations
| Date | Spectral range | Disp. | FWHM | Spatial res. | PA | Exposure Time |
|---|---|---|---|---|---|---|
| (Å) | (Å px-1) | (Å) | (″ px-1) | (o) | (sec) | |
| 04-02-2000 | 4779-5199 | 0.21 | 0.4 | 0.38 | 355 | 4 1200 |
| 04-02-2000 | 8363-8763 | 0.39 | 0.7 | 0.36 | 355 | 4 1200 |
| 05-02-2000 | 4779-5199 | 0.21 | 0.4 | 0.38 | 45 | 3 1200 |
| 05-02-2000 | 8363-8763 | 0.39 | 0.7 | 0.36 | 45 | 3 1200 |
| 05-02-2000 | 4779-5199 | 0.21 | 0.4 | 0.38 | 310 | 3 1200 |
| 05-02-2000 | 8363-8763 | 0.39 | 0.7 | 0.36 | 310 | 3 1200 |
High resolution blue and far-red spectra were acquired as part of an observing run in 2000. They were obtained simultaneously using the blue and red arms of the Intermediate dispersion Spectrograph and Imaging System (ISIS), on the 4.2 m William Herschel Telescope (WHT) of the Isaac Newton Group (ING) at the Roque de los Muchachos Observatory, on the Spanish island of La Palma. We used the EEV12 detector in the blue arm with a CCD binning factor of 2 both in “x” and “y”. The H2400B grating was used to cover the wavelength range 4779-5199 Å ( = 4989 Å). The TEK4 CCD was attached to the red arm. In this case, the R1200R grating was used, covering a spectral range from 8363 to 8763 Å ( = 8563 Å). The spatial resolution of the observations was 0.2 and 0.36″ px-1 for the blue and red configurations respectively. A slit width of 1 arcsec was used. The spectral ranges and grating resolutions (spectral dispersion in Å px-1 and FWHM in Å measured on the sky lines) attained are given in table 1 containing the journal of observations.
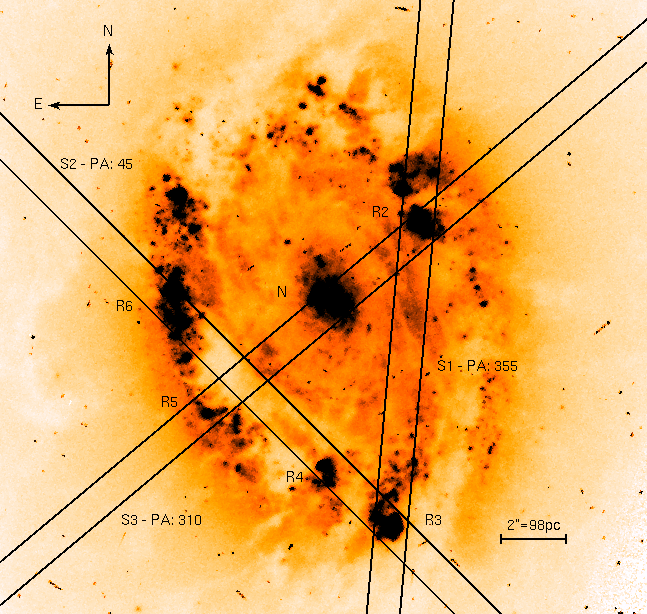
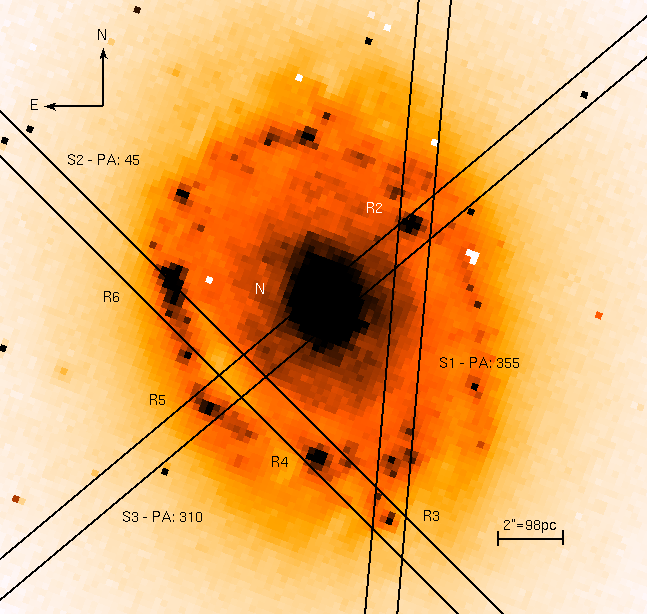
Three different slit positions were chosen to observe 5 CNSFRs and the nucleus of NGC 3351. In Fig. 1 we show the position of these slits at angles of 355∘, 45∘ and 310∘ (which we have labelled S1, S2 and S3 respectively) overlapped on an image of the circumnuclear region of NGC 3351 acquired by the HST (see description below). The regions observed are identified on the H map by Planesas, Colina & Pérez-Olea (1997) using their same nomenclature. The slit was positioned on the regions using the offsets from the nucleus, clearly visible during the data acquisition, given by Planesas et al. (1997).
Several bias and sky flat field frames were taken at the beginning and the end of each night in both arms. In addition, two lamp flat field and one calibration lamp exposure per each telescope position were performed. The calibration lamp used was CuNe+CuAr.
We have also downloaded two astrometrically and photometrically calibrated broad-band images of the central part of NGC 3351 from the Multimission Archive at Space Telescope111http://archive.stsci.edu/hst/wfpc2. The images were taken through the F606W (wide V) and the F160W (H) filters with the Wide Field and Planetary Camera 2 (WFPC2; PC1) and the NICMOS Camera 3 both on-board the HST. They are displayed in Figure 1, with the slit positions overlaid and the CNSFRs and the nucleus labelled.
2.2 Data reduction
The data was processed and analysed using IRAF222IRAF: the Image Reduction and Analysis Facility is distributed by the National Optical Astronomy Observatories, which is operated by the Association of Universities for Research in Astronomy, Inc. (AURA) under cooperative agreement with the National Science Foundation (NSF). routines in the usual manner. The procedure includes the removal of cosmic rays, bias substraction, division by a normalised flat field and wavelength calibration. Wavelength fits were performed using 20-25 arc lines in the blue and 10-15 lines in the far red by a polynomial of second- to third-order. These fits have been done at 50 and 60 locations along the slit in the blue and far red, respectively, and they have yielded rms residuals between 0.1 and 0.2 px.
In the red, we also performed the wavelength calibration using sky lines following the work by Osterbrock et al. (1996). However, although more lines (20-25) were available for the calibration, the fits gave higher rms residuals, between 0.3 and 0.45 px since the low intensities of some of the lines did not allow a good Gaussian fit. We have therefore adopted the calibration made using only the arc lines.
Background subtraction was performed using the spectra at both ends of the slit. This background includes light from the disk and bulge of the galaxy. It was almost impossible to neatly substract the background bright emission lines in the far red spectra due to the nonuniform and extended nebular emission surrounding each cluster and the variation over time of the sky emission lines. It is worth noting that these spurious features do not affect the CaT absorption lines.
We have not corrected the spectra for atmospheric extinction or performed any flux calibration, since our purpose was to measure radial velocities and velocity dispersions.
In addition to the galaxy frames, observations of 11 template velocity stars were made (4 during the first night and 7 during the second) to provide good stellar reference frames in the same system as the galaxy spectra for the kinematic analysis in the far red. They are late type giant and supergiant stars which have strong CaT features (see Díaz et al., 1989). In table 2 we list the spectral types and luminosity classes of the stars and the dates of observation.
| Star | ST - LC | date |
| HD71952 | K0 I | 04-02-2000 |
| HD129972 | G6 I | |
| HD134047 | G6 III | |
| HD144063 | G4 III | |
| HD16400 | G5 III | 05-02-2000 |
| HD22007 | G5 I | |
| HD22156 | G6 III | |
| HD92588 | K1 I | |
| HD102165 | F7 I | |
| HD115004 | G8 III | |
| HD116365 | K3 III |
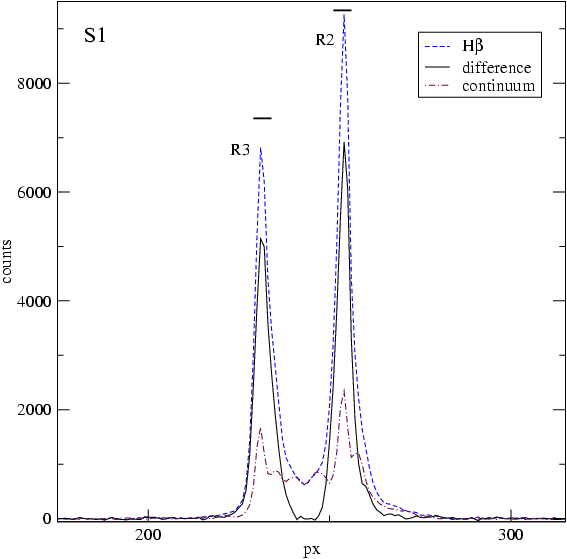
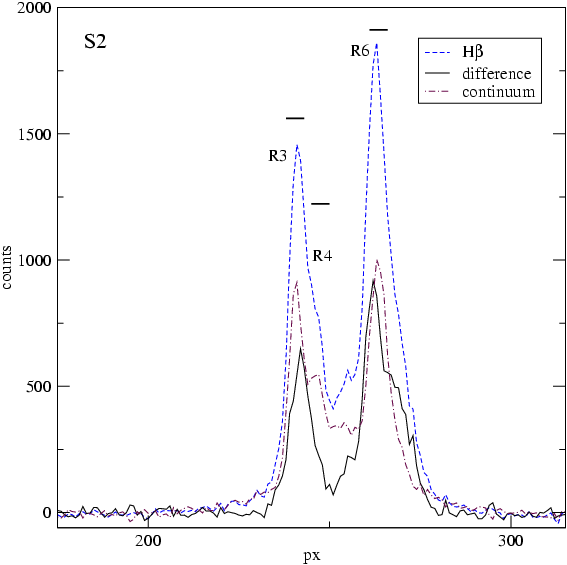
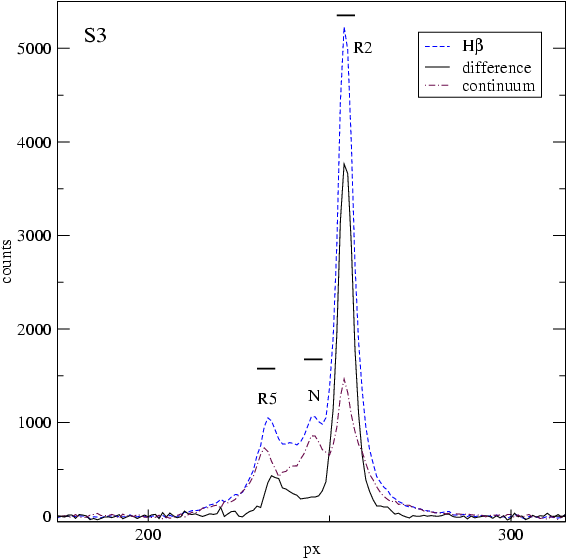
Figure 2 shows the spatial profiles of the H emission along each slit position. These H profiles have been generated by collapsing eleven pixels of the spectra in the direction of the resolution between 4860 and 4862 Å, rest frame, 4861 being the center of the H line, and are plotted as dashed lines. Continuum profiles were generated by collapsing 11 resolution pixels centered on 4844 Å and are plotted as dash-dotted lines. The difference betwee the two is shown by solid lines and corresponds to the pure H emission. On these profiles we have selected the regions of the frames to be extracted in one dimensional spectra corresponding to each of the identified CNSFRs. Those regions are marked by horizontal lines and labelled with their respective names in the figure. Spectra in slit positions 1 and 2 are placed along the circumnuclear ring and therefore any contribution from the underlying galaxy bulge is difficult to assess but the spatial profiles corresponding to slit position 3, that goes through the galactic nucleus, can be used to make an estimate. For the blue spectra the light from the underlying bulge is almost negligible amounting at most to 5 % at the H line. For the red spectra, the contribution is more important. From Gaussian fits to the 8500 Å profile at slit position S3 we find that it amounts to about 20 % for the lowest surface brightness region, R5. Similar values are found from inspection of the HST-NICMOS image shown in Figure 1.
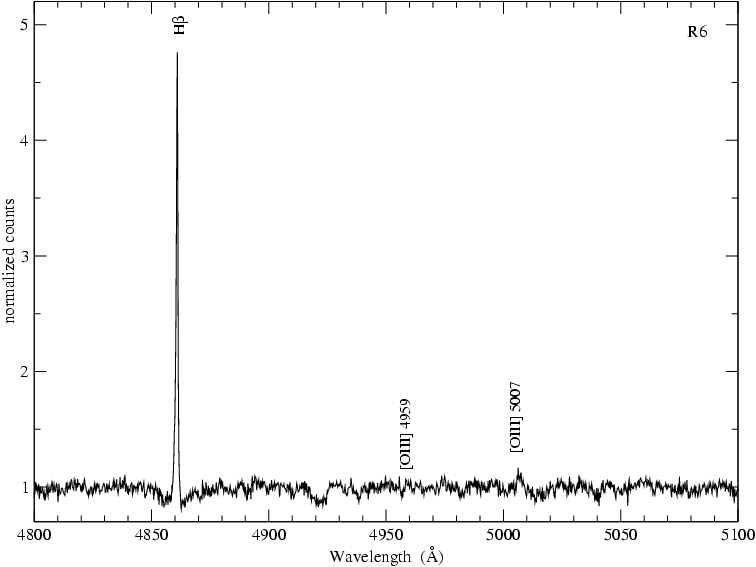
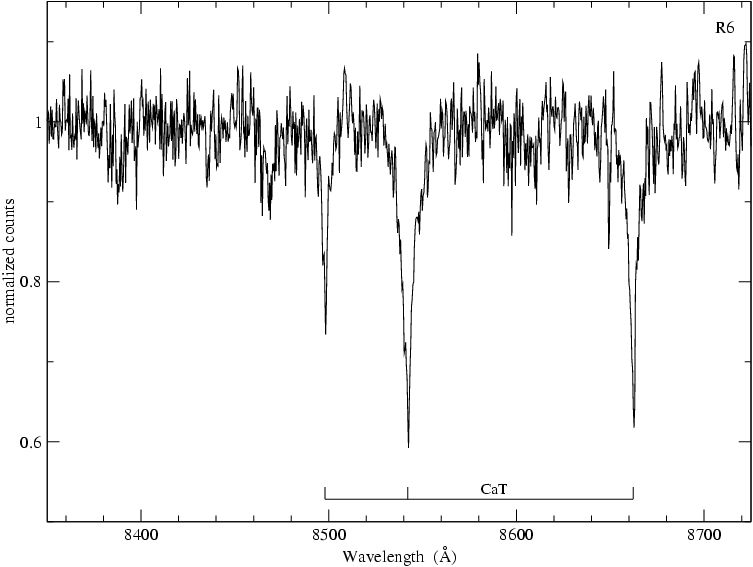
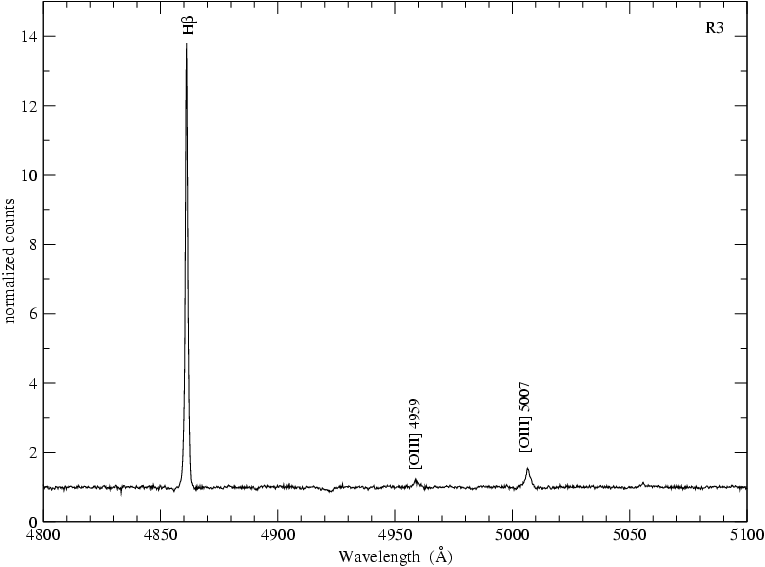
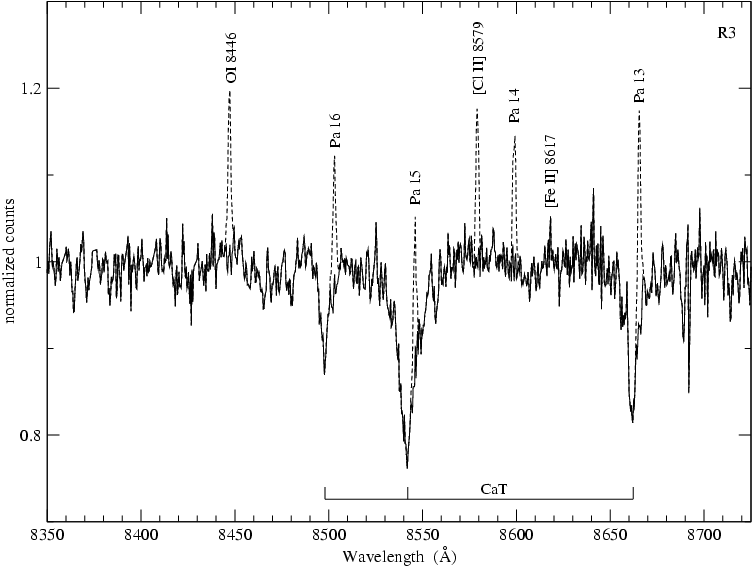
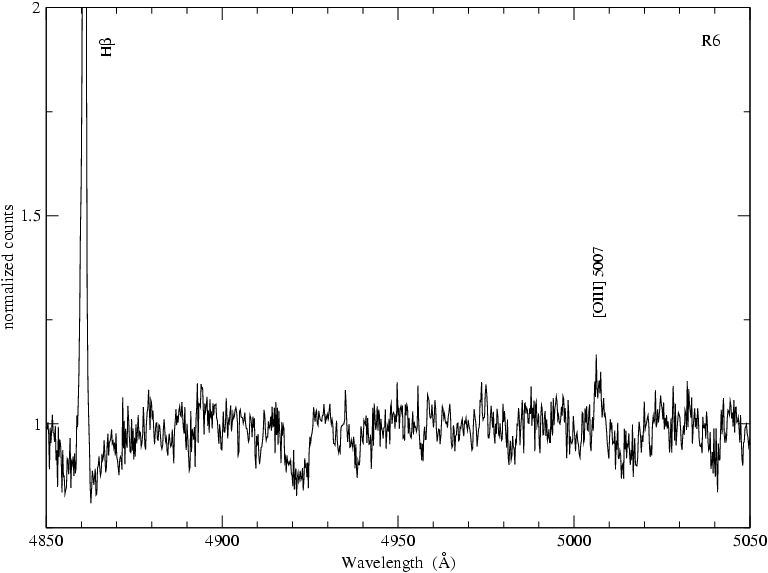
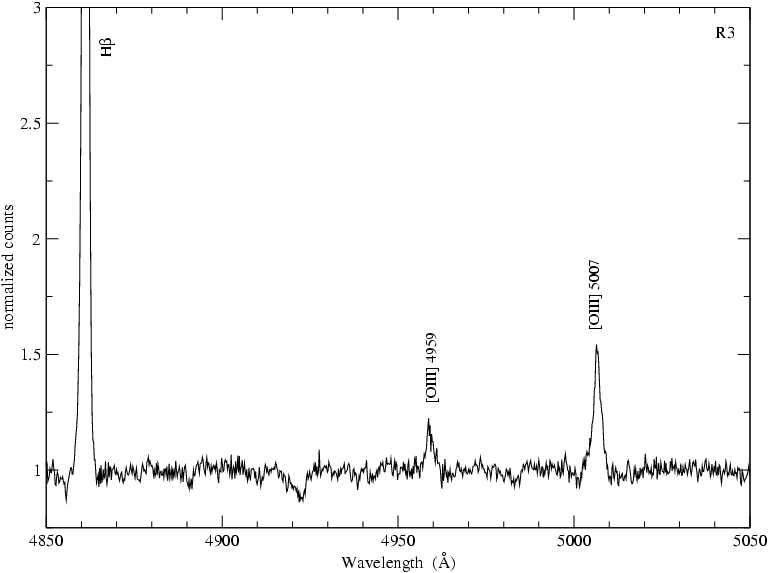
Figs. 3 and 4 show representative spectra of these regions (R6 and R3, respectively) in the blue and the red spectral range split into two panels. The blue spectra show the Balmer H recombination line and the collisionally excited [Oiii] lines at 4959,5007 Å. Due to the high metallicity of the CNSFRs (Díaz et al. 2006), the lines of oxygen are seen to be very weak (see Fig. 5) and, in some cases, only the strongest 5007 Å is detected (left panel of this figure). The red spectra show the stellar Caii triplet (CaT) lines in absorption at 8498, 8542, 8562 Å. In some cases, these lines are contaminated by Paschen emission (see for example the lower panel of Fig. 4) which occur at wavelengths very close to those of the CaT lines. In addition to these emission lines, it is possible to observe other emission features, such as Oi 8446, [Clii] 8579, Pa 14 and [Feii] 8617. The observed red spectrum of R3 is plotted in Fig. 4 with a dashed line. A single Gaussian fit to the emission lines was performed and the lines were subsequently subtracted after checking that the theoretically expected ratio between the Paschen lines was satisfied. The solid line shows the subtracted spectrum.
3 Results
3.1 Kinematics of stars and ionised gas
Stars
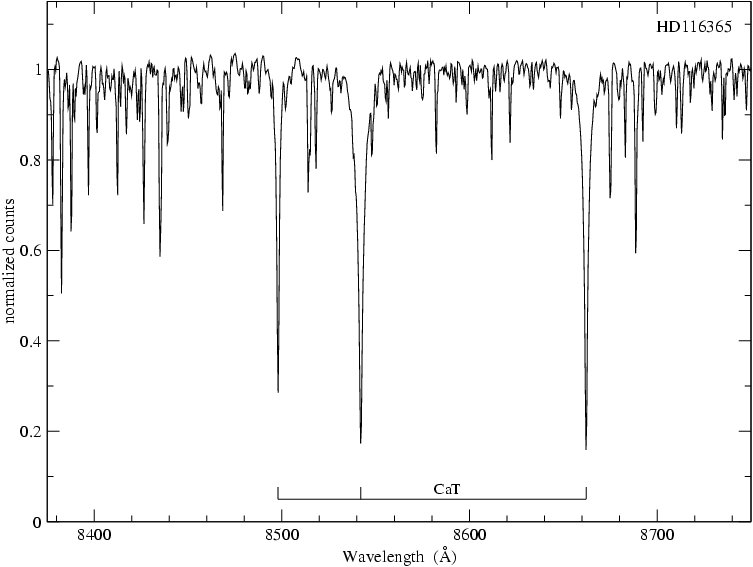
Stellar radial velocities and velocity dispersions were obtained from the absorption CaT lines using the cross-correlation technique described in detail by Tonry & Davis (1979). This method requires the comparison with a stellar template (which can be synthetic or observed) that represents the stellar population that best reproduces the conspicuous feature used to perform these measurements. An example of the red spectrum of a template star (HD116365) is shown in Fig. 6 with the prominent features of CaT indicated. The line-of-sight velocity dispersions is calculated from the width of the primary peak of the cross-correlation function (CCF) after deconvolution of the instrumental profile. A filtering of high frequencies of the Fourier transform spectrum is usually included in this procedure to avoid noise contamination and a low frequency filtering is usually made to eliminate the residual continuum.
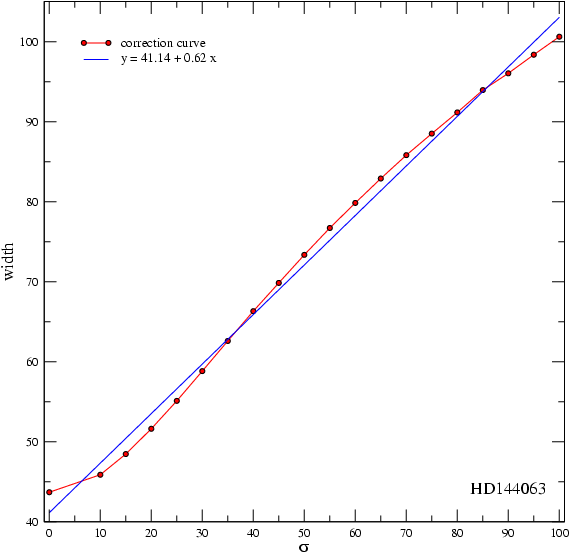
Minor changes/improvements with respect to the cross-correlation technique originally proposed by Tonry & Davis (1979) were introduced as described below. In order to apply this method, we have used XCSAO, an external package of IRAF within the RVSAO, which implements the cross-correlation method of Tonry and Davies and is a direct descendant of the system built by them (Kurtz & Mink, 1998). We used late type giant and supergiant stars that have strong CaT absorption lines (Fig. 6) as stellar velocity templates. We normalized the stellar spectra dividing by a fitted continuum and convolved each stellar spectrum template with a set of Gaussian functions of different simulating a wide range in velocity dispersions from 10 to 100 km/s with a bin size of 5 km/s. The obtained spectra are cross-correlated with the original template obtaining a relation between the width of the main peak of the cross-correlation and of the input Gaussian. This relation constitutes a correction curve for each template that is applied as described below to obtain the stellar velocity dispersion for each CNSFR as described in Nelson & Whittle (1995). This procedure will allow us to correct for the known possible mismatches between template stars and the region composite spectrum. In Figure 7 we show an example of these correction curves, in particular for HD 144063, together with a linear fit to it.
We determined the line of sight stellar velocity along each slit. Extractions were made every two pixels for slit position S1. For slit positions S2 and S3 they were made every three pixels, with one pixel overlap between consecutive extractions. In this way the signal to noise ratio and the spatial resolution were optimised.
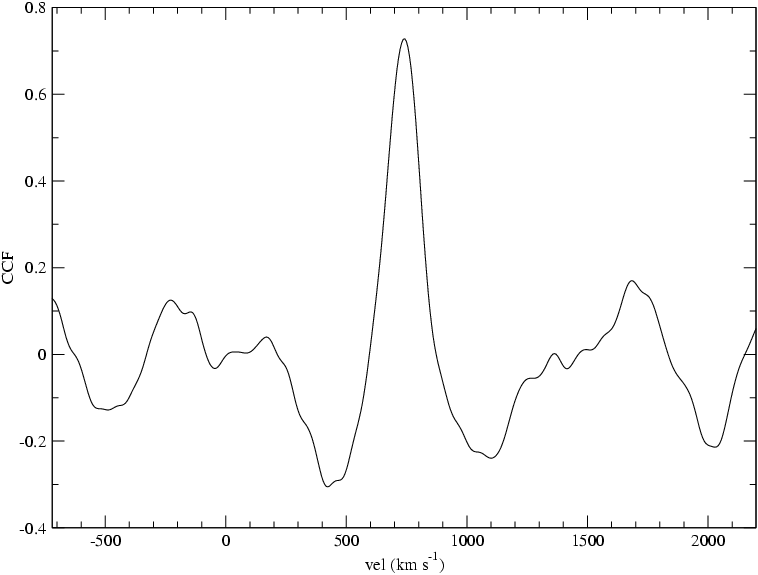
The stellar velocity dispersion was estimated at the position of each CNSFR and the nucleus using apertures of 5 pixels in all cases, which correspond to 1.0″ 1.8″. A set of eleven templates of different spectral types and luminosity classes were used following Nelson & Whittle (1995) with the variation introduced by Palacios et al. (1997) of using the individual stellar templates instead of an average. To measure the velocity dispersion in a galactic spectrum we have convolved it with each stellar template, correcting the width of the main peak of the CCF (see Fig. 8) with the corresponding correction curve. Although the linear fits to the curves are very good approximations (see Fig. 7), we used a linear interpolation between the two nearest values to estimate the corrected width. The of the stars () is the average of the values found for each stellar template and its error is given by the dispersion of the individual values of and the rms of the residuals of the wavelength fit. This procedure allows a more accurate estimate of (Palacios et al., 1997). The radial velocities are the average of the radial velocities determined directly from the position of the main peak of the cross-correlation of each galaxy spectrum with each template in the rest frame.
The stellar velocity dispersions are listed in column 3 of table 3 along with their corresponding errors.
Ionised gas
The wavelength and the width of the H and [Oiii] 5007 Å emission lines were measured to determine both the radial velocities and the velocity dispersions of the ionised gas. As in the case of the stars, we determined the radial velocity of the gas in the line of sight along each slit, every two pixels for S1 and every three pixels, superposing one pixel for consecutive extractions, for S2 and S3.
The velocity dispersion of the gas was estimated at the position of each CNSFR and the nucleus using 5 pixel apertures, corresponding to 1.0″ 1.9″. Following Jiménez-Benito et al. (2000) we adjusted three different suitable continua chosen by visual inspection and fitted a Gaussian to the whole line. Positions and widths of the emission lines are the average of the corresponding measurements and their errors are calculated as the dispersion of these measurements taking into account the rms of the residuals of the wavelength calibration. Thus, the error is associated with the continuum placement.
The velocity dispersions of the gas are calculated as
where and are the measured and instrumental dispersions respectively. was measured directly from the sky emission lines and is about 10.5 km s-1 at 4861 Å.
Unexpectedly, the Gaussian fit just described revealed the presence of more than one component in the H lines. The optimal fit was found for two different components for all the regions. We then used the widths of those components to fit the [OIII] lines finding also optimal fits for regions R2 and R3 in the four analysed spectra corresponding to two different slit positions. For the rest of the regions the two component fit did not show any improvemt over the single component one, probably due to the low signal-to-noise ratio. An example of the fit for H and [Oiii] 5007 Å can be seen in Fig. 9. The radial velocities found using this method are the same, within the errors, as those found by fitting a single component.
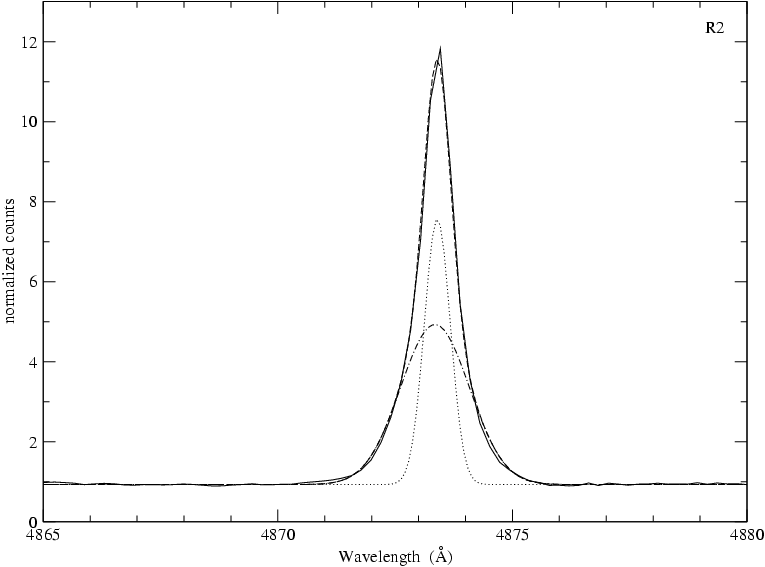
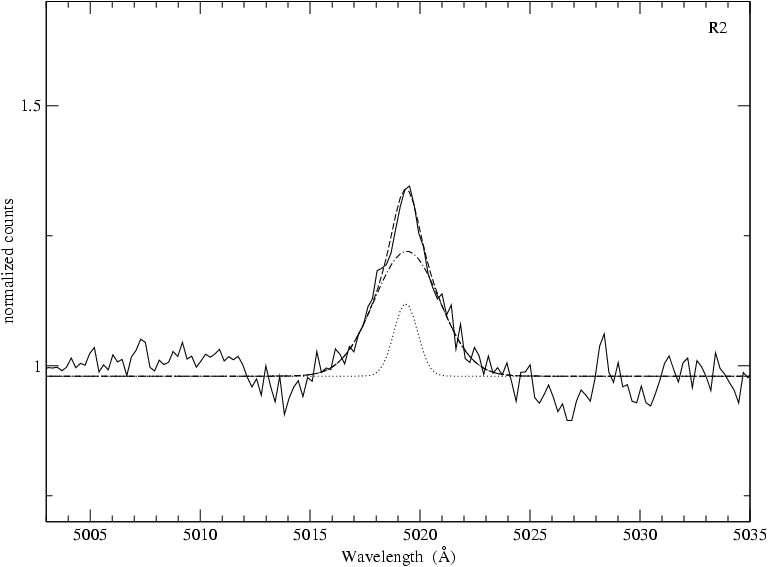
Gas velocity dispersions for H and [Oiii] 5007 Å lines are given in table 3. We have listed the velocity dispersions derived using the two different methods, the single line and the double line Gaussian fit . For the first method we have labelled the results as 1 component (columns 4 and 5). For the second one, labels 2 components - narrow (columns 6 and 7) and 2 components - broad (columns 8 and 9) for the narrow and the broad component respectively are used.
| 1 component | 2 components | |||||||
| narrow | broad | |||||||
| Region | Slit | (H) | ([Oiii]) | (H) | ([Oiii]) | (H) | ([Oiii]) | |
| R2 | S1 | 501 | 261 | 727 | 173 | 214 | 453 | 745 |
| R2 | S3 | 516 | 293 | 699 | 162 | 235 | 432 | 768 |
| R3 | S1 | 555 | 351 | 677 | 253 | 284 | 594 | 714 |
| R3 | S2 | 597 | 395 | 707 | 243 | 246 | 593 | 749 |
| R4 | S2 | 664 | 374 | 768 | 293 | — | 654 | — |
| R5 | S3 | 474 | 342 | 567 | 30 | — | 76 | — |
| R6 | S2 | 396 | 296 | 467 | 163 | — | 464 | — |
| N | S3 | 671 | 533 | 736 | 415 | — | 677 | — |
| velocity dispersions in km s-1 | ||||||||
3.2 Sizes
Two parameters are needed in order to determine the mass of a virialized stellar system, namely its velocity dispersion and its size. Previously estimated radii (R) for the regions, such as those given by Planesas et al. (1997) from H images or Colina et al. (1997) from ultraviolet STIS-HST images, were defined to include the total integrated emission flux of the regions, and therefore they are not appropriate to calculate their dynamical masses, as what is needed for this is a measurement of the size of the mass distribution, i.e. the star-cluster size. This is traditionally done measuring the effective radius using images obtained in bands where the light is dominated by the stellar contribution and where the contamination by gaseous emission is either small or can be estimated and corrected.
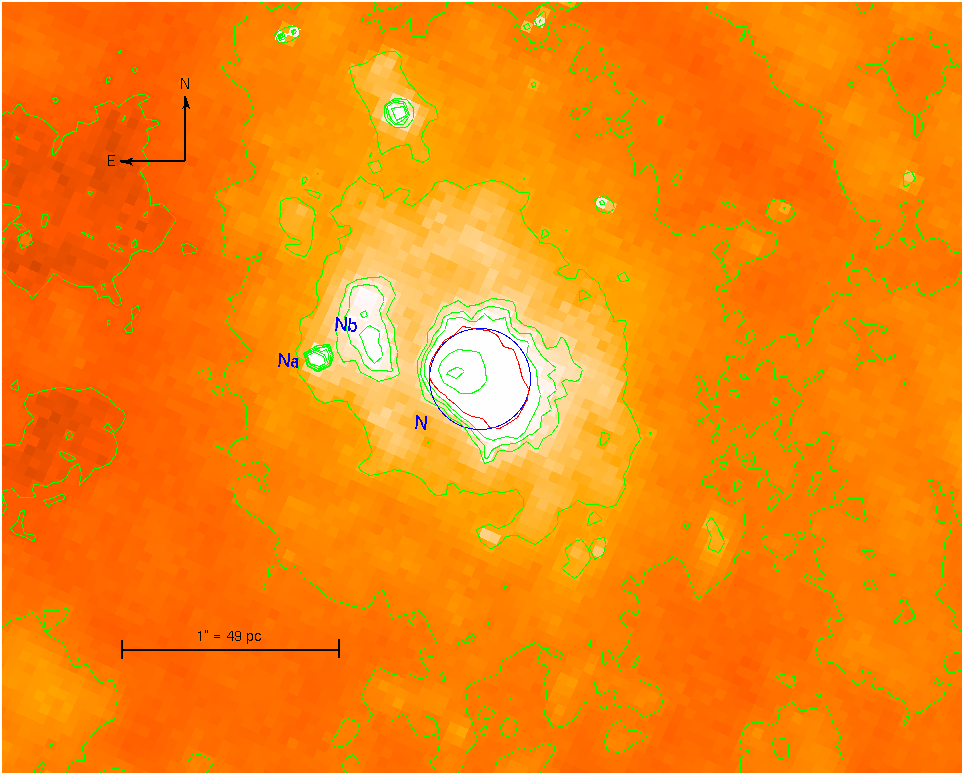
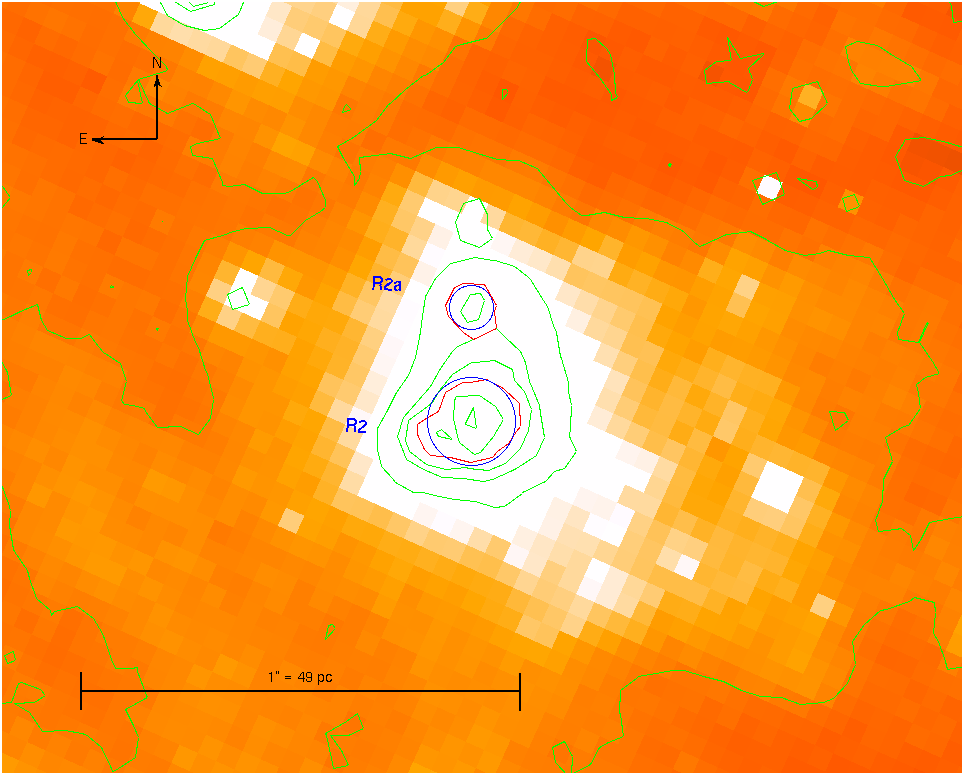
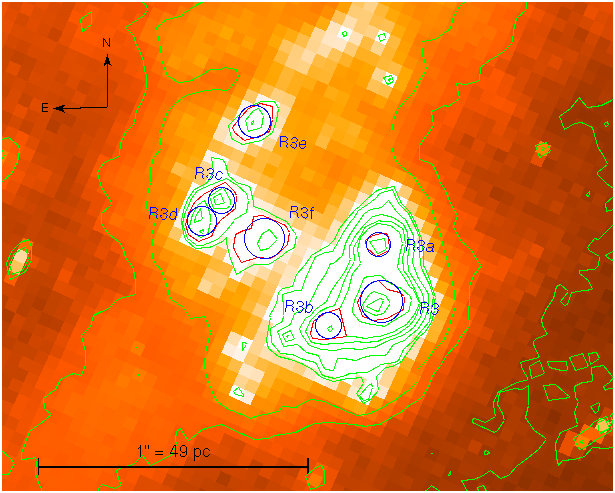
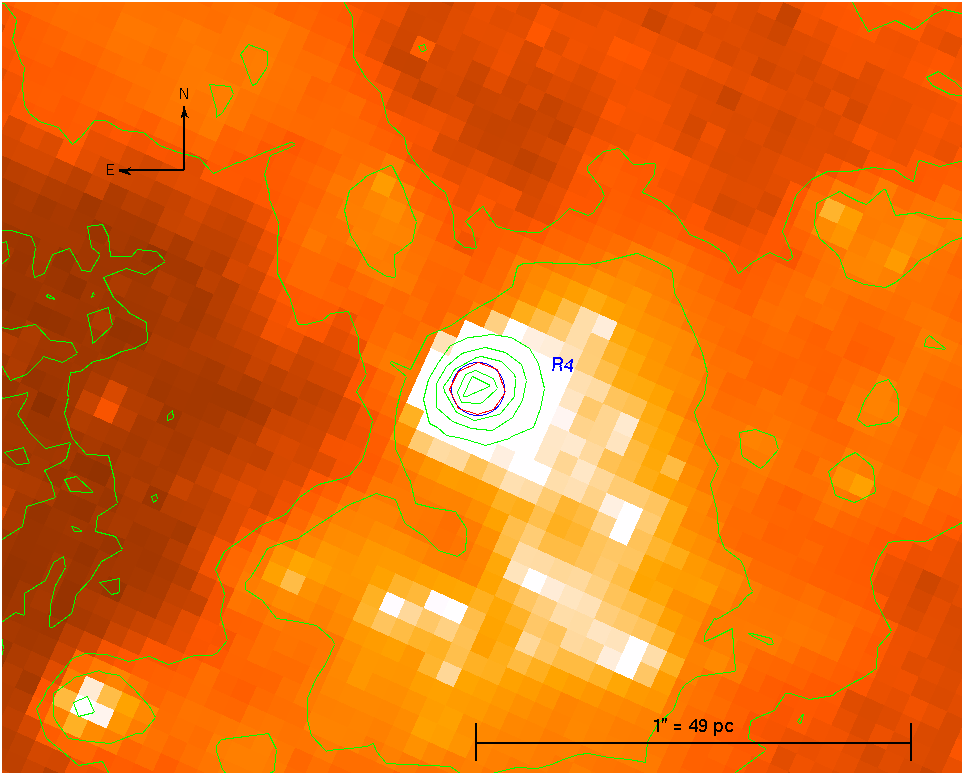
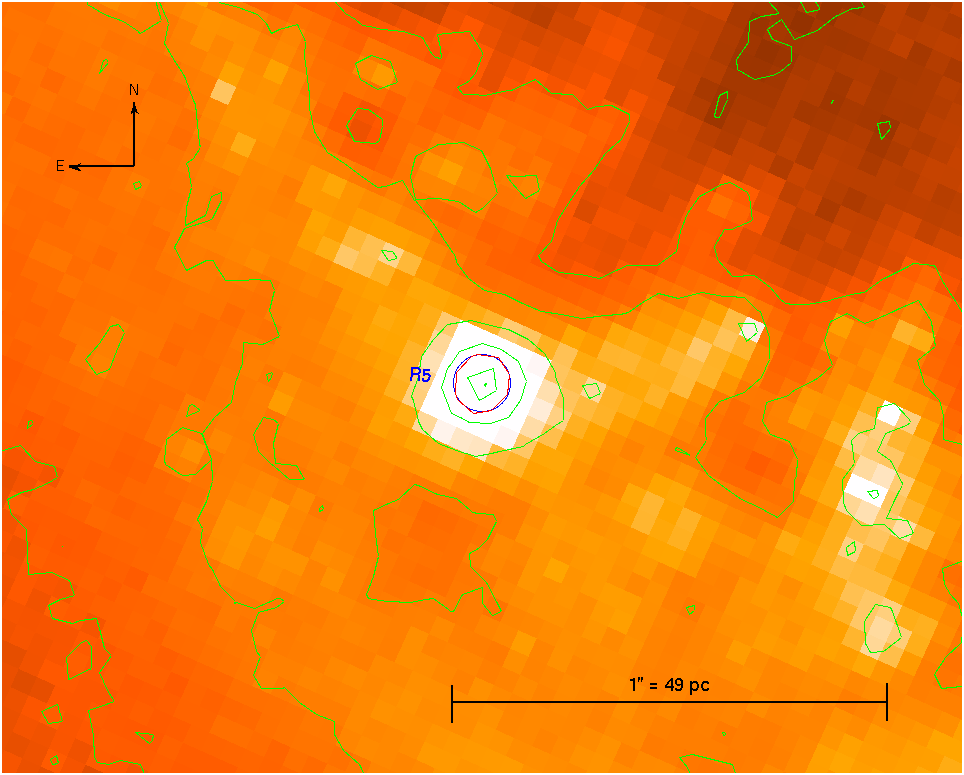
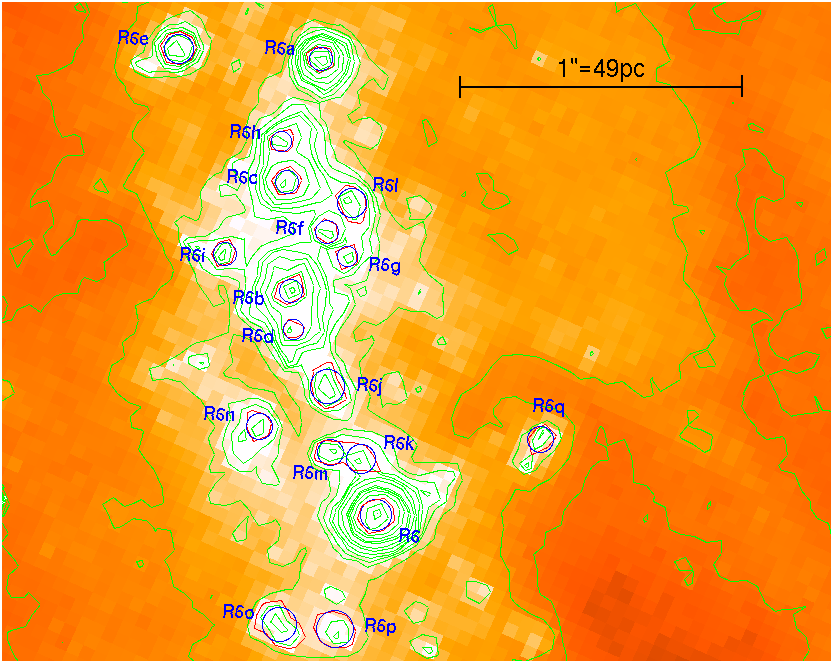
Following Ho & Filippenko (1996a) we have defined the radius (R) of a given structure as in Meurer et al. (1995) assuming that they have an intrinsically circularly symmetric Gaussian profile. As we can see in Fig. 10 this is a rather good approximation. We have determined the full width at half maximum, , by superposing the contours in the F606W WFPC2-HST image and determining the half light strength between the peak of the intensity for each region and the galaxy background (red contours in the electronic version of the paper). Then, for this model, we take R as the half light radius, R = 0.5W50. While Meurer et al. (1995) measured the sizes from an H image, we only have the F606W (wide V; containing H) image in this spectral range and with the appropriate spatial resolution.
We find, as expected, that several of these regions are composed of more than one knot. Only R4 and R5 seem to have a unique principal knot, at least at the PC1 spatial resolution. In the most extreme case, R6, we find at least 18 knots with a detection level of 10 above background level. All these knots are within the radius of the regions defined by Planesas et al. (1997). We have to remark that our search for knots has not been exhaustive since that is not the aim of this work. The radii of the single knots vary between 1.7 and 4.9 pc.
Position, radius and its error, and the peak intensity in counts measured from the WFPC2 image are listed in table 4 for each knot identified.
| Region | position | R | I | |
|---|---|---|---|---|
| (pc) | (counts) | |||
| R2 | 10h43m5712 | +11∘42′0827 | 4.90.2 | 2531 |
| R2a | 10h43m5712 | +11∘42′0853 | 2.50.2 | 956 |
| R3 | 10h43m5716 | +11∘41′5902 | 3.90.2 | 2598 |
| R3a | 10h43m5716 | +11∘41′5924 | 2.20.1 | 1852 |
| R3b | 10h43m5718 | +11∘41′5893 | 2.00.3 | 1032 |
| R3c | 10h43m5721 | +11∘41′5941 | 2.50.3 | 546 |
| R3d | 10h43m5721 | +11∘41′5933 | 2.70.3 | 489 |
| R3e | 10h43m5720 | +11∘41′5971 | 2.90.2 | 383 |
| R3f | 10h43m5720 | +11∘41′5926 | 3.70.4 | 330 |
| R4 | 10h43m5732 | +11∘42′0092 | 2.90.1 | 2581 |
| R5 | 10h43m5755 | +11∘42′0250 | 3.20.1 | 973 |
| R6 | 10h43m5760 | +11∘42′0521 | 2.70.1 | 2399 |
| R6a | 10h43m5762 | +11∘42′0681 | 2.00.1 | 794 |
| R6b | 10h43m5762 | +11∘42′0600 | 2.00.2 | 714 |
| R6c | 10h43m5763 | +11∘42′0638 | 2.00.1 | 551 |
| R6d | 10h43m5762 | +11∘42′0586 | 1.70.1 | 404 |
| R6e | 10h43m5765 | +11∘42′0685 | 2.40.2 | 376 |
| R6f | 10h43m5762 | +11∘42′0621 | 2.00.1 | 340 |
| R6g | 10h43m5761 | +11∘42′0612 | 1.70.1 | 295 |
| R6h | 10h43m5763 | +11∘42′0652 | 1.70.1 | 290 |
| R6i | 10h43m5764 | +11∘42′0613 | 2.00.1 | 285 |
| R6j | 10h43m5762 | +11∘42′0566 | 2.90.3 | 282 |
| R6k | 10h43m5761 | +11∘42′0541 | 2.40.2 | 275 |
| R6l | 10h43m5761 | +11∘42′0631 | 2.40.3 | 272 |
| R6m | 10h43m5761 | +11∘42′0543 | 2.20.2 | 270 |
| R6n | 10h43m5763 | +11∘42′0552 | 2.20.3 | 251 |
| R6o | 10h43m5763 | +11∘42′0483 | 2.90.3 | 212 |
| R6p | 10h43m5761 | +11∘42′0481 | 3.10.3 | 212 |
| R6q | 10h43m5756 | +11∘42′0548 | 2.20.3 | 211 |
| N | 10h43m5729 | +11∘42′0581 | 11.30.1 | 513 |
| Region | Slit | M∗ | error(%) |
|---|---|---|---|
| R2 | S1 | 855 | |
| R2a | S1 | 444 | |
| R2sum | S1 | 1296 | 3.4 |
| R2 | S3 | 8721 | |
| R2a | S3 | 4411 | |
| R2sum | S3 | 13123 | 17.8 |
| R2 (adopted) | 1296 | 3.4 | |
| R3 | S1 | 8214 | |
| R3a | S1 | 468 | |
| R3b | S1 | 429 | |
| R3c | S1 | 5211 | |
| R3d | S1 | 5711 | |
| R3e | S1 | 6111 | |
| R3f | S1 | 7815 | |
| R3sum | S1 | 41731 | 7.3 |
| R3 | S2 | 9423 | |
| R3a | S2 | 5313 | |
| R3b | S2 | 4814 | |
| R3c | S2 | 6016 | |
| R3d | S2 | 6517 | |
| R3e | S2 | 7017 | |
| R3f | S2 | 895 | |
| R3sum | S2 | 47747 | 9.9 |
| R3 (adopted) | 44756 | 12.6 | |
| R4 | S2 | 8712 | 13.9 |
| R5 | S3 | 498 | 16.4 |
| R6 | S2 | 299 | |
| R6a | S2 | 218 | |
| R6b | S2 | 218 | |
| R6c | S2 | 218 | |
| R6d | S2 | 187 | |
| R6e | S2 | 2610 | |
| R6f | S2 | 218 | |
| R6g | S2 | 187 | |
| R6h | S2 | 187 | |
| R6i | S2 | 218 | |
| R6j | S2 | 3112 | |
| R6k | S2 | 2610 | |
| R6l | S2 | 2610 | |
| R6m | S2 | 249 | |
| R6n | S2 | 249 | |
| R6o | S2 | 3112 | |
| R6p | S2 | 3313 | |
| R6q | S2 | 249 | |
| R6sum | S2 | 43439 | 9.0 |
| N | S3 | 35011 | 3.1 |
| masses in 105 M⊙ | |||
3.3 Masses
Dynamical masses
We have used the virial theorem to estimate upper limits to the dynamical masses (M∗) inside the half light radius (R) for each observed knot in the F606W WFPC2-HST image. In order to do this, we have assumed that the systems are spherically symmetric, gravitationally bound and have isotropic velocity distribution ((total) = 3 ). Then, the dynamical mass is given by M∗ = 3 R/G (Ho & Filippenko, 1996a, b).
It must be noted that we have measurements for the size of each knot (typically 5pc), but we do not have direct access to the stellar velocity dispersion of each of the clusters, since our spectroscopic measurements encompass a wider area (1.0″ 1.8″ 49 88 pc2) that includes the CNSFRs to which each group of knots belong. The use of these wider size scale velocity dispersion measurements to estimate the mass of each knot, lead us to overestimate the mass of the individual clusters, and hence of each CNSFR.
However, as can be seen in the HST-NICMOS image (right panel of Fig. 1), the CNSFRs of NGC 3351 are clearly visible in the IR and dominate the light inside the apertures observed. All the regions analysed show up very prominently in the near IR and therefore we can assume that the light at the CaT wavelength region is dominated by the stars in the clusters. The IR CaII triplet is very strong, in fact the strongest stellar feature, in very young clusters, i.e. older than 4 Myr (Terlevich et al., 1990). Besides, we detect a minimum in the velocity dispersion at the position of the clusters, indicating that they are kinematically distinct. We cannot be sure though that we are actually measuring their velocity dispersion and thus prefer to say that our measurements of and hence dynamical masses constitute upper limits. Although we are well aware of the difficulties, still we are confident that these upper limits are valid and important for comparison with the gas kinematical measurements.
The estimated dynamical masses and their corresponding errors for each knot are listed in table 5. For the regions that have been observed in more than one slit position, we list the derived values using the two different stellar velocity dispersions. The dynamical masses in the lines labelled “sum” are the sum of the values derived for each knot of the corresponding region, when there are more than one. The “adopted” dynamical mass for R2 is directly the sum of the dynamical masses of the two knots derived using the velocity dispersion estimated from S1 since the mass calculated from S3 is in agreement with the first one (see table 5) but it has a much greater error. This greater error is due to the lower signal to noise ratio of the spectrum of R2 extracted from S3. In contrast, the derived dynamical masses for R3 are not in complete agreement, although they coincide within the errors, which are comparable. In this case we have taken the average as the “adopted” value. The fractional error in the “sum” and the adopted values of the dynamical masses of the CNSFRs are listed in column 4 of table 5.
Ionising star clusters
We have derived the masses of the ionising star clusters (Mion) from the total number of ionising photons using solar metallicity single burst models by García-Vargas et al. (1995), assuming a Salpeter IMF (Salpeter, 1955) with lower and upper mass limits of 0.8 and 120 M⊙ which provide the number of ionising photons per unit mass, . This number decreases with the age of the region. We have used the following relation between and the equivalent width of H, EW(H), derived from the models, in order to take into account the evolutionary state of the region (Díaz, 1998):
We have taken the values of EW(H) from Pérez-Olea (1996) (see table 6) which are not corrected by the contribution to the continuum by the underlying stellar population. This correction would increase the values of EW(H) thus decreasing the calculated Mion. The total number of ionising photons has been derived from the H luminosities (Leitherer & Heckman, 1995):
We have taken the total observed H luminosities from Planesas et al. (1997) correcting them for the different assumed distance. These authors estimated a diameter of 2.4″ for each whole region and the nucleus, except for R4 for which they used 2.2″. We have corrected the H luminosities for internal extinction using the colour excess [E(B-V)] estimated by Pérez-Olea (1996) and assuming the galactic extinction law of Miller & Mathews (1972) with = 3.2.
Our derived values of Q(H0) are lower limits since we have not taken into account either the absorption of photons by dust or any photon escape from the Hii regions.
The final expression for the derivation of Mion is:
Ionised gas
The amount of ionised gas (MHII) associated to each starforming region complex has been obtained from our derived H luminosities using the relation given by Macchetto et al. (1990) for an electron temperature of 104 K
where Ne is the electron density. The electron density for each region (obtained from the [Sii] 6717 / 6731 Å line ratio) has been taken from Díaz et al. (2006) for the CNSFRs and Pérez-Olea (1996) for the nucleus (see table 6).
In table 6 we have listed for each region and the nucleus, the H luminosities [L(H)] (corrected and uncorrected for reddening), the colour excess, E(B-V), the logarithmic extinction at H, C(H), the number of ionising photons, Q(H0), the equivalent width of H, EW(H), the electron density, Ne, and the masses of the ionising stellar cluster, Mion, and of the ionised hydrogen, MHII.
| Region | Lobs(H)† | E(B-V)‡ | C(H) | L(H) | Q(H0) | EW(H)‡ | Mion | N | MHII | Mion/M∗(%) |
| R2 | 19.3 | 0.17 | 0.02 | 20.5 | 15.0 | 9.5 | 7.2 | 440 | 0.15 | 5.6 |
| R3 | 25.0 | 0.46 | 0.65 | 111.0 | 81.5 | 16.5 | 24.2 | 430 | 0.86 | 5.4 |
| R4 | 12.7 | 0.27 | 0.24 | 22.0 | 16.2 | 13.0 | 5.9 | 310 | 0.24 | 6.8 |
| R5 | 5.9 | 0.25 | 0.20 | 9.2 | 6.8 | 5.1 | 5.5 | 360 | 0.09 | 11.3 |
| R6 | 7.5 | 0.0 | -0.34 | 3.4 | 2.5 | 2.3 | 4.1 | 360 | 0.03 | 1.0 |
| N | 3.3 | 0.07 | -0.19 | 2.1 | 1.6 | 1.8 | 3.1 | 650‡ | 0.01 | 0.9 |
| luminosities in 1038 erg s-1, masses in 105 M⊙, ionising photons in 1050 ph s-1 and densities in cm-3 | ||||||||||
| †from Planesas et al. (1997) corrected for the different adopted distances | ||||||||||
| ‡from Pérez-Olea (1996) | ||||||||||
| § from Díaz et al. (2006) | ||||||||||
3.4 Emission line ratios
We have used two different ways to integrate the intensity of a given line: (1) in the cases of a single Gaussian fit the emission line intensities were measured using the SPLOT task of IRAF. The positions of the local continua are placed by eye. For the H emission lines a conspicuous underlying stellar population is easily appreciable by the presence of absorption features that depress the lines (see discussion in Díaz, 1988). Examples of this effect can be appreciated in Fig. 5. We have then defined a pseudo-continuum at the base of the line to measure the line intensities and minimise the errors introduced by the underlying population (for details see Hägele et al., 2006). (2) in the cases of a fit by two Gaussians the individual intensities of the narrow and broad components are estimated from the fitting parameters using the expression I = 1.0645 A FWHM (= A ), where I is the Gaussian intensity, A is the amplitude of the Gaussian and FWHM is the full width at half maximum ( is the dispersion of the Gaussian). A pseudo-continuum for the H emission line was also defined in these cases.
Following González-Delgado et al. (1994), Castellanos, Díaz & Terlevich (2002) and Pérez-Montero & Díaz (2003), the statistical errors associated with the observed emission fluxes have been calculated using the expression = N1/2[1 + EW/(N)]1/2, where is the error in the observed line flux, represents the standard deviation in a box near the measured emission line and stands for the error in the continuum placement, N is the number of pixels used in the measurement of the line intensity, EW is the line equivalent width, and is the wavelength dispersion in angstroms per pixel. For the H emission line we have doubled the derived error, , in order to take into account the uncertainties introduced by the presence of the underlying stellar population (Hägele et al., 2006).
The logarithmic ratio between the emission line intensities of [Oiii] 5007 Å and H, and their corresponding errors, are presented in table 7. We have also listed in this table the logarithmic ratio between the emission line fluxes of [Nii] 6584 Å and H together with their corresponding errors from Díaz et al. (2006).
| 1 component | 2 components | ||||
| narrow | broad | ||||
| Region | Slit | log([Oiii]5007/H) | log([Oiii]5007/H) | log([Oiii]5007/H) | log([Nii]6584/H)† |
| R2 | S1 | -1.070.06 | -1.660.08 | -0.930.12 | -0.430.01 |
| R2 | S3 | -1.010.06 | -1.550.08 | -0.960.13 | |
| R3 | S1 | -1.100.06 | -1.570.07 | -0.930.10 | -0.420.01 |
| R3 | S2 | -1.000.06 | -1.520.09 | -0.890.10 | |
| R4 | S2 | -1.030.07 | — | — | -0.490.01 |
| R5 | S3 | -0.850.12 | — | — | -0.370.03 |
| R6 | S2 | -1.090.11 | — | — | -0.520.02 |
| N | S3 | -0.280.05 | — | — | |
| †from Díaz et al. (2006) | |||||
4 Discussion
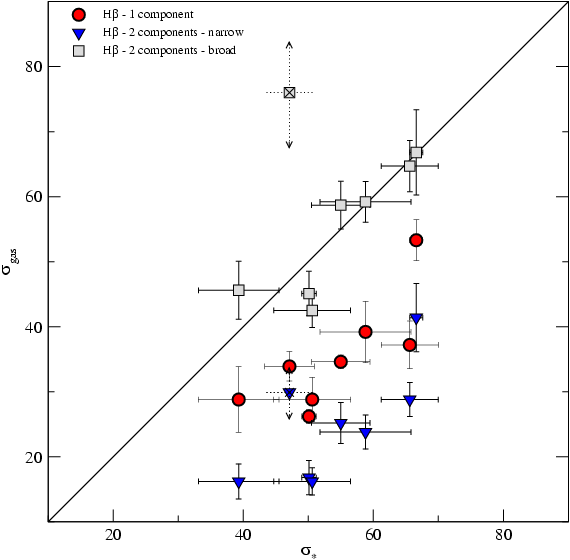
The upper panel of Fig. 11 shows the relation between the velocity dispersions of gas and stars. Circles correspond to gas velocity dispersions measured from the H emission line using a single Gaussian fit. Squares and triangles correspond to measurements performed using two-component Gaussian fits, squares for the broad component and triangles for the narrow one. The straight line shows the one-to-one relation. As a general result, the H velocity dispersions derived by a single Gaussian fit are lower than the stellar ones by about 25 km s-1. This is also the case for the Paschen lines in the two regions where they could be measured. On the other hand, a good agreement is found between the stellar velocity dispersions and those of the broad component of H. The deviant point, marked with arrows, corresponds to the region with the lowest signal-to-noise ratio (R5) for which the fits do not provide accurate results. The narrow component shows velocity dispersions even lower than those obtained by single Gaussian fits. The ratio between the fluxes in the narrow and broad components is between 0.7 and 0.95 (except for the case of R5 for which no meaningful result is found).
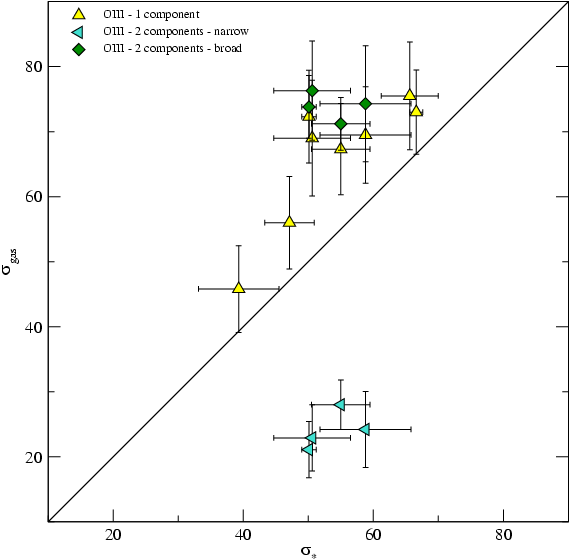
The lower panel of Fig. 11 shows the relation between the stellar velocity dispersions and those of the [Oiii] emission line measured by both single and two-component Gaussian fits, which due to the weakness of the line (see figures 3 to 5), could be done in only four cases, corresponding to the two slit positions on regions R2 and R3. In this case, the broad component seems to dominate the width of the emission line which again agrees with the stellar one. The width of the narrow component, in the cases in which the two-component fit was possible, is comparable to that of the narrow component of the H line.
The two gaseous components have been plotted separately in Fig. 12 which shows their location in the [Oiii]/H vs [Nii]/H diagram (BPT; Baldwin, Phillips & Terlevich, 1981) together with a sample of emission line galaxies (including Hii-like objects) from the SDSS-DR3 (López, 2005) and Hii regions from the sample of Pérez-Montero & Díaz (2005). The two systems are clearly segregated in this diagnostic diagram with the narrow component showing the lowest excitation of the two and occupying the same position in the diagram as the starburst systems in the SDSS dataset with the lowest excitation found.
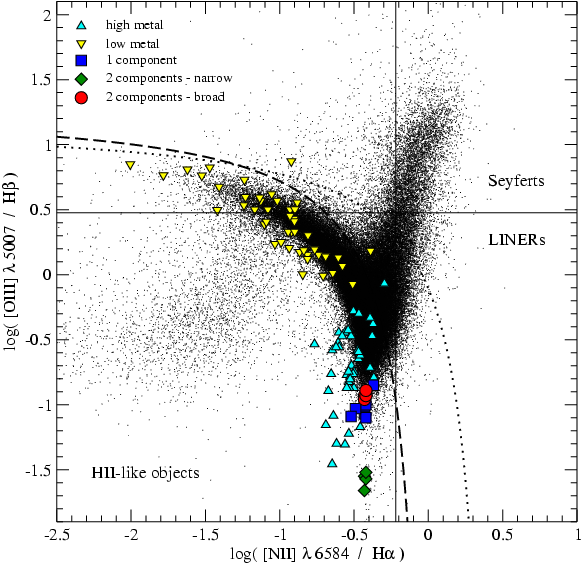
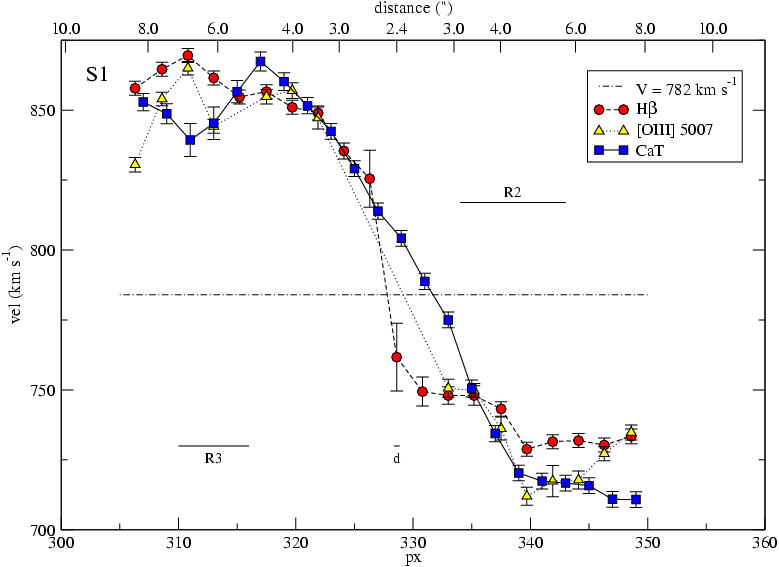
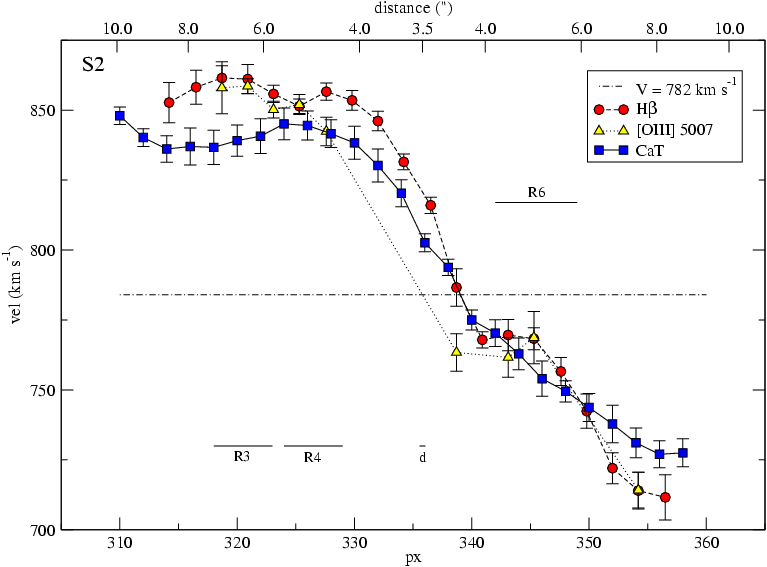
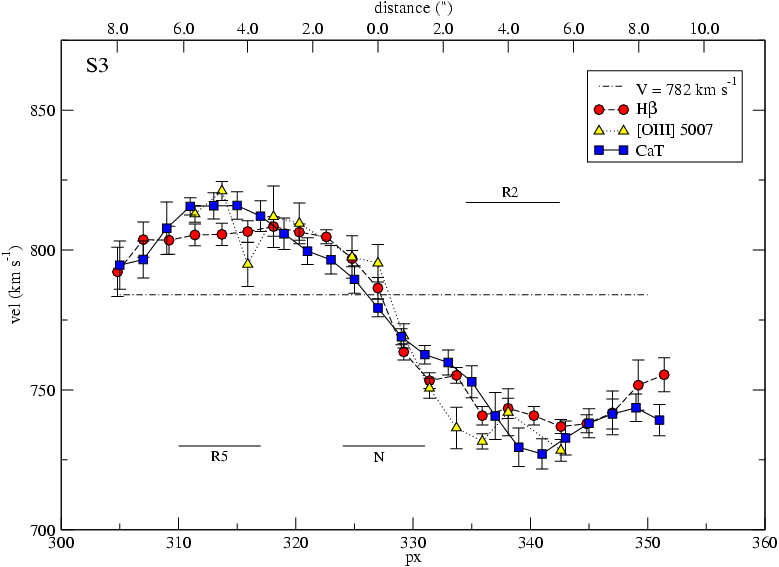
Fig. 13 shows the radial velocities along the slit for each slit position as derived from the ionised gas emission lines and stellar absorptions. The turnover points of the rotational curves seem to be located at the same position than the starforming ring, specially for the S3 slit position that crosses the centre of the galaxy, as found in other galaxies (see Telesco & Decher, 1988; Díaz et al., 1999, and references therein). For the systemic velocity of NGC 3351, the derived values are consistent with those previously obtained by Rubin et al. (1975) and Planesas et al. (1997), and with the velocity distribution expected for this type of galaxies (Binney & Tremaine, 1987).
The rotation velocities derived for both stars and gas are in reasonable agreement, although in some cases the gas seems to rotate somewhat faster than the stars. In fact, in the lower panel of Fig 13, which corresponds to the slit position passing through the nucleus, it is interesting to note that at the maximum and minimum of the velocity curve, which correspond approximately to the positions of regions R5 and R2, the H emission line shows velocities lower and higher than the stars by about 25 and 30 km s-1 respectively. This could be interpreted as motions of the ionised hydrogen deviating from rotation and consistent with a radial infall to the central regions of the galaxy. A similar result was found by Rubin et al. (1975) from high dispersion observations of the H line in the central region of this galaxy. Their preferred model for the fitting of the kinematical data consists of gas which is rotating and contracting with Vrot = 126 16 km s-1 and Vcont = 34 11 km s-1.
It is clearly of major interest to find out how widespread is the presence of two distinct components in the emission lines in ionised regions and what is its influence on the observed line ratios for several reasons. Firstly, a change in position in the diagnostic diagrams would certainly affect the classification of the activity in the central regions of the concerned galaxies. Secondly, it will affect the inferences about the nature of the source of ionisation in the two components. And thirdly, it could have an influence on the gas abundance determinations given that the ratio of the narrow to the broad components of H is about 1. Clearly it is not possible to use global line ratios to estimate gaseous abundances if the permitted and forbidden line fluxes are partially originated in different kinematical systems. To disentangle the origin of these two components it will be necessary to map these regions with high spectral and spatial resolution and much better S/N in particular for the O2+ lines. 3D spectroscopy with Integral Field Units (IFUs) would be the ideal tool to approach this issue.
Our values of the dynamical masses have been derived from stellar velocity dispersion measurements as mapped by the CaT absorption lines and the sizes measured on an HST image. They are in the range between 4.9 106 and 4.3 107 M⊙ for the CNSFRs and is 3.5 107 M⊙ for the nuclear region inside the inner 11.3 pc (see table 5). The fractional errors of the dynamical masses of the CNSFRs are between 3.4 and 17.8 %, and is 3.1 % for the nucleus. Masses derived from the H velocity dispersion under the assumption of a single component for the gas would have been underestimated by factors between approximately 2 and 4. We have found that only two of the regions, R4 and R5, seem to possess just one knot showing up in the continuum image and coincident with the H emission. The sizes of these knots are 2.9 and 3.2 pc respectively. The rest of the regions are made up of several knots which presumably correspond to individual star clusters. Their sizes are between 4.9 and 1.7 pc, at the limit of the resolution. For comparison, the size of cluster A in NGC 1569 is 1.9 pc, as given by Meurer et al. (1995). The sizes and absolute visual magnitudes estimated for each individual star cluster (e.g. Mv = -12.55 for R4 derived from the HST image) are in the ranges established by Meurer et al. (1995) in the definition of a super star cluster (SSC).
Other estimates of the masses of these regions have been obtained from the fitting of broad band colours or spectra with the use of stellar population synthesis models. Elmegreen et al. (1997) from near IR photometry in the J and K bands and models by Leitherer & Heckman (1995) for instantaneous star formation and solar and twice solar metallicity, derive masses of the CNSFRs from 1 to 10 105 M⊙. Colina et al. (1997), from UV (IUE) spectra and instantaneous burst models by Mas-Hesse & Kunth (1991) derive a value of 3 105 M⊙ for the whole SF ring. In both cases, in fact, these observables trace the young massive population which constitutes only part of the total mass.
The masses derived here for the circumnuclear starforming individual clusters of NGC 3351 are between 1.8 and 8.7 106 M⊙. These values are between 5.5 and 26 times the mass derived for the SSC A in NGC 1569 by Ho & Filippenko (1996a) from stellar velocity dispersion measurements using red (6000 Å) spectra, which is (3.30.5) 105 M⊙ and larger than masses derived kinematically for SSC in irregular galaxies (McCrady, Gilbert & Graham, 2003; Larsen, Brodie & Hunter, 2004). They are also larger than those derived by Benedict et al. (2002) for the individual circumnuclear clusters of NGC 4314 form HST imaging data following the procedure of Elmegreen & Salzer (1999), which are in the range 0.2 10 M 1.6 104 M⊙. However, also the H luminosities of the NGC 4314 clusters are lower than those of NGC 3351 by a factor of about 40.
The masses of the ionising stellar clusters of the CNSFRs, as derived from their H luminosities, are between 4.1 105 and 2.4 106 M⊙ for the starforming regions, and is 3.1 105 M⊙ for the nucleus (see table 6). These values are comparable to that derived by González-Delgado et al. (1994) for the circumnuclear region A in NGC 7714 (5.1105 M⊙). In column 11 of table 6 we show a comparison (in percentage) between ionising stellar masses of the circumnuclear regions and their dynamical masses. These values vary approximately in the range 1-11 % for the CNSFRs, and is 0.9 % for the nucleus. Since the CaT absorption features are dominated by young stars (see discussion above, Sec. 3.3), and the Mion/M∗ fraction is still remarkably small in the case of the CNSFRs composed of single knots (R4 and R5, for which the dynamical mass is most robustly estimated) we can assume that our upper limits to the dynamical masses, in spite of the limitations of the method used to derive them, are rather tight. Then, our results concerning the Mion/M∗ fraction are robust.
Finally, the masses of the ionised gas vary between 3 103 and 8.6 104 M⊙ for the CNSFRs, and is 1 103 M⊙ for the nucleus (see table 6), also comparable to that derived by González-Delgado et al. (1994) for the circumnuclear region A in NGC 7714 (3105 M⊙). They make up a small fraction of the total mass of the regions.
Both the masses of the ionising stellar clusters and the ionised gas, have been derived from the H luminosity of the CNSFRs assumed to consist of one single component. However, if we consider only the broad component whose kinematics follows that of the stars in the regions, all derived quantities would be smaller by a factor of two.
5 Summary and conclusions
We have measured gas and stellar velocity dispersions in 5 CNSFRs and the nucleus of the barred spiral NGC 3351. The stellar dispersions have been measured from high resolution spectra of the CaT lines at 8494, 8542, 8662 Å, while the gas velocity dispersions have been measured by Gaussian fits to the H 4861 Å line on high dispersion spectra.
Stellar velocity dispersions are between 39 and 67 km s-1, about 20 km s-1 larger than those measured for the gas. However, the best Gaussian fits involved two different components for the gas: a “broad component” with a velocity dispersion similar to that measured for the stars, and a “narrow component” with a dispersion lower than the stellar one by about 30 km s-1.
When plotted in a [Oiii]/H vs [Nii]/H diagram, the two systems are clearly segregated with the narrow component having the lowest excitation and being among the lowest excitation line ratios detected within the SDSS dataset of starburst systems.
Values for the dynamical masses of the CNSFRs have been derived from stellar velocity dispersions and are in the range between 4.9 106 and 4.3 107 M⊙ for the CNSFRs and is 3.5 107 M⊙ for the nuclear region inside the inner 11.3 pc. Masses derived from the H velocity dispersion under the assumption of a single component for the gas would have been underestimated by factors between approximately 2 to 4.
The derived masses for the individual clusters of NGC 3351 are between 1.8 and 8.7 106 M⊙. These values are between 5.5 and 26 times the mass derived for the SSC A in NGC 1569 by Ho & Filippenko (1996a) and larger than other kinematically derived SSC masses.
Masses of the ionising stellar clusters of the CNSFRs have been derived from their H luminosities under the assumption that the regions are ionisation bound and without taking into account any photon absorption by dust. Their values are between 4.1 105 and 2.4 106 M⊙ for the starforming regions, and is 3.1 105 M⊙ for the nucleus (see table 6), comparable to that derived by González-Delgado et al. (1994) for the circumnuclear region A in NGC 7714. Therefore, the ratio of the ionising stellar population to the total dynamical mass is between 0.01 and 0.11.
Derived masses for the ionised gas vary between 3 103 and 8.6 104 M⊙ for the CNSFRs, and is 1 103 M⊙ for the nucleus, also comparable to that derived by González-Delgado et al. (1994).
It is interesting to note that, according to our findings, the SSC in CNSFRs seem to contain composite stellar populations. Although the youngest one dominates the UV light and is responsible for the gas ionisation, it constitutes only about 10 % of the total. This can explain the low equivalent widths of emission lines measured in these regions. This may well apply to the case of other SSC and therefore conclusions drawn from fits of SSP (single stellar population) models should be taken with caution (e.g. McCrady, Gilbert & Graham, 2003; Larsen, Brodie & Hunter, 2004). Also the composite nature of the CNSFRs means that star formation in the rings is a process that has taken place over time periods much longer than those implied by the properties of the ionised gas.
The rotation velocities derived for both stars and gas are in reasonable
agreement, although in some cases the gas shows a velocity slightly different
from that of the stars. The rotation curve corresponding to the position
going through the centre of the galaxy shows maximum and minimum values at the
position of the circumnuclear ring, as observed in other galaxies with
CNSFRs. The differences in velocity between gas and stars can be interpreted
as motions of the ionised hydrogen deviating from rotation and consistent with
a radial infall to the central regions of the galaxy. Our results are
consistent with those found by Rubin et al. (1975) and would yield an infall
velocity of about 25 km s-1.
The existence of more than one velocity component in the ionised
gas corresponding to kinematically distinct systems, deserves further
study. Several results derived from the observations of the different emission
lines could be affected, among others: the classification of the activity in
the central regions of galaxies, the inferences about the nature of the source
of ionisation, the gas abundance determinations, the number of ionising
photons from a given region and any quantity derived from them, etc. To
disentangle the origin of these two components it will be necessary to map
these regions with high spectral and spatial resolution and much better S/N in
particular for the O2+ lines. 3D spectroscopy with Integral Field Units
(IFUs) would be the ideal tool to approach this issue.
Acknowledgments We are indebted to Jesús López who provided the data on the SDSS sample prior to publication. We acknowledge fruitful discussions with Horacio Dottori, Enrique Pérez, Enrique Pérez-Montero and José Vílchez. We thank very much an anonymous referee for his/her careful examination of our manuscript. We have found the report extremely thorough and undoubtedly has helped to improve the contents of this paper.
The WHT is operated in the island of La Palma by the Isaac Newton Group in the Spanish Observatorio del Roque de los Muchachos of the Instituto de Astrofísica de Canarias. We thank the Spanish allocation committee (CAT) for awarding observing time.
Some of the data presented in this paper were obtained from the Multimission Archive at the Space Telescope Science Institute (MAST). STScI is operated by the Association of Universities for Research in Astronomy, Inc., under NASA contract NAS5-26555. Support for MAST for non-HST data is provided by the NASA Office of Space Science via grant NAG5-7584 and by other grants and contracts.
This research has made use of the NASA/IPAC Extragalactic Database (NED) which is operated by the Jet Propulsion Laboratory, California Institute of Technology, under contract with the National Aeronautics and Space Administration.
This research has made use of the SIMBAD database, operated at CDS, Strasbourg, France.
This work has been supported by DGICYT grant AYA-2004-02860-C03. GH and MC acknowledge support from the Spanish MEC through FPU grants AP2003-1821 and AP2004-0977. AID acknowledges support from the Spanish MEC through a sabbatical grant PR2006-0049. Also, partial support from the Comunidad de Madrid under grant S-0505/ESP/000237 (ASTROCAM) is acknowledged.Support from the Mexican Research Council (CONACYT) through grant 49942 is acknowledged by ET and RT. We thank the hospitality of the Institute of Astronomy of Cambridge where this paper was written.
References
- Alloin & Nieto (1982) Alloin D., Nieto J.-L., 1982, Astron. and Astrophys. Suppl. Sries, 50, 491
- Baldwin et al. (1981) Baldwin J. A., Phillips M. M., Terlevich R., 1981, Publ. Astron. Soc. Pac., 93, 5
- Benedict et al. (2002) Benedict G. F., Howell D. A., Jørgensen I., Kenney J. D. P., Smith B. J., 2002, Astron. J., 123, 1411
- Binney & Tremaine (1987) Binney J., Tremaine S., 1987, Galactic dynamics. Princeton, NJ, Princeton University Press, 1987, 747 p.
- Castellanos et al. (2002) Castellanos M., Díaz A. I., Terlevich E., 2002, Mon. Not. R. Astron. Soc., 329, 315
- Cid Fernandes et al. (2001) Cid Fernandes R., Heckman T., Schmitt H., Delgado R. M. G., Storchi-Bergmann T., 2001, Astrophys. J., 558, 81
- Colina et al. (1997) Colina L., García Vargas M. L., Mas-Hesse J. M., Alberdi A., Krabbe A., 1997, Astrophys. J. Letters, 484, L41+
- Colina et al. (2002) Colina L., González-Delgado R., Mas-Hesse J. M., Leitherer C., 2002, Astrophys. J., 579, 545
- Devereux et al. (1992) Devereux N. A., Kenney J. D., Young J. S., 1992, Astron. J., 103, 784
- Díaz (1988) Díaz A. I., 1988, Mon. Not. R. Astron. Soc., 231, 57
- Díaz (1998) Díaz A. I., 1998, Astron. Astrophys. Suppl. Ser., 263, 143
- Díaz et al. (2000) Díaz A. I., Álvarez-Álvarez M., Terlevich E., Terlevich R., Portal M. S., Aretxaga I., 2000, Mon. Not. R. Astron. Soc., 311, 120
- Díaz & Pérez-Montero (2000) Díaz A. I., Pérez-Montero E., 2000, Mon. Not. R. Astron. Soc., 312, 130
- Díaz et al. (2006) Díaz A. I., Terlevich E., Castellanos M., Hägele G. F., 2006, astro-ph/0610787
- Díaz et al. (1989) Díaz A. I., Terlevich E., Terlevich R., 1989, Mon. Not. R. Astron. Soc., 239, 325
- Díaz et al. (1999) Díaz R., Carranza G., Dottori H., Goldes G., 1999, Astrophys. J., 512, 623
- Elmegreen et al. (1997) Elmegreen D. M., Chromey F. R., Santos M., Marshall D., 1997, Astron. J., 114, 1850
- Elmegreen & Salzer (1999) Elmegreen D. M., Salzer J. J., 1999, Astron. J., 117, 764
- García-Vargas et al. (1995) García-Vargas M. L., Bressan A., Díaz A. I., 1995, Astron. and Astrophys. Suppl. Sries, 112, 35
- González-Delgado et al. (1998) González-Delgado R. M., Heckman T., Leitherer C., Meurer G., Krolik J., Wilson A. S., Kinney A., Koratkar A., 1998, Astrophys. J., 505, 174
- González-Delgado et al. (1994) González-Delgado R. M., Pérez E., Tenorio-Tagle G., Vílchez J. M., Terlevich E., Terlevich R., Telles E., Rodríguez-Espinosa J. M., Mas-Hesse M., García-Vargas M. L., Díaz A. I., Cepa J., Castañeda H., 1994, Astrophys. J., 437, 239
- Graham & et al. (1997) Graham J. A., et al. 1997, Astrophys. J., 477, 535
- Hägele et al. (2006) Hägele G. F., Pérez-Montero E., Díaz A. I., Terlevich E., Terlevich R., 2006, Mon. Not. R. Astron. Soc., 372, 293
- Ho & Filippenko (1996a) Ho L. C., Filippenko A. V., 1996a, Astrophys. J. Letters, 466, L83+
- Ho & Filippenko (1996b) Ho L. C., Filippenko A. V., 1996b, Astrophys. J., 472, 600
- Ho et al. (1997) Ho L. C., Filippenko A. V., Sargent W. L. W., 1997, Astrophys. J., Suppl. Ser., 112, 315
- Hoyos & Díaz (2006) Hoyos C., Díaz A. I., 2006, Mon. Not. R. Astron. Soc., 365, 454
- Jiménez-Benito et al. (2000) Jiménez-Benito L., Díaz A. I., Terlevich R., Terlevich E., 2000, Mon. Not. R. Astron. Soc., 317, 907
- Kauffmann et al. (2003) Kauffmann G., Heckman T. M., Tremonti C., Brinchmann J., Charlot S., White S. D. M., Ridgway S. E., Brinkmann J., Fukugita M., Hall P. B., Ivezić Ž., Richards G. T., Schneider D. P., 2003, Mon. Not. R. Astron. Soc., 346, 1055
- Kewley et al. (2001) Kewley L. J., Dopita M. A., Sutherland R. S., Heisler C. A., Trevena J., 2001, Astrophys. J., 556, 121
- Kurtz & Mink (1998) Kurtz M. J., Mink D. J., 1998, Publ. Astron. Soc. Pac., 110, 934
- Larsen et al. (2004) Larsen S. S., Brodie J. P., Hunter D. A., 2004, Astron. J., 128, 2295
- Leitherer & Heckman (1995) Leitherer C., Heckman T. M., 1995, Astrophys. J., Suppl. Ser., 96, 9
- López (2005) López J., 2005, MSc Thesis. INAOE
- Macchetto et al. (1990) Macchetto F., Colina L., Golombek D., Perryman M. A. C., di Serego Alighieri S., 1990, Astrophys. J., 356, 389
- Maoz et al. (1996) Maoz D., Barth A. J., Sternberg A., Filippenko A. V., Ho L. C., Macchetto F. D., Rix H.-W., Schneider D. P., 1996, Astron. J., 111, 2248
- Mas-Hesse & Kunth (1991) Mas-Hesse J. M., Kunth D., 1991, Astron. and Astrophys. Suppl. Sries, 88, 399
- McCrady et al. (2003) McCrady N., Gilbert A. M., Graham J. R., 2003, Astrophys. J., 596, 240
- Melnick et al. (1999) Melnick J., Tenorio-Tagle G., Terlevich R., 1999, Mon. Not. R. Astron. Soc., 302, 677
- Melnick et al. (1988) Melnick J., Terlevich R., Moles M., 1988, Mon. Not. R. Astron. Soc., 235, 297
- Meurer et al. (1995) Meurer G. R., Heckman T. M., Leitherer C., Kinney A., Robert C., Garnett D. R., 1995, Astron. J., 110, 2665
- Miller & Mathews (1972) Miller J. S., Mathews W. G., 1972, Astrophys. J., 172, 593
- Nelson & Whittle (1995) Nelson C. H., Whittle M., 1995, Astrophys. J., Suppl. Ser., 99, 67
- Osterbrock et al. (1996) Osterbrock D. E., Fulbright J. P., Martel A. R., Keane M. J., Trager S. C., Basri G., 1996, Publ. Astron. Soc. Pac., 108, 277
- Palacios et al. (1997) Palacios J., García-Vargas M. L., Díaz A., Terlevich R., Terlevich E., 1997, Astron. Astrophys., 323, 749
- Pérez-Montero & Díaz (2003) Pérez-Montero E., Díaz A. I., 2003, Mon. Not. R. Astron. Soc., 346, 105
- Pérez-Montero & Díaz (2005) Pérez-Montero E., Díaz A. I., 2005, Mon. Not. R. Astron. Soc., 361, 1063
- Pérez-Olea (1996) Pérez-Olea D., 1996, PhD Thesis. Universidad Autónoma de Madrid
- Planesas et al. (1997) Planesas P., Colina L., Pérez-Olea D., 1997, Astron. Astrophys., 325, 81
- Prada et al. (1994) Prada F., Greve A., McKeith C. D., 1994, Astron. Astrophys., 288, 396
- Rubin et al. (1975) Rubin V. C., Peterson C. J., Ford Jr. W. K., 1975, Astrophys. J., 199, 39
- Sérsic & Pastoriza (1967) Sérsic J. L., Pastoriza M., 1967, Publ. Astron. Soc. Pac., 79, 152
- Salpeter (1955) Salpeter E. E., 1955, Astrophys. J., 121, 161
- Sandage & Tammann (1987) Sandage A., Tammann G. A., 1987, A revised Shapley-Ames Catalog of bright galaxies. Carnegie Institution of Washington Publication, Washington: Carnegie Institution, 1987, 2nd ed.
- Telesco & Decher (1988) Telesco C. M., Decher R., 1988, Astrophys. J., 334, 573
- Terlevich et al. (1990) Terlevich E., Terlevich R., Díaz A. I., Pastoriza M. G., Dottori H., 1990, Mon. Not. R. Astron. Soc., 242, 48P
- Tonry & Davis (1979) Tonry J., Davis M., 1979, Astron. J., 84, 1511