Yet another galaxy identification for an
ultraluminous X-ray source††thanks: Based on observations collected
at the Bologna Astronomical Observatory in Loiano, Italy, and
at the Astronomical Observatory of Asiago, Italy.
We report on the identification of the optical and infrared counterparts of the ultraluminous X-ray source (ULX) XMMU J121214.5+131248 (NGC4168-ULX1). The optical spectrum yields a redshift of , which implies that the ULX is not associated with the nearby galaxy NGC 4168, but rather with a background object. Optical spectral line ratios and the spectral energy distribution constructed from the available data indicate that the source is likely a starburst nucleus.
Key Words.:
Galaxies: distances and redshifts — Galaxies: photometry — Galaxies: starburst1 Introduction
Ultraluminous X-ray sources (ULXs), i.e. off-nuclear sources with luminosities well above the Eddington limit for a typical neutron star, are now known to populate about 30% of nearby galaxies (see van der Marel 2003 for a review). Despite much effort, little is presently known about the nature of these sources, particularly since the counterparts at other wavelengths are difficult to find. Indeed, these sources are often superposed against regions of high surface brightness in their host galaxy. Thus, most of the optical identifications are obtained by spatial coincidence of the counterparts and comparison with broadband spectral characteristics of known stars in the host (Liu et al. 2002; Wu et al. 2002; Zezas et al. 2002; Zampieri et al. 2003). In other cases, it has been possible to study only the nearby environment in the ULX host (Pakull & Mirioni 2002; Wang 2002; Roberts et al. 2003). In one case (NGC4698-ULX1) the optical spectral features allowed a clear identification as a background BL Lac object (Foschini et al. 2002a).
Here we report the identification of the nature of another ULX. The counterparts in the infrared and optical bands were found, and spectroscopy revealed clear Balmer and forbidden transition emission lines. The derived redshift of indicates a background galaxy in this case also.
2 The source: NGC4168-ULX1
NGC 4168 is an E2 elliptical galaxy located in the Virgo cluster ( Mpc). It hosts an active galactic nucleus (AGN), classified as a Seyfert 1.9 by Ho et al. (1997). The galaxy was observed on 4 December 2001 using the European Photon Imaging Camera (EPIC) on board the XMM-Newton satellite (see Foschini et al. 2002b; for the X-ray part, we refer in the following to the results obtained in this paper, unless explicitly stated). EPIC is composed of two instruments: the PN-CCD camera (Strüder et al. 2001) and two MOS-CCD detectors (Turner et al. 2001). The effective exposure time was ks.
One ULX was found apparently associated with NGC 4168, being inside the galaxy’s ellipse, at from the optical centre of the galaxy. The ULX has coordinates (J2000) and , with an uncertainty radius of .
The counts were not sufficient to extract a spectrum, so we could only convert to physical units using the count rates derived from the eboxdetect task of the XMM-SAS software (v. 5.2). We found a count rate of counts s-1 in the 0.5–10 keV band, which corresponds to a flux of erg cm-2 s-1 adopting a conversion factor of counts cm2 erg-1, which in turn was derived by using a power-law model with and an average Galactic column density of cm-2. This value for is common among the ULXs found with XMM-Newton. This flux value was corrected according to the energy encircled fraction (Ghizzardi 2001). Correction for vignetting (Lumb 2002) was not applied because the source is close to the center of the field of view (). At the distance of NGC 4168 the resulting keV luminosity is erg s-1 (for a discussion on the luminosity threshold of ULXs, see Foschini et al. 2002c).
3 Archival optical and near-infrared data
A single optical object with coordinates (J2000) and 8 (i.e., 14 from the XMM-Newton position, thus well within the X-ray error box) is clearly visible on the Digitized Sky Survey (DSS)111http://archive.eso.org/dss/dss/ observation of NGC 4168, originally made with the 48-inch Schmidt telescope at Palomar Observatory on 14 April 1955. We thus consider it as the optical counterpart of NGC4168-ULX1.
The source is also present in the US Naval Observatory (USNO) B1.0 Catalog (Monet et al. 2003) with the identification number . The magnitudes in the different bands are , , , , and . The and magnitudes refer to the Palomar Observatory Sky Survey I (POSSI), performed between 1949 and 1965. The , and magnitudes are measured from the Palomar Observatory Sky Survey II (POSSII), performed from 1985 to 2000.
Two Micron All Sky Survey (2MASS)222http://www.ipac.caltech.edu/2mass/ near-infrared (NIR) observations were performed on 5 April 2000, and the source was detected in all the three bands (). From the Second Point Source Catalog, we get = 16.80.2, = 16.10.2, and = 15.30.1.
4 Optical observations at Loiano and Asiago
4.1 Spectra
Six medium-resolution optical spectra of the ULX were acquired between 21:23 UT of 4 March and 03:24 UT of 5 March 2003 in Loiano (Italy) with the Bologna Astronomical Observatory metre “G.D. Cassini” telescope plus BFOSC, for a total exposure time of 3 hours. One single 1-hour medium-resolution spectrum was also obtained at the “L. Rosino” Astronomical Observatory of Asiago (Italy), starting at 01:02 UT of 26 February 2003, with the metre “Copernicus” telescope plus AFOSC. The Cassini telescope was equipped with a pixels EEV CCD. The Copernicus telescope mounted instead a pixels SITe CCD. In both cases, Grism #4 and a slit width of were used, providing nominal spectral coverages 3500-8500 Å (Loiano) and 4000-8000 Å (Asiago). The use of this setup secured a final dispersion of Å/pix and Å/pix for the spectra acquired in Loiano and Asiago, respectively.
Spectra, after correction for flat-field, bias and cosmic-ray rejection, were background subtracted and optimally extracted (Horne 1986) using IRAF333http://iraf.noao.edu/. Wavelength calibration of the Loiano spectra was performed using He-Ar lamps, while the one acquired in Asiago was calibrated with Cd-Hg-Ne lamps. Spectra taken in Loiano were then flux-calibrated by using the spectrophotometric standard Hiltner 600 (Hamuy et al. 1992, 1994) and finally stacked together. Correction for slit losses was also applied to the continuum. For the Asiago spectrum no spectroscopic standard was available. Wavelength calibration was checked by using the positions of background night sky lines; the error was 0.5 Å for both spectra.
4.2 Imaging
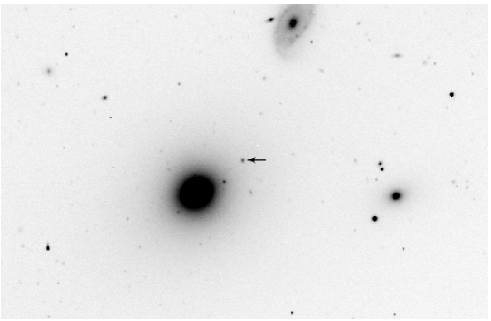
Between 23:45 UT of 4 March and 01:28 UT of 5 March 2003 photometry was also acquired in Loiano with BFOSC under an average seeing of 15. The EEV CCD, with a scale of 058/pix, secured a field of 126126. Images were corrected for bias and flat-field in the usual fashion and calibrated using the Rubin 149 field (Landolt 1992); the calibration accuracy is better than 3% in and better than 5% in . The source (in Fig. 1) is well detected in all bands.
Galactic absorption in the optical and NIR bands along the direction of the source was evaluated using the Galactic dust infrared maps by Schlegel et al. (1998); from these data we obtained a color excess = 0.036 mag. By applying the relation of Cardelli et al. (1989), we derived the following magnitudes for Galactic extinction correction: = 0.17, = 0.15, = 0.11, = 0.08, = 0.07, = 0.03, = 0.02, and = 0.01.

| Line | Flux |
|---|---|
| O ii 3727 | 1.510.15 |
| Hβ | 1.10.2 |
| O iii 5007 | 0.350.09 |
| N ii 6548 | 0.900.18 |
| Hα | 6.40.3 |
| N ii 6583 | 2.900.15 |
| S ii 6716 | 0.630.13 |
| S ii 6731 | 0.860.17 |
5 Results
The average spectrum taken at Loiano (Fig. 2) shows a number of emission features that can be readily identified with typical optical nebular lines. These include [O ii] 3727, Hβ, [O iii] 5007, Hα, [N ii] 6548, 6583, and [S ii] 6716, 6731. All identified emission lines yield a redshift of . This result is, in hindsight, not surprising, as the images acquired in Loiano show that the field is well populated by galaxies of various sizes and brightnesses, with very few foreground stars. The Asiago spectrum, albeit of lower S/N due to its shorter exposure, shows the presence of Hβ and [O ii] 3727 at the same redshift, thus confirming the result of the Loiano observations. Unfortunately, the actual useful spectral range secured by this spectrum has its red end at 7800 Å; therefore it does not cover the region containing Hα. Table 1 reports the emission-line fluxes as determined from the Loiano spectrum, dereddened for Galactic absorption. Given the limited S/N and resolution of the spectrum, no correction for starlight contamination (e.g., Ho et al. 1993, 1997) was attempted, but this does not strongly affect any of our conclusions.
Magnitudes of the source in the Loiano images were measured through aperture photometry, since its profile is significantly larger than the image PSF (26 versus 15) and, as measured on the -band frame, is possibly elongated in the NW-SE direction. Using an aperture radius of 4.5 pixels (corresponding to 26), we found the following optical magnitudes (not corrected for Galactic absorption): = 19.490.08, = 19.780.04, = 18.690.03, = 18.330.03, and = 17.680.05. The broad-band spectral energy distribution (SED) of the source, constructed with data from XMM-Newton (X-ray), Loiano (optical), and 2MASS (NIR), is shown in Fig. 3. The optical-NIR data points were corrected for Galactic absorption and converted into flux densities using the tables by Fukugita et al. (1995) for the optical and by Bersanelli et al. (1991) for the NIR. A 5% systematic error was added in quadrature to account for the uncertainties in the magnitude-to-flux conversion factors (Fukugita et al. 1995). No correction for any possible further absorption along the line of sight produced by the halo of NGC 4168 was included; this, however, should not be high as the source is well detected in the band.

6 Discussion
So, yet another putative ULX is found to be a background source. Assuming a cosmology with = 65 km s-1 Mpc-1, = 0.7 and = 0.3, we find that the luminosity distance to this source is = 1.16 Gpc, and that its X-ray luminosity is erg s-1 in the 0.6–12 keV rest-frame energy range. The angular size of the source translates into a linear diameter of about 30 kpc at = 0.217.
The measured value for the luminosity is 100–1000 times less that of “classical” active galactic nuclei (AGNs). Indeed, visual inspection of the optical spectrum in Fig. 2 suggests that the lines are due to stellar photoionization, rather than to an AGN. The diagnostic line ratios [N ii]/Hα, [S ii]/Hα, and [O iii]/Hβ, together with the nondetection of substantial [O i] 6300 emission, place this source in the regime of metal-rich giant extragalactic H ii regions or starburst nuclei (Ho et al. 1993, 1997).
Inspection of the SED of the source (Fig. 3) shows that a peak in the optical-NIR domain is present, followed by a drop across the and bands. Given the dominance of the stellar continuum in the spectrum (Fig. 2), most of the optical and NIR light comes from the integrated stellar emission from the galaxy. Although the S/N of the spectrum is insufficient to place strong constraints on the age and metallicity of the stellar population, they are not inconsistent with that of an evolved population. The optical-NIR SED also supports this conjecture. The X-ray emission, by contrast, is likely to be associated with the star-forming regions that give rise to the optical line emission. This may consist of a single starburst nucleus or multiple off-nuclear sources. An X-ray luminosity of 1042 erg s-1 is high, but not unusual, for a starburst (David et al. 1992).
The strength of the optical emission lines, after accounting for internal reddening, can be used to estimate the star formation rate (SFR) and metallicity. Assuming an intrinsic Balmer decrement of Hα/Hβ = 2.86 (Osterbrock 1989) and the extinction law of Cardelli et al. (1989), the observed Hα/Hβ = 5.82 implies an internal reddening of = 0.72 mag. Following Kennicutt (1998), we determine a SFR of 435 yr-1 from the reddening-corrected Hα luminosity of erg s-1. Similarly, the [O ii] luminosity yields a SFR of 8020 yr-1. Thus, to within a factor of 2 and within the uncertainties, the two estimates are consistent.
The optically derived SFR, on the other hand, is significantly lower than that predicted from the total X-ray luminosity. From the calibration of Ranalli et al. (2003), a 0.5–10 keV luminosity of 31042 erg s-1, if entirely attributed to star formation, requires a SFR of 300 yr-1, a factor of 5 higher than our estimates based on optical line emission. There are two possible explanations for this apparent discrepancy. First, the optically derived SFR may be an underestimate of the total SFR if star formation is more extended than the 2′′-wide slit: indeed, in case the distribution of star-forming regions is wider than that of the optical continuum emission, the correction for slit losses underestimates the actual total flux of emission lines. By contrast, the X-ray emission integrates over a larger area. Second, only a portion (20%) of the X-ray emission originates from star formation, with the dominant fraction coming from an AGN. Although the optical spectrum shows no signs of nonstellar activity, we cannot exclude the presence of a low-level AGN, especially one that is heavily obscured. Both of these possibilities can be tested with further observations.
The detection of [O ii], [O iii], and Hβ also allows us to infer the gas-phase oxygen abundance. Following Kobulnicky et al. (1999), the parameter gives 12 + log (O/H) = 7.6 or 8.9. Considering the intrinsic luminosity of the source (rest-frame 21.5 mag) and its [O iii]/[N ii] ratio, the larger of the two values is likely to be the correct one (see Kobulnicky et al. 1999), pointing to a basically solar oxygen abundance.
The comparison of the USNO archival magnitudes with the results of the optical photometry acquired in Loiano seems to suggest long-term variability for the source. However, we caution the reader that it is not infrequent to find discrepancies as large as 0.6 mag (see e.g. Masetti et al. 2003) between the automatically extracted archival magnitudes and the actual ones, calibrated through Landolt (1992) fields. This is most likely due to the fact that magnitude extraction from archival images was performed by using automatic pipelines and was (for the oldest surveys) applied to photographic plates.
In the minisurvey in Foschini et al. (2002b) 18 ULXs in 10 nearby galaxies were detected. According to the statistics from the Lockman hole studies (Hasinger et al. 2001) we expect to find 3.2 background sources with 2–10 keV flux higher than erg cm-2 s-1 in an area corresponding to the sum of all the ellipses of the considered galaxies. If we also take into account the case reported in Foschini et al. (2002a), with the present identification we already found 2 background objects among the 18 ULX candidates: so, we are close to the statistical limit by assuming that the Lockman Hole studies are valid over a wide range of the sky. Albeit the two selected cases might suffer from an observational bias (they are quite bright and outside the main body of the parent galaxy), additional detection of other background objects in the minisurvey should be considered with care.
In conclusion, we wish to remark that this case, as that of the ULX in NGC 4698 reported by Foschini et al. (2002a), has been instructive: despite the availability of broad-band multiwavelength data, they have proven insufficient to disclose the true nature of the source. The most crucial piece of information is optical spectroscopy of sufficient quality to reveal clear spectral features, which simultaneously provide redshift information and spectral diagnostics.
Acknowledgements.
We wish to thank L. Zampieri for the coordination of the Asiago Service Mode observations, and P. Grandi and M. Cappi for useful discussions. We also thank R. Gualandi for the night assistance in Loiano and H. Navasardyan for having performed the observations in Asiago as a Service Mode run. This research has made use of the NASA Astrophysics Data System Abstract Service, of the NASA/IPAC Extragalactic Database (NED), and of the NASA/IPAC Infrared Science Archive, which are operated by the Jet Propulsion Laboratory, California Institute of Technology, under contract with the National Aeronautics and Space Administration.References
- (1)
- (2) Bersanelli, M., Bouchet, P., & Falomo, R., 1991, A&A, 252, 854
- (3) Cardelli, J.A., Clayton, G.C., & Mathis, J.S., 1989, ApJ, 345, 245
- (4) David, L.P., Jones, C., & Forman, W., 1992, ApJ, 388, 82
- (5) Foschini, L., Ho, L.C., Masetti, N., et al., 2002a, A&A, 396, 787
- (6) Foschini, L., Di Cocco, G., Ho, L.C., et al., 2002b, A&A, 392, 817
- (7) Foschini, L., Di Cocco, G., Ho, L.C., et al., 2002c. In: Cagnoni, I. (ed.) Inflows, Outflows and Reprocessing around Black Holes – Proceedings of the 5th Italian AGN Meeting444http://www.unico.it/ilaria/AGN5/proceedings.html, p. 88 [astro-ph/0209298]
- (8) Fukugita, M., Shimasaku, K., & Ichikawa, T., 1995, PASP, 107, 945
- (9) Ghizzardi, S., 2001. In-flight calibration of the PSF for the MOS1 and MOS2 cameras. EPIC-MCT-TN-011 (Internal report)
- (10) Hamuy, M., Walker, A.R., Suntzeff, N.B., et al., 1992, PASP, 104, 533
- (11) Hamuy, M., Suntzeff, N.B., Heathcote, S.R., et al., 1994, PASP, 106, 566
- (12) Hasinger, G., Altieri, B., Arnaud, M., et al., 2001, A&A 365, L45
- (13) Ho, L.C., Filippenko, A.V., & Sargent, W.L.W., 1993, ApJ, 417, 63
- (14) Ho, L.C., Filippenko, A.V., & Sargent, W.L.W., 1997, ApJS, 112, 315
- (15) Horne, K., 1986, PASP, 98, 609
- (16) Kennicutt, R.C., Jr., 1998, ARA&A, 36, 189
- (17) Kobulnicky, H.A., Kennicutt, R.C., Jr., & Pizagno, J.L., 1999, ApJ, 514, 544
- (18) Landolt, A.U., 1992, AJ, 104, 340
- (19) Liu, J.-F., Bregman, J.N., & Seitzer, P., 2002, ApJ, 580, L31
- (20) Lumb, D.H., 2002. In: Jansen, F. (ed.) New Visions of the X-ray Universe in the XMM-Newton and Chandra Era, ESA-SP 488 [astro-ph/0203278]
- (21) Masetti, N., Palazzi, E., Pian, E., et al., 2003, A&A, in press [astro-ph/0302350]
- (22) Monet, D.G., Levine, S.E., Canzian, B., et al., 2003, AJ, 125, 984
- (23) Osterbrock, D.E., 1989, Astrophysics of Gaseous Nebulae and Active Galactic Nuclei (Mill Valley: Univ. Science Books)
- (24) Pakull, M.W., & Mirioni, L., 2002. In: Jansen, F. (ed.) New Visions of the X-ray Universe in the XMM-Newton and Chandra Era, ESA-SP 488 [astro-ph/0202488]
- (25) Ranalli, P., Comastri, A., & Setti, G., 2003, A&A, 399, 39
- (26) Roberts, T.P., Goad, M.R., Ward, M.J., et al., 2001, MNRAS 325, L7
- (27) Roberts, T.P., Goad, M.R., Ward, M.J., & Warwick, R.S., 2003, MNRAS, in press [astro-ph/0303110]
- (28) Schlegel, D.J., Finkbeiner, D.P., & Davis, M., 1998, ApJ, 500, 525
- (29) Strüder, L., Briel, U., Dennerl, K., et al., 2001, A&A, 365, L18
- (30) Turner, M.J., Abbey, A., Arnaud, M., et al., 2001, A&A, 365, L27
- (31) van der Marel, R.P., 2003. In: Ho, L.C. (ed.) Carnegie Obs. Astroph. Ser., Vol. 1: Coevolution of Black Holes and Galaxies, Cambridge Univ. Press, in press [astro-ph/0302101]
- (32) Wang, Q.D., 2002, MNRAS 332, 764
- (33) Wu, H., Xue, S.J., Xia, X.Y., et al., 2002, ApJ, 577, 738
- (34) Zampieri, L., Mucciarelli, P., Falomo, R., et al., 2003, ApJ, submitted
- (35) Zezas, A., Fabbiano, G., Rots, A.H., & Murray, S.S., 2002, ApJ, 577, 710