Abstract
I present some preliminary results from a high-resolution spectroscopic observing campaign conducted with UVES (Ultraviolet Visual Echelle Spectrograph) at the ESO VLT (Very Large Telescope), devoted to the study of the newly discovered, metal-rich red giant branch in Centauri (the RGB-a). In particular, I derive and discuss accurate abundances of iron-peak elements, -elements and -process elements. The main results discussed in this contribution are: (i) the RGB-a is the most metal-rich component of the RGB stellar mix in Cen, with [Fe/H]=; (ii) the RGB-a has a lower -enhancement compared to the other red giants, possibly due to SNe type Ia pollution and (iii) the -process elements overabundance of the RGB-a is similar to that of the other red giants in Cen, and unusually high for globular cluster stars, due to pollution by low mass Asymptotic Giant Branch (AGB) stars.
Chapter 0 Metal Rich Stars in Centauri
1 Introduction
Centauri (NGC 5139) is the most massive and bright system among the Galactic Globular Clusters (GGC). However, its most astonishing characteristic is the chemical inhomogeneity: Cen is the only GGC that shows clear and undisputed variations not only in the light elements abundances, but also in its overall metallicity. From this point of view, Cen could be considered a “bridge” between the common globulars, which are unable to retain the gas ejected by their former massive stars, and the dwarf galaxies, which are the least massive self-enriching stellar systems known. It is interesting to note that those dwarf spheroidal galaxies (dSph) that are less luminous than Cen (e.g. Ursa Minor, Draco and Carina) show modest abundance spreads with respect to this cluster.
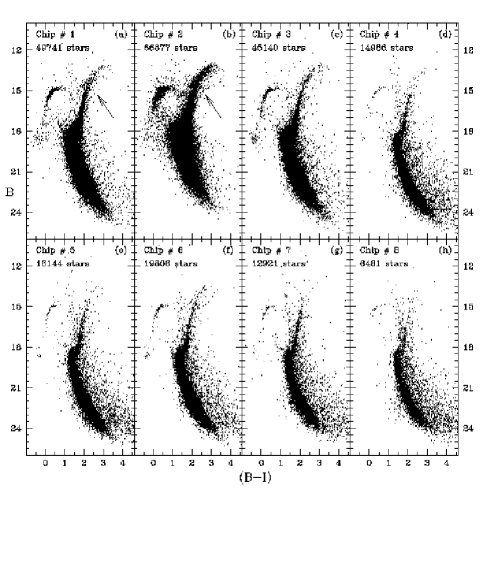
The metallicity distribution of Cen red giant branch (RGB) stars was derived by means of low resolution spectroscopy (see for example Norris et al. 1996 or Suntzeff & Kraft 1996), showing its main peak at [Fe/H]= with a long extended tail to higher metallicities and a possible secondary peak at about [Fe/H]. Recently, wide field photometric studies of Cen (Lee et al. 1999 and Pancino et al. 2000) have revealed the complex structure of the RGB of Cen. In particular, the presence of an additional well detached sequence, previously unknown, to the red side of the RGB (Figure 1) has been discovered. According to Pancino et al. (2000), three main sub-populations can be identified in the RGB distribution of Cen: (i) the main, metal-poor population (RGB-MP), with [Fe/H]= and comprising of the RGB population; (ii) the RGB-MInt, comprising the secondary peak at [Fe/H] together with the long tail extending to higher metallicity, comprising of the RGB; (iii) the additional RGB-a recently identified, that appears to be the most metal-rich component in Cen ([Fe/H]=, Pancino et al. 2002) and comprises only of the RGB population.
We have started a long term project devoted to the photometric and spectroscopic study of the various sub-populations in Cen, which is described in Ferraro et al. (2002) and in Pancino et al. (2003). I present here the first, preliminary results from the optical, high-resolution survey conducted with UVES mounted at the ESO VLT, which has been undertaken to investigate on the chemical properties of the RGB-a population, which was never studied with high-resolution spectroscopy before.
2 Observational Material
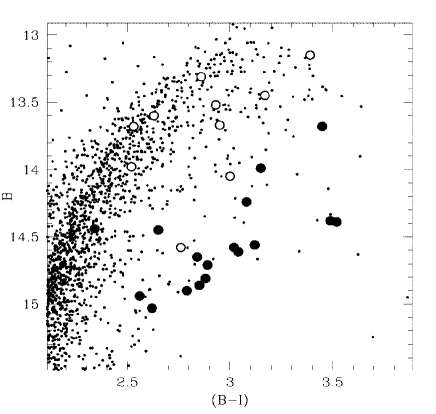
The principal aim of the observations was to cover the RGB-a along its full extension in a homogeneous way while having, at the same time, a good number of RGB-MInt and RGB-MP giants in common with previous high-resolution abundance studies of Cen. In particular, the attention has been concentrated so far on the most metal-rich stars in the sample, mostly belonging to the RGB-a and RGB-MInt populations (Figure 2).
Observations were conducted during three different observing runs with UVES at the ESO VLT in Paranal, Chile. All the spectra have high-resolution () and high signal to noise ratios (see Table 1). The first run (Run A) was carried out in June 2000, as a backup while the main targets were not visible, and six stars were observed covering a wide wavelength range (3500–9000Å, with gaps around 5000Å and 7000Å). A preliminary analysis of these stars has been already published by Pancino et al. (2002). The rest of the sample has been observed in April 2001 (Run B), with a slightly different setup, covering the range 3500–7000Å, with two gaps around 4600Å and 5800Å. Two additional stars have been added during the last observing run in March 2002 (Run C), using the same setup as in Run B.
A summary of the stars properties is presented in Table 1. Colors and magnitudes are from the wide field CCD and photometry published by Pancino et al. (2000) and from some additional band material observed with the WFI (Wide Field Imager) at the ESO 2.2 m telescope in La Silla, Chile. The colors have been dereddened using from Lub (2002).
| WFI | ROA | V | (B–V)o | (V–I)o | Run | S/N | Pop |
|---|---|---|---|---|---|---|---|
| (1) | (2) | (3) | (4) | (5) | (6) | (7) | (8) |
| 126361 | 179 | 12.10 | 1.46 | 1.72 | C | 20/110 | RGB-MInt |
| 139267 | — | 13.09 | 1.17 | 1.10 | B | 20/90 | RGB-MInt |
| 140419 | — | 13.49 | 1.22 | 1.19 | B | 25/100 | RGB-a |
| 221132 | 300 | 12.71 | 1.48 | 1.63 | A | 30/130 | RGB-a |
| 221376 | 500 | 13.12 | 1.30 | 1.36 | B | 30/110 | RGB-a |
| 221647 | 523 | 13.39 | 1.13 | 1.27 | B | 30/110 | RGB-a |
| 222068 | — | 12.95 | 1.42 | 1.32 | A | 30/110 | RGB-a |
| 222679 | — | 13.26 | 1.26 | 1.25 | A | 25/90 | RGB-a |
| 249639 | 517 | 13.10 | 1.19 | 1.35 | B | 25/110 | RGB-a |
| 263340 | — | 13.62 | 1.13 | 1.05 | B | 25/100 | RGB-a |
| 305654 | — | 13.38 | 1.29 | 1.18 | B | 40/110 | RGB-a |
| 321293 | — | 13.69 | 1.15 | 1.09 | B | 30/100 | RGB-a |
| 329557 | 447 | 12.85 | 1.35 | 1.79 | B | 30/150 | RGB-a |
| 617829 | 371 | 12.71 | 1.34 | 1.36 | A | 40/120 | RGB-MInt |
| 618774 | — | 13.22 | 1.24 | 1.22 | B | 25/90 | RGB-a |
| 618854 | — | 13.26 | 1.00 | 0.97 | A | 40/90 | RGB-MInt |
| 619210 | 211 | 12.43 | 1.37 | 1.40 | A | 30/140 | RGB-MInt |
The monodimensional spectra were extracted with the UVES pipeline (Ballester et al. 2000), which includes bias-subtraction, inter-order background light subtraction, optimal extraction with cosmic ray rejection, flat-field correction, wavelength calibration, rebinning and final merging of all overlapping orders. The spectra were then normalized to the continuum and corrected for telluric absorption bands using standard tasks within the IRAF111Image Reduction and Analysis Facility. IRAF is distributed by the National Optical Astronomy Observatories, which is operated by the association of Universities for Reasearch in Astronomy, Inc., under contract with the National Science Foundation package noao.onedspec. To this aim, a few hot stars have been chosen from the Bright Star Catalog (Hoffleit & Jaschek 1991) and observed as telluric standards at least once each night, at an airmass similar to that of the targets. All of the program stars presented here are radial velocity members of Cen.
3 Abundance analysis
| WFI | ROA | [M/H] | [Fe/H] | |||
|---|---|---|---|---|---|---|
| (1) | (2) | (3) | (4) | (5) | (6) | (7) |
| 126361 | 179 | 3900 | 0.6 | 1.8 | -1.0 | -1.34 |
| 139267 | - | 4300 | 1.4 | 1.5 | -0.6 | -0.79 |
| 140419 | - | 4200 | 1.5 | 1.4 | -0.6 | -0.68 |
| 221132 | 300 | 4000 | 0.7 | 1.7 | -0.6 | -0.90 |
| 221376 | 500 | 4100 | 1.5 | 1.2 | -0.6 | -0.52 |
| 221647 | 523 | 4200 | 1.6 | 1.4 | -0.6 | -0.65 |
| 222068 | - | 4000 | 1.1 | 1.3 | -0.6 | -0.64 |
| 222679 | - | 4200 | 1.6 | 1.3 | -0.6 | -0.53 |
| 249639 | 517 | 4100 | 1.3 | 1.2 | -0.6 | -0.53 |
| 263340 | - | 4400 | 1.9 | 1.2 | -0.6 | -0.63 |
| 305654 | - | 4200 | 1.6 | 1.4 | -0.6 | -0.65 |
| 321293 | - | 4300 | 1.6 | 1.4 | -0.6 | -0.71 |
| 329557 | 447 | 4000 | 0.9 | 1.6 | -0.6 | -0.91 |
| 617829 | 371 | 4000 | 0.8 | 1.7 | -0.6 | -0.93 |
| 618774 | - | 4200 | 1.6 | 1.5 | -0.6 | -0.64 |
| 618854 | - | 4600 | 1.2 | 1.5 | -1.0 | -1.17 |
| 619210 | 211 | 4000 | 0.7 | 2.1 | -1.0 | -1.08 |
The abundance analysis has been performed using a fairly standard spectral synthesis method, similar to the one described in Pancino et al. (2002), but with more updated software, atomic data and models (see below). Since we wanted to have all measurements in a common scale, we re-analyzed the six stars of Run A together with Runs B and C.
We selected a more extended input line list, including many lines for a set of different elements: (i) -elements like O, Mg, Si, Ca and Ti; (ii) some iron-peak elements like V, Sc, Zn, Cr, Co, Ni; (iii) some of the best studied -process elements like Yr, Zr, Ba, Ce, for a total of lines. Atomic data from these lines have been taken from the VALD222In Pancino et al. (2002) we used the NIST database instead, which has different oscillator strengths for many lines. In particular, the difference in [Ca/Fe] between Pancino et al. (2002) and here is to ascribe entirely to the choice of log gf values. Relative abundances among different stars are, of course, unchanged. (Vienna Atomic Lines Database – Kupka et al. 1999).
Equivalent Widths (EW) have been measured by gaussian fitting lines in the monodimensional spectra by means of an automatic FORTRAN routine (DAOSPEC, Stetson & Pancino, in preparation). The resulting EW are in perfect agreement with the IRAF measurements used in Pancino et al. (2002), at the level.
1 Search for the Best Model
First estimates of the effective temperature and surface gravity have been obtained from the WFI photometry, assuming (Lub 2002) and (Harris 1996), and using the color temperature calibrations of Montegriffo (1998) and Alonso et al. (1999). Estimates of the microturbulent velocity and of the model metallicity [M/H] have been derived from the color magnitude diagrams, the curves of growth of iron and previous literature abundance studies, when available.
Finally, we used the recently updated, expanded models from Plez (1997, 2000 private communication), that span a wider range in gravities, -enhancements, temperatures and metallicities, to derive abundances of Fe I and Fe II for different models for each star, with parameters close to the first estimates.
The best model has been chosen by imposing simultaneously the four following conditions: (i) excitation equilibrium, i.e. Fe lines with different must give the same abundance; (ii) lines with different EW must give the same abundance; (iii) ionization equilibrium, i.e. lines from Fe I and Fe II must give the same abundance, within the uncertainties and (iv) lines at different wavelengths should give the same abundance.
The adopted best models for the stars presented here are shown in Table 2 and have been used to measure abundances of the other elements. An accurate error estimate has not been computed yet, so in what follows we will attach a representative dex errobar to every abundance determination. To place the present results in a broader context, Table 3 compares the results for ROA 179 and ROA 371 with previous literature determinations.
| WFI | ROA | [Fe/H] | Reference | |||
|---|---|---|---|---|---|---|
| 126361 | 179 | 3900 | 0.6 | 1.8 | -1.34 | Here |
| 3850 | 0.5 | 1.5 | -1.10 | Norris & Da Costa (1995) | ||
| 3850 | 0.5 | 1.0 | -1.62 | Brown et al. (1991) | ||
| 617829 | 371 | 4000 | 0.8 | 1.7 | -0.93 | Here |
| 4000 | 0.9 | 1.6 | -0.79 | Norris & Da Costa (1995) | ||
| 4000 | 0.9 | 2.2 | -1.00 | Vanture et al. (1994) | ||
| 4000 | 0.9 | 1.5 | -0.90 | Brown et al. (1991) | ||
| 4000 | 0.9 | 2.5 | -1.37 | Paltoglou & Norris (1989) |
4 Results
The results presented here are preliminary in the sense that they concern a sub-sample of the stars observed, of the measurable lines of each species, of the available atomic species, and of the observed spectral range. A complete analysis of the dataset should thus add more information and statistics, but we do not expect it to alter significantly the abundances obtained up to now.
A first result concerns the average metallicity of the RGB-a, which turns out to be [Fe/H], perfectly compatible with what obtained by Pancino et al. (2002), with of course a lower error due to to the higher number of stars. Moreover, as expected, the detailed chemical abundance ratios of the iron-peak elements analyzed appear to be roughly solar at all [Fe/H] values, although some of them, like V and Sc, appear slightly higher than solar: a detailed spectral synthesis of each line, including hyperfine structure may lower these values (see e.g. Smith 2002).
More interesting is the situation for the -elements and the -process elements.
1 The -elements

We obtained a single [/Fe] abundance by averaging Mg, Si, Ca and Ti. While the abundance measurements of Si, Ca and Ti are quite safe since they are based on a few tens of lines each, the ones for Mg are slighly more uncertain being based on less than ten lines. For Oxygen, the situation is even more delicate since the only available lines are the forbidden [O I] lines at 6300 Å and 6363 Å, both falling inside one TiO band that is most disturbing for the coolest stars (). The Å O2 telluric band falls also in that region since the radial velocitiy of Cen stars is around km s-1. As a result, only a sub-sample of the stars anlyzed so far has reliable O abundances.
Due to these problems, we decided to exclude Oxygen from the estimate of the overall -enhancement presented in Figure 3, where our measurements are compared with the results published by Norris & Da Costa (1995) and Smith et al. (2000). The first thing to note is that, even if we did not perform a detailed star-by-star comparison, our measurements in the region [Fe/H] (the RGB-MInt) appear in reasonable agreement with the literature values.
Another interesting effect concerns the RGB-MP stars with [Fe/H], which appear to have a slightly lower -enhancement with respect to the RGB-MInt stars measured from the same authors. As recently discussed by Shetrone et al. (2003), a low and constant -enhancement, in a metallicity regime where SNe Ia did not play any rôle, indicates that any enrichment due to SNe II must have been driven preferentially by lower mass SNe II, i.e., with . A more detailed study of the single -elements, on a large sample of giants of all metallicities is thus urgently needed (see also the contribution by Verne Smith, in these proceedings).
However, the most interesting result obtained here is that the RGB-a stars have, on average, a lower enhancement with respect to the RGB-MInt ones, confirming the results of Pancino et al. (2002). Thus, if these stars formed from the -enriched ejecta of the previous generations of stars in Cen (like the RGB-MInt, for example) then the only way to lower the -enhancement would be a further enrichment by SNe Ia.
In order to firmly disentangle contributions of SNe II from SNe Ia, it is necessary to identify appropriate tracers, i.e., elements that, unlike the -elements and the iron-peak elements, are produced almost exclusively (100%) by only one type of SNe. For example, while Eu appears as a good tracer of SNe II enrichment, Cu and Mn appear as promising tracers of SNe Ia, although their effective production mechanisms are still quite debated. To derive accurate abundances of Eu, Cu and Mn, a full spectral synthesis of the line profile is required, since they possess hyperfine structure. Lines of these elements are present in our UVES spectra, so their analysis is the next urgent task.

2 The -process Elements
The next set of derived abundances concerns the -process elements Y, Zr, Ba, La, Ce and Nd, which are mainly produced in AGB stars (Busso et al. 1999). These are some of the best studied -process elements, although their measurements for red giants are often based on a handful of lines, so that even one single uncertain log gf value can produce significant variations on the final abundance. This is especially true, in the present case, for Ce and La, that could be measured only in a few stars, and anyway resulted in scattered abundance trends.
To try to compensate for these drawbacks, we averaged the four most reliable elements, Y, Zr, Ba and Nd to produce a global [/Fe] ratio. In Figure 4, our measurements are compared with literature results by Norris & Da Costa (1995), Smith et al. (2000) and Vanture et al. (2002). While the last two studies, based on more updated atomic data, appear in good agreement with our determinations, the data by Norris & Da Costa (1995) had to be shifted by dex (a value determined using the only star in common, ROA 371) to produce a satisfactory agreement. This has to be ascribed entirely to the choice of log gfs.
Figure 4 confirms what already found in the past for the RGB-MP and RGB-MInt populations: a dramatic increase of the -process overabundance is clearly seen for RGB-MP stars up to approximately [Fe/H], followed by a flattening out, or at least a break in the slope, for the RGB-MInt stars. Smith (2002) noticed that this break in slope, if true, appears exactly at the metallicity that separates the RGB-MP from the RGB-MInt.
Concerning the RGB-a, we see that it shows the same enrichment level of the RGB-MInt, i.e., ten times higher than the solar value. The likely interpretation is that the RGB-MInt and the RGB-a were similarly enriched by low mass AGB stars ejecta. This continuity of properties between the RGB-MInt and the RGB-a is somehow in contrast with the discontinous behaviour of their -enhancement.

To further investigate on the source of -process enrichment, we used an indicator of the neutron exposure, or efficiency of the -process: the ratio [/] between heavy and light -process elements. We computed these ratios by averaging Ba with Nd for the heavy component and Y with Zr for the light component. The result is shown in Figure 5, where UVES measurements are compared with literature results, as above.
The clear overabundance of heavy -sprocess elements with respect to the light ones points towards low mass (1.53 ) AGB stars as the main enriching source for Cen, through the 13C(,)16O reaction that takes place in the interpulse period (Busso et al. 1999). The RGB-a makes no exception, showing again a perfect continuity of properties with the RGB-MInt.
5 Open Problems
The literature data from Figures 3 and 4 suggest that the RGB-MP and the RGB-Mint sub-populations have been simultaneously enriched by SNe II and low mass AGB stars (see Norris & Da Costa 1995 and Smith et al. 2000). This poses a well known problem, concerning the enrichment timescales of these two contributors. In particular, the timescales of enrichment by SNe II are thought to be extremely short ( Gyr), so the hypothesis was made that Cen reached [Fe/H] in such a short time, i.e., soon after a burst of star formation. However, the lifetime of a 1.53 AGB star is of 1–3 Gyr (Castellani, Chieffi & Straniero 1990), so AGB stars took at least 1–3 Gyr to enrich stars with [Fe/H], where the break in the [/Fe] slope with [Fe/H] appears.
Concerning the RGB-a, as already said, we also have some contradictory evidence. We see a remarkable continuity of properties with the other RGB sub-populations – especially with the RGB-MInt – when we look at the enrichment in -process elements, where [/Fe] at all metallicities (Figure 4). We see instead a clearly discontinuous behaviour in the -enhancement, suggesting some additional enrichment by SNe Ia (Figure 3).
References
- [1] Ballester, P., Modigliani, A., Boitquin, O., Cristiani, S., Hanuschik, R., Kaufer, A., Wolf, S. 2000, The ESO Messenger, 101, 31
- [2] Brown, J. A., Wallerstein, G., Cunha, K., & Smith, V. V. 1991, A&A, 249, L13
- [3] Busso, M., Gallino, R. & Wasserburg, G. J. 1999, ARA&A, 37, 239
- [4] Castellani, V., Chieffi, A., & Straniero, O. 1990, ApJS, 74, 463
- [5] Ferraro, F. R., Pancino, E., & Bellazzini, M. 2002, ASP Conf. Ser. 265: Omega Centauri, A Unique Window into Astrophysics, 407
- [6] Hoffleit, D. & Jaschek, C. 1991, The Bright Star Catalog (New Haven, Conn.: Yale University Observatory, 5th rev.ed., edited by Hoffleit, D. & Jaschek, C.),
- [7] Kupka, F., Piskunov, N., Ryabchikova, T. A., Stempels, H. C., & Weiss, W. W. 1999, A&AS, 138, 119
- [8] Lub, J. 2002, ASP Conf. Ser. 265: Centauri, A Unique Window into Astrophysics, 95
- [9] Norris, J. E. & Da Costa, G. S. 1995, ApJ, 447, 680
- [10] Norris, J. E., Freeman, K. C., & Mighell, K. J. 1996, ApJ, 462, 241
- [11] Paltoglou, G. & Norris, J. E. 1989, ApJ, 336, 185
- [12] Pancino, E., Ferraro, F.R., Bellazzini, M., Piotto, G. & Zoccali M. 2000, ApJL, 534, L83
- [13] Pancino, E., Pasquini, L., Hill, V., Ferraro, F. R., & Bellazzini, M. 2002, ApJL, 568, L101
- [14] Pancino, E., 2003, PhD Thesis, Univesity of Bologna
- [15] Smith, V. V., Suntzeff, N. B., Cunha, K., Gallino, R., Busso, M., Lambert, D. L., & Straniero, O. 2000, AJ, 119, 1239
- [16] Smith, V. V. 2002, ASP Conf. Ser. 265: Omega Centauri, A Unique Window into Astrophysics, 109
- [17] Suntzeff, N. B. & Kraft, R. P. 1996, AJ, 111, 1913
- [18] Vanture, A. D., Wallerstein, G., & Brown, J. A. 1994, PASP, 106, 835
- [19] Vanture, A. D., Wallerstein, G., & Suntzeff, N. B. 2002, ApJ, 569, 984
- [20] Woolley, R. R. 1966, Royal Observatory Annals, 2, 1