X-ray Variability and Emission Process of the Radio Jet in M87
Abstract
We monitored the M87 jet with the ACIS-S detector on Chandra with 5 observations between 2002 Jan and 2002 Jul. Our goal was to determine the presence and degree of variability in morphology, intensity, and spectral parameters. We find strong variability of the core and HST-1, the knot lying 0.8′′ from the core. These observations were designed to constrain the X-ray emission process: whereas synchrotron emission would necessitate the presence of extremely high energy electrons with a halflife of a few years or less, inverse Compton emission from a relativistic jet would arise from low energy electrons with very long halflives. Currently, all indications point to a synchrotron process for the X-ray emission from the M87 jet. We give key parameters for a “modest beaming” synchrotron model.
keywords:
M87 , relativistic jets , X-ray variability1 Introduction
Although there is general agreement that X-ray emission from radio jets arises from non-thermal processes, both synchrotron emission and inverse Compton (IC) emission are indicated for different, and occasionally the same, radio features (Celotti et al. 2001, Marshall et al. 2001, Sambruna et al. 2001). Here we present strong evidence that synchrotron emission is responsible for the X-ray emission from the M87 jet and demonstrate a reasonable combination of source parameters for HST-1, the jet feature lying 0.8′′ from the nucleus.
We take the distance to M87 to be 16 Mpc so that one arcsec = 77pc. We use the normal convention for spectral index: flux density, S .
2 Data Processing and Results
We used a 1/8th subarray on the back illuminated ACIS-S3 chip with 0.4s readout to mitigate pileup; the same configuration used for a 12ks archival observation of 2000Jul. A ’standard’ reduction system, based on the CIAO threads, was developed to ensure that each dataset was processed identically. We believe that the key to reliable photometry for closely spaced features is to remove the pixel randomization and re-grid to 1/10th pixel. This process recovers the true resolution of the Chandra Observatory. The event files were then binned and filtered into three energy bands: soft = 0.2-0.75keV; medium = 0.75-2 keV; and hard = 2-6 keV. The bands were chosen to minimize the change in effective area across each band, although this was not possible for the soft band. We then created corresponding exposure maps and divided the images by these to obtain flux maps. By testing on a fixed area of hot cluster gas, we recovered the quantum efficiency (QE) degradation of the ACIS CCD. Multiplying each band map by h of the mean energy plus the correction factor for QE, we obtained flux maps comparable to the 2000 observation.
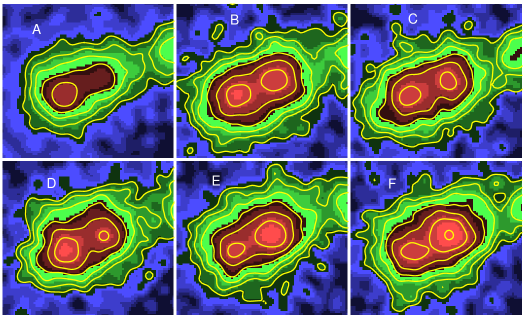
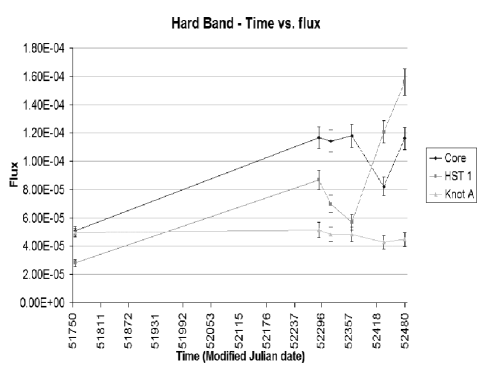
The basic results for the core and HST-1 are shown in fig. 1 and strong intensity variability can be seen. Using small circular apertures for the core, knot A, and HST-1, we obtained the relative fluxes shown in figure 2. HST-1 increased by a factor of two in the last 116 days covered by our observations. The light travel time for this interval is 0.1pc which may be compared with our inherent resolution of order 0.3′′ or 23pc at the distance of M87.
3 HST-1
We take our variability data of HST-1 to support the synchrotron emission model since when the flux is decreasing, there is a larger percentage drop in the hard band than in the medium or soft bands, and the flux decrease is consistent with halflives of order a year rather than a value of order 10,000 years corresponding to the low energy electrons which would produce inverse Compton (IC) X-rays.
We used a single power law to fit the optical (Perlman et al. 2001) and X-ray flux densities of HST-1 from Hz to Hz with = 0.68. With this spectrum, we then derived synchrotron parameters based on the usual equipartition assumptions (Pacholczyk, 1970) for two alternative source sizes: r=0.3′′ and a radius corresponding to the light travel time of 116 days. For each choice, we examined parameters for beaming factors, ranging from 1 to 16. For those parameters requiring a value of the bulk relativistic velocity, we assumed .
The detailed results of these models will be given in Harris et al. (2003), but here we summarize the results by noting that for the large source size of 0.3′′, values of the halflife, , for the highest energy electrons are greater than a year for all values of 16. Since large ’s require very small angles of the jet axis to the line of sight (l.o.s.), the data support the smaller diameter alternatives.
For models with the source size given by the light travel time, small values of have values of too small to match our data and large values of predict significantly larger than a year. The parameters that best fit the data are provided by = 4. For this model, the characteristic angle to the l.o.s. is 14∘, consistent with canonical values from radio considerations; a magnetic field strength of 1 mG; and a total energy requirement (field plus particles) of 1048 ergs. In the jet frame, the time required to double the intensity (and thus double the total energy reservoir) is s, which translates into a very modest ’drain’ on jet power of erg s-1 The photon energy density in the jet frame is dominated by the synchrotron spectrum, but is of order 5% of the magnetic field energy density.
Since synchrotron self-Compton models under predict the observed X-ray emission by a large factor and IC/CMB models require unreasonable values of and angles to the l.o.s. (Harris & Krawczynski, 2002), the “modest beaming” synchrotron model appears to be the model of choice.
Colleagues for this project are J. Biretta, W. Junor, E. Perlman, W. Sparks, & A. Wilson; they will be co-authors of a longer paper (Harris et al., 2003). We thank O. Stohlman for assistance in the data reduction. This work was supported by NASA contract NAS8-39073 and grant GO2-3144X.
References
- (1) Celotti, A., Ghisellini, G., & Chiaberge, M. 2001 MNRAS 321, L1
- (2) Harris, D. E., Biretta, J. A., Junor, W., Perlman, E. S., Sparks, W., and Wilson, A. S. 2003, ApJL (in press); http://xxx.lanl.gov/abs/astro-ph/0302270
- (3) Harris, D. E. and Krawczynski, H. 2002, ApJ 565, 244-255
- (4) Marshall, H. et al. 2001 ApJ 549, L167
- (5) Pacholczyk, A.G. 1970, “Radio Astrophysics” W. H. Freeeman , San Franciso.
- (6) Perlman, E. S., Biretta, J. A., Sparks, W. B., Macchetto, F. D., and Leahy, J. P. 2001, ApJ 551, 206
- (7) Sambruna, R.M., Urry, C.M. Tavecchio, F., Maraschi, L., Scarpa, R., Chartas, G., & Muxlow, T. 2001 ApJ 549, L161
- (8)
- (9)