A. Vallenari,
The field population towards the globular cluster NGC 6553
Abstract
We analyze the colour magnitude diagram of the field population in the direction of the bulge cluster NGC 6553 to discuss the stellar field component projected towards the cluster. In particular we investigate the nature of a peculiar feature, called “red flare” which appears as a faint turnoff, located 2 magnitudes about below the turnoff of the cluster, with a sparse trace of a sub-giant branch just above. A detailed modeling shows that the red flare is consistent with the expected location of the turnoff and sub-giant branch of the bulge population, once that the appropriate metallicity range and spatial distribution of the bulge stars are adopted. From the data, hints can be derived about the spatial shape and the basic stellar parameters of the bulge.
keywords:
Galaxy:structure – Galaxy:stellar content – Galaxy:the bulge1 Introduction
The structure of the Galactic Bulge and the nature of its stellar population have been controversial problems in the last decade. Most of the current knowledge is based on models derived from low resolution, photometric infrared observations. The data interpretation requires some hypotheses on the distribution of the dust and some assumption on the disk/bulge separation. Efforts have been as well devoted to the interpretation of field color-magnitude diagrams (CMDs) projected in the direction of the inner bulge along the minor and the major bulge axis. These diagrams appear quite complex, with a number of unexpected features. Recently Feltzing & Gilmore ([2000]) and Beaulieu et al. ([2001]) published HST CMDs of the globular cluster NGC 6553, projected at galactic coordinates and . In their diagrams they detect a peculiar feature called “red flare”. This feature appears as a faint turnoff, located 2 magnitudes about below the turnoff of the cluster, with a sparse trace of a sub-giant branch just above. The two papers leave the problem open, suggesting different interpretations. Feltzing & Gilmore ([2000]) suggest a possible contamination by the background Sagittarius galaxy. Beaulieu et al. ([2001]) seem more inclined to a bulge background turnoff. They fail to reproduce that turnoff with an isochrone of the same [Fe/H] content than the cluster, namely [Fe/H] concluding than the mean bulge population must be more metal poor. Both the interpretations, however, have to face some difficulties: the Sagittarius galaxy hypothesis implies a wide contamination, not present in the other fields, while the “more metal poor” bulge field one is based on data where cluster and field stars are mixed together, preventing any firm conclusion. In addition Beaulieu et al. ([2001]) reproduce the bulge with a single metallicity stellar population located at 8 Kpc distance from the Sun, while recent papers based on high resolution spectroscopy suggest a wide range of [Fe/H], from to 0.55 with a mean value of (Rich & McWilliam [2000]). As far as the cluster is concerned, the most recent literature determinations, based on high resolution spectroscopy, give [Fe/H] or (Barbuy [2000]), and [Fe/H] or (Cohen et al. [1999]) revised upward to [Fe/H] or by Carretta et al. ([2001]) with evidence of an excess of process elements. From these results Cohen et al. ([1999]) and Carretta et al. ([2001]) conclude that the value of [Fe/H] for NGC 6553 is comparable to the mean of the Galactic Bulge. This implies that there is no strong evidence in the recent literature supporting an higher metallicity of the cluster in comparison to the field. For this reason we decide to proceed to a deeper investigation aimed to detect the true nature of this feature using the galactic models developed in Padova (Vallenari et al. [2000]) and the most recent CMDs of NGC 6553 published by Zoccali et al. ([2001]) , where relative proper motions are provided. This allow us to discard cluster objects from field stars. The goal is to discuss whether an appropriate admixture of bulge and disk stars can be responsible of this red flare.
In Section 2 the Galaxy model is presented, in Section 3 the observed and simulated CMDs are shown and the resulting shapes of the bulge are discussed. Finally the conclusions are drawn in Section 4.
2 Modeling the Galaxy
The simulation of the Galaxy is done with the code already described by Bertelli et al. ([1995]) and revised by Vallenari et al. ([2000]). The generation of the synthetic population makes use of the set of stellar tracks by Salasnich et al. ([2000]) for isochrones with enhanced abundances. We adopt for the old disk population an age of 10 Gyr while the youngest population is reaching an age of 2 Gyr.
Evidence have been advanced in literature that the bulge might not have spherical symmetry. Several models have been proposed, going from spherical to triaxial symmetry. In our galaxy model the following choices are included:
1) COBE-DIRBE oblate spheroidal model (Dwek et al. [1995], their model G0). It is a Gaussian type function, with axial ratios 1:1:0.56, similar to the values derived on the basis of the near infrared maps by Kent et al. ([1991]).
2) COBE-DIRBE constrained triaxial model by Kent et al. ([1991]) as modified by Dwek et al. ([1995]) (their model G2). It is a “boxy” Gaussian models, with axial ratios 1:0.22:0.16.
3) the triaxial model introduced by Binney et al. ([1997]) to fit COBE-DIRBE data with the best fitting parameters by Bissantz et al. ([1997]) (thereafter B0). The axial ratios are 1:0.6:0.4.
4) an exponential triaxial function (Dwek et al. [1995] model E2) based on the distribution of the IRAS Mira variable. The axial ratios are 1:0.18:0.39. This model is suggested by Dwek et al. ([1995]) as giving one of the most reliable fit to the COBE-DIRBE observations.
3 The red flare population in the field of NGC 6553
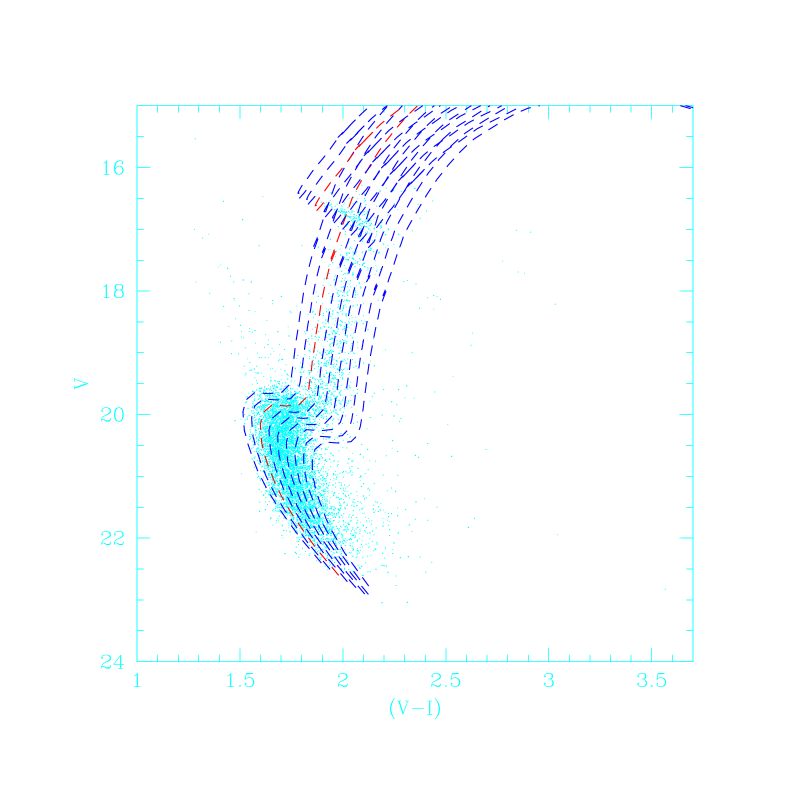
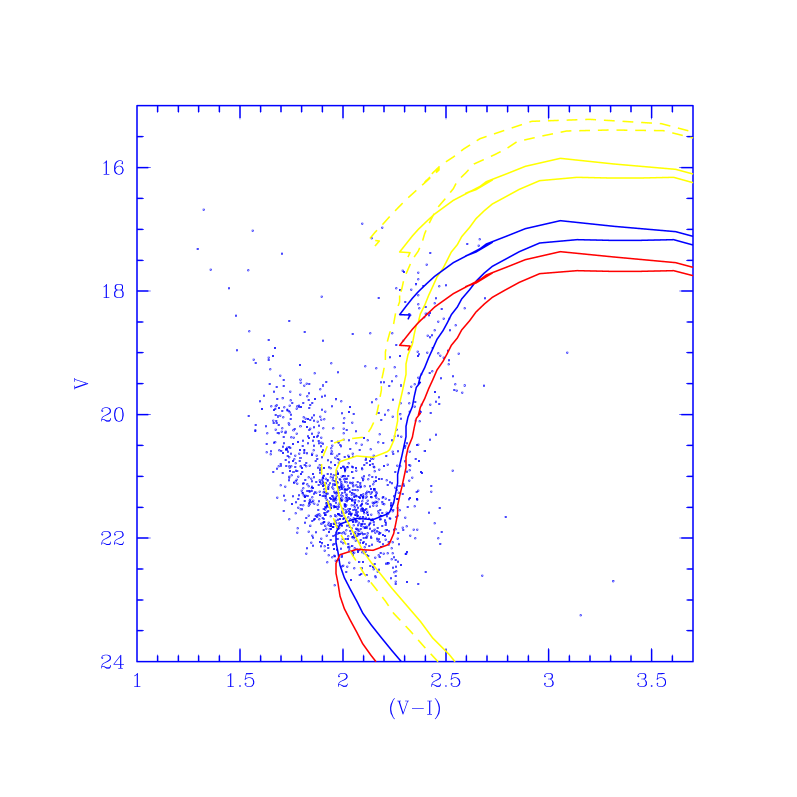
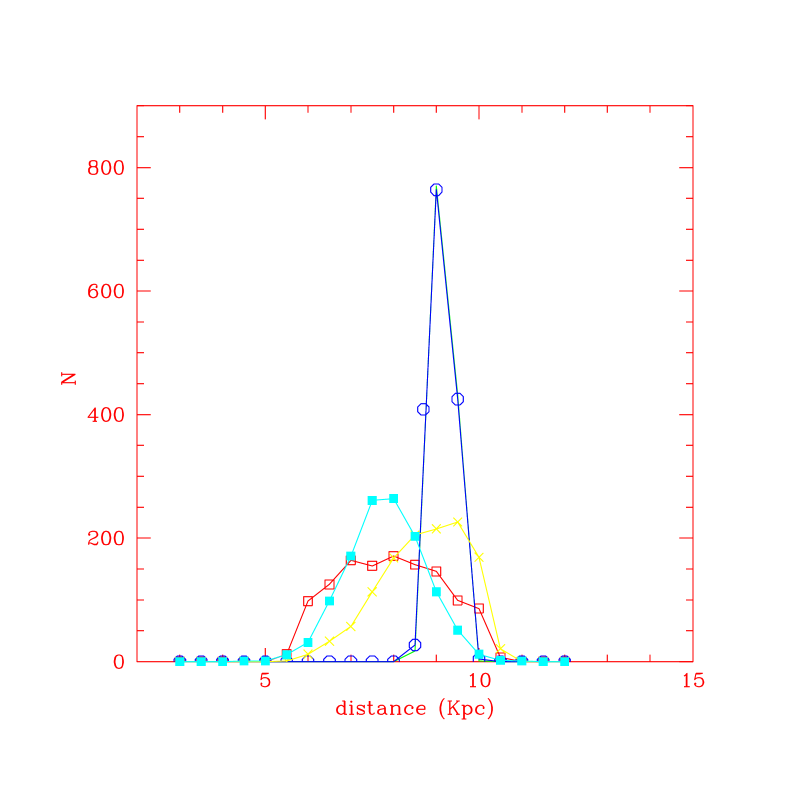
The first step towards the interpretation of the data is the separation of the field from the cluster stars. Zoccali et al. ([2001]) compare images of NGC 6553 taken at different epochs in order to derive star proper motions. As expected, these authors find that the cluster and the field populations follow two different distributions of relative proper motions and can consequently be disentangled. Cluster objects are distributed by construction in a Gaussian centered on relative proper motion in and while field population is clustered around pixels. Following the analysis by Zoccali et al. ([2001]), in their CMD of the region around NGC 6553 (see Fig.1) we select stars having (corresponding to a proper motion of mas yr-1 of the cluster with respect to the field objects). Those stars are believed to sample the foreground and background population. Consequently, the field population is disentangled from the cluster objects. The corresponding CMD is presented in Fig.2. About 1200 stars are selected in the field. In particular the red flare is brought into evidence. Since NGC 6553 is located in the direction of the Galactic bulge, the most obvious hypothesis is that this population is simply due to a superposition along the line of sight of mainly bulge stars with a residual disk contamination. The stars redder than would then be sub-giant and clump objects of disk and bulge. In order to reproduce the red flare under this hypothesis, it is necessary to remember that a single isochrone at a fixed distance of 8 Kpc is not an appropriate representation of the bulge population. In fact the bulge is an admixture of objects of various metallicity, and has a spatial distribution as discussed in previous Sections. Fig. 3 presents the predicted distributions of the bulge stars with the distance from the Sun in the line of sight of NGC 6553 at varying bulge models. The vast majority of the models presented in literature expect bulge stars to be located at a distance from 5 to 11 Kpc from the Sun. Fig. 2 where isochrones are superposed on red flare data shows how populations of various metallicity placed at different distance from the Sun can reproduce the location and the colour of the sub-giant branch and clump.
A Galactic disk component is needed to reproduce the main sequence region bluer than and roughly brighter than mag, as far as the appropriate reddening is adopted (see the following Section). The evolved stars of this disk population are located in the same CMD region of the sub-giant branch and clump stars of the bulge.
3.1 Extinction determination
It has been proved (Vallenari et al. [2000]) that the blue edge of the main sequence in the CMD of the disk and bulge population can be interpreted in terms of extinction along the line of sight. Comparing the observed main sequence edge location with theoretical simulations at varying extinction, we derive the values of along the line of sight as a function of the heliocentric distance (see Fig.2). Using this method, we find that at the distance of 5 Kpc from the Sun the absorption is mag. This value is larger than obtained by Zoccali et al. ([2001]) from the fit of the cluster NGC 6553, located at 5.3 Kpc from us. However, these authors claim they analyze a low reddening region inside the cluster. In fact, differential reddening is present in the field. This is evident from Fig.1 where cluster data of the whole field obtained by Zoccali et al. ([2001]) are plotted together with isochrones at varying extinction. If the width of the cluster sub-giant branch is mainly due to differential reddening, the data are consistent with ranging from 2.1 to 2.7. This result is in substantial agreement with the analysis made by Sagar et al. ([1999]), Guarnieri et al. ([1997]), Beaulieu et al. ([2001]) who find a differential reddening of about 0.5 mag inside the field. As far as the foreground and background population of Fig.2 is concerned, the main contribution to the absorption is due to the disk interstellar gas and dust at distances closer than 5-6 Kpc. In fact, to reproduce the colour of the main sequence field population at higher distances, an additional extinction of 0.1 is required leading to a final value of .
3.2 The results
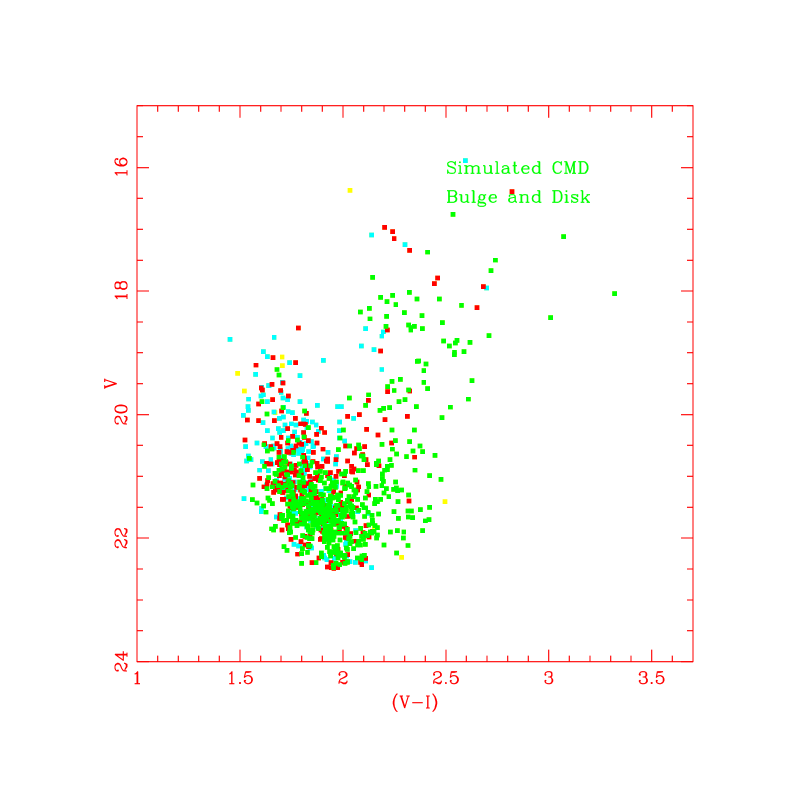
Using the model described in Section 2 including thin disk and bulge we reproduce the CMD of Fig.2. The result of the simulation is shown in Fig.4. It is quite obvious looking at Fig.3 that different spatial distributions of the stars in the bulge can predict different turnoff magnitudes. The termination point magnitude changes at maximum of 0.3-0.4 mag because of this effect. A detailed discussion can be found in Vallenari et al. ([1999]). Here we recall that “rounder” distributions (model G0 or B0) result in brighter magnitudes (), while flat distributions having large position angle (model E2) produce fainter turnoff (). The luminosity function of the disk population reaches a maximum at mag corresponding to a distance from us of about 7 kpc. Because of the combined effect of disk and bulge population, to compare observational and simulated CMDs is then not trivial. We make use of a test (see Vallenari et al. [2000] for more detail on the adopted procedure). is defined as where and are the observed and the expected number of stars per magnitude bin, and is the number of degrees of freedom (which is equal to the number of bins minus 1, since the in the simulations we impose that the total number of model stars is equal to the observed total number of stars). In consequence of this definition, high probability models have . Due to the poor statistics, all the models, but the model E2 are in good agreement with the data, resulting in a . Although it is difficult to reach a firm conclusion, models B0 and G0 seem to result in a more convincing agreement with the data, model G2 is not in disagreement, while the model E2 is definitely less probable (). As a final comment on the adopted bulge population, we point out that while the metallicity and distance spread are fundamental to reproduce the observational width of the sub-giant branch, the age range is poorly constrained by the data, due to the poor statistics. This analysis strongly points in favor of the fact that the red flare is simply due to the bulge and disk populations. From our simulations, we estimate that the disk contributes at maximum for the 30% to the red sub-giant branch and clump population.
4 Conclusions
Using simulations derived from models of the Galaxy and the recent HST CMDs of NGC 6553 and its projected field, we are able to reproduce the bulge and disk field contributions and the so-called “red flare” discussed in Feltzing & Gilmore ([2000]) and Beaulieu et al. ([2001]). This feature turns out to be a natural consequence of bulge and disk field contamination. The spread in distance and metallicity is fundamental to reproduce the observational CMD of the field. The bulge is modeled using an age from 10 to 12 Gyr and a metallicity ranging between and . The cluster is fitted with an isochrone of which is inside the metallicity range of the bulge field. We recall however that while constraints set on metallicity are stringent, the age range is poorly determined, due to the limited statistics.
References
- [1999] Barbuy, B., Renzini, A., Ortolani, S., Bica, E., & Guarnieri, M. D. 1999, A&A, 341, 539
- [2000] Barbuy, B, in From Extrasolar Planets to Cosmology: The VLT Opening Symposium, 2000 eds J. Bergeron & A. Renzini, Springer-Verlag, p. 357.
- [2001] Beaulieu S.F., Gilmore G., Elson R.A.W.,Johnson R., Santiago B., Sigurdsson S., Tanvir N. ApJ, 121,2618, 2001
- [1995] Bertelli G., Bressan A., Chiosi C., Ng Y.K., Ortolani S. 1995, A&A, 301, 381
- [1997] Bissantz, N; Englmaier, P; Binney, J; Gerhard, O., 1997, MNRAS, 289, 651
- [1997] Binney, J., Gerhard, O., Spergel, D., 1997, MNRAS, 288, 365
- [2001] Carretta E., Cohen, J.C., Gratton R.G., Behr, B.B., 2001, AJ, submitted (astro-ph0102014)
- [1999] Cohen, J. G.; Gratton, R. G.; Behr, B. B.; Carretta, E., 1999 , ApJ, 523, 739
- [1995] Dwek, E.; Arendt, R. G.; Hauser, M. G.; Kelsall, T.; Lisse, C. M.; Moseley, S. H.; Silverberg, R. F.; Sodroski, T. J.; Weiland, J. L., 1995, ApJ, 445, 716
- [2000] Feltzing S., Gilmore G., 2000, A&A, 355, 949
- [1997] Guarnieri, M. D., Renzini, A., Ortolani, S., 1997, ApJ, 477, L21
- [1991] Kent, S. M., Dame, T. M.; Fazio, G., 1991, ApJ, 378, 131
- [2000] Rich M. R., McWilliam A., 2000 , Proc. SPIE, Discoveries and Research Prospects from 8- to 10-Meter-Class Telescopes, J. Bergeron Ed., Vol 4005, p. 150-161
- [1999] Sagar, R., Subramaniam, A., Richtler R., Grebel E.K., 1999, A&A, 135, 391
- [2000] Salasnich B., Girardi L., Weiss A., Chiosi C., 2000, A&A, 361, 1023.
- [1999] Vallenari, A.; Bertelli, G.; Bressan, A.; Chiosi, C., 1999, BaltA, 8, 159
- [2000] Vallenari A., Bertelli G., Schmidtobreick L., 2000, A&A, 361, 73
- [2001] Zoccali, M.; Renzini, A.; Ortolani, S.; Bica, E.; Barbuy, B., 2001, AJ, 121, 2638