Photometric properties of Stellar Populations in GGCs: a multi-wavelength approach
Abstract
Globular star clusters are extremely important astrophysical objects since (1) they are prime laboratories for testing stellar evolution; (2) they are “fossils” from the epoch of galaxy formation, and thus important cosmological tools; (3) they serve as test particles for studying the dynamics of the Galaxy; (4) information on individual stars can provide constrains for stellar dynamic models; (5) they are the largest aggregates in which all post Main Sequence (MS) stars can be individually observed, and thus serve as fiducial templates for all the studies of the integrated light from distant stellar systems. In the framework of a long-term project devoted to a multi-band study of stellar populations in Galactic Globular Clusters I present a set of recent results of a systematic study of (1) the Red Giant Branch in the near-IR (J,K) and in the optical bands; (2) the Horizontal Branch and Blue Stragglers stars from mid- and far-UV observations obtained with HST.
Osservatorio Astronomico di Bologna, via Ranzani 1, 40127 Bologna, Italy
1. Introduction
Stellar evolution theory is crucial to yield a reliable clock for dating astrophysical objects. Suitable Color Magnitude Diagrams (CMDs) and Luminosity Functions (LFs) are the most powerful tools to test theoretical models and, in turn, the running of the stellar clock. Within this framework, our group started a long–term project devoted to the quantitative analysis and testing of each individual evolutionary sequence in the CMDs of Galactic Globular Clusters (GGCs) in the most appropriate photometric bands (from the near-IR to the far UV). The most recent results obtained are presented and discussed in this review. In particular, I present results of a systematic study of (i) the Red Giant Branch (RGB) in the near-IR (J,K) and in the optical bands; (ii) the Horizontal Branch (HB), Blue Stragglers stars (BSS) and some UV-excess stars (UVE) from mid- and far-UV observations obtained with the Hubble Space Telescope.
2. Cool Stellar Populations in GGCs
The main aim of this part of the project is to obtain a complete quantitative description of the RGB as a function of the intrinsic cluster parameters, and to yield a few observational relationships for general use and suitable to carefully test the theoretical models. The full set of results were published in two recent papers: Ferraro et al 1999 (F99) and Ferraro et al 2000a (F00).
2.1. The Optical catalog
As a first step, we reviewed the papers on CMDs for GGCs published over the last ten years, in order to select populous and high quality CMDs. As a result, a catalog including the most recent CMDs for a sample of 61 GGCs has been presented in F99. We used this data-base to perform an homogeneous systematic analysis of the evolved sequences (namely, RGB, HB and AGB). In F99, we presented: (1) a new methodology to derive the actual level of the Zero Age Horizontal Branch (ZAHB) and the distance moduli from the matching of V(ZAHB) and the theoretical models computed by Straniero, Chieffi & Limongi (1997, hereafter SCL97); (2) an independent estimate for RGB metallicity indicators and new calibrations of these parameters in terms of both spectroscopic () and global metallicity (, including also the elements enhancement). In particular, we adopted the metallicity scale presented by CG97 based on high quality measurements of iron abundances using high dispersion spectra of and lines. However, in order to perform a correct parametrization of the RGB behavior as a function of metallicity, the simple knowledge of the quantity usually called iron abundance is not sufficient. since the RGB location mainly depends on the [Mg+Si+Fe] mixture abundance rather than on the [Fe] abundance alone. Therefore, a more reliable parameter to describe the actual metal content of the RGB stars is the so–called global metallicity, which takes into account not only the iron but also the –element (like Mg and Si) abundance. In doing this, we adopted the relation proposed by Salaris, Chieffi & Straniero (1993).
In F99 we presented a complete set of equations which can be used to simultaneously derive a photometric estimate of the metal abundance and the reddening from the morphology and the location of the RGB in the -CMD. Moreover, we were able to determine the location of the RGB-Bump and the AGB-Bump in a number of GGCs. In the following subsection I breafly summarize the results we got for these two peculiar evolutive features along the Giant Branches.
The RGB-Bump –The RGB evolution is characterized by a narrow burning hydrogen shell which is moving towards the outer region of the star. The shell is quite thin in mass and a temporary drop in luminosity is expected when it reaches the discontinuity in the hydrogen distribution profile generated by the inner penetration of the convective envelope. This interruption in the expansion of the stellar envelope has its signature in the differential LF star excess, the so–called bump.
Since the early work presented in Fusi Pecci et al 1990 (F90), the RGB-Bump has been identified in a growing number of GGCs (see for example Brocato et al. 1996). As pointed out by F90, the best tool to identify the RGB-bump is the Luminosity Function (LF), and both the integrated and the differential LFs are useful (Ferraro 1992). Following the prescriptions of F90 we independently identified the RGB-bump in 47 GGCs. This is the largest GGCs sample listing the RGB-bump locations available so far.
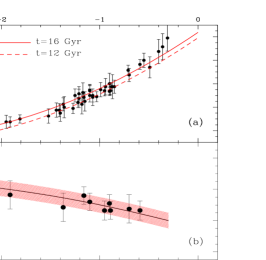
To allow comparisons with theoretical models, following F90, we have measured the parameter: , which has the advantage of being actually independent of the photometric zero-point of the cluster data, the reddening, and the distance modulus. In Figure 1(a) we compare the observed values of the parameter with the latest theoretical predictions (SCL97) as a function of the global metallicity . As a result, we found that by using the latest theoretical models and the new metallicity scales the discrepancy between theory and observations ( mag) found by F90, completely disappears.
The AGB-Bump – According to the evolutionary models (Castellani, Chieffi & Pulone, 1991), the beginning of the AGB is characterized by a rapid increase of the luminosity followed by a slowing down in the evolutionary rate. Then, from an observational point of view, a well defined clump of stars is expected to indicate the base of the AGB.
The models suggest (Castellani, Chieffi & Pulone 1991, Pulone 1992) a luminosity level of the AGB-clump of , almost independent of the chemical composition of the cluster stars (both and ), so that this (quite bright) feature could be a very promising “standard candle”. However, we note that the theoretical calibration of the AGB clump location is affected by the uncertainties in the actual extension of the convective core of an He burning low mass stars. On the other hand, as pointed out by Caputo et al. (1989) one might use the observed differences between the HB luminosity level and that of the AGB-clump (i.e. ) to constrain the convection theory (see Dorman & Rood 1993).
Unfortunately, the identification of such a clump is not easy since the AGB phase itself is very short ( yr) and, in turn, always poorly populated. There are a few identifications of the AGB-clump in the literature: Ferraro (1992) reported a preliminary identification of this feature in a few GGCs. Then, to initiate a systematic study of the properties of the AGB-clump, in F99 we have identified such a feature in 9 GGCs whose CMDs show a significant clump of stars in the AGB region.

In Figure 1(b), we compare the theoretical and observed values of the parameter. The shaded region represents the quoted uncertainty () in the absolute location of the AGB clump. Despite the quite large error bar affecting most of the (few) available measurements of the AGB-clump, the level of the agreement with the theoretical prediction is remarkable. Such a result, especially combined with that obtained for the RGB-bump location, is comforting about the reliability and the internal consistency of the adopted theoretical prescriptions.
2.2. IR Observations
The advantage of observing GGCs in the near IR is well known since many years. The contrast between the red giants and the unresolved background population in the IR bands is greater than in any optical region, so they can be observed with the highest S/N ratio also in the innermost region of the cluster. Moreover, when combined with optical observations, IR magnitudes provide useful observables such as for example the V–K color, which is an excellent indicator of the stellar effective temperature (Te) and allows a direct comparison with theoretical models predictions.
In F00 we presented a new set of high quality IR Color Magnitude Diagrams for a sample of 10 GGCs, spanning a wide range in metallicity. This new, homogeneous data–base has been used to determine a variety of observables quantitatively describing the main properties of the Red Giant Branch, namely: (a) the location of the RGB in the CMD (both in (J–K)0 and (V–K)0 colors at different absolute K magnitudes (–3, –4, –5, –5.5) and in temperature); (b) its overall morphology and slope; (c) the luminosity of the Bump and the Tip. All these quantities have been measured via a homogeneous procedure applied to each individual CMD. Their behavior as a function of the cluster global metallicity has been investigated.
In doing this we used the distance moduli scale defined in F99 to locate the observed RGB fiducial ridge lines in the absolute MK,(J–K)0 and MK,(V–K)0 planes. The result is plotted in Fig.2. The dashed lines in the figure represent the magnitude levels and the colours at which some of the parameters defined in F00 are measured. The full discussion of these morphologic parameters and slopes and their dependance from the metallicity can be found in F00, here I will only show the results we got for the RGB-Bump and the RGB-Tip (TRGB).
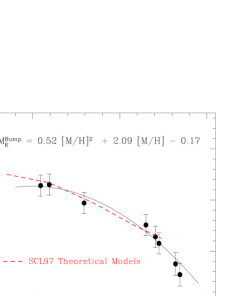
The RGB-bump – In Fig.3 the absolute K magnitude of the RGB-bump as a function of the cluster global metallicity is plotted. The dashed line in Figure 3 represents the theoretical expectations based on the SCL97 models, for an age of Gyr (Straniero 1999, private comunication). As can be seen, the models show an excellent agreement with the observational data. This result fully confirms the finding of F99 (from the location of the RGB bump in 47 GGCs in the visual band - see Fig. 1a) that the earlier discrepancy between theory and observations (mag) (cf. F90, Ferraro 1992) has been completely removed using the latest theoretical models and the global metallicity ().
In order to allow a direct comparison (and calibration) of the theoretical models we transformed the fiducial lines plotted in Figure 2 in the absolute -plane by using the bolometric corrections and temperature scales for Population II giants computed and adopted by Montegriffo et al. (1998) (cf. their Table 2). In Fig. 2 (panel (c)) the fiducial RGB ridge lines for the 10 GGCs in the F00 sample are plotted in the MBol vs Te theoretical plane.
The RGB tip – A quite well defined relationship between the bolometric luminosity of the brightest RGB star in a GGC and its metallicity has been found by Frogel, Persson & Cohen (1981) and Frogel, Cohen & Persson (1983, FCP83). This finding had a noteworthy impact both on testing the theoretical models and on the use of the brightest TGB stars as possible distance indicators.
In order to derive a similar relation using our sample of GGCs, we identified the candidate brightest giant in each cluster, paying particular care in the decontamination of possible field objects and (especially in the case of metal–rich clusters) of bright AGB stars and the variables commonly associated to the AGB, the so–called Long Period Variables (LPV). Of course, the degree of reliability of the decontamination is hard to quantify due to the very small number of stars populating the brightest extreme of the giant branch, possibly affected by severe statistical fluctuations.
Fig.4 reports the bolometric magnitude of the adopted brightest star (the observed RGB tip) for 9 of the 10 clusters considered in F00 (M4 was excluded since the number of sampled giants is too low).

As can be seen, our result is fully consistent with FPC83 (plotted as dashed line in Figure 4), and with theoretical models. Two theoretical relations have been over–plotted in Fig.4: Caloi et al. (1997) (dotted line) and Salaris & Cassisi (1997, hereafter SC97) (solid line), respectively. Indeed, the theoretical prediction nicely agrees with the observations and, though residual contamination and statistical fluctuations could still affect the sample, the success of the theory in reproducing the data seems quite rewarding. It may also be interesting to note that such an agreement indirectly implies that the adopted distances and reddening should not be affected by large errors. It is important to remind here that the theoretical relationships have to be considered indeed as upper limits to the luminosity of the observed giants, because of the statistical fluctuations affecting these poor samples (Castellani, Degl’Innocenti & Luridana, 1993).
2.3. The Global Test: the LF of M3
One of the classical tests of stellar evolutionary calculations is through the comparison of theoretical and observed stellar LFs. The LF for the stars below the main sequence turn-off (MSTO) can be related to the stellar initial mass function and be used as a probe of stellar dynamics within a cluster. The LF of stars after the MSTO depends primarily on the rate of evolution and provides a direct and straight-forward test of evolutionary calculations. Features in the observed LF can be related to interior structure, as for example the RGB-Bump (see Section 2.1). Beside the bump, more subtle observables are also present: the slope of the LF below and above the LF bump are different because the H-burning shell is in the first case passing through a region of varying H abundance and later through a region of constant H (F90,F99,F00). In particular, a breakdown in canonical stellar evolution theory (Renzini & Fusi Pecci, 1988) can affect the LF in the region of the subgiant branch (SGB). Some preliminary evidences of the existence of a breakdown in the canonical models for very low metallicity clusters was showed by Stetson (1991) and Bolte (1994) and recently confirmed for M30 (Sandquist et al. 1999). This region could be affected by non-canonical assumptions like WIMP energy transport (Faulkner & Swenson 1993), and helium settling (SCL97), both of which could reduce cluster age estimates. If large enough, also stellar rotation could affect the region of the LF (VandenBerg, Larsen, & de Propris 1998).
In this scenario, a few years ago, we started an ambitious project aimed to a new global approach to the test of theoretical sequences: the immediate objective of this project was the construction of a new generation of LFs for a selected sample of GGCs, in which all post–MS stars at all radii have been measured. The validity of this approach is shown by our work in the GGC M3. In this intermediate-metallicity cluster, we have constructed (by using a combination of ground-based and HST observations) the most complete CMD ever obtained in a GGC.
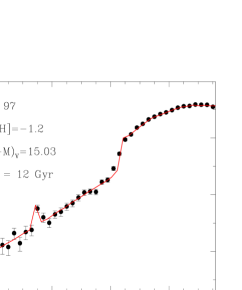
The data-base for this cluster was collected during the last decades (Buonanno et al 1994, Ferraro et al 1993, 1997a, 1997c) and the global LF constructed over this huge database was finally recently published in Rood et al (1999). The differential LF for the global sample is shown in Figure 5. Even though it extends only 2 mag below the turnoff, this LF, including more than 50,000 stars, is the most populated LF ever published for a GGC. The solid line in the figure represent the SCL97 theoretical models for , and . As shown in the Figure, the theoretical and observed LFs agree well in the SGB region and lower-RGB. Indeed the fit is essentially perfect: basically, there is no indication for a breakdown in the canonical models.
3. Hot Stellar Populations in GGCs
As discussed in previous Sections, the CMD of a GGC in the classical -plane is dominated by the cool stellar component. However, relatively populous hot stellar components do exist in GGCs and are significant emitters in the UV, namely: (i) the hot post AGB (PAGB) stars, (ii) the blue part of the HB, (iii) the BSS and, (iv) various by-products of binary system evolution, such as interacting binaries (IB), for example Cataclysmic Variables (CVs), Low Mass X-ray Sources (LMXB), etc. Some of these sources (such as CVs, WDs, BSS, X-ray sources, binaries, as well as the complete luminosity function of the HBs) look hopelessly faint in the classical plane and for this reason remained unobserved until the advent of the Hubble Space Telescope, whose space resolution and imaging/spectroscopic capabilities in the UV gave a new impulse to these studies.
As a part of the global multi-band approach to the study of the stellar population in GGCs we are involved in a long-term observational programme which uses the Hubble Space Telescope to perform UV observations for a selected sample of GGCs. In this section I summarize the most recent results about the UV populations (namely, HB, BSS, and faint UV sources). The advantages of studying hot populations in the UV can be easily deduced from the comparison of the two panels in Figure 1 of Ferraro, Cacciari & Paltrinieri (1999).
3.1. Gaps Along the HB: UV CMD to Proof Their Reality
Besides the global HB morphology difference between clusters at the same metallicity, another peculiarity was noted since the first CMDs of NGC 6752 (Cannon, 1981): the discontinuous stellar distribution along the branch. The blue extension of the HB is, in fact, often interruped by underpopulated regions or gaps.
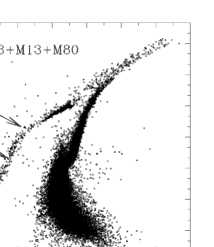
The most recent evidence has been found in NGC 2808 (Sosin et al. 1997), M13 (Ferraro et al 1997b) and M80 (Ferraro et al 1998). In particular, the comparison of the CMDs of M13 and M80 showed that the HB in this two clusters do have similar characteristics: (1) the very long blue tail extending mag (2) the non-uniform stellar distribution, with at least 4 groups of stars separated by gaps.
To get a better impression of the similarities in the overall HB morphology we aligned the CMDs in the plane, shifting the CMDs to match the M13 principal sequences and then co-adding the result. We included also M3 in the comparison. Figure 6 shows the combined CMD, in which more than 50,000 stars have been plotted. As can be seen from the small scatter along the RGB and HB the sequences match well, showing the high degree of similarity of the main branches in the CMD for these clusters: the HB of M3 nicely matches the reddest part of the HB in M13 and M80. Moreover, the HB multi-group distribution is still (perhaps more obviously) present. This is the cleanest demonstration that the gaps observed along the HB are indeed real, since they have been observed at the same location in different GGCs.
A preliminary comparison with the theoretical models (Dorman et al. 1995) and with other clusters (see Table 2 in Ferraro et al 1998) suggests that:
(a) all the clusters with extreme long blue tail have a gap on the lower blue tail at . It is present in at least 6 clusters (M13, M80, NGC 6752, NGC 2808, Cen);
(b) others gaps occur in many but not all clusters: the gap at is present in 5 clusters (M13, M80, NGC6681, M79, M15), the gap at is present in 3 clusters (M13, M80, NGC6681).
Which is the scenario emerging from this picture? The hottest gap occurs at a at which the HB/post-HB evolutionary tracks change morphology: the hotter stars (so-called extreme-HB or EHB) evolve essentially vertically in the H-R diagram and do not return to the asymptotic giant branch (AGB) after core He exhaustion (AGB-manqué stars). For this reason it is tempting to identify it with the onset of EHB behavior (Newell 1973, Rood 1997). No simple explanation can be found for the existence of the other gaps.
Evolutionary as well as statistical considerations seem to suggest that these gaps are produced by random mass loss efficiency during the RGB phase, which drives the mass distribution on the HB. Multiple mass loss mechanisms, or the multimodal behavior of a single mechanism, may be required in order to account for all the observed gaps (see Ferraro et al 1998 for a full discussion of the problem).
3.2. Blue Straggler Stars
Blue Straggler stars (BSS), first discovered by Sandage (1953) in M3, are interpreted as Main Sequence stars of larger mass, possibly originated by coalescence of binary/multiple stars, either from original systems or via later stellar collisions. Therefore they represent an important tool to study dynamical interactions inside star clusters. See Bailyn (1995) for a recent review on this subject.
In this context, the first surprising result has been obtained in the GGC M3. By using HST data and complementary ground-based observations, we were able for the first time to follow the BSS radial distribution over the entire extension of the cluster: it turns out to be clearly bimodal (Ferraro et al 1993, 1997c). Moreover the LF for BSS in the inner region has been found to be significantly different from that obtained in the external regions, suggesting that BSS in different environments could have different origin: while BSS in the core could be originated by stellar interactions, BSS in the external regions could be a merging of primordial binary systems.
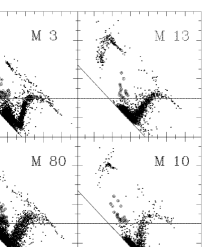
Encouraged by the results obtained in M3 we used our UV data-base to extend the search for BSS in the core of three other cluster: M80, M13 and M10. Figure 7 shows the () CMDs for the four clusters: more than 50,000 stars are plotted in four panels of Figure 7. Horizontal and vertical shifts have been applied to M13, M80 and M10 principal sequences in order to match those in M13. The bright BSS are put in evidence in the Figure as big filled circles. The BSS population selected in such a way (bright BSS) has been compared to reference stellar populations (RGB and HB) observed in the same area of the cluster. The main results can be summarized as follows: (1) BSS are more centrally concentrated than the corresponding RGB stars in M3, M80 and M10, whereas in M13 no significant difference has been found in the radial distribution of these stars; (2) the BSS Specific Frequency (defined as ) turns out to be largely variable in the four clusters, varying by a factor 10 from M13 (the lowest) to M80 (the highest). Particularly interesting is the case of M80 which shows an execeptionally high BSS frequency: indeed, considering the whole BSS content – not only the bright BSS – in the field of view of the PC, BSS turn out to be almost twice as abundant as HB stars. Indeed BSS are overabundant in M80: more than 300 BSS have been identified in this cluster (Ferraro et al 1999b): this is the largest and most concentrated BSS population ever found in a GGC. Since M80 is the GGC which has the largest central density among those not yet core-collapsed, this discovery could be the first direct evidence that stellar collisions could indeed be effective in delaying the core collapse.
These results seem to generally confirm the qualitative scenario proposed by Ferraro, Bellazzini & Fusi Pecci (1995) concerning the possible origin of BSS in globular clusters: the most important formation mechanisms would be coalescence of primordial binaries, most efficient in low density environments, and stellar collisions, most efficient in high density environments. Both mechanisms could be at work in different areas of the same cluster (e.g. M3), while the mechanism producing BSS via the collisional channel should be at its maximum efficiency in M80 (Ferraro et al 1999b).
3.3. Faint UVE
GGC cores have long been thought to harbor other exotic objects which are supposed to result from various kinds of binary systems: low mass X-ray binaries, cataclysmic variables, millisecond pulsars, etc. Though the number of such peculiar objects is admittedly low, they are fundamental probes of GGC cores. The systematic study of these objects will permit a better understanding of the impact of environmental conditions on stellar evolution. In particular, some of them are most often connected to binary systems containing compact objects (like neutron stars or white dwarfs) and are detected via X-ray emission.

In this respect, the faintest low luminosity X-ray sources (LLGCXs) () might be associated with cataclysmic variables (CVs), i.e., binary systems in which a white dwarf is accreting material from a late type dwarf, for example a MS-SGB star (Hertz, Grindlay & Bailyn, 1993). The search for optical counterparts for LLGCXs is essential to determine their origin and the role of the dynamical history of the parent cluster.
Up to now, in all the GGCs observed in our UV-HST survey we identified a few faint objects with a strong UV excess standing significantly outside the main loci defined by other cluster stars. Many of these objects have been found to lie within the error boxes of LLXGCs (see for example Ferraro et al 1997d, 2000c). In a recent review (Ferraro et al 2000b) the photometric characteristics of 10 UVE objects, associated to LLGCXs, detected in the core of 6 GGCs have been compared and discussed. Here I report on our most recent discovery: the surprising UVE population in 47 Tuc.
In Ferraro et al 2001, we presented UV–CMDs obtained for stars detected within the Planetary Camera (PC) field of view in the core of 47 Tuc. We have pinpointed a number of interesting objects: (i) 43 blue stragglers stars (BSSs) including 20 new candidates; (ii) 12 bright (young) cooling white dwarfs (WDs) at the extreme blue region of the UV-CMD; (iii) a large population of UV-excess (UVE) stars, lying between the BSS and the WD sequences. The UVE stars discovered in the core of 47 Tuc represent the largest population of anomalous blue objects ever observed in a globular cluster – if the existence of such a large population is confirmed, we have finally found the long-searched population of interacting binaries predicted by the theory. A zoom of the () CMD is shown in Figure 8: as it can be seen there are at least a dozen of UVE stars (plotted as filled triangles in Figure 8) lying between the WD and the BSS sequence and a large population of faint UVE (small empty squares in Figure 8). The true nature of these anomalous UVE stars cannot be satifactorily assessed yet. In fact many different evolutionary mechanisms involving stellar collisions and interactions could account for them. High resolution, deeper imaging and spectroscopic observations in the UV are required to discriminate among the various models. However, the large number of positional coincidences with X-ray sources (from the recent CHANDRA catalog by Grindlay et al. 2001) indeed suggests that part of them could be IBs. In particular, a significant number of X-ray sources () have been found to be possibly associated with the faint UVE population discovered here, supporting the presence of a large population of faint CV in the core of this cluster.
Acknowledgments.
It is a pleasure to thank all the collaborators involved in this complex project, and E. Pancino & E. Sabbi for a critical reading of the manuscript. The financial support of the Agenzia Spaziale Italiana (ASI) and of the Ministero della Università e della Ricerca Scientifica e Tecnologica (MURST) to the project Stellar Dynamics and Stellar Evolution in Globular Clusters is kindly acknowledged.
References
Bailyn, C.D.: 1995, ARA&A, 33, 133
Bolte, M. 1994, ApJ, 431, 223
Brocato, E., Buonanno, R., Malakhova, Y., Piersimoni, A.M. 1996, A&A, 311,778.
Buonanno, R., et al., 1994, A&A, 290, 69
Caloi V., D’Antona F., Mazzitelli I., 1997, A&A 320, 823
Caputo, F., et al., 1989, ApJ, 340, 241
Carretta, E., Gratton, R.G. 1997, A&ASS, 121, 95
Castellani, V., Chieffi, A., Pulone, L., 1991, ApJS, 76, 911
Castellani, V., Degl’Innoconeti, S., Luridiana, V.,1993, A&A, 272, 442
Dorman, B., Rood, R.T., 1993, ApJ, 409, 387
Faulkner, J., & Swenson, F. J. 1993, ApJ, 411, 200
Ferraro, F.R., 1992, MSAIt, 63, 95.
Ferraro, F.R., et al., 1993, AJ, 106, 2324
Ferraro, F.R., Fusi Pecci, F. & Bellazzini, M. 1995, A&A, 294, 80
Ferraro, F.R., et al., 1997a, A&A, 320, 757
Ferraro, F.R., et al., 1997b, ApJ, 484, L145.
Ferraro, F.R., et al., 1997c, A&A, 324, 915
Ferraro, F.R., et al., 1997d, MNRAS, 292, L45
Ferraro, F.R., et al., 1998, ApJ, 500 311
Ferraro, F.R., et al., 1999a, AJ, 118, 1783 (F99)
Ferraro, F.R., et al., 1999b, ApJ, 522, 983
Ferraro, F.R., Paltrinieri B., Cacciari, C., 1999, MSAIt, 70, 599
Ferraro, F.R., et al., AJ, 119, 1282 (F00)
Ferraro, F.R., et al., 2000b, ApJ, 537, 312
Ferraro, F.R., Paltrinieri, B., Paresce, F., De Marchi, G., 2000c, ApJ, 542, L29.
Ferraro, F.R., et al., 2001, ApJ, 561, 337
Fusi Pecci, F., et al., A&A, 238, 95 (F90).
Frogel J.A., Persson S.E., Cohen J.G., 1981, ApJ 246, 842
Frogel J.A., Cohen J.G., Persson S.E., 1983, ApJ 275, 773 (FCP83)
Grindlay, J.E., Heinke, C.,Edmonds, P.D., Murray, S.S., 2001, Science, 292, 2290
Hertz P., Grindlay J. E., Bailyn C. D.: 1993, ApJ, 410, L87
Montegriffo P., Ferraro F.R., Origlia L., Fusi Pecci F., 1998, MNRAS, 297, 872
Newell, E. B. 1973, ApJS, 26, 37
Pulone, L., 1992, MSAIt, 63, 485.
Renzini, A., Fusi Pecci, F. 1988, ARA&A, 26, 199
Rood, R. T. 1997, in Fundamental Stellar Properties: The Interaction Between Theory and Observation, eds. T. R. Bedding, A. J. Booth, & J. Davis (Dordrect: Kluwer), 363
Rood, R. T., et al., 1999, ApJ, 523, 752
Sandage, A. R.: 1953, AJ, 58, 61
Salaris, M., Chieffi, A., Straniero, O., 1993, ApJ, 414, 580.
Salaris M., Cassisi S., 1997, MNRAS 289, 406 (SC97)
Sandquist, E. L., et al., 1999, ApJ, 518, 262
Sosin, C., et al., 1997, in Advances in Stellar Evolution, eds. R. T. Rood & A. Renzini (Cambridge: Cambridge U. Press), 92
Stetson, P. B. 1991, in ASP Conf. Ser. 13, The Formation and Evolution of Star Clusters, ed. K. Janes (Sanfrancisco: ASP), 88
Straniero, O., Chieffi, A., 1991, ApJS, 76, 525
Straniero, O., Chieffi, A., Limongi, M., 1997, ApJ, 490, 425 (SCL97).
Vandenberg, D. A., Larson, A. M., & De Propris, R. 1998, PASP, 110, 98
Wood, M.A., 1995, in Lecture Notes in Physics, 443, White Dwarfs, ed. D. Koester & K.Werner (berlin:Springer), 41