-band Observations of He 2-10: Unveiling the Dusty Engine of a Starburst Galaxy 111Based on observations obtained at the Gemini Observatory, which is operated by the Association of Universities for Research in Astronomy, Inc., under a cooperative agreement with the NSF on behalf of the Gemini partnership: the National Science Foundation (United States), the Particle Physics and Astronomy Research Council (United Kingdom), the National Research Council (Canada), CONICYT (Chile), the Australian Research Council (Australia), CNPq (Brazil) and CONICET (Argentina)
Abstract
As part of an ongoing program to better understand the early stages of massive star cluster evolution and the physical conditions for their formation, we have obtained , , and (10.8 m) images of the nuclear region of the starburst galaxy He 2-10. The -band images were obtained with the Gemini North telescope. In only ten minutes of on-source integration time with Gemini we were able to detect three of the five enshrouded clusters, or “ultradense H II regions” (UDH IIs) recently discovered in radio maps. None of these sources appears in either the optical HST images or the near-infrared (, , and ) images. These sources comprise about 60% of the total -band flux from He 2-10 and, we suspect, a similar fraction of the total far infrared flux measured by IRAS.
The inferred spectra of the UDH IIs are strikingly similar to those of Galactic ultracompact H ii regions. We have modeled the radio+IR spectrum of these UDH IIs under the assumption that they are “scaled-up” Galactic ultracompact H ii regions. From this model, the bolometric luminosity of the brightest cluster alone is estimated to be L⊙. The total mass of the dust and gas in this UDH II is . We have also used the observed spectra to place constraints on the masses and ages of the stellar clusters enshrouded within the UDH IIs. For the brightest UDH II, we find that the stellar mass must be and the age must be yr, with the most probable age yr. If we assume that the region is pressure confined and enforce the requirement that the star formation efficiency must be less than %, we find that the age of this stellar cluster must lie within a very narrow range, yr. All of the clusters within the UDH IIs in He 2-10 are estimated to have ages less than about yr and masses greater than about .
We find that the logarithmic ratio of the radio to far-infrared flux densities, , for the UDH IIs in He 2-10 is ; for both He 2-10 as a whole and NGC 5253, another nearby starburst known to host UDH IIs. These values of are significantly larger than the average found for normal galaxies, but comparable to the values of found for ultraluminous infrared galaxies. We suggest that large values for starburst galaxies may indicate that a significant fraction of the far-infrared flux may arise from thermal dust emission from UDH IIs.
Finally, the possibility that all of the far-infrared flux from He 2-10 and other starburst galaxies may be produced by regions completely obscured at wavelengths as long as suggests that the well-known correlation between ultraviolet continuum slope and infrared-to-ultraviolet flux ratio in starbursts cannot be due entirely to reprocessing of ultraviolet radiation by dust in a foreground screen geometry. In fact, the dust which reddens the ultraviolet continuum slope must be largely decoupled from the dust which produces the large infrared fluxes in some starbursts.
1 INTRODUCTION
Images of starburst galaxies obtained with the Hubble Space Telescope (HST) have resolved the sites of active star formation into numerous compact star clusters (see e.g., Schweizer 1999; Whitmore 2000 and references therein). These so-called “super star clusters” (SSCs) comprise approximately 20% of the total observed ultraviolet flux, and therefore represent a major mode of star formation in starburst galaxies (Meurer et al. 1995). The radii of these SSCs are typically a few pc and masses, estimated from both theoretical mass-to-light ratios and from direct measurements of velocity dispersions, are in the range . The oldest of these SSCs have ages significantly greater than their dynamical timescales and hence must be bound. The masses, sizes, stellar densities, and ages of SSCs suggest that the most massive examples may be the progenitors of globular clusters. SSCs may also be intimately related to nuclear stellar clusters recently found in the centers of exponential bulges in spiral galaxies (Carollo, Stiavelli, & Mack 1998; Carollo 1999; Böker, van der Marel, & Vacca 1999; Böker et al. 2001). Although the processes involved and the conditions required for massive star cluster formation are not completely understood, it seems clear that extreme environments are necessary. In the local universe vigorous star formation activity, for which SSCs are the signposts, often appears to be associated with cataclysmic events, such as galaxy mergers and interactions.
With ages few Myr, the young blue SSCs discovered with HST (Whitmore 2000) have already emerged from their birth clouds. Even earlier stages of cluster evolution must be hidden from optical and ultraviolet (UV) observations by large amounts of molecular clouds and dust from which the clusters are formed. Hence, studies of the early phases of cluster evolution require observations at longer wavelengths which are relatively immune to the effects of dust scattering and absorption by the natal material.
Recent radio observations of the starburst galaxies He 2-10 by Kobulnicky & Johnson (1999, hereafter KJ99), and NGC 5253 by Turner and collaborators (e.g., Turner, Beck, & Ho 2000; Gorjian, Turner, & Beck 2001) suggest that examples of this young, embedded phase of cluster evolution may now have been identified. The radio maps of these starbursts reveal several compact thermal continuum sources that are optically thick at cm and longer wavelengths. While the radio spectra (either flat or rising with frequency) clearly indicate the emission from these sources is thermal in origin, the small sizes ( few pc), large inferred densities ( cm-3) and enormous emission measures ( cm-6 pc) suggest however that these are not simply “normal” H ii regions. Although H ii regions with similar densities, emission measures, and so-called “inverted spectra” ( with ) exist in the Galaxy, and are known as ultracompact H II regions (UCH IIs; for a review see Churchwell 1990, 1999), Galactic UCH IIs exist on vastly smaller mass scales: typical Galactic UCH IIs are excited by a single (or only a few) O-type star(s) (e.g., Churchwell, Wolfire, & Wood 1990). The compact radio sources found in He 2-10 and NGC 5253, on the other hand, have inferred masses of , ionizing luminosities , and contain the equivalent of O-type stars. The properties of these compact sources are clearly similar to those of the SSCs seen in the optical and UV images. Because of the similarity of their radio spectra to those of UCH IIs, KJ99 dubbed these objects “ultradense H II regions”, or UDH IIs.
The existence of such dense thermal emission regions in starburst galaxies had been suggested prior to the recent results on He 2-10 and NGC 5253. Puxley et al. (1991) inferred the presence of compact, high density clusters in NGC 2146 based on H53 observations. This result was confirmed by Tarchi et al. (2000), who found six UDH IIs in 1.6 and 5 GHz maps of this galaxy. Zhao et al. (1997), using H92 observations, found similarly dense regions in NGC 3628 and IC 694. Ulvestad & Antonucci (1997) reported a number of such flat-spectrum sources in multi-wavelength radio maps of NGC 253. The unusual properties of the UDH II in NGC 5253 were suggested by the work of Beck et al. (1996) and Turner, Ho, & Beck (1998). In addition, the VLA survey of so-called Wolf-Rayet galaxies by Beck, Turner, & Kovo (2000) indicates that UDH IIs are quite common in starbursts.
The significance of the recent results on He 2-10 and NGC 5253 lies not simply in the detection of the UDH II regions, but also in the morphologies of the radio maps relative to high spatial resolution optical images obtained with HST. None of the radio “knots” detected in He 2-10 and NGC 5253 is associated with the SSCs readily seen in the HST ultraviolet and optical images. It is this detailed positional comparison, impossible before the launch of HST, that is so striking and that lends support to the suggestion by KJ99 that these radio sources are in fact heavily dust-enshrouded stellar clusters, the youngest phases of SSCs still buried deep within their birth clouds.
If these UDH IIs are indeed young SSCs hidden at ultraviolet and optical wavelengths as the result of absorption by surrounding dust, the bulk of their substantial bolometric luminosities should be radiated in the mid- to far-IR regimes as a result of the reprocessing of the cluster ultraviolet flux by the dust. With this in mind, we have carried out a set of near-infrared and thermal infrared imaging observations in an attempt to detect the UDH IIs directly from their dust emission. In this paper we present the detection of thermal-infrared emission in the -band from the UDH IIs discovered by KJ99 in He 2-10. The observations are described in §2. A discussion of the relative morphologies, an analysis of the spectral energy distributions (SEDs) of the radio knots, and constraints on the properties of the embedded stellar clusters are presented in §3. We compare the properties of the UDH IIs seen in He 2-10 with those of Galactic UCH IIs and discuss the implications our results have on the infrared-radio correlation and the correlation for starburst galaxies in §4. Our conclusions are summarized in §5.
2 OBSERVATIONS
2.1 -band images
-band (m) observations of He 2-10 were made using the mid-infrared imager OSCIR on the Gemini North telescope during the scheduled OSCIR mini-queue in February 2001. OSCIR contains a Si:As BIB detector sensitive between 8 and 25 m. At Gemini North, the field of view of OSCIR is and the pixel scale is pix-1. Conditions were photometric during the observations and the seeing, as measured by the FWHM of standard stars, was in the range of . However, due to high winds, unfortunately only a total of ten minutes of ‘on source’ integration time were possible. Two sets of 5 minute observations (with small offsets in pointing) were made of He 2-10 at an airmass of . Throughout the observations, standard chopping and nodding techniques were employed in order to subtract the thermal sky background.
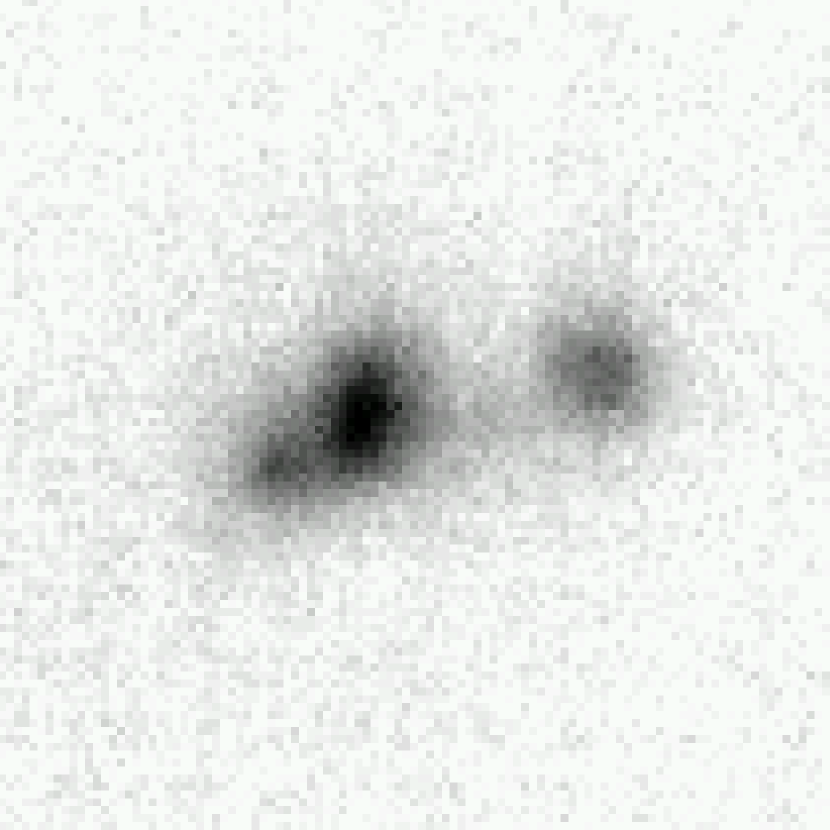
The images were reduced using the OREDUCE task in the GEMINI/OSCIR package available in the Image Reduction and Analysis Facility (IRAF). The two sets of images of He 2-10 were reduced separately and then shifted (to account for the pointing offsets) and combined. The final -band image, corresponding to , is shown in Figure 1, which reveals several marginally-resolved, closely-spaced emission regions. Photometry of these regions was performed by constructing a model of the source, consisting of tilted, elliptical Gaussians atop a constant background, and fitting it to the image using a least-squares routine. In addition to providing estimates of the total fluxes and sizes of the extended emission regions, and a goodness-of-fit value, this method also ensures consistency between the -band fluxes and the radio fluxes, which were derived in a similar fashion.
The data were calibrated using observations of the standard stars CrB, Leo, and Pix. We adopted the -band magnitudes given by Tokunaga (1984) for CrB and Leo. The -band magnitude of Pix was calculated using the absolutely calibrated spectrum given by Cohen et al. (1999) and the OSCIR filter transmission curve. We adopted the median -band extinction coefficient for Mauna Kea given by Krisciunas et al. (1987) and solved for the photometric zero point. The zero point and the extinction coefficient were then applied to the instrumental fluxes computed for the various emission regions in He 2-10. Flux densites in mJy were computed using the conversion given on the OSCIR web page (0 mag Jy). The absolute uncertainties in the source fluxes are % and are dominated by the uncertainties in the photometric calibration derived from the standard stars.
2.2 Near-infrared images
As part of a larger project to image starburst galaxies in the near-infrared, He 2-10 was observed in the , , and bands using the University of Hawaii 2.2m telescope with the Quick Infrared Camera (QUIRC, Hodapp et al. 1996 ) and the UH tip/tilt system (Jim et al. 2000) on 02 January 1996. QUIRC contains a HAWAII array produced by Rockwell and is sensitive between 1 and 2.5m . At the focus of the 2.2m telescope, the pixel scale is pix-1 and the field of view is approximately . During the observations, conditions were photometric and the seeing, as measured from standard stars, was about at .
Standard procedures were used for observing an extended source in the near-infrared (dithering and nodding to sky). A set of 7 on-source images, each 180 s in and and 90 s in , were acquired. A set of equal length sky exposures were interleaved between the source frames. The images were reduced in IRAF using a suite of specially designed routines. After subtracting the sky and flat-fielding, the images were aligned and combined using a median routine. The image of the center of He 2-10, with the central position, size, and orientation corresponding to the -band image, is presented in Figure 2; the full band image of He 2-10 was presented by Vacca (1997). Flux calibration was determined from near-infrared photometric standard stars (Casali & Hawarden 1992) observed during the night. A detailed discussion and analysis of the near-infrared images will be presented elsewhere (Vacca, in preparation).
3 RESULTS
3.1 -band Morphology
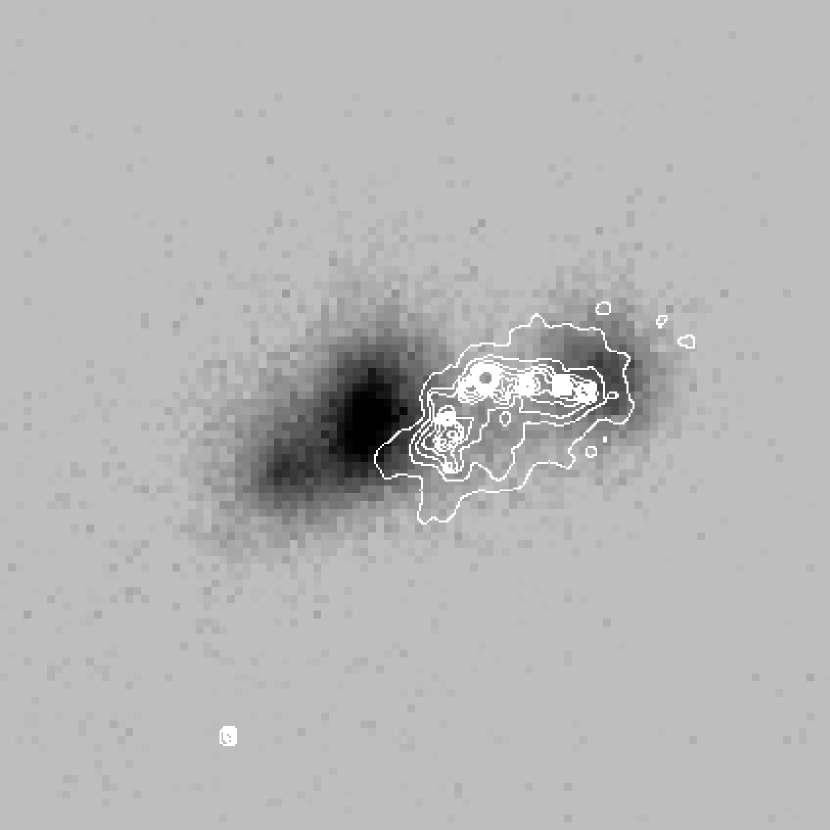
Figures 1 and 2 show the and images of He 2-10, respectively; the orientations and fields of view of these images are the same. For an assumed distance to He 2-10 of 9 Mpc (Vacca & Conti 1992), corresponds to about 44 pc; the full image shown in Figure 1 covers approximately 410 pc 410 pc. Despite the lower resolution of the ground-based observations, the image appears very similar to the HST UV and optical images presented by Conti & Vacca (1994) and Johnson et al. (2000), in that it reveals a bright arc of emission, and a luminous point source at the top of the arc corresponding to the brightest UV/optical starburst knot, against a diffuse background. A detailed comparison between the near-IR images and the HST images will be presented elsewhere (Vacca, in prep.). The -band image, however, which reveals three bright sources atop a much weaker background, is striking for its dissimilarity to either the optical or near-infrared images of this galaxy. To demonstrate this, in Figure 3 we show the contours of the optical V-band image from HST obtained by Johnson et al. (2000) on top of the -band image. Even with the relative astrometric uncertainty in the HST image of , it is clear that none of the SSCs seen in the HST UV and optical images, or the ground-based near-infrared images, is detected in the Gemini -band image. The starburst clusters seen in the optical image are not associated with the bright mid-IR emission regions. In fact, it appears that the bright -band regions serve to delimit the extent of the optical emission. The arc of UV/optical starburst knots is entirely located between the two brightest -band sources directly to the east and west; the brightest UV/optical SSC is located at the position of the weakest -band emission between these two bright sources. This region of weak 10.8 m emission also shows very low H equivalent width, which Johnson et al. (2000) suggest is due to the strong winds from the starburst knots having blown away the ambient gas. The equivalent width map shows no other obvious correlation (or anti-correlation) with the -band image; weak emission is seen throughout the region where the brightest -band source is located, for example.
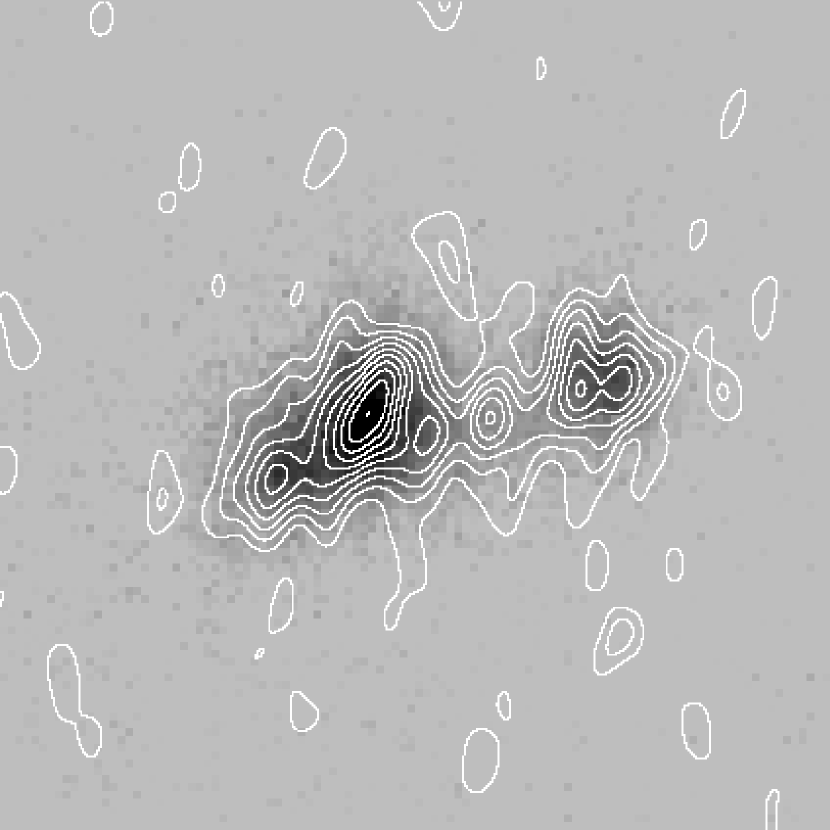
In contrast with the UV, optical, and near-infrared images, the radio maps of KJ99 are extremely well-correlated with the -band image, as shown in Figure 4, which presents the 2 cm flux contours on top of the -band image. The four sources detected in the -band are clearly associated with four or five of the radio-bright UDH IIs found by KJ99. The morphology of the mid-IR emission is nearly identical to that of the thermal radio emission and is not correlated with the UV, optical, or near-IR morphology. This result immediately suggests that most of the 10.8 flux is not due to ambient dust that has been heated (primarily) by the starburst knots seen in the UV/optical. As we will demonstrate below (§4.1), heating of dust in the bright 10.8 regions and their surrounding vicinity by these optical SSCs is negligible. Rather, the 10.8 emission arises primarily from hot dust heated by the stars embedded within the UDH IIs themselves.
In KJ99 the UDH IIs are numbered 1-5 from west to east in He 2-10. Using this nomenclature, we have detected the UDH IIs 1, 3, 4, and 5 at 10.8 m; UDH II #2 is likely to be blended with #1 in the -band image. All the knots have observed FWHM values larger than the seeing, and are therefore marginally resolved. Knot 4, in particular, is clearly extended in one direction, in agreement with the morphology seen in the radio maps. This may be due to the presence of several sources which are not separated at our resolution. The fluxes and -band magnitudes of the four -band knots are listed in Table 2 along with the effective radii derived from the elliptical Gaussian fits used to determine the photometry. The effective radii were calculated from
| (1) |
where is the semi-major axis and is the axial ratio determined from the fits. We corrected these values for broadening due to Gaussian seeing.
The total -band flux found from our image is mJy. This value is in reasonable agreement with that given by Telesco, Dressel, & Wolstencroft (1993), who measured the integrated -band flux of He 2-10 to be mJy. Both of these values, however, are substantially smaller than those found by Sauvage, Thuan, & Lagage (1997; 1.06 Jy) and Cohen & Barlow (1974; 1.6 Jy). 222After this paper was submitted the recent m observations of He 2-10 by Beck, Turner, & Gorjian (2001) were brought to our attention. The morphology of He 2-10 at m appears to be very similar (as expected) to that seen in our m image. Beck et al. (2001) measure a total flux at m of 880 mJy, which represents at least 80% of the total 12 m flux measured by IRAS. This value is in reasonable agreement with our estimate of the total flux at m, given that the infrared spectrum of He 2-10 as measured by IRAS is steeply rising between 12 and 25 m; our value is within the 20% uncertainty of theirs. However, their estimates of the fluxes for the individual knots seen in the images are about a factor of 2 larger than ours. This is presumably due to the fact that Beck et al. (2001) did not account for the background beneath the knots in their photometric measurements. Nevertheless, the fractional contributions of the knots to the total m flux are identical to those found here. The physical sizes of the knots as estimated by Beck et al. (2001) are somewhat smaller than, although comparable to, those we have derived.
Sauvage et al. (1997) dismissed the measurement of Cohen & Barlow (1974) as being in error since it is substantially larger than the 12 IRAS flux. The difference between our flux value and that of Sauvage et al. (1997) is more puzzling, however, as He 2-10 is a fairly compact source and all of the flux contours presented by Sauvage et al. (1997) are contained within the field of view of our image. In fact, their deconvolved image appears to be nearly identical to ours, and all of their measured flux is contained within the same regions we detect (see their Table 1). Therefore, it is unlikely that Sauvage et al. (1997) could have detected significantly more flux from He 2-10 (in, for example, a faint diffuse extended component) than we see.
The discrepancy is probably due to three factors: (1) large differences in the -band filter transmission profiles and central wavelengths; (2) an attempt by Sauvage et al. (1997) to incorporate a color term in their photometric calibration (we have not included a correction for the color differences between our standards and He 2-10); and (3) non-photometric conditions during the observations of Sauvage et al. (1997). With regard to point (2), we should point out that, while there probably is a potentially large color term in the photometric transformations between the standards and He 2-10, the color term correction adopted by Sauvage et al. (1997) is almost certainly incorrect. Sauvage et al. (1997) extrapolated their observed 10.1 m to the -band assuming a spectral energy distribution of ; however, as we show below, the spectral energy distribution of He 2-10 near m is actually decreasing rapidly with frequency (see also Zinnecker 1987). Additionally, if we fit a blackbody spectrum to the IRAS 12 m and 25 m flux points, and extrapolate to m, we predict a total -band flux of 640 mJy, in good agreement with both our observed value and that of Telesco et al. (1993). It should also be noted that Sauvage et al. (1997) assumed the thermal-IR emission is coincident with the optically visible starburst. As can be seen from Figures 4 and 3, the dust emission coincides with the thermal radio morphology and is not associated with the optically visible SSCs.
The combined -band flux of the four detected UDH IIs indicates that % of the m flux from the entire galaxy can be attributed to just these four objects. Almost all of the remaining -band flux is due to the background on which the UDH IIs sit, and which has a morphology very similar to that of the UDH IIs, but on a slightly more extended scale. Very little flux arises from any diffuse component beyond the immediate location of the UDH IIs. The surface brightness of the background beneath the UDH IIs is approximately 10 mJy/sq arcsec. Based on the relative morphologies of the HST images and the background detected in the -band image, it would also appear that very little of this background flux is due to emission from dust directly surrounding and heated by the SSCs seen in the UV and optical images. It is possible that some of the background flux arises from dust which is heated by radiation escaping from the UDH IIs. If this is indeed the case, then nearly all of the observed -band flux and, by extension nearly all of the observed flux in the 12 IRAS band, from He 2-10 would be attributable to UDH IIs that are invisible in UV, optical, and near-infrared images. Given the vigorous star formation throughout He 2-10, as traced by the HST UV and optical images (Conti & Vacca 1994; Johnson et al. 2000), this result is in itself rather remarkable.
The relative locations along the line of sight of the -band knots and the optically bright starburst knots are not known; the optical SSCs could be located in front, behind, or at the same distance as the -band sources. If the optical SSCs are located behind the -band knots, this would suggest that the observed optical morphology is completely determined and delineated by the foreground regions of low dust optical depth (and hence weak or absent -band emission).333This is the “hole story” scenario of Meurer et al. (1995). On the other hand, if the -band knots and the optical SSCs reside at the same relative distance, it is tempting to conclude that the -band morphology may, to some extent, be a result of the sweeping action of the wind arising from the optically visible starburst. The -band emission would then identify regions where dust has been swept up, the density has increased, and the resulting structures have collapsed and begun to form stars; the areas of faint or absent -band emission would indicate regions where the dust has been effectively cleared out by the starburst wind.
3.2 Observed Spectral Energy Distributions and Physical Models for the UDH IIs
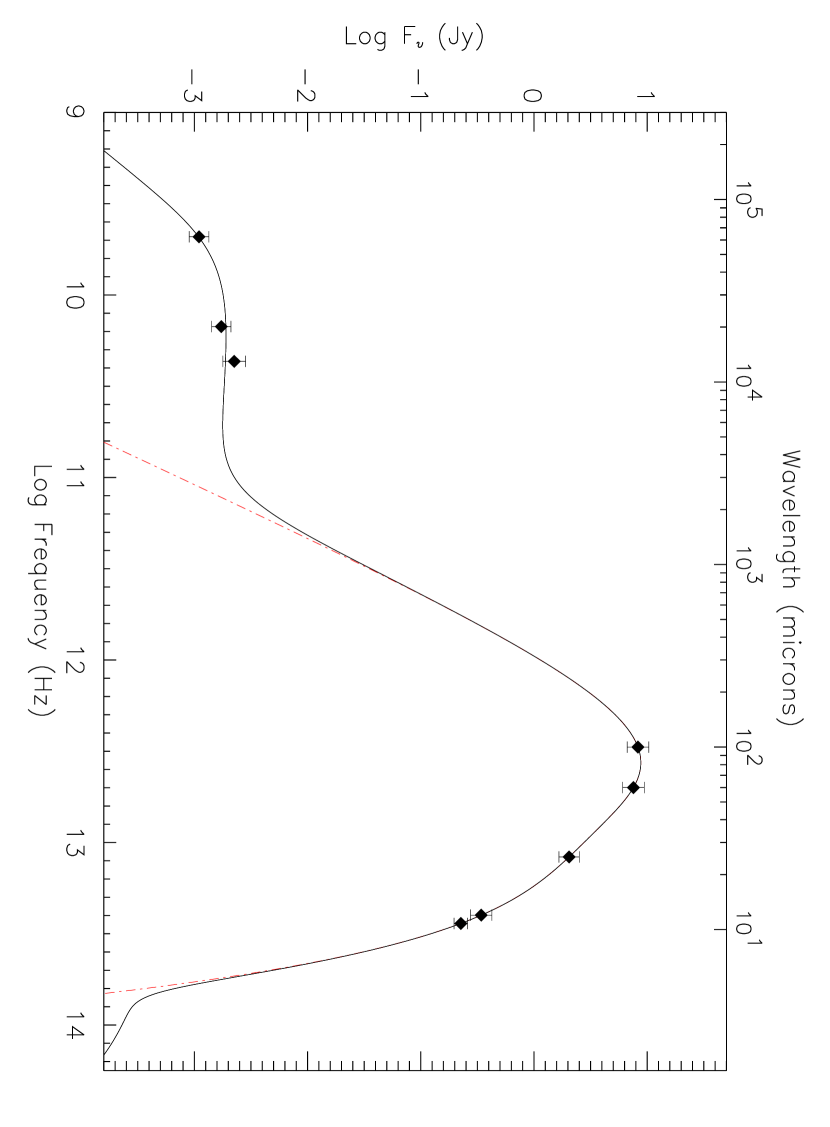
We have constructed an SED for each of the four -band knots by combining the measured -band fluxes, the radio fluxes at 2 and 6 cm from KJ99, additional fluxes at 1.3 cm for three knots (kindly provided by H. Kobulnicky, private communitcation), and estimated fluxes in the IRAS bands. The last were estimated as follows. As discussed above, there is a good correspondence between the total -band flux observed from He 2-10 and that predicted at 10.8 m by fitting the short wavelength IRAS fluxes with a simple blackbody. Hence, it appears that the knots seen in the -band image can account for most of the m IRAS flux from He 2-10. 444This has been confirmed by the m observations of He 2-10 by Beck et al. (2001). See footnote 3 and the previous section. If we now assume that the -band and radio images are representative of the spatial distribution of the emission regions detected in the IRAS bands, we can then infer the 12, 25, 60, and 100 m fluxes for each of the knots by multiplying the total IRAS fluxes for He 2-10 at these wavelengths by the fractional contributions of each knot to the total -band flux. The resulting SEDs are shown in Figure 5 and bear a remarkable resemblance to the SEDs for Ultracompact H ii regions (e.g., Wood & Churchwell 1989).
Using the analysis of UCH II regions as a guide (see e.g., Churchwell et al. 1990), we have constructed simplified physical models of UDH II regions and attempted to match the observed SEDs of the knots with the model spectra. The models consist of a “cocoon” comprising two emission zones: an inner spherical region (), which produces the thermal bremsstrahlung radio spectrum, surrounded by a spherical dust shell with , which is responsible for most of the far-infrared emision. The entire cocoon surrounds a stellar cluster which provides the photons necessary to ionize the inner region and heat the dust in the outer shell. For the free-free emission region we adopted the mean electron temperature found by Kobulnicky et al. (1999) of K, and assumed a constant electron density .
For simplicity, we assumed the dust consists of spherical silicate grains with an opacity proportional to and a radius of 0.1 . The absorption efficiency was normalized to a value of 0.01 at 40 , as given by Draine & Lee (1984). The dust density was assumed to be constant with shell radius. The latter assumption has been shown to provide a good fit to the spectra of Galactic UCH II regions (Churchwell et al. 1990) The dust shell was assumed to be optically thin at all wavelengths. The far infrared data (-band and IRAS points) clearly indicate that a single temperature blackbody is not a good representation of the SED. Therefore, the dust temperature within the shell was allowed to vary with radius between values specified at the inner and outer edges of the shell, and , respectively. We adopted the specific functional form , where was determined from the fit to the data. This form was adopted primarily because it is fairly general and can reproduce the qualitative characteristics of the temperature profile found by Churchwell et al. (1990) in their analysis of the UCH II G5.89-0.39. We made no attempt to determine the temperature self-consistently, however, and therefore these models are not completely realistic; nevertheless, they are useful for obtaining rough estimates of the physical parameters of the knots.
The model was fit to the SEDs of each of the knots using a least-squares procedure. The relevant parameters resulting from this procedure are given in Table 3. The radii and the electron densities we find are similar to those derived by KJ99; the large electron densities are required to produce the turnover observed in the SEDs at the lowest frequencies. Because of the manner in which the fluxes in the IRAS bands were estimated, the derived dust shell parameters are all very similar for the four knots. Figure 6 shows the resulting best fit to the spectrum of knot 4. The temperature profile as a function of shell radius for knot 4 is shown in Figure 7. As this figure shows, the dust temperature varies between K at the inner edge and K at the outer edge, falling off quickly with radius; was found to be , and hence the temperature drops from its maximum value to below K within a radius of 10 pc, or less than 0.1% of the total shell volume. Throughout most of the shell the dust temperature is between K and K. The outer temperature K is in good agreement with the value expected for the ambient interstellar medium. Churchwell et al. (1990) found similar results in their more complete models of UCH II regions. Despite the large outer radius, it is not in contradiction with the observed sizes, as the half-light radius estimated from the temperature distribution is only about a few pc. Rather, the fact that the predicted half-light radii are so much smaller than the radii measured from the -band image suggests that the completely optically thin assumption we adopted may not be valid for the shorter wavelengths (10.8, 12, and possibly 25 m).
The total far infrared luminosity between 10 and 1 cm for knot 4 is , with an uncertainty of about 20%. (The uncertainties on the infrared luminosities of the other knots are about 25%.) This represents about % of the total far infrared flux from He 2-10. The total mass found for the dust shell, , is about , where we have assumed the standard dust-to-gas ratio of (Whittet 1992). The dust mass is highly uncertain, however, as it depends critically on the exact values of the dust properties and the absorption coefficient. A significantly larger mass for the shell would result from using the substantially lower dust-to-gas ratio of suggested by Baas, Israel, & Koornneef (1994). Additionally, the total shell mass could well be larger than our estimate if the dust shell is actually optically thick at the shorter wavelengths. One indication that this could indeed be the case (in addition to the half-light radii mentioned above) comes from the estimate of the optical and near-infrared extinction. Despite the fact that the UDH IIs are not detected in either our optical or near-infrared images, the estimated dust masses derived from our model fits correspond to only moderate optical extinction values of between about 0.7 (for knot 3) and 12 (for knot 4); the corresponding extinction values at 2.2 m are estimated to be only between 0.05 and 0.9. (For these estimates we have adopted the extinction laws appropriate for the silicate-graphite mix of Mathis, Rumpl, & Nordsieck 1977, as calculated by Draine & Lee 1984). Clearly, there must be more dust than indicated by our model fits or the knots would be visible in our -band image.
We point out that we do not know the extent to which emission from fine structure nebular lines (e.g., [Ar iii] 8.9 m, [S iv] 10.5 m, and [Ne ii] 12.8 m) and polycyclic aromatic hydrocarbons (PAHs, at 8.6, 11.3, and 12.6 m) might be contaminating the observed -band fluxes of the individual knots. (The filter transmission is between 8 and 13 m.) Starburst galaxies are known to exhibit a wide range of strengths for these features (Madden 2000). We can estimate the possible nebular line contamination to the total -band flux of He 2-10 using the [Ar iii], [S iv], and [Ne ii] emission line strengths reported by Beck, Kelly, & Lacy (1997). The total flux from these three emission lines is erg cm-2 s-1. The size of the region to which this total line flux corresponds is unclear from the Beck et al. (1997) paper, but probably includes all four -band knots. In this case, the emission line flux represents only % of the total measured -band flux from the four knots, far less than our photometric uncertainty. Therefore, we have ignored the possible nebular line contamination to the 10.8 m fluxes. The possible PAH contribution is far more uncertain. A mid-IR spectrum of the starburst galaxy NGC 5253 presented by Crowther et al. (1999), however, shows no sign of PAH emission. We have therefore assumed that these features also do not contribute substantially to the -band flux from He 2-10.
3.3 Mass and Age of the Stellar Cluster in Knot 4
Despite the limited knowledge of the SEDs of the -band/radio knots, a number of constraints can be placed on the ages and masses of the stellar clusters embedded in these UDH IIs. We will demonstrate these constraints using knot 4 as an example.
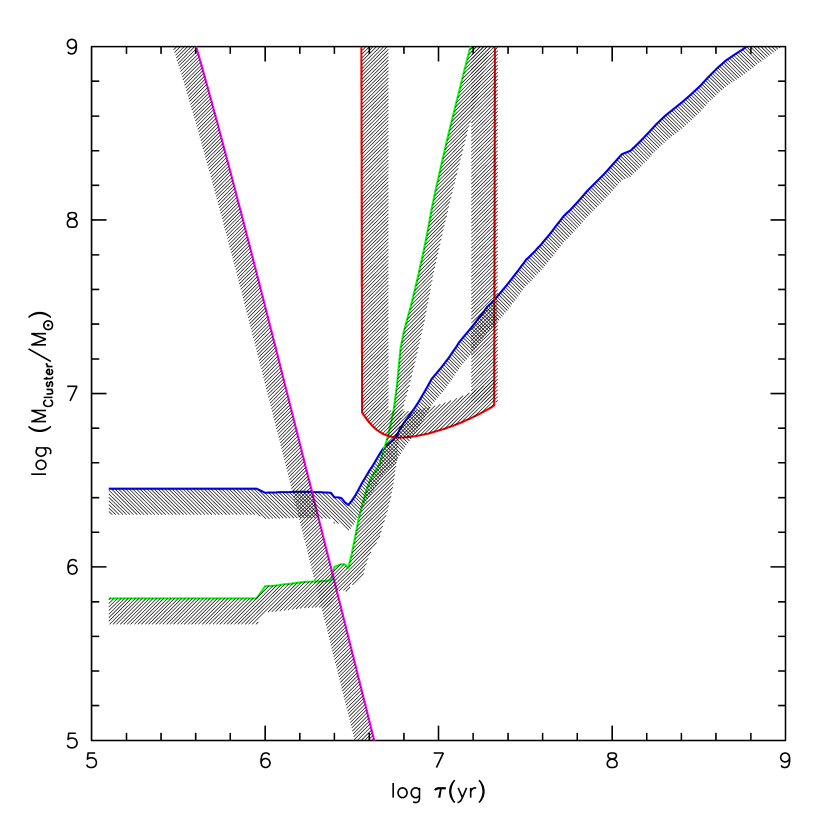
Because the UDH IIs are not seen in the UV, optical, and near-infrared images, we can approximate the bolometric flux for the knots as . This estimate is strictly a lower limit, as the knots could well be emitting some (presumably small) fraction of between 2.5 and m. If we now make the usual assumption that the infrared flux represents the reprocessed emission from a stellar cluster, we can compare our estimates of with those predicted by population synthesis models to constrain the mass and age of the cluster. We have used the updated version of the Bruzual & Charlot (1993) models (hereafter referred to as BC00) models with the following parameters: (1) an instantaneous burst of star formation; (2) solar metallicity; and (3) a Salpeter Initial Mass Function between 0.1 and 100 M⊙. For knot 4, the observed value of can be reproduced by the model clusters with the set of ages and masses indicated by the solid line shown in the age-vs.-mass plot in Figure 8. Because the estimated value of is a lower limit to the true value, the region below this line is excluded.
The relatively flat radio spectra () of the knots between 5 GHz (6 cm) and 23 GHz (1.3 cm), and the observed turnover in the spectra at low frequencies, are indicative of thermal free-free emission, as discussed by KJ99, and as we have assumed in our models (§3.2). Most galaxies, however, exhibit radio spectra that decrease with increasing frequency, indicative of synchrotron emission from SNe and cosmic rays. Indeed, He 2-10 as a whole also has a non-thermal radio spectral index. The thermal nature of the radio spectrum of the knots can be used to place limits on the SN frequency, and consequently on the ages, of the knots. Let us assume for the moment that all of the flux emitted at 6 cm is due to synchrotron radiation; this is clearly an upper limit to the non-thermal flux. The relation between the non-thermal luminosity and the SN rate is given by Condon & Yin (1990) and Condon (1992):
| (2) |
This equation can be used to derive an upper limit to the SN rate in knot 4, once the 6 cm flux has been scaled to account for the possible effects of synchrotron self-absorption. Adopting a value of typical for Galactic synchrotron sources (Condon 1992), we find yr-1. Again employing the models of BC00, we use this value to place the additional constraints on the mass and age of the stellar cluster in knot 4 shown in Figure 8. Regions above the designated line in this figure are excluded by the lack of any signatures of SNe in the SED of knot 4.
The radio flux can also be used to estimate the total ionizing flux from the stellar cluster. Assuming that all the radio flux is due to thermal bremsstrahlung, and correcting for self-absorption, we find the total thermal luminosity for knot 4 is , depending on the wavelength used for the estimate. This value corresponds to a limit on the total ionizing flux from the cluster of where we have used the relation between the radio luminosity and the predicted number of ionizing photons emitted per second by a cluster given by Condon (1992)
| (3) |
This value of is a lower limit, as Equation 3 does not account for the effects of absorption of ionizing photons by dust. Of course, could well be smaller than this estimate if a significant fraction of the radio flux is due to synchrotron emission rather than thermal bremsstrahlung. However, our estimate agrees well with that determined by Mohan, Anatharamaiah, & Goss (2001) from observations of the H92 emission line (). The limit on corresponds in turn to limits on the mass and age of the stellar cluster. From the BC00 models, we find that the estimated value of can be produced by stellar clusters with the ages and masses indicated by the designated line in Figure 8. Regions below this line are excluded because too few ionizing photons would be produced to account for the observed radio luminosity.
We can also apply lifetime arguments to the knots in He 2-10 to derive additional constraints on the stellar cluster masses and ages, as well as the ambient density in the vicinity of the UDH IIs. The radius of an H ii region should expand according to the relation given by Spitzer (1978),
| (4) |
where is the local sound speed, and is the initial size of the Stromgren sphere immediately after the ionizing stars “turn on”, given by
| (5) |
where is the fraction of ionizing photons absorbed by dust; we have assumed .
We can invert this equation to determine the age and mass of the stellar cluster for various values of the initial (assumed to be the ambient) density . The results indicate that masses and ages consistent with the other constraints shown in Figure 8 can found only if the ambient density is on the order of cm-3. We can estimate independently from equilibrium arguments. The H ii region stops expanding when it comes into pressure equilibrium with the ambient environment, such that
| (6) |
where the left hand side of the equation corresponds to the conditions within the ionized region and the right hand side corresponds to the ambient environment. The value of the numerical constant depends on the dominant state of the gas in the ambient medium. If the gas consists mainly of atomic hydrogen, ; if molecular hydrogen is the main component of the ambient medium, (De Pree, Goss, & Gaume 1998). The final radius of the ionized region is given by
| (7) |
where is the time at which equilibrium is reached and is the ionizing flux produced by the cluster at this time. Assuming that cm-3 and K, as found from our model of the SED of knot 4, and adopting K and , we use Equation 6 to solve for and find cm-3. Given the location of the radio knots, very close to starburst regions which are visible in the ultraviolet (and hence have blown away their birth clouds), such densities do not seem unrealistic. They are also consistent with estimates of ambient densities around Galactic UCH II regions (e.g., De Pree, Rodríguez, & Goss 1995). Both the original ambient density and the wind arising from the optically visible starburst may serve to pressure confine the UDH IIs (and possibly extend their lifetimes). As suggested in §3.1, such a scenario would also be consistent with the H equivalent width map of He 2-10 presented by Johnson et al. (2000), as well as with the relative morphologies of the -band and UV/optical images.
Using this estimate of , the current radius of the ionized region pc as determined from the fit to the SED of knot 4, and the predictions of the BC00 models for the value of as a function of the mass of a young stellar cluster, we derive the relation between the age and mass of the stellar cluster within knot 4 plotted in Figure 8. This relation is strictly a lower limit, as both absorption of ionizing photons by dust () and the use of yield larger cluster masses for any given age. Hence, cluster age and mass combinations below this line in Figure 8 are excluded. Note, however, that the estimate for explicitly assumes that the H ii is in pressure equilibrium with its surrounds. For the young ages that are possible for these UDH IIs this may not be valid.
As an aside, we note that one of the outstanding problems in the study of UCHII regions has been their relatively long lifetimes. Early estimates yielded an expected lifetime of a typical UCH II of only yr, far too short to account for the number of UCH IIs seen in the Galaxy (Wood & Churchwell 1989). De Pree, Rodríguez, & Goss (1995; see also García-Segura & Franco 1996), however, have suggested that the solution to this puzzle lies in the value of the ambient gas density in which an UCH II is formed. If the ambient density is on the order of cm-3, rather than cm-3, the estimated lifetime of an UCH II can be increased by a factor of 10 or more beyond the original value estimated by Wood & Churchwell (1989). Given the observational similarities between UDH IIs and UCH IIs, we might expect these objects to be formed in analogous physical environments.
As Figure 8 demonstrates, the age of the stellar cluster in knot 4 is constrained to be less than about yr, with the most probable value less than yr, and the mass must be larger than about . Carrying out similar calculations for the other knots seen in the -band image reveals that they all must have ages less than about yr and masses greater than about . Using the lower limit of the mass of the stellar cluster and the estimated mass of the surrounding dust shell for knot 4, we find a star formation efficiency of about 17% for this knot. The uncertainties on this value are, of course, very large.
If we now assume that the total stellar mass in knot 4 must be less than about [where we have increased the estimated cocoon mass by a factor of 10, to allow for the possibilities that the SED model may have underestimated the total dust mass and that the dust-to-gas ratio may be smaller in irregular blue starburst galaxies (Hunter et al. 1986), and have required the star formation efficiency to be %], we find that the age of the cluster in knot 4 must lie within a narrow range between yr. Decreasing the mass of the stellar cluster raises the lower age limit and narrows the range of possible ages; decreasing the age increases the lower mass limit. The total dynamical mass of He 2-10 was estimated by Kobulnicky et al. (1995) to be of the order of . Therefore, it seems somewhat unlikely that of material could be contained within a single cluster with an effective radius of only 20 pc. However, reducing the estimated mass to yields an even narrower range of ages, yr. Clearly these UDH IIs are among the youngest extragalactic stellar clusters yet found.
It is interesting to compare the results of this analysis with those determined above from the spectral models. For a cluster age of about yr and a mass of , we would predict a radius for the Stromgren sphere surrounding the cluster of about 2.9 pc, which is in excellent agreement with the radius determined from fitting the SED (§3.2 and Table 3). We can, in fact, use the size of the ionized region to place additional constraints on the mass and age of the cluster. As expected from the above comparison of the radii, the resulting curve lies close to that obtained from the total ionization rate derived from the radio fluxes. Alternatively, if the mass and age of the cluster are known the comparison between and the predicted Stromgren radius allows us to place limits on the amount dust contained within the ionized region. For the age-mass pair used above, the fraction of ionizing photons absorbed by dust within the Stromgren sphere, , must be close to zero. However, for younger and/or more massive clusters, rises rapidly: for an age of yr and a mass of , for example, .
The lower mass limits found for the stellar clusters embedded in these UDH IIs are far larger than the typical masses found for SSCs in He 2-10 (Johnson et al. 2000), NGC 1714 (Johnson et al. 1999), and many other starburst galaxies (see Schweizer 1999; Whitmore 2000 and references within). The mass of the cluster in knot 4 is about a factor of 10 larger than that estimated for the most luminous SSC in He 2-10 (Johnson et al. 2000); for the other knots, the estimated masses are factors of several larger than that of the brightest optical SSC. In deriving our constraints on the stellar cluster ages and masses, we have assumed that each UDH II contains a single embedded cluster, with an initial mass function extending down to . If the mass function extends down only to (the typical value assumed for mass estimates of SSCs), the stellar cluster masses would be reduced by a factor of 2.55. Furthermore, the extended morphology of knot 4 could be due to the superposition of several unresolved sources. Large UCH II complexes in the Galaxy, such as W49A for example, consist of a conglomeration of several embedded clusters (De Pree et al. 1997; Smith et al. 2000). Whether a given UDH II consists of a single embedded stellar cluster, or a complex of several clusters, each surrounded by their own dust cocoons and residing within a lower density intercluster medium, is unknown at present. Because our mass and age limits are derived from the total observed broadband fluxes of each UDH II, they represent the luminosity-weighted (or mass-weighted) characteristics for the sum of the embedded clusters, if several are contained within an UDH II. Hence individual subclusters would have smaller masses and could have a range of ages compared to our estimates. Nevertheless, the mass estimates we have derived under the assumption of a single stellar cluster are within the observed range (albeit at the high end) of the masses found for SSCs (e.g., Mengel et al. 2001) and nuclear stellar clusters (Böker, van der Marel, & Vacca 1999). Recent work by Johnson et al. (2001) suggests there is a continuum of sizes and masses of embedded extragalactic clusters, from those with only a few O7V* stars 555O7V* is the number of “equivalent” O7V-type stars required to create a given Lyman continuum flux; a single O7V* produces Lyman continuum photons s-1 (Vacca 1994)., to moderate sized clusters of a few hundred O7V* (which are observationally nearly identical to UCH II complexes in the Galaxy such as W49A), up to these giant UDH IIs, which may be proto-globular clusters. The question of whether subclusters are present within UDH IIs could be settled by higher spatial resolution radio and infrared observations or possibly by interferometric observations in the -band, for example with the MIDI instrument on the VLTI (Leinert et al. 2000; Lopez et al. 2000).
4 DISCUSSION
4.1 Comparison with Ultracompact HII Regions
In Figure 5 we plot the estimated SEDs for knots 1+2, 3, 4, and 5 seen in the -band and radio images. Comparison with the SEDs of Galactic UCH II regions (e.g., Wood & Churchwell 1989) reveals a striking similarity and reinforces the suggestion of KJ99 that the knots in He 2-10 are in fact the extragalactic analogues of UCH IIs, albeit vastly scaled up in size. Indeed, the inner dust temperature of 189 K found from our analysis of the SEDs of the knots in He 2-10 (Table 3) is remarkably close to that predicted by the simple relation between radius and temperature given by Wilner, Welch, & Forster (1995) for Galactic UCH IIs,
| (8) |
even though the lumosity is well beyond the range for which the relation was derived (see e.g., Wolfire & Cassinelli 1986).
Although the association of the radio knots in He 2-10 with Galactic UCH II regions appears appropriate, the two types of objects are not identical. In Figure 9 we plot the ratio of the observed fluxes for knot 4 to those of W49A after scaling the latter to a distance of 9 Mpc. W49A is one of the most well-studied Galactic UCH II complexes and has been resolved into at least 30 individual UCH IIs (De Pree et al. 1997; Conti & Blum 2001). We have taken the fluxes for W49A at the various frequencies from the results given by Mezger, Schraml, & Terzian (1967) and Ward-Thompson & Robson (1990). Figure 9 shows that flux ratio increases steadily with frequency, from a value of about 11 at 6 cm, to well over 200 at 12 . This suggests that the UDH IIs contain far more dust than UCH IIs relative to their ionizing luminosity. The trend in the flux ratio could be due to different mean ages for the stellar clusters within the two types of objects, as the ionizing luminosity from a cluster drops more rapidly than the bolometric luminosity as a cluster ages. However, such an explanation would require the mean age of the clusters in W49A to be substantially younger than those in the UDH IIs in He 2-10. With ages yr, the clusters embedded with the UDH IIs are clearly very young. If the mean age of the clusters within W49A were larger than that for the UDH IIs, one would expect the flux ratio to decrease with frequency, opposite of the trend seen in Figure 9.
Because the flux ratio in Figure 9 continues to increase from 100 to 12 , the relative fraction of hot dust (K) must be greater in the UDH IIs than in W49A. The increased fraction of hot dust in the UDH IIs in He 2-10 could be due to external heating from other starburst regions in the vicinty. Given the tremendous star formation activity occuring in the center of He 2-10, as well as the location of the knots close to, or on the edges of sites of vigorous star formation activity, this does not seem implausible. If external heating of the dust is significant, the bolometric luminosity (and hence the lower mass limits) for the embedded stellar clusters would be substantially smaller than we have estimated. However, the superb match between the radio and the -band morphologies, the rather spherical shapes of the -band knots, and the lack of any significant edge-brightening on the sides nearest the optical starburst regions suggests that the SSCs detected in the UV/optical HST images do not provide a substantial fraction of this heating. We can attempt to estimate their heating contribution in the following way. If we assume that the optical SSCs and the UDH IIs are at the same relative distance, we can use the effective radii of the UDH IIs measured from the -band image to compute the solid angle subtended by any knot as seen from the SSCs. Knot 4 has pc and is located about 40 pc from three SSCs seen in the UV and optical HST images of He 2-10. Assuming that these SSCs have masses of , we estimate the maximum available bolometric luminosity impinging on knot 4 from these sources is . This is less than % of the total infrared luminosity of the knot.
Chini, Krügel, & Wargau (1987) found a correlation between the bolometric luminosity of Galactic UCH IIs and their total gas mass,
| (9) |
Using the estimate of derived from our fit to the SED of knot 4, we find that the bolometric luminosity of this knot is factor of 3 larger than predicted by the relation above. As discussed above, it is certainly possible that the optically thin models underestimate the total gas mass. Nevertheless, again we find that the UDH IIs are overluminous in the far infrared relative to UCH IIs. The UDH IIs also do not lie on the size-density relation found by Garay et al. (1993) and Kim & Koo (2001) for Galactic UCH IIs []; they are either far too dense for their size (as measured by either their or ) or too large for their estimated electron density.
The results of these comparisons may indicate that the total dust mass required to form a stellar cluster of a given mass increases non-linearly with the cluster mass. This in turn would imply that the star formation efficiency varies with the mass of the embedded cluster and is not nearly as high in the UDH IIs as in the far less massive Galactic UCH IIs, which contain only one to a few massive O stars. However, given the uncertainties, and the numerous other possible explanations (both observational and physical) for the trend seen in Figure 9, this suggestion is clearly only speculative.
4.2 Implications for the Infrared-Radio Correlation and Ultraluminous Infrared Galaxies
There is a well-known correlation between the infrared and radio fluxes of galaxies over a wide range of Hubble types, first reported by van der Kruit (1971). This relation is typically represented by , the logarithm of the far-infrared(FIR)-to-radio flux ratio, given by
| (10) |
where is an approximation to the total flux between and m given by
| (11) |
where , , and are the flux densities at 1.49 GHz (in units of W m2 Hz-1) and 60m and 100m (in Jy), respectively.
Over a range of normal, irregular, and starburst galaxies is very robust with a small standard deviation: for a sample of galaxies with (see Sanders & Mirabel 1996 and references therein). For starburst galaxies selected from the IRAS Bright Galaxy Survey with , Condon et al. (1991b) find an average value of . However, they also find that the more infrared luminous galaxies tend to have larger values of . We have compiled values for a sample of 19 starburst galaxies with (corresponding to ; see Sanders & Mirabel 1996 for a definition of ) taken from Condon et al. (1991) and Carilli & Yun (2000). The mean and median values for this set of Ultra-Luminous Infrared Galaxies (ULIRGs) are and 2.44, respectively. Furthermore, those galaxies with high values tend to have compact radio sources. Condon et al. (1991b) hypothesized that most ULIRGs are powered by dense, compact starbursts which are optically thick at 1.49 GHz, and whose radio flux density is therefore suppressed relative to the far-infrared flux. Correcting for free-free absorption at 1.49 GHz yields an even tighter FIR-radio correlation. Such dense, optically thick starburst regions are exactly what our -band (and radio) observations of He 2-10 have revealed. The dusty infrared engine of this starburst galaxy turns out to be the young, compact UDH IIs first identified by KJ99, objects which are clearly related to nuclear stellar clusters, SSCs and, by extension, globular clusters.
It is interesting to estimate the for the extreme case of a galaxy composed entirely of UDH IIs. We estimated the fluxes at 1.49 GHz for each of the UDH IIs in He 2-10 from our model fits and derived from the SED points using Eq. 11. The resulting values are given in Table 2 and range from 3.7 (for knot 3) to 4.8 (for knot 4), far larger (as expected) than the typical values found for starbursts, and larger even than the typical values found for ULIRGs. For comparison, we also calculated for W49A. From the values given by Ward-Thompson & Robson (1990) for and , W m-2 for W49A. From Mezger, Schraml, & Terzian (1967), we have (1.41 GHz) Jy. These values yield for W49A, which is also significantly higher than the average value found in normal galaxies, starbursts, and most ULIRGs. (The fact that for W49A is smaller than the values found for the UDH IIs in He 2-10 reflects the result discussed above, namely that the UDH IIs are overluminous in the infrared relative to their radio flux, as compared with Galactic UCH IIs.)
Given the high value derived for the knots in He 2-10 and W49A, which are entirely dominated by extremely young and embedded massive stars, we might also expect to find high values for the galaxies in which we have detected UDH IIs. Using the IRAS Point Source Catalog fluxes, we find W m-2 for He 2-10 and W m-2 for NGC 5253. From KJ99, (1.42 GHz) mJy for He 2-10, and from Condon et al. (1990; see also Turner, Ho & Beck 1998), (1.49 GHz) mJy for NGC 5253. The resulting values are 2.63 and 2.65 for He 2-10 and NGC 5253, respectively, both significantly higher than the average value derived for starburst galaxies, but comparable with values found for ULIRGs. Even if we correct the radio flux from He 2-10 for free-free self-absorption according to the prescription given by Condon et al. (1991b), we find , well above the average value. These values demonstrate again that the total far-infrared spectra of these galaxies are dominated by the emission from the UDH IIs; in addition, the total radio fluxes must also have a component from the UDH IIs, whose spectra are powered by thermal free-free, rather than synchrotron, emission. They also suggest that values significantly larger than the mean of 2.34 may serve to identify starburst galaxies which host energetically dominant UDH IIs. Furthermore, because high values are typical of ULIRGs, it is possible that UDH IIs might have a significant role in powering the infrared luminosities of these galaxies.
The fact that the overall value for He 2-10 does not match those of the UDH IIs indicates that there is a significant contribution from non-thermal synchrotron emission to the total radio flux. This is confirmed by the radio spectral slope of , measured by Allen et al. (1976), Mendez et al. (1999), and KJ99. We can attempt to remove the non-thermal component and measure , the value associated with only the thermal component; this should reflect the values for the UDH IIs. Assuming that and that the intrinsic power spectrum index for synchroton emission is , we estimated the thermal fraction of the flux at 1.49 GHz from the observed radio spectral index and computed . We find for He 2-10. Carrying out the same procedure for the sample of 16 ULIRGs discussed above for which radio spectral indices are available, we find a mean value of and a median value of 3.13. Given the approximate nature of the separation into thermal and non-thermal components, these values are reasonably close to those determined for the individual UDH IIs in He 2-10.
How common might UDH IIs be among starburst galaxies? Beck et al. (2000) have recently carried out radio mapping of a small sample of nine Wolf-Rayet galaxies. In most of these, they find regions where the spectral slope increases with frequency, a signature of optically thick free-free emission. The estimated parameters for these regions are very similar to those of the UDH IIs seen in He 2-10 and NGC 5253. Hence UDH IIs appear to be quite common among this class of starbursts. Of course, Wolf-Rayet galaxies are identified by the signatures of young massive stars in their integrated spectra (e.g., Vacca & Conti 1992), so perhaps it is not surprising to find UDH IIs in these objects.
4.3 UDH IIs in Ultraluminous Infrared Galaxies?
The above discussion naturally leads to the question of whether the FIR flux in LIRGs and ULIRGs can possibly be produced by UDH IIs. With , He 2-10 clearly falls far short of the standard definition of a LIRG () or a ULIRG (; e.g., Sanders & Mirabel 1996). However, He 2-10 is also a dwarf galaxy with (Kobulnicky et al. 1995). Scaling its by the ratio of the molecular mass of a typical ULIRG, such as Arp 220 [; Radford, Solomon, & Downes 1991; Scoville, Yun, & Bryant 1997] to that of He 2-10, we would predict a “ massive He 2-10” to have and contain approximately 100 UDH IIs. This would imply that UDH IIs are needed to power the FIR emission from a ULIRG. Such a large number of UDH IIs, all with ages yr, and all located within a small radius of only a few hundred pc, perhaps seems unlikely. Nevertheless, the UDH II hypothesis is attractive as it naturally explains the large values found for ULIRGs, as well as the dust temperatures and small sizes estimated for the starburst regions in these objects. Perhaps a single very massive UDH II might be powering the FIR flux in these sources. Furthermore, because the dust masses in ULIRGs are so much higher than that found in He 2-10, it may well be possible that pressure confinement extends the lifetime of the UDH II phase in these objects. Finally, the above comparison reveals that either ULIRGs are overluminous relative to their mass compared to objects like He 2-10, and hence their star formation efficiencies are much higher, or that alone is not a good tracer of the total material available for cluster formation.
4.4 Implications for the Correlation for Starburst Galaxies
Meurer et al. (1997, 1999) have shown that the ratio of the FIR flux to that at 1600 Å is well correlated with the UV spectral slope, . This correlation has been interpreted as arising naturally from the fact that the hot stars which produce the UV flux heat the dust surrounding the star formation site where they were born. The dust absorbs and reprocesses the UV flux and emits it in the far infrared. Meurer et al. (1995) find that a foreground screen model and a fairly gray extinction curve provide the best fit to the observed correlation.
It is interesting to determine where He 2-10 and NGC 5253 lie on the vs diagram. Assuming that all of the observed flux in the IRAS bands for He 2-10 is the region seen in our -band image, and using the UV flux value for this region, corrected for Galactic extinction, given by Johnson et al. (2000), we find that . The value of , after correcting the observed UV spectrum for Galactic extinction, is . These values place He 2-10 slightly above the best fit line given by Meurer et al. (1999) but not far from it, and certainly within the spread of data points used to define the correlation. For NGC 5253, , and (Meurer et al. 1995), which place NGC 5253 very close to the best fit line given by Meurer et al. (1999).
Since most, and perhaps almost all, of the FIR flux in He 2-10 and NGC 5253 is generated by the compact radio knots, and does not represent reprocessed UV flux from the starbursts seen in the UV, optical, and near-infrared images of these galaxies, the obvious question then is, Why do these objects appear to follow the correlation between and ? The UV flux and the FIR emission are not generated by the same starburst regions. In fact, the UDH IIs individually cannot be plotted on this diagram at all, because they have no detectable UV flux.
Given that UDH IIs may well be quite common in starburst galaxies, and hence may dominate the FIR flux of these objects, it is surprising that the correlation demonstrated by Meurer et al. (1999) exists at all. In fact, it could be argued that this correlation indicates that UDH IIs cannot be common in starbursts or that their emission cannot dominate the FIR fluxes. However, the results presented by Beck et al. (2000), discussed above, directly contradict this argument. Alternatively, since at least some of the observed FIR flux must be due to dust heated by the UV-visible starbursts, although most of the FIR flux arises from UDH IIs, one might expect that the correlation shown by Meurer et al. (1997, 1999) should actually represent a lower envelope for an ensemble of starbursts. The fact that most ULIRGs do appear to lie above the correlation reinforces this suggestion (Meurer et al. 2000). If this is indeed the case, then perhaps much of the scatter seen in the vs correlation presented by Meurer et al. (1997, 1999) might be eliminated if the contribution of UDH IIs could be removed from the total FIR flux. On the other hand, the distribution of points around the correlation does not exhibit any substantial asymmetry toward higher values of , as one would expect if this relation is actually a lower envelope for starbursts in general.
In any case, if most of the FIR flux in starbursts is indeed due to UDH IIs, this immediately implies that the observed FIR and 1600 Å fluxes are not causally connected in the straightforward manner suggested by the simple foreground dust screen reddening/reprocessing picture presented by Meurer et al. (1995). Rather, the correlation between and might instead represent merely a trend in the dust content among starburst galaxies: starbursts containing more numerous UDH IIs are simply dustier in general. Hence, the reddening of the observed UV continuum appears to correlate with the ratio, even though the observed fluxes in the FIR and UV are not directly coupled.
The observed correlation in the vs diagram is naturally produced in the model presented by Charlot & Fall (2000) for dust absorption in starbursts. Charlot & Fall (2000) include the finite lifetime and optical depth of stellar birth clouds in their attempt to reproduce the inferred extinction law and the observed correlations of parameters in starburst galaxies. They find that, under the assumption of constant star formation, the presence and finite lifetimes ( yr) of these birth clouds are key to reproducing the empirical observation that the reddening derived from the is generally larger than that derived from the UV continuum. In this model, the ionizing photons responsible for the H lines arise primarily from hot stars deeply embedded in optically thick birth clouds, the UV arises from older stellar clusters whose birth clouds have dispersed, and the infrared emission is produced by dust reprocessing of non-ionizing UV flux from both populations in both environments (birth clouds and ambient ISM). However, most of the infrared emission (typically %; S. Charlot, private communication) is generated by the dust reprocessing in the birth clouds. The observed vs. correlation arises in this model as a result of a trend in the overall dust content of starbursts, as suggested by our findings, rather than extinction and reprocessing from a foreground screen of dust. Our Gemini results, in which % of the FIR flux is produced by young stellar clusters deeply embedded in their birth clouds, provide strong support for this model.
5 Summary and Conclusions
We have obtained -band (10.8 m) images of the starburst galaxy He 2-10 with OSCIR and the Gemini North Telescope. These images reveal the presence of four bright, compact knots (with effective radii on the order of 10-20 pc) which have no counterparts in the HST UV, HST optical, or ground-based near-infrared (, , and ) images. However, the -band morphology is extremely well-correlated with the radio maps presented by KJ99. Therefore, we identify these knots with the UDH II regions found by KJ99. The four knots comprise about % of the total -band flux from He 2-10. Assuming the morphology seen in the -band image persists to longer wavelengths (e.g., 100 m), we have scaled the observed IRAS fluxes from the galaxy by the fraction each knot contributes to the total -band flux and combined the resulting values with the -band and radio fluxes to generate SEDs for the individual knots. The SEDs bear a remarkable resemblance to those of Galactic UCH II regions. We have constructed simple models to match the SEDs and have derived physical parameters for each knot. We find that the electron densities in the ionized regions surrounding the stellar clusters are on the order of cm-3, and radii of these regions are between 2 and 5 pc. The masses of the surrounding dust shells are about . The radio and IR fluxes also allow us to place constraints on the properties of the embedded stellar clusters. For the brightest knot we find a mass and an age yr. The stellar clusters within all of the knots must have ages less than yr and masses greater than . Hence, we confirm the suggestion of KJ99 that the radio knots represent deeply embedded SSCs, and may be the youngest examples yet observed.
While the SEDs of the UDH IIs appear to be similar to Galactic UCH IIs, a comparison between the brightest -band knot (# 4) and the Galactic source W49A reveals that knot 4 emits far more IR flux relative to its radio flux than W49A. This suggests that, compared to Galactic UCH IIs, knot 4 contains far more dust relative to the ionizing luminosity of the embedded cluster. In addition, the fraction of hot dust is larger in this knot than in W49A. Furthermore, the UDH IIs do not follow the size-density relation found for Galactic UCH IIs. It is not clear what causes these differences. It is also not certain whether knot 4 consists of a single embedded stellar cluster or of several clusters, each surrounded by their own cocoons. Higher resolution radio and infrared observations would be useful to answer this question.
The logarithmic ratio of the radio to far-infrared flux densities, , for the UDH IIs in He 2-10 is . For both He 2-10 as a whole and NGC 5253, another nearby starburst known to host UDH IIs, . The latter value is significantly larger than the average found for normal galaxies, but comparable to the values of found for ultraluminous infrared galaxies. We suggest that large values for starburst galaxies may indicate that a significant fraction of the far-infrared flux may arise from dust emission from UDH IIs.
Recent radio surveys seem to indicate that such UDH IIs may be common among starburst galaxies. If this is indeed the case, a significant fraction of the star formation in these galaxies is occuring within regions that are completely hidden to UV, optical, and even near-infrared observations. This in turn raises important questions about the origin and meaning of the empirical correlation observed for samples of starbursts. Attempts to address these issues would benefit from a much larger sample of -band observations of nearby starburst galaxies.
References
- Allen et al. (1976) Allen, D. A., Wright, A. E., & Goss, W. M. 1976, MNRAS, 177, 91
- Baas et al. (1994) Baas, F., Israel, F. P., & Koornneef, J. 1994, A& A, 284, 403
- Beck, Kelly, & Lacy (1997) Beck, S. C., Kelly, D. M., & Lacy, J. H. 1997, AJ, 114, 585
- Beck, Turner, & Gorjian (2001) Beck, S. C., Turner, J. L., & Gorjian, V. 2001, AJ, 122, 1365
- Beck, Turner, & Kovo (2000) Beck, S. C., Turner, J. L., & Kovo, O. 2000, ApJ, 120, 244
- Böker et al. (1999) Böker, T., van der Marel, R. P., & Vacca, W. D. 1999, AJ, 118, 831
- Böker et al. (2001) Böker, T., van der Marel, R. P., Mazzuca, L., Rix, H.-W., Rudnick, G., Ho, L. C., & Shields, J. C. 2001, AJ, 121, 1473
- Bruzual & Charlot (1993) Bruzual, A., G., & Charlot, S. 1993, ApJ, 405, 538
- Carollo (1999) Carollo, C. M. 1999, ApJ, 523, 566
- Carollo, Stiavelli, & Mack (1998) Carollo, C. M., Stiavelli, M., & Mack, J. 1998, AJ, 116, 68
- Casali & Hawarden (1992) Casali, M. M., & Hawarden, T. G. 1992, in JCMT-Newsletter, 3, 33
- Charlot & Fall (2000) Charlot, S., & Fall, S. M. 2000, ApJ, 539, 718
- Chini, Krügel, & Wargau (1987) Chini, R., Krügel, E., & Wargau, W. 1987, A& A, 181, 378
- Churchwell (1990) Churchwell, E. 1990, A& A Rev, 2, 79
- Churchwell (1999) Churchwell, E. 1999, in The Origins of Stars and Planetary Systems, eds. C. J. Lada & N. D. Kyaflis, (Kluwer:Dordrecht), 515
- Churchwell, Wolfire, & Wood (1990) Churchwell, E., Wolfire, M. G., & Wood, D. O. S. 1990, ApJ, 354, 247
- Cohen & Barlow (1974) Cohen, M., & Barlow, M. J. 1974, ApJ, 193, 401
- Cohen et al. (1999) Cohen, M., Walker, R. G., Carter, B., Hammersley, P., Kidger, M., & Noguchi, K. 1999, AJ, 117, 1864
- Condon, Anderson, & Helou (1991) Condon, J. J., Anderson, M. L., & Helou, G., 1991a, ApJ, 376, 95
- Condon et al. (1991b) Condon, J. J., Huang, Z.-P., Yin, Q. F., & Thuan, T. X. 1991b, ApJ, 378, 65
- Condon & Broderick (1988) Condon, J. J. & Broderick, J. J. 1988, AJ, 96, 30
- Conti & Blum (2001) Conti, P. S., & Blum, R. D. 2001, ApJ, in press
- Crowther et al. (1999) Crowther, P. A., Beck, S. C., Willis, A. J., Conti, P. S., Morris, P. W., & Sutherland, R. S. 1999, MNRAS, 304, 654
- De Pree, Rodríguez, & Goss (1995) De Pree, C. G., Rodríguez, L. F., & Goss, W. M. 1995, Rev Mex Astr Ap, 31, 39
- De Pree, Mehringer, & Goss (1997) De Pree, C. G., Mehringer, D. M., & Goss, W. M. 1997, ApJ, 482, 307
- Draine & Lee (1984) Draine, B. T., & Lee, H. M. 1984, ApJ, 285, 89
- Garay et al. (1993) Garay, G., Rodríguez, L., Moran, J. M., & Churchwell, E. 1993, ApJ, 418, 368
- García-Segura & Franco (1996) García-Segura, G., & Franco, J. 1996, ApJ, 469, 171
- Gorjian, Turner, & Beck (2001) Gorjian, V., Turner, J. L., & Beck, S. C. 2001, astro-ph/0103101
- Helou, Soifer, & Rowan-Robinson (1985) Helou, G., Soifer, B. T., & Rowan-Robinson, M. 1985, ApJ, 298, L7
- Hodapp et al. (1996) Hodapp, K.-W., et al. 1996, NewAst, 1, 177
- Hunter et al. (1986) Hunter, D. A., Gillett, F. C., Gallagher, J. S., III, Rice, W. L., & Low, F. J. (1986), ApJ, 303, 171
- Jim et al. (2000) Jim, K., et al. 2000 PASP, 112, 716
- Johnson et al. (2000) Johnson, K. E., Leitherer, C., Vacca, W. D., & Conti, P. S. 2000, AJ, 120, 1273
- Johnson et al. (2001) Johnson, K. E., Kobulnicky, H. A., Massey, P., & Conti, P. S. 2001, ApJ, 559, 864
- Kobulnicky et al. (1995) Kobulnicky, H. A., Dickey, J. M., Sargent, A. I., Hogg, D. E., & Conti, P. S. 1995, AJ, 110, 116
- Kobulnicky & Johnson (1999) Kobulnicky, H. A., & Johnson, K. E. 1999, ApJ, 527, 154 (KJ99)
- Krisciunas et al. (1987) Krisciunas, K., Sinton, W., Tholen, D., Tokunaga, A., Golisch, W., Griep, D., Kaminski, C., Impey, C., & Christian, C. 1987, PASP, 99, 887
- Leinert et al. (2000) Leinert, C., et al. 2000, in Interferometry in Optical Astronomy, Proc. SPIE, 4006, 43
- Leitherer et al. (1999) Leitherer, C. et al. 1999, ApJS, 123, 3
- Lopez et al. (2000) Lopez, B., et al. 2000, in Interferometry in Optical Astronomy, Proc. SPIE, 4006, 54
- Madden (2000) Madden, S. 2000, NewAR, 44, 249
- Mathis et al. (1977) Mathis, J. S., Rumpl, W., & Nordsieck, K. H. 1977, ApJ, 217, 425
- Mendez et al. (1999) Mendez, D. I., Esteban, C. Filopovic, M. D., Ehle, M., Haberl, F., Pietsch, W., & Haynes, R. F. 1999, A& A, 349, 801
- Mengel et al. (2000) Mengel, S., Lehnert, M. D., Thatte, N., Tacconi-Garman, L. E., & Genzel, R. 2001, ApJ, 550, 280
- Meurer et al. (1995) Meurer, G. R., Heckman, T. M., Leitherer, C., Kinney, A., Robert, C., & Garnett, D. R. 1995, AJ, 110, 2665
- Meurer et al. (1997) Meurer, G. R., Heckman, T. M., Lehnert, M. D., Leitherer, C., & Lowenthal, J. 1997, AJ, 114, 54
- Meurer et al. (1999) Meurer, G. R., Heckman, T. M., & Calzetti, D. 1999, ApJ, 521, 64
- Meurer et al. (2000) Meurer, G. R., Heckman, T. M., Seibert, M., Goldader, J., Calzetti, D., Sanders, D., & Steidel, C. C. 2000, in Highlights of Astronomy, 12, eds. D. J. Wilner et al. in press
- Mezger, Schraml, & Terzian (1967) Mezger, P. G., Schraml, J., & Terzian, Y. 1967, ApJ, 150, 807
- Mohan et al. (2001) Mohan, N. R., Anantharamaiah, K. R., & Goss, W. M. 2001, astro-ph/0104407
- Puxley et al. (1991) Puxley, P. J., Brand, P. W. J. L., Moore, T. J. T., Mountain, C. M., & Nakai, N. 1991, MNRAS, 248, 585
- Radford et al. (1991) Radford, S. J. E., Solomon, P. M., & Downes, D. 1991, ApJ, 368, L15
- Scoville, Yun, & Bryant (1997) Scoville, N. Z., Yun, M. S., Bryant, P. M. 1997, ApJ, 484, 702
- Sanders & Mirabel (1996) Sanders, D. B., & Mirabel, I. F. 1996, ARA&A, 34, 749
- Sauvage, Thuan, & Lagage (1997) Sauvage, M., Thuan, T. X., & Lagage, P. O. 1997, A&A, 325, 98
- Smith et al. (2000) Smith, N., Jackson, J. M.,Kraemer, K. E.,Deutsch, L. K., Bolatto, A., Hora, J. L., Fazio, G., Hoffmann, W. F., & Dayal, A. 2000, ApJ, 540, 316
- Spitzer (1978) Spitzer, L., Jr. 1978, Physical Processes in the Interstellar Medium, New Yok: Wiley-Interscience, 254
- Tarchi et al. (2000) Tarchi, A., Neininger, N., Greve, A., Klein, U., Garrington, S. T., Muxlow, T. W. B., Pedlar, A., & Glendenning, B. E. 2000, A& A, 358, 95
- Telesco, Dressel, & Wolstencroft (1993) Telesco, C. M., Dressel, L. L., & Wolstencroft, R. D. 1993, ApJ, 414, 120
- Turner, Ho, & Beck (1998) Turner, J. L., Beck, S. C., & Ho, P. T. P. 1998, ApJ, 532, L109
- Ulvestad & Antonucci (1997) Ulvestad, J. S., & Antonucci, R. R. J. 1997, ApJ, 488, 621
- Vacca (1994) Vacca, W. D. 1994, ApJ, 421, 140
- Vacca (1997) Vacca, W. D. 1997, in The Ultraviolet Universe at Low and High Redshift: Probing the Progress of Galaxy Evolution, (AIP: New York), eds. W. H. Waller, M. N. Fanelli, J. E. Hollis, & A. C. Danks, 21
- Vacca & Conti (1992) Vacca, W. D., & Conti, P. S. 1992, ApJ, 401 543
- van der Kruit (1971) van der Kruit, P. C. 1971, A&A, 15, 110
- Ward-Thompson & Robson (1990) Ward-Thompson, D. & Robson, E. I. 1990, MNRAS, 244, 458
- Whitmore (2000) Whitmore, B. 2000, in Celebrating 10 Years of HST, May 2000, in press
- Whittet (1992) Whittet, D. C. 1992, Dust in the Galactic Environment, (IOP: London), 73
- Wilner, Welch, & Forster (1995) Wilner, D. J., Welch, W. J., & Forster, J. R. 1995, ApJ, 449, L73
- Wolfire & Cassinelli (1986) Wolfire, M. G., & Cassinelli, J. P. 1986, ApJ, 310, 207
- Wood & Churchwell (1989) Wood, D. O., & Churchwell, E. 1989, ApJS, 69, 831
- Wunderlich, Klein, & Wielebinski (1987) Wunderlich, E., Klein, U., & Wielebinski, R. 1987, A&AS, 69, 487
- Zhao et al. (1997) Zhao, J.-H., Anantharamaiah, K. R., Goss, W. M., & Viallefond, F. 1997, ApJ, 482, 186
- Zinnecker (1987) Zinnecker, H. 1987, in Starbursts and Galaxy Evolution, eds. T. X. Thuan, T. Montmerle, & J. T. T. Van (Gif-sur-Yvette: Editions Frontières), 165


| Object | Flux (mJy) | N mag | (pc) |
|---|---|---|---|
| 1 & 2 | 15.7 | ||
| 3 | 17.1 | ||
| 4 | 21.0 | ||
| 5 | 10.3 |
| Wavelength | Flux (mJy) | |||
|---|---|---|---|---|
| knots 1&2 | knot 3 | knot 4 | knot 5 | |
| m | 101 17 | 41 9 | 226 31 | 65 13 |
| m | 153 36 | 62 17 | 342 74 | 98 25 |
| m | 913 208 | 371 99 | 2043 421 | 588 149 |
| m | 3378 811 | 1371 383 | 7558 1663 | 2174 574 |
| m | 3703 889 | 1503 419 | 8287 1823 | 2383 629 |
| cm | 1.40 0.21 | … | 2.25 0.52 | 1.25 0.29 |
| cm | 2.00 0.28 | 0.89 0.18 | 1.73 0.34 | 1.04 0.21 |
| cm | 1.38 0.19 | 0.89 0.18 | 1.10 0.22 | 0.57 0.12 |
| 4.2 | 3.7 | 4.8 | 4.6 | |
| Parameter | knots 1&2 | knot 3 | knot 4 | knot 5 |
|---|---|---|---|---|
| Ionized Region | ||||
| (cm-3) | 2240 | 1400 | 4290 | 5720 |
| (pc) | 4.2 | 4.7 | 2.9 | 2.0 |
| EM (cm-6 pc)a | ||||
| Dust Shell | ||||
| (pc) | 4.2 | 4.7 | 2.9 | 2.0 |
| (pc) | 170 | 198 | 115 | 91 |
| (K) | 190 | 192 | 189 | 194 |
| (K) | 29 | 28 | 29 | 28 |