The nature of the bright submillimeter galaxy population: a radio pre-selected sample with
Abstract
Deep submillimetre surveys have successfully detected distant, star-forming galaxies, enshrouded in vast quantities of dust and which emit most of their energy at far infrared wavelengths. These luminous galaxies are an important constituent of the Universal star-formation history, and any complete model of galaxy evolution must account for their existence. Although these sources have been tentatively identified with very faint and sometimes very red optical counterparts, their poorly constrained redshift distribution has made their interpretation unclear. In particular, it was not understood if these galaxies had been missed in previous surveys, or if they constituted a truly new class of objects, undetectable at other wavelengths. By utilizing a radio selection technique, we have isolated a sample of 20 sub-mm objects representative of the 850m population brighter than 5 mJy with 3. We show that these galaxies are so heavily dust obscured that they remain essentially ’invisible’ to ultraviolet selection. Furthermore, relying on the radio-submillimeter flux density ratio, we estimate their redshift distribution, finding a median of two. These results are inconsistent with the existence of a very high redshift () population of primeval galaxies (L h-2 ) contributing substantially to the sub-mm counts. While not a substitute for the thorough followup of blank field sub-mm surveys, our results do shed light on a substantial portion of the luminous sub-mm population with 3.
Subject headings:
galaxies: clusters: general – galaxies: evolution – galaxies: formation – submillimeter: galaxies – radio continuum: galaxies1. Introduction
The extragalactic far-infrared background light is believed to be composed of the integrated thermal starlight and non-thermal AGN radiation, reradiated by dust within star-forming galaxies over the entire history of galaxy formation. The energy density of this infrared background is approximately the same as found in the optical suggesting that at least half of the Universal star-formation history remains hidden from optical view (Puget et al. 1996). This diffuse background was first resolved into discrete sources by the Sub-millimetre Common User Bolometer Array (SCUBA – Holland et al. 1999) on the James Clerk Maxwell Telescope (JCMT) by a number of groups (Smail et al. 1997, Hughes et al. 1998, Barger et al. 1998, Eales et al. 1999).
Although a large number of deep SCUBA surveys has led to a better estimate of the 850 micron galaxy surface density, our understanding of the nature of the sub-mm population remains limited. The principal obstacle is obtaining reliable counterparts of these sub-mm sources at other wavelengths, a problem exacerbated by both the coarseness of the JCMT resolution (15 arcsec at 850 microns) and the inherent faintness of suspected optical counterparts (Smail et al. 1999). It is still unclear if the sub-mm selected sources are related to known populations, such as high redshift quasars (Hughes et al. 1997, McMahon et al. 1999) or Lyman-break galaxies (Chapman et al. 2000a), or constitute a truly new class of objects. With the exception of several isolated objects, few reliable identifications have been made (e.g. Ivison et al. 1998, Frayer et al. 1998). Thus the redshift distribution has remained largely unconstrained over a vast range, with the possibility that many sources lay at extreme distances ().
One technique, which has shown some promise in identifying sub-mm sources, is radio continuum followup. Because galaxies and the inter-galactic medium are transparent at centimeter wavelengths, radio emission is unhindered by intervening gas and dust. Ubiquitous in local star-forming galaxies, radio emission also correlates very strongly with the far-infrared emission in star-forming galaxies (Helou et al. 1986). Moreover, the high resolution provided by radio interferometers can provide a surrogate for the poor sub-mm angular resolution and astrometric uncertainties.
Given the difficulties of obtaining secure optical identifications and spectroscopic redshifts, the radio observations provide another clue to the nature of sub-mm sources. Via the empirically observed far-infrared to radio correlation in local star-forming galaxies, one can use the observed ratio of sub-mm to radio continuum flux density to estimate a redshift. As the k-corrections (corrections based on the redshifted spectral energy distribution - SED) of the radio and sub-mm flux densities are opposite in slope, the ratio of radio to sub-mm flux density is quite sensitive to redshift (Carilli & Yun 1999).
Barger, Cowie & Richards (2000 – hereafter BCR) first attempted to use a radio selected sample to target a number of optically faint microJansky radio sources with near-infrared magnitude, . Using SCUBA to a 3 RMS limiting flux density of 6 mJy at 850 microns, they detected 5 out of 15 radio sources, while in the process demonstrating that none of the optically brighter radio sources () were detected in the sub-mm. The surface density of these few bright radio selected sub-mm sources closely matched that from blank field surveys, indicating a close correspondence between the optically faint radio population and bright sub-mm sources. Other pointed SCUBA studies of known high- populations such as Lyman-break galaxies (LBGs – Chapman et al. 2000a) and radio loud AGN (Archibald et al. 2000) have revealed few SCUBA detections, and nowhere near the surface density of blank field sub-mm sources.
We have refined the selection criterion to those microJansky radio sources with an optical magnitude, , based on the clear bi-modal break in the optical properties of microJy radio sources (Richards et al. 1999). We have applied this technique to a sample in the region surveyed by Richards (2000) centered on the Hubble Deep Field. We have selected a total of 47 radio sources in our study, 20 previously observed, which meet our criterion. Our followup SCUBA photometry observations of 27 radio selected objects demonstrate this to be a highly successful technique. We now detect 50% of the new 27 object sample above 4.5 mJy at 850 microns, with an overall success rate of 20 out of 47 objects observed. Our increased detection success over BCR is likely to be a result of our slightly deeper survey coupled with the stricter selection criterion. We are thus able to uncover bright sub-mm sources using SCUBA at the rate of one source per hour on the JCMT, greater than an order of magnitude more rapid than mapping a random patch of sky. Our new survey represents a sub-mm mapping of a 100 arcmin2 effective region in less than 16 hours, sensitive to sources S mJy and 3.
2. Source Selection and Sub-mm Observations
The HDF region has previously been imaged at 1.4 GHz using the Very Large Array (VLA) radio telescope by Richards (2000) to a completeness of 40 Jy. We aligned a deep -band optical image described in Barger et al. (1999), with the VLA FK5 astrometric frame by using 102 of 333 radio sources which lie within the 30′ 30′ optical field of view. After alignment, 60 radio sources were determined not to have any optical identifications within 2 arcsec of the radio position brighter than . Of these, 17 have previously been described in Richards et al. (1999). Several of these were followed up as part of the sub-mm study of BCR. Of the increased sample of 60 optically faint radio objects, we chose to concentrate on the 40 which had previously not been observed by BCR or Hughes et al. (1998). Time constaints allowed us to observe only 27 of these, although these were selected at random with no further selection bias.
We observed each of the radio sources using the JCMT/SCUBA at 850/450 microns in photometry mode for an effective integration time between 600s and 2000s. The secondary was chopped at 7.8125 Hz, using a chop throw (50″) and direction chosen to keep the source in a bolometer throughout the observation. Pointing was checked before and after the observation on blazars and sky-dips were performed to measure the atmospheric opacity directly. The RMS pointing errors were below 2 arcsec, while the average atmospheric zenith opacities at 450 and 850 microns were 1.7 and 0.24 respectively. The data were reduced using the Starlink package SURF (Scuba User Reduction Facility – Jenness et al. 1998), and our own reduction routines to implement the three bolometer chopping mode. Spikes were first carefully rejected from the data, followed by correction for atmospheric opacity and sky subtraction using the median of all the array pixels, except for obviously bad pixels and the source pixels. The data were then calibrated against standard planetary and compact HII region sources, observed during the same nights.
Additionally, we reanalysed the SCUBA data from BCR and found their source ‘3’ to have a 3 detection (5.31.7 mJy), which we include in our present sample. We also include the sub-mm source HDF850.2 from the Hughes et al. 1998 study, having a radio source counterpart S40Jy and .
3. Analysis and Discussion
The crucial data available to us from our technique are the optical properties and redshift estimates for the sub-mm sources, which we present in Table 1. Our results assume a , , H0=65 km/s/Mpc cosmology. Redshift estimates can be obtained from the sub-mm/radio flux ratios (Carilli & Yun 2000). All of our sub-mm sources fall roughly in the redshift range with a median redshift for the sample of , consistent with previous results from BCR. The sensitivity of our radio survey to star-forming galaxies with radio luminosities fainter than W/Hz diminishes quickly past , and hence biases our sub-mm survey. An independent check on the sub-mm/radio redshift estimates can be obtained through the 450m/850m ratio (e.g. Hughes et al. 1998). Subject to unknown dust temperature, we obtain an estimate of Td/(1+), which we list in Table 1 for Td=45 K for consistency with the ultra-luminous infrared galaxy, Arp 220. Raising or lowering the adopted dust temperature has the effect of a corresponding systematic raising and lowering of both our redshift estimates (Blain 1999).
In order to calculate the density of sub-mm sources on the sky as found in our radio pre-selection survey, we need to determine the effective area covered by our study. This is given simply by the overlap regions between the optical and radio images. However, a further complication arises from the non-uniform sensitivity of the radio image which serves to decrease the visibility area. This issue is discussed in Richards (2000) and we use the same method for determining the source count.
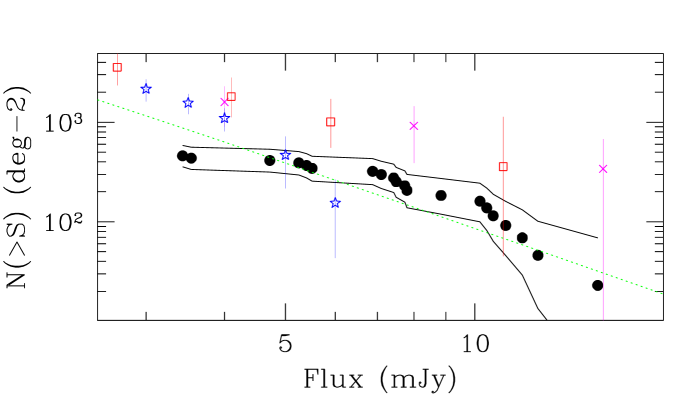
Our pre-selected sample has already saturated the bright ( mJy) sub-mm counts (Fig. 1), and there are not likely to be many additional bright, high redshift sub-mm sources in our survey region. BCR found that 2 additional sub-mm sources without radio counterparts were detected in their survey area, indicating 75% of the bright sub-mm sources are typically recovered through such radio pre-selection. Since we performed photometry on the sources, we have no means of estimating this extra population. By accounting for such an additional 25% high redshift population our sample is in agreement with analyses of the redshifts for lensed sub-mm sources (Barger et al. 1999, Smail et al. 2000, Blain et al. 1999b). The percentage of sub-mm sources missed by our pre-selection technique will depend field to field on the high- clustering of sub-mm luminous sources. A lensed sub-mm survey (Smail et al. 2000) detects a similarly large fraction of their bright sub-mm sources in the radio. Deeper blank field sub-mm surveys (e.g. Eales et al. 2000 – S850μm3 mJy) detect 1/3 of their sources in the radio. This is roughly in agreement with our results which use deeper radio maps and brighter sub-mm limits. While not a substitute for the thorough (and difficult) followup of blank field sub-mm surveys, our results do shed light on a substantial portion of the luminous sub-mm population with 3.
At the faint end of the counts, our pre-selected sources appear to fall short of full source counts recovery, and the interesting question becomes what is the nature of the 850-micron sources at flux densities 5 mJy? Although we are only sensitive to sources with S8505 mJy, we can deduce important properties about the fainter sub-mm population. Averaging our sub-mm undetected sample (inverse variance weighted) reveals a mean flux of S mJy, suggesting that many of these 50% of our and S Jy radio sample are still fairly luminous sub-mm sources. They likely form a continuous distribution with the S8505 mJy sample, lie at similar or lower redshifts (Table 1), and comprise roughly 10% of the blank field SCUBA source counts from 1–5 mJy. This leaves a large portion of sub-mm sources fainter than 5 mJy that are not subsumed in our present radio sample.
The first possibility is that these fainter sub-mm sources are largely contained in our present radio surveys, but are actually optically bright (). Bright LBGs are known to emit at the 1–2 mJy level (Chapman et al. 2000a, Peacock et al. 2000), so they must contribute some fraction of the missing sources. This is consistent with the high SFR deduced by Steidel et al. 1999, who apply a large dust correction to their results. Our Arp 220 SED model suggests that these sources would be detected in our present radio survey almost out to . However, the HDF-SCUBA results (Hughes et al. 1998, Peacock et al. 2000) also show directly that a significant fraction of the 2 mJy sources are not associated with bright LBGs. Although deeper radio observations with optically faint counterparts may quickly recover this population, it also remains a possibility that these sources represent high redshift () protogalaxies with L , which would remain undetected in the radio to significantly deeper flux limits. So by pushing to fainter radio limits, it is rather unclear what types of objects might be pre-selected.
An additional concern with the sub-mm source population is that massive AGN may be heating the dust rather than star formation. We can be reasonably certain that our radio selected sub-mm sources are not driven primarily by AGN for two reasons. Firstly, the sources are spatially resolved with a median of about 2″ in the radio using the Merlin interferometer at a resolution of 0.2″ (Richards 2000, Muxlow et al. 2000), corresponding to 1 kpc at for our adopted cosmology. If the radio and associated sub-mm emission were emanating from such a compact active nucleus (AGN), it would appear unresolved even at this fine resolution. Secondly, the sub-mm sources have recently been shown to have little or no overlap with X–ray sources as observed with the Chandra satellite (e.g. Fabian et al. 2000, Hornschemeier et al. 2000, Barger et al. 2001). As scenarios which would obscure even the X–ray emission are improbable, the implication is that most bright sub-mm sources are in fact driven by star formation.
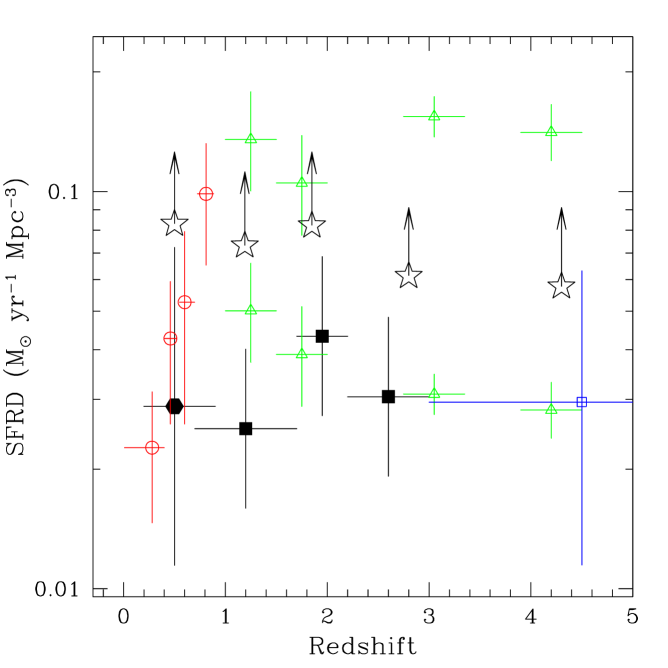
Assuming then that our radio-selected sources are driven primarily by star formation, it is appropriate to use our data to estimate a contribution to the comoving star formation rate density (SFRD). In Fig. 2, we integrate over our measured counts in three redshift bins, and divide by the effective volume of our detected sources, to represent the sub-mm SFRD as a function of redshift. Since we have assumed the far-IR/radio relation in the redshift estimates, our SFRD estimates can be derived from either wavelength in a manner similar to BCR. We plot our new points as solid squares (sub-mm detected objects) and a solid hexagon (sub-mm undetected objects). The very high redshift open square () represents the Hubble Flanking Fields sub-mm sources undetected in the radio from BCR and Borys et al. 2001. We then compare optically selected sources (open triangles) at redshifts (Connolly et al. 1997, Steidel et al. 1999). We apply a dust correction to the optical points for , using the Steidel et al. (1999) prescription (factor 5 for ). This is roughly in accord with the expected correction from the Chapman et al. (2000b) sub-mm measurement of 33 LBGs with large expected star formation rates. Lower redshift radio selected sources with bright optical counterparts, as analysed by Haarsma et al. (2000) are also plotted (red open circles) requiring no correction factor for dust obscuration.
Sub-mm sources fainter than 5 mJy likely begin to merge with optically selected samples (e.g. Adelberger & Steidel 2000). However, our radio selected population is truly an orthogonal population to those discovered in optical surveys, even for S8505 mJy. We can then confidently sum the optically selected (but uncorrected for dust) () and sub-mm () points from 1–4 to arrive at a conservative lower limit to the total SFRD of all presently known objects (plotted as large stars with arrows). This lower limit can be compared with the dust corrected optical points, which is still a rather uncertain procedure.
We have therefore recovered the majority of the bright ( mJy) sub-mm sources with a statistically significant sample, selected based on the microJy radio emission with extremely faint optical counterparts. We can state with some assurance that the bulk of bright sub-mm selected sources represent a highly dust obscured star forming population which would be very difficult to identify in optically based surveys. Our redshift analysis has also demonstrated that this is not because the sub-mm sources are at very high redshifts (). These sources may represent the epoch in which the most massive spheroid galaxies were being formed through merging fragments in cluster environments. Indeed, the recent identification of prodigious sub-mm emission with highly over-dense cluster cores at and (Chapman et al. 2000c and Ivison et al. 2000 respectively) suggests that the most luminous members of our sub-mm source sample may highlight similar such regions. Pushing our study to fainter sub-mm and radio flux limits will facilitate our understanding of the transition and overlap between these ultra-luminous high star formers (which may evolve into the most massive spheroids in the present epoch) and the less massive galaxies selected in the optical through the Lyman-break technique (Steidel et al. 1999).
References
- (1) Adelberger, K., Steidel, C., 2000, ApJ, In press
- (2) Archibald, E., et al., 2000, MNRAS, In press
- (3) Barger et al. 2001, AJ, in press, astro–ph/0007175
- (4) Barger, A., Cowie, L., Richards, E., 2000, AJ, 119, 2092
- (5) Barger, A., et al., 1999a, AJ, 117, 102
- (6) Barger, A., et al., 1999b, AJ, 117, 2656
- (7) Barger, A., et al., 1998, Nature, 394, 293
- (8) Blain, A., 1999, MNRAS, 309, 995
- (9) Blain, A., Kneib, J.-P., Ivison, R.J., Smail, I., 1999a, ApJL, 512, 87
- (10) Blain, A., Jameson, A., Smail, I., Longair, M., Kneib, J.-P., Ivison, R.J., 1999b, MNRAS, 309, 715
- (11) Borys, C., Chapman, S., Halpern, M., Scott, D., 2000, UMass/Amherst “Deep sub-mm surveys”, astro–ph/0009134
- (12) Carilli, C., Yun, M., 1999, ApJL, 513, 13
- (13) Carilli, C., Yun, M., 2000, ApJ, 530, 618
- (14) Chapman, S., et al., 2000a, MNRAS, In press, astro–ph/9909092
- (15) Chapman S., Scott D., Borys C., Halpern M., 2000b, UMass/Amherst “Deep sub-mm surveys”, astro–ph/0009152
- (16) Chapman, S., et al., 2000c, ApJL, In press, astro–ph/0010101
- (17) Chapman, S., Scott, D., Borys, C., Fahlman, G., 2001, MNRAS, submitted, astro–ph/0009134
- (18) Connolly, A., et al., 1997, ApJ 486, L11
- (19) Eales, S., et al, 1999, ApJ, 515, 518
- (20) Eales, S., et al, 2000, AJ, In press
- (21) Fabian, A., et al, 2000, ApJ, In press
- (22) Haarsma, D.B., Partridge, R.B., Windhorst, R.A., Richards, E.A., 2000, ApJ, in press
- (23) Frayer, D., et al., 1998, ApJ, 506, L7
- (24) Helou, G., Soifer, B.T., Rowan-Robinson, M., 1986, ApJ, 298, L7
- (25) Holland, W., et al., 1999, MNRAS, 303, 659
- (26) Hornschemeier, A.E., et al., 2000, ApJ, In press
- (27) Hughes, D., et al., 1998, Nature, 394, 241
- (28) Hughes, D., Dunlop, J., Rawlings, S., 1997, MNRAS, 289, 766
- (29) Ivison, R., et al., 1998, MNRAS, 298, 58
- (30) Ivison, R., et al., 2000, ApJ, In press, astro–ph/0005234
- (31) Jenness, T., et al., 1998, SPIE, 3357, 548
- (32) McMahon, R., et al., 1999, MNRAS, 309, 1L
- (33) Muxlow, T.W.B., Wilkinson, P.N., Richards, A., Kellerman, K., Richards, E., Garrett, M., 2000, New Astronomy 43, 623
- (34) Peacock, J., et al., 2000, MNRAS, In press
- (35) Puget, J.-L., et al., 1996, A&A 308, L5
- (36) Richards, E., 2000, ApJ 533, 611
- (37) Richards, E., et al., 1999, ApJ, 526, 73L
- (38) Smail, I., et al., 2000, ApJ, 528, 612
- (39) Smail, I., et al., 1999, MNRAS, 308, 1061
- (40) Smail, I., Ivison, R.J., Blain, A.W., 1997, ApJ, 490, L5
- (41) Steidel, C., Adelberger, K., Giavalisco, M., Dickinson, M., Pettini, M., 1999, ApJ, 519, 1
| source | ||||
|---|---|---|---|---|
| (Jy) | (mJy) | |||
| 1 | 14313.2 | 8.32.8 | 2.2 | n/a |
| 2 | 98.710.3 | 5.51.8 | 2.0 | |
| 3 | 58.49.00 | 8.82.1 | 2.9 | |
| 4 | 21213.7 | 5.41.9 | 1.3 | |
| 5 | 26217.1 | 6.92.0 | 1.5 | |
| 6 | 74.49.00 | 11.63.5 | 3.0 | n/a |
| 7 | 78.89.10 | 10.43.4 | 2.9 | n/a |
| 8 | 26418.4 | 3.51.2 | 1.0 | |
| 9 | 66035.8 | 4.71.6 | 0.6 | |
| 10 | 17012.8 | 10.22.7 | 2.0 | |
| 11 | 55130.6 | 7.42.2 | 1.0 | |
| 12 | 13210.1 | 7.72.4 | 2.0 | n/a |
| 13 | 59530.9 | 15.72.4 | 1.4 | |
| 14 | 37825.9 | -0.62.5 | 1.0 | |
| 15 | 11711.9 | 0.72.1 | 1.6 | |
| 16 | 19314.7 | -1.22.1 | 1.2 | |
| 17 | 11810.6 | 2.31.6 | 1.4 | |
| 18 | 35422.2 | 2.01.9 | 0.9 | |
| 19 | 55.49.10 | 2.12.4 | 2.2 | |
| 20 | 80.69.30 | 2.12.2 | 1.9 | |
| 21 | 11111.4 | -0.92.2 | 1.6 | |
| 22 | 15911.7 | 3.22.3 | 1.4 | |
| 23 | 20215.4 | 1.52.2 | 1.2 | |
| 24 | 30717.4 | -0.72.2 | 1.0 | |
| 25 | 50630.2 | -4.63.0 | 0.9 | |
| 26 | 70836.9 | 3.21.9 | 0.6 | |
| 27 | 6580330 | -0.53.7 | 0.02 |
References. —
a) Redshift estimates from the sub-mm/radio index using the Carilli & Yun (2000) indicator.
b) An independent check on the sub-mm/radio redshift estimates through the 450m/850m limit (e.g. Hughes et al. 1998) and a dust temperature Td=45 K, consistent with Arp220. The 450m measurement is often not sufficient to provide a useful limit (listed ‘n/a’).