CorMASS: A Compact and Efficient NIR Spectrograph for Studying Low-Mass Objects11affiliation: Observations made at the Palomar Observatory were made as part of a continuing collaboration between the California Institute of Technology and Cornell University. The 60-inch telescope at Palomar Mountain is jointly owned by the California Institute of Technology and the Carnegie Institution of Washington.
Abstract
CorMASS (Cornell Massachusetts Slit Spectrograph) is a compact, low-resolution (), double-pass prism cross-dispersed near-infrared (NIR) spectrograph in operation on the Palomar Observatory 60-inch telescope. Its 2-dimensional spectral format provides simultaneous coverage from to (źJHK bands). A remotely operated cold flip mirror permits its NICMOS 3 detector to function as a slit viewer to assist object placement into the slit. CorMASS was primarily designed for the rapid spectral classification of low-mass stellar and sub-stellar objects identified by the Two-Micron All Sky Survey (2MASS). CorMASS’ efficiency and resolution also make it a versatile instrument for the spectral observation and classification of many other types of bright objects () including quasars, novae, and emission line objects.
PASP, accepted 30 Oct 2000
1 Introduction
Recent successes by deep near-infrared (NIR) surveys such as the Two Micron All Sky Survey (2MASS; (Skrutskie et al., 1997)), the Deep Near-Infrared Survey (DENIS; (Epchtein, 1997)), and the Sloan Digital Sky Survey (SDSS; (Gunn & Weinberg, 1995)) in identifying very low-mass stellar and sub-stellar field candidates have made a tremendous impact upon the study of low-mass objects in the local stellar neighborhood. Spectroscopic follow-up of low-mass survey candidates has revealed objects with atmospheric features different from the TiO and VO features seen in the atmospheres of M-dwarfs. Two new classifications, L with (Kirkpatrick et al., 2000a) and T with (Fegley & Lodders, 1996; Burrows & Sharp, 1999; Kirkpatrick et al., 2000a), have been proposed to account for the unique spectral characteristics of these objects at and below the bottom of the main sequence (Martín et al., 1997; Kirkpatrick et al., 1999). L-dwarf spectra are dominated by metallic hydrides and alkali atomic features as the oxides of M-dwarfs condense into solids at these cooler atmospheric temperatures. T-dwarfs show the distinctive absorption features at and . Gl 229B is the archetypical T-dwarf (Nakajima et al., 1995; Oppenheimer et al., 1998).
Motivated by the potential identification of a few candidate L and T-dwarfs in the northern sky by 2MASS (Reid et al., 1999), we have built a spectrograph specifically for the efficient confirmation and classification of low-mass object candidates. This paper describes the Cornell Massachusetts Slit Spectrograph (CorMASS) and presents a sample of spectral observations from its first runs on the Palomar 60-inch telescope.
CorMASS is a double-pass prism cross-dispersed NIR grating spectrograph. Simultaneous wavelength coverage spans from to the HgCdTe NICMOS 3 array cut-off at (the źJHK photometric bands)111ź is a SDSS photometric band with and . The long wave cut-off is determined by CCD sensitivity (Fukugita et al., 1996).. This wavelength coverage is dispersed into 6 orders on the array. A spectral resolution of maximizes signal from relatively faint objects, while keeping resolution high enough to identify features of the target between blended airglow lines, including in H-band. An externally driven cold flip mirror permits the reflective slit to be imaged in on the NICMOS 3 array using a complementary optical train.222 is a passband created for the 2MASS survey by one of us (M. Skrutskie). This band is shortened and shifted blue-ward compared to the conventional K-band to reduce in-band thermal emission (Persson et al., 1998). The slit viewer’s field-of-view (FOV) enables rapid object identification and accurate placement of science targets into the slit for spectroscopy. The compact instrument optical and mechanical design occupies an cooled volume of inside the Dewar.
After presenting our scientific requirements for the instrument in §2, the optical design is discussed in §3. The mechanical design is discussed in §4. Electronics and Data Acquisition are covered in §5. In §6 we discuss performance, and in §7 data reduction is discussed and sample spectra are presented.
2 Science Requirements
We desired an instrument that could rapidly provide identifying spectra for candidate low-mass objects identified by 2MASS to within 1-2 spectral sub-classes. To accomplish this the instrument requires access to telltale L and T-dwarf identifying features in the red-optical such as CrH and FeH at , at , the FeH feature at , as well as features at and (Kirkpatrick et al., 1999). Other features important to NIR classification include the K I resonance doublets at and , broad absorption features, and the CO bandhead at .
The instrument’s resolution must be as low as possible to maximize signal from intrinsically faint low-mass objects, yet high enough to detect identifying features between blended airglow lines. Since the airglow lines are most plentiful and intense in H-band, we chose the lowest resolution that retained the ability to observe the methane absorption feature between blended airglow lines, thus preserving the ability to identify this telltale T-dwarf spectral feature for the faintest objects.
Observing efficiency was paramount if the instrument were to quickly identify large numbers of objects and select those that warranted higher resolution and S/N study on larger telescopes, especially given the large number of L-dwarfs expected to be found by surveys. This requirement favored a cross-dispersed spectrograph with its efficient 2-D spectral format.
A NIR slit viewing mode was deemed imperative for rapid field identification and for steering objects accurately into the slit. Most science targets for this spectrograph have extreme visible-IR colors, i.e. CorMASS science targets tend to be visibly faint but IR bright.
The choice of slit width was driven by the typical seeing at the Palomar 60-inch of . To achieve Nyquist sampling at , we chose a slit and a plate scale of . We desired the slit length to be as long as possible to sample the sky for accurate subtraction ( if possible), but left the final length to be determined by the optical design constraints.
Lastly, we wanted the instrument to have first light within one year of commencing design due to the rapidly progressing field of low-mass objects. For cost and schedule reasons we decided to modify an existing IR Labs Dewar and use an existing NICMOS 3 array and array electronics.
3 Optical Design
3.1 Palomar 60-inch
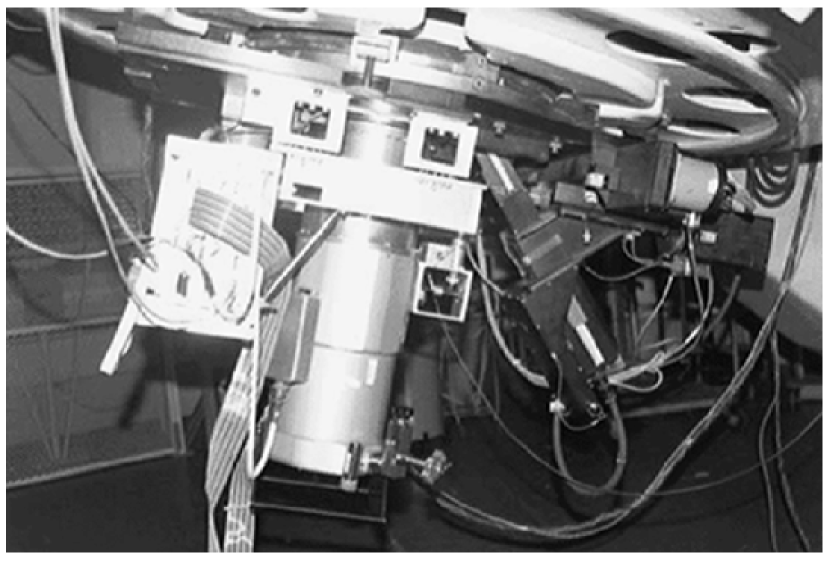
The Palomar 60-inch telescope is an equatorial mounted Ritchey-Chrétien design (Bowen & Rule, 1966). Table 1 includes the telescope prescription. CorMASS mounts directly to the instrument mounting plate at the Cassegrain focus, as shown in Figure 1. With the exception of the primary and secondary mirrors and the Dewar window all the optical elements are cooled to temperature.
3.2 Design Constraints
CorMASS features a compact design that was constrained by the existing Dewar and the telescope focus position.
3.2.1 Dewar Modification
The CorMASS Dewar previously served as the 2MASS Prototype Camera Dewar and more recently for testing NICMOS 3 arrays for the 2MASS survey. The original Dewar is an Infrared Laboratories (Tucson, AZ) ND-2(8)MOD Dewar with a 4.5 liter tank and double shielding. It has a usable cold instrument volume of ø7.5 inches inches. It was clear that a Dewar expansion was required to increase the cold volume available for the new spectrograph optics. Clearly the simplest Dewar modification would be a cylindrical extension of the Dewar walls and shields. Thus the new spectrograph was constrained to ø 7.5 inches, with the length a ‘free parameter.’
3.2.2 Telescope Focus Position
The optimal telescope focus is only mm below the instrument mounting plate (Table 1). In addition, a permanently mounted offset guide camera and filter motor assembly on the telescope instrument mounting plate constrain the outer diameter of an instrument mounted flush to the plate to be inches.
These constraints on access made placement of a cold slit at the telescope focus difficult. The awkward focus position was good incentive to allow the beam to diverge past the telescope focus, enter the cryogenic Dewar, and then re-image the beam onto a slit. Such a scheme would provide straight-forward f/conversion between the telescope focus and slit, as well as produce a well-defined cold pupil stop. But a re-imaging scheme would further lengthen the cylindrical axis of the instrument, thus increasing expense, flexure and the moment arm of the instrument mass that must be compensated with telescope balance.
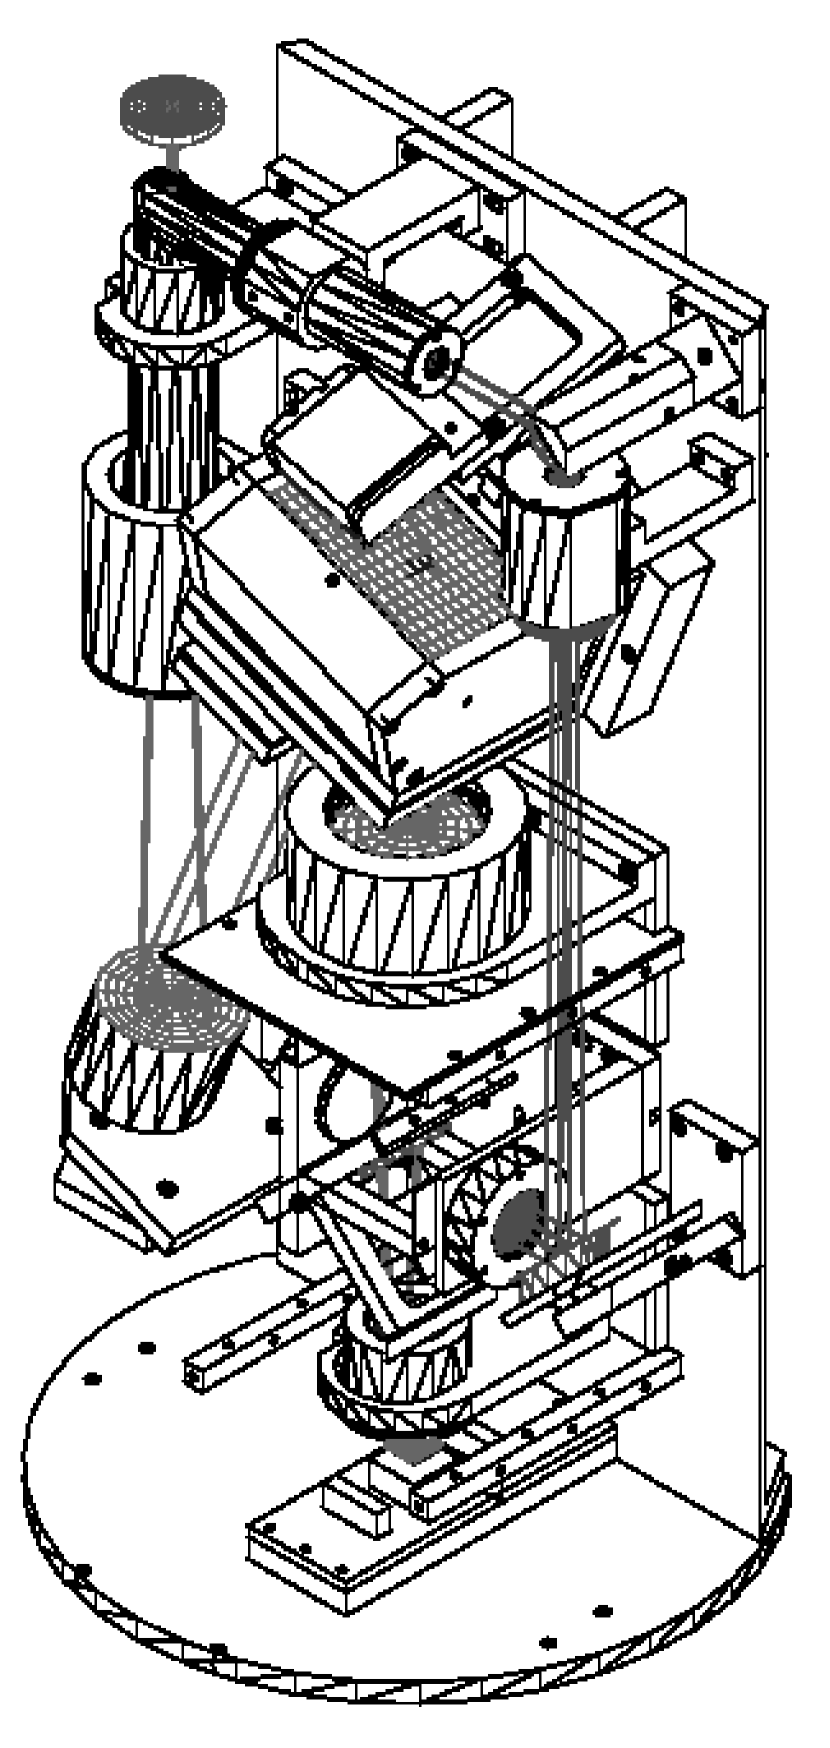
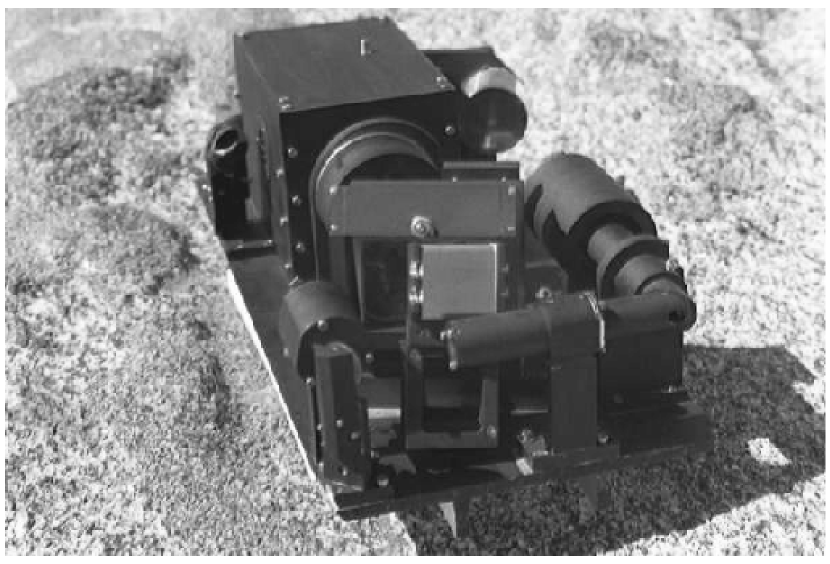
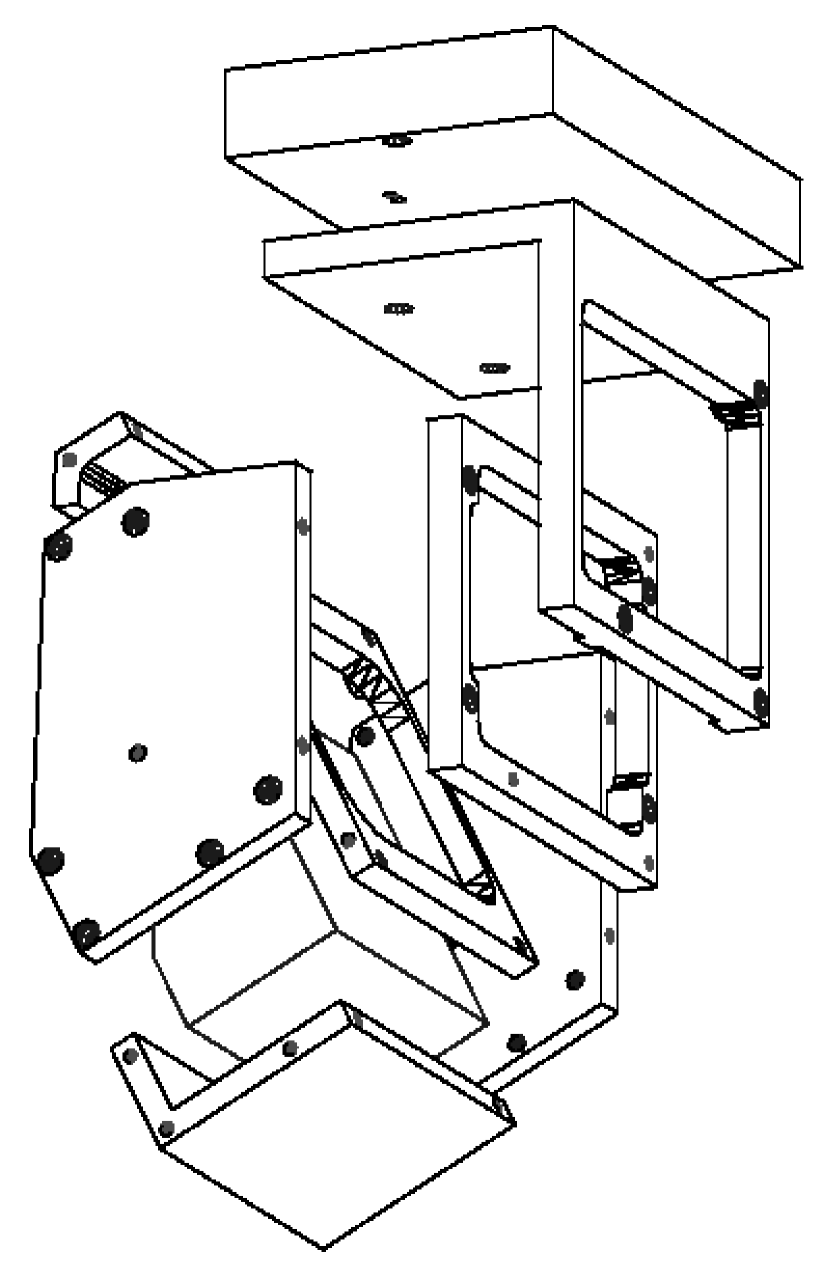
We chose instead the more compact scheme of placing a cold slit at the telescope focus. This required a very tightly integrated mechanical design just inside the window: the Dewar top plate, CaF2 window, two radiation shield tops, and slit occupy a span of mm measured along the optical axis. f/conversion is accomplished as the beam diverges past the cold slit. The clearance between the instrument mounting plate and the telescope fork is inches. The final design length of CorMASS measures inches. Figures 2 & 3 show the design of CorMASS.
3.3 Spectrograph Optics
3.3.1 Prescription
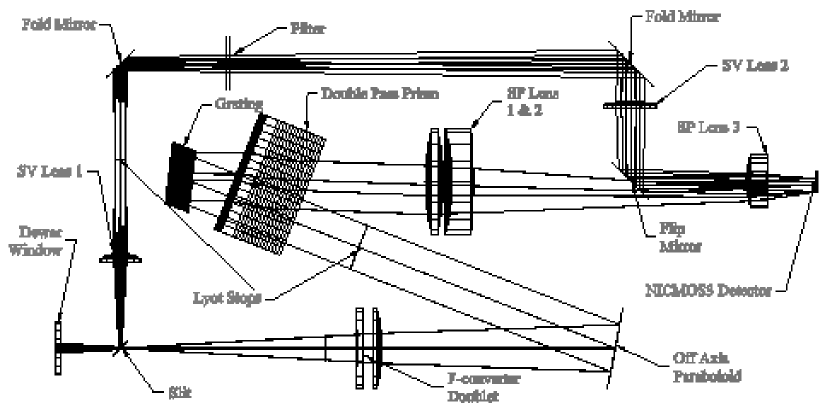
Ray tracing, optimization, and tolerancing for the CorMASS optical design was accomplished with the optical design software ZEMAX Version 6.0 (Focusoft, Tucson, AZ). The optical layout of CorMASS is shown in Figure 4. All five lenses are spherical and one is from stock while the remaining four are custom manufactured using in-house test-plates by Janos Technology, Inc. (Townshend, VT).
The main dispersing element is a coarse 40 lines mm-1 grating, blazed at . A prism made from the Schott Dense Flint SF-10 is used in double-pass for cross-dispersion. Table 1 lists the spectrograph prescription.
After passing through the Dewar window, the converging telescope beam reaches a focus at the slit. A wire electrical discharge machine (EDM) was used to cut a slit into the center of a thick stainless steel (SS304) disk that had been hand polished with diamond paper. Ron Witherspoon Inc. (Campbell, CA) manufactured the slit. The disk is rotated about the axis of the slit length so that incoming light not transmitted through the slit is reflected into the slit viewing train. The slit width is oversized by to compensate for the disk rotation.
Past the slit the beam is converted from to by an Infrasil 301-CaF2 air-spaced doublet333Infrasil 301 is a water-free fused quartz made by Hereaus-Amersil Corp. (Duluth, GA). and is collimated by a gold-coated, diamond-turned, aluminum alloy (6061-T6) off-axis paraboloid. The beam then passes through a cold Lyot Stop sized to the pupil diameter of 22.6 mm. After the stop the beam passes through the SF-10 prism for the first cross-dispersion pass. The prism has a apex angle and is used at minimum deviation. It was fabricated by Kreischer Optics, Ltd. (McHenry, IL).
A prism was necessary as the cross-dispersing element because the desired wavelength coverage exceeded a factor of 2. A double-pass prism design was adopted because it could be implemented in combination with the grating to produce a very compact optical package. When the dispersing elements were ordered in series [prism pass 1 (cross dispersion) – grating reflection (primary dispersion) – prism pass 2 (cross dispersion)] the optical path was neatly returned into the main ‘2-d’ plane of the optical bench (Figures 2 - 4). Single-pass prism designs led to cubical mechanical packages that could not be simply inserted into the dewar.
In addition to SF-10 various other prism materials were considered, including AMTIR1 and ZnSe. Both have higher dispersion in the NIR than SF-10 but were rejected due to coating difficulty and expense. The use of a material easily coated was imperative for the reduction of Fresnel reflection losses at the four vacuum-prism interfaces encountered with a prism used in double-pass.444We became aware of SF-10 during a search of stock prism vendors. Interestingly, the Schott ‘SF’ dense flint glasses have a partial dispersion similar to the alkaline-earth flouride crystals (e.g. , , and ). This makes the SF glasses an appealing ‘flint’ to couple with the crystals to form achromatic NIR cameras (Oliva & Gennari, 1997). The dispersion of SF-10 and the resulting order separation is discussed in §3.3.2.
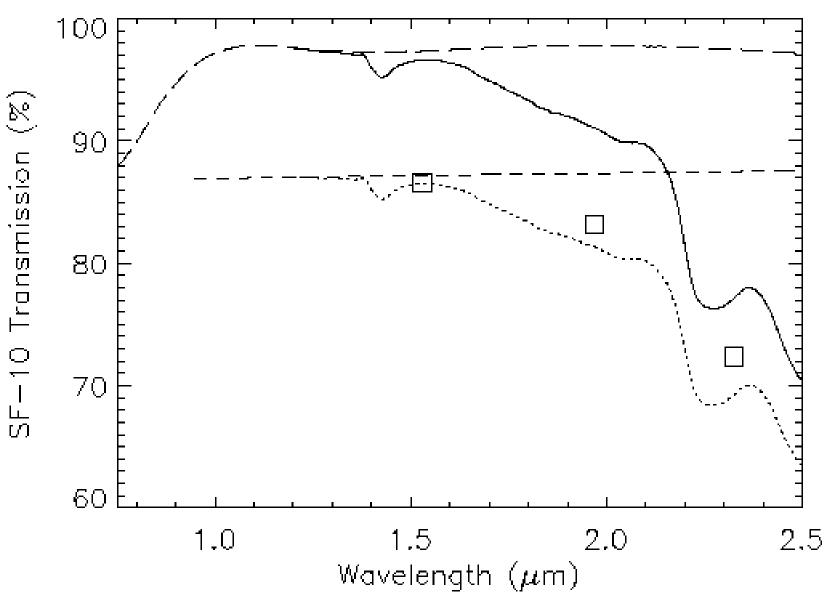
The measured internal transmission of SF-10 (kindly provided by Dr. E. Oliva) and expected Anti-Reflection (AR) coating performance (Janos Technology, Inc.) are plotted in Figure 5. The transmission measurement was performed as described in Oliva & Gennari (1997) and includes theoretical Fresnel losses from two air-glass interfaces (dashed line) and internal transmission through one pass of a 21.7 mm uncoated sample (dotted line). This is very close to the median length of SF-10 traversed by the CorMASS beam in one pass (20.7 mm), so the plotted transmission, neglecting Fresnel losses, accurately reflects the expected internal transmission in our instrument. Shortward of the glass is nearly transparent. We assume absorption features longward of are due to water/OH in the glass. Combining the expected reflection losses through two air-glass interfaces after AR coating (long dashed line) with the internal transmission gives the total expected transmission through one prism pass for CorMASS (solid line). While the transmission losses were unfortunate, they were accepted because the primary spectral features in -band for L and T-dwarfs, the CO bandhead at and the feature, resp., were deemed less important and redundant compared to the źJH band features.
Following the first pass through the prism the beam is diffracted by the grating. Richardson Grating Labs (Rochester, NY) mounted an epoxy replica of a stock master grating onto an aluminum alloy (6061-T6) substrate provided by us. The gold coated grating, with 40 groove density and blazed at , is used with a turn-angle of to match the angular beam deviation of the off-axis paraboloid for optical layout symmetry. The first order blaze wavelength () is . The detector images the 2nd through 9th orders, with coverage from to . We designed the spectrograph to use orders 2-5 and were fortunate that orders 6-7 are in good optical focus as well. In practice only 2nd through 6th orders have useful throughput. (Spectrograph throughput is discussed in §6).
Inadvertently the shortward edge of order 2 and longward edge of order 3 are cutoff by the array edges, resulting in a gap in spectral coverage from - . Evidently the final spectrograph camera focal length is too long, likely due to errors in our assumed cryogenic indices of refraction.
Grating efficiency is well described by scalar theory if where is the groove spacing ( for CorMASS). Therefore, polarization effects are very small (Loewen et al., 1977). Theory also predicts efficiency from to in first order. At higher orders this efficiency will be maintained because the grating is used even farther into the scalar domain as decreases (Loewen et al., 1977). A check of our chosen grating parameters in a commercial software program for grating efficiency analysis (PC Grate, Optometrics, Ayer, MA) yields estimated peak efficiencies of 90% for orders 2-5.
After diffraction by the grating, the beam passes through the prism for a second time. Lastly, the beam is focused onto the detector by an camera which delivers a final plate scale of to the square NICMOS 3 pixels. The camera features three elements in a doublet-singlet format. Following a BaF2-Infrasil air-spaced doublet, there is a space of inches before the converging beam passes through the final Infrasil lens and focuses on the detector. The final lens and detector are separated by inch.
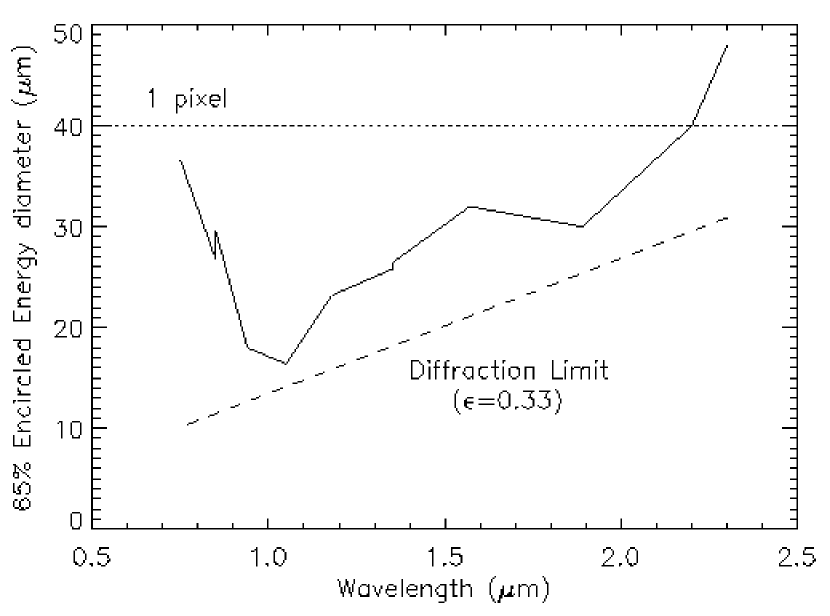
The ratio of the telescope central obscuration diameter to primary diameter is . For a telescope with the Encircled Energy fraction (EE) within the first Airy dark ring is 0.65 (Schroeder, 1987). We used this EE benchmark to judge the image quality of the spectrograph design. Shortward of all wavelengths image EE within 1 pixel (Figure 6). This applies for the entire slit FOV (2″x 15″).
3.3.2 Order Format
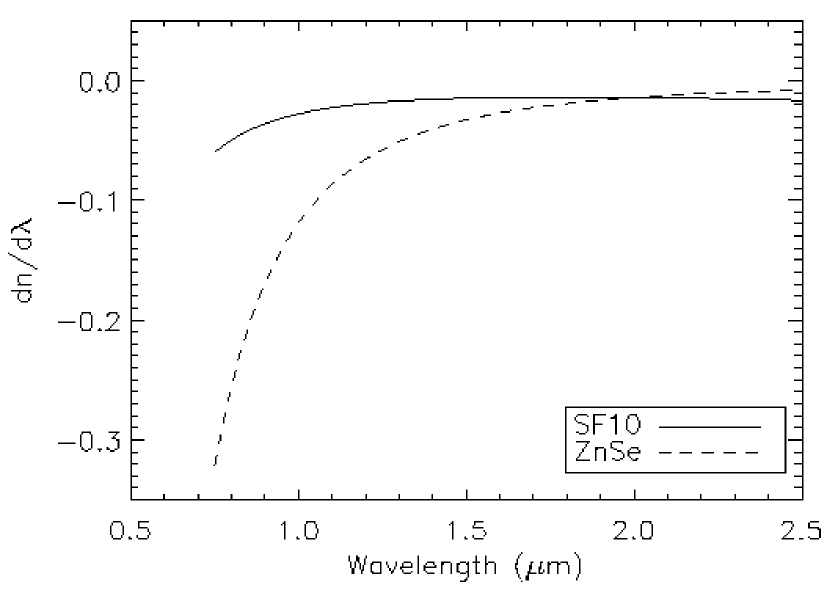
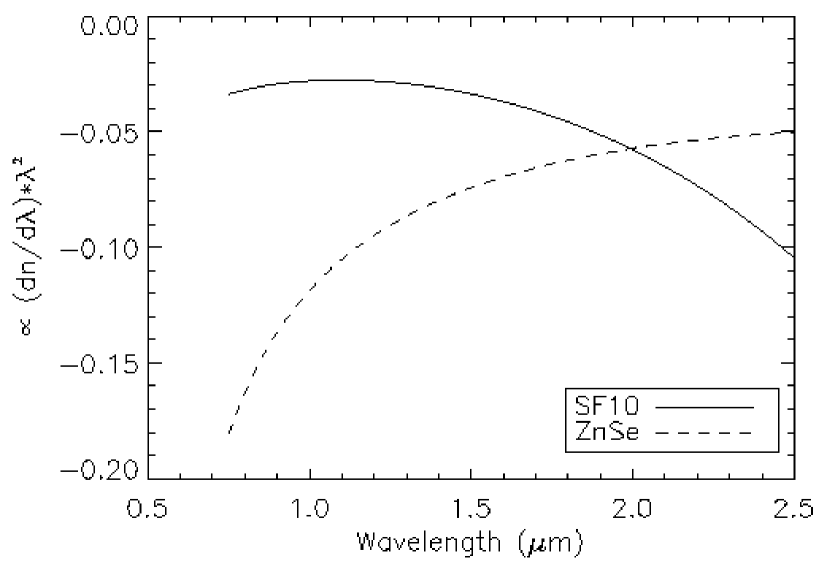
The SF-10 prism in CorMASS leads to an order format similar to that found when a first order grating is used as the cross-disperser555Grating cross-dispersers usually give an order separation (Schroeder, 1987).; CorMASS’ order separation increases with increasing wavelength (Figure 7), whereas prism cross-dispersers typically give larger order separation for decreasing wavelength. The CorMASS format occurs because the dispersion of SF-10 in the near-infrared does not follow the usual dispersion law for transparent glasses in the optical, . Instead of a monotonically decreasing dispersion with increasing wavelength, SF-10 has a dispersion minimum at (Figure 8) at room temperature. This leads to theoretical relative order separations also shown in Figure 8. Both plots compare SF-10 and ZnSe. SF-10 has a similar dispersion function at 77K as at room temperature.
3.4 Slit Viewer Optics
Complementing the spectrograph optical train is a slit viewing mode (Figure 4). Light not transmitted through the slit is reflected by the polished slit substrate into the secondary slit viewing train. This allows viewing a image of the reflective slit for rapidly steering science targets into the slit. A remotely-controlled drive motor outside the Dewar turns an internal flip-mirror between the slit-viewing and spectrographic positions in sec. The flip mirror is located between the doublet and singlet of the spectrograph camera. The slit viewing optical prescription is listed in Table 2. Since the slit viewing mode is not intended for photometric imaging, all lenses in the slit viewing train are from manufacturer’s stock to reduce material costs.
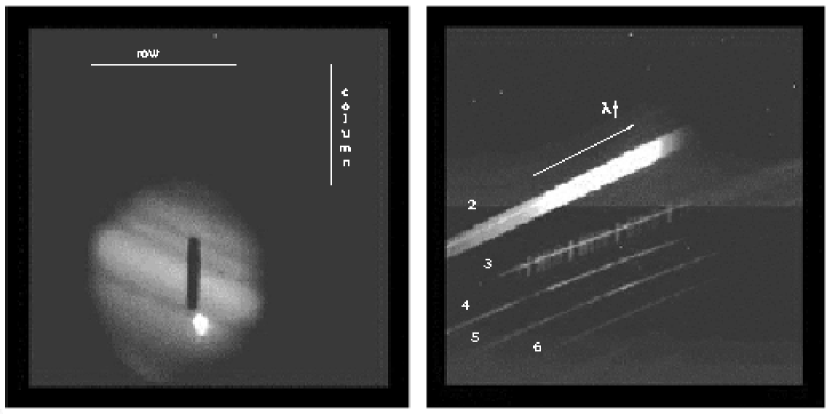
Light reflected from the slit is collimated by a CaF2 lens and passes through a Lyot Stop sized to the pupil diameter of 5.1 mm. The collimated beam is then steered by two gold-coated fold mirrors to the spectrograph camera assembly. The beam also passes through a filter mounted between the fold mirrors (tilted away from the spectrograph elements to reduce light contamination). The slit viewing filter can be changed by opening the dewar. Lastly the beam is refocused onto the detector by the combined action of a CaF2 lens and the final Infrasil lens of the spectrograph camera (Figure 4). The gold-coated flip mirror steers the light from the CaF2 lens towards the final Infrasil lens and detector. The plate scale of the slit viewer is , corresponding to an beam. This plate scale was chosen to give a FOV () large enough to aid the identification of targets in confused fields (Figure 7). The slit-viewer design gives 65% encircled energy diameters of pixels on axis and pixels at the edge of the FOV.
Light leakage from the slit viewing train when in spectroscopy mode is minimal because the flip mirror mechanism blocks the slit viewing beam just past the second slit viewing lens with a shaped baffle plate when not in use (Figure 2). We gave extra care to minimize this source of stray light in such close proximity to the detector.
4 Mechanical Design & Alignment
4.1 Mechanical Design
AutoCAD Version 14.0 and Mechanical Desktop 2.0 (Autodesk, San Rafael, CA) were used for the mechanical design. The optics were designed assuming all elements inside the Dewar are at 77K. Since the optical mounts are machined at room temperature, distances between elements required by the optical prescription are adjusted for the linear expansion of materials (Table 3) prior to the mechanical design and fabrication. Thus upon cooling the elements are correctly positioned.
All optical mounts were fabricated from the aluminum alloy 6061-T6, the same material used for the off-axis paraboloid and grating substrate. The mounts are attached to a ‘T’ cross-section aluminum ‘optical bench’ extending from the Dewar’s cold plate. The use of only one material for all mounts reduced Coefficient of Thermal Expansion (CTE) effects and eased the difficulty of achieving good optical alignment at 77K. The aluminum optical bench, off-axis paraboloid, and grating substrate were thermally cycled between room temperature and 77K multiple times prior to final finishing to stabilize them.
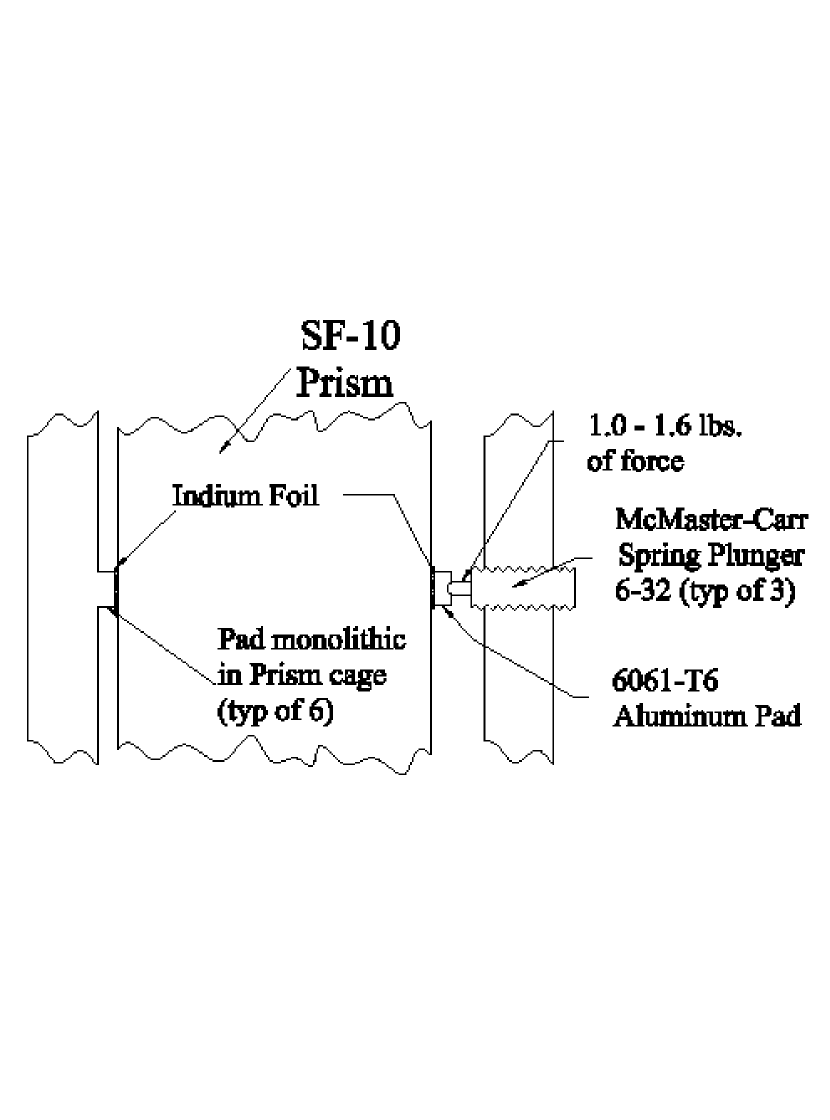
The prism is constrained through a system of six aluminum pads that form a semi-kinematic mount (Figure 9). Three spring plungers oppose the pads in three dimensions and each exerts lbs force to constrain the pound prism. Between each pad and the prism material is an Indium shim to prevent abrasion (Figure 9).
To accommodate differing thermal contractions all lenses are mounted in lens barrels with oversized inside diameters to prevent crushing. Retaining rings compress spring wave washers against the outer annulus of lens faces to accommodate differences in axial contraction during cooldowns.
The flip mirror is driven by an externally mounted 30 VDC motor. A shaft directly couples the external motor to the flip mirror through an O-ring rotary seal at the Dewar wall. The O-ring seal and a flexible coupling inside the dewar make up for small positional and axial changes upon cooling the instrument. Mirror position is controlled by a logic circuit involving a remotely operated toggle switch at the observer’s station and limit switches engaged by the motor shaft outside of the Dewar. Placement of the limit switches outside the Dewar allows adjustment of the mirror-throw while the instrument is cold.
The double-shielded dewar uses only liter of per night of observing.
4.2 Stray Light Reduction
All appropriate surfaces are painted black for stray light reduction. After using one primer coat of the two-part 9924 Wash Primer, black polyurethane Aeroglaze Z-306 paint (Lord Corporation, Erie, PA) mixed with carbon black powder was applied in two or more coatings to all exposed aluminum surfaces (Hunter et al., 1996).
The optical element mounts were designed to minimize stray light. Lenses are mounted within cylindrical aluminum tubes, as mentioned above. Particular attention was devoted to reducing stray light adjacent to the prism. Since the reflective slit is close to the prism, both optical paths past the slit are well enclosed in tubes. The prism itself is enclosed in a mount that exposes only the entrance and exit faces to the optical beam. Another critical area was that near the detector. To reduce stray light the final spectrograph camera and flip mirror assembly were placed within a rectangular enclosure that extends nearly to the cold plate to prevent the direct illumination of the detector by stray light from the shield walls (Figure 3). All transmissive elements in the spectrograph train were AR coated.
4.3 Alignment
Alignment of the optical trains was completed in two parts - internal element alignment and alignment with the telescope secondary. First, alignment within the instrument was conducted in the lab with a HeNe laser. As discussed above, because all element mounts were made from aluminum, the relative alignment of the optical elements was preserved upon cooling from room temperature to 77K. A telescope simulator was used to re-image a neon illuminated point source onto the slit plane to check focus. The slit-viewing collimating lens and spectrograph f/conversion lens positions were adjusted to make the slit-viewer field and the spectrum confocal with the slit.
Second, the independent optical paths of the spectrograph and slit viewer were co-aligned with the telescope secondary through an iterative process. Using a gimbaled sighting scope mounted on the telescope at the same position as CorMASS normally mounts, the scope was centered on the center of the secondary. The scope (with its directional alignment preserved) was transferred to a cassegrain-mounting-plate-simulator in the lab and sighted onto a paper disk the diameter of the secondary and mounted at the distance of the secondary. CorMASS was then mounted onto the simulator and a neon lamp was used to trace the f/cone of both optical paths at the distance of a paper disk. Initially, the spectrograph f/cone was found to be aligned within of the secondary (centers within 1 inch at the slit-secondary distance of 135 inches), but the slit viewing f/cone was found to be displaced 4 inches. The slit viewing train elements were re-aligned and a subsequent test showed the alignment to have improved to within .
Peak-up of both trains relative to the secondary can be fine-tuned by adjusting the position of 4 mounting blocks that attach the instrument to the Cassegrain mounting plate.
5 Electronics & Data Acquisition
A set of MCE-3 electronics from Infrared Laboratories provides clocking and readout of the NICMOS 3 array. Four 16-bit analog-to-digital converters sample the output of each of the four NICMOS 3 quadrants with a pixel dwell time of 3 . A complete read of the array requires 51 . Data are recorded in a standard double-correlated sampling sequence: reset, , integration delay (), . The reset timing is identical to the read timing with a pixel dwell time of 3 . A fiber-optic interface transmits the sampled data from the telescope to the control room where a custom interface provides for buffering of the frames into a frame-grabber card in a Pentium-based data-acquisition computer. The computer stores the raw reads as two-plane FITS images and displays the frame difference for real-time analysis by the observer.
A custom DOS-based user interface provides a variety of control features such as background subtraction of stored images and Ethernet connection to the Telescope Control System (TCS). There are two acquisition modes: continuous-acquisition and single frame modes. The former provides a real-time stream of typically short integration frames ( sec) useful for steering objects into the slit.
6 Performance
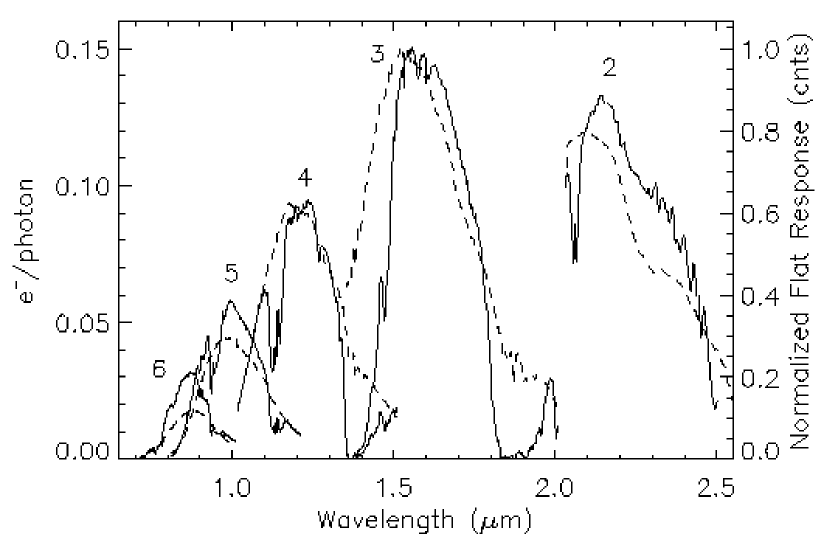
Detector and instrument performance are summarized in Table 4. Average spectrograph throughput is ź=0.05, , , and . Figure 10 gives throughput as a function of wavelength and order, and includes transmission losses from the atmosphere, telescope, instrument and detector. The spectrograph sensitivity is , , and in sec for . The spectrograph performance was determined by analyzing the reduced spectrum of the Faint HST standard P565-C (Persson et al., 1998) observed in clear conditions and with seeing at . This sensitivity conforms to experience; in clear conditions we normally observe objects for sec, and objects for sec, to ensure sufficient S/N.
Also plotted in Figure 10 are normalized dome flat response curves for each order. The response curves displayed are the normalized spectra (raw DN) from the sum of 45 flat lamp on – lamp off differenced pairs accumulated over 9 nights in May 2000.
The Slit Viewer sensitivity is in 2 sec for a point source detection with a subtracted background under good seeing conditions. In practice 2-5 sec continuous acquisition frames without background subtraction are used to detect and steer sources into the slit. For (the faintest sources practical to observe spectroscopically with CorMASS) sec frames are used. Subtraction of a previously saved sky background integration is often used to aid detection of fainter sources. Slit Viewer throughput at is out of the array per photon in at the top of the atmosphere. This throughput includes transmission losses from the atmosphere, telescope, instrument optics, and detector QE. The slit viewer performance was determined by analyzing images of P-565C in the same conditions mentioned above.
Persistence is observed in the CorMASS detector when very bright objects, e.g. calibration stars, are observed spectroscopically. calibrators are preferred for this reason.
7 Data Reduction & Spectra
7.1 Data Reduction
CorMASS first light observations occurred during 1999 August 22-25, with seven additional runs through 2000 August.
Single frame integration times of 100-300 seconds are typically taken with telescope nods of along the slit between each integration. Frame integration times are reduced when airglow and/or atmospheric water content are judged to be highly variable to maintain effective sky subtraction.
Dome flats are taken before the start of each night’s observing. Dome illumination for the flats is provided by a 10W QTH (Quartz, Tungsten and Halogen) lamp mounted above the telescope secondary.
Spectral observations of calibrator stars for atmospheric correction are taken at airmasses within airmass of the target observations. A-stars from the Elias standards (Elias et al., 1982) and bright late-F and G-stars have been used as calibrators.
Following bad-pixel correction, the flat field and flux calibration spectral images are corrected for NICMOS 3 . This is a noiseless exponential change in pixel bias based upon position, time since last pixel read, and detector temperature. The changing temperature of the detector readout amplifiers during readout causes an exponentially varying bias in the direction orthogonal to the pixel clocking, or along the columns (Böker et al., 2000). The columns are perpendicular to the orders (Figure 7). To remove this artifact a quadratic is fit to a row-by-row clipped median of the top quarter of the array, the portion unused by the spectrograph. The fit is extrapolated to 128 rows for the top two quadrants, duplicated for the bottom two quadrants, and subtracted row-by-row from all pixels. The quadratic fit agrees well with row medians of ’quasi-dark’ images taken with the flip mirror half-way between spectrograph and slit-viewing mode.
Spectra are reduced using standard routines in IRAF666IRAF is distributed by the National Optical Astronomy Observatories, which are operated by the Association of Universities for Research in Astronomy, Inc., under cooperative agreement with the National Science Foundation.. Images are flat fielded using a pixel responsivity solution derived from the APFLATTEN task using dome flats from all nights of the run summed together. Nodded image pairs for science objects are subtracted against each other to remove sky background to first-order and shading effects. The shading correction discussed above is not applied to science object images because the subtraction of adjacent nodded images removes the effect to a comparable noise level as the quadratic fit method.
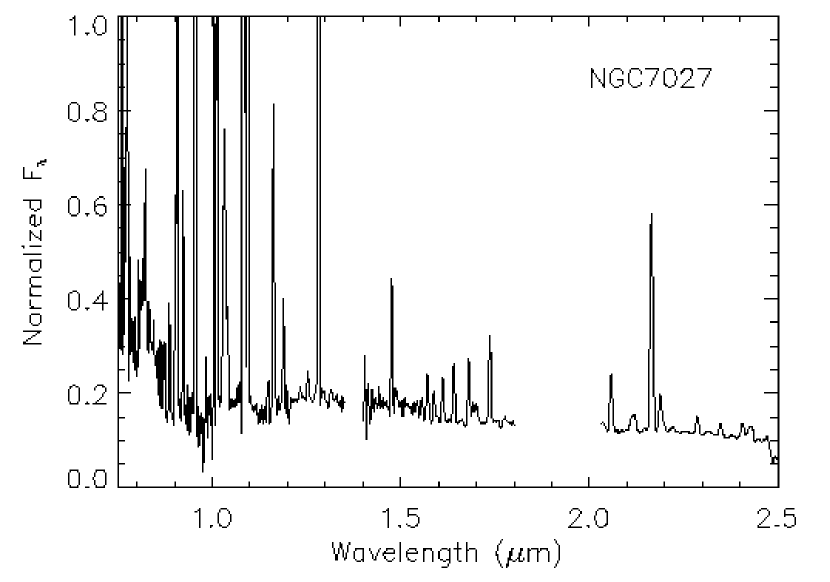
The APALL task is then used for spectral extraction. Wavelength calibration is accomplished by using line identifications from spectral observations of planetary nebulae, e.g. NGC 7027 and NGC 6210. A third-order polynomial is fit to the identified lines to derive a dispersion solution across the orders. The fit residual RMS is pixel () across the wavelength coverage. The use of OH airglow lines was rejected because at the resolution of CorMASS (), many airglow lines are blended together, especially in the H-band, making line identifications problematic.
Telluric absorption effects are removed by dividing by the reduced spectrum of a standard observed at similar airmass and hand corrected for stellar H Paschen and Brackett recombination lines as required. The ratio is then multiplied by a black-body with a temperature equal to the effective temperature of the stellar type of the calibrator observed (Tokunaga, 2000). Lastly, all observations for each order are weighted by the spectra mean and combined with the SCOMBINE task using a trimmed average. Orders are stitched together with SCOMBINE after hand deletion of noisy data at the ends of the orders.
7.2 Spectra
A spectrum of the infrared bright planetary nebula NGC 7027 is shown in Figure 11. The plentiful emission lines of planetary nebulae, primarily H and He lines, are used for wavelength calibration. CorMASS’ wavelength coverage and efficiency are well suited for the study of numerous types of objects including quasars, novae, and emission line objects.
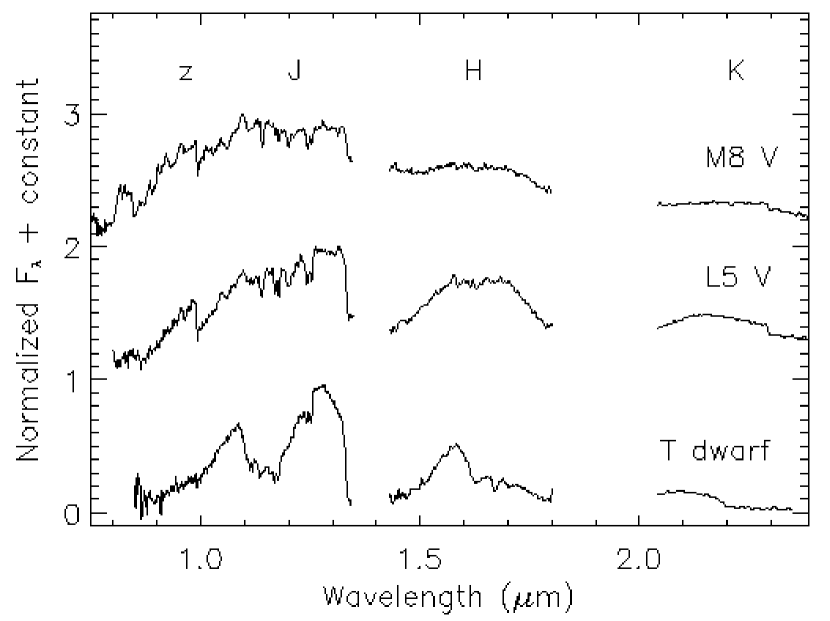
Spectra of the low-mass objects VB 10 (M 8V), 2MASSW J1507476-162738 (L 5V, hereafter 2M1507), and the T-dwarf 2MASSI J0559191-140448 (hereafter 2M0559) are presented in Figure 12. A full spectral sequence and NIR L-dwarf features will be discussed in another paper (Wilson et al., 2000).
CorMASS spectroscopically confirmed the classification of 2M0559 () during the instrument’s second run (Burgasser et al., 2000). 2M0559 is 0.4 mag brighter than Gl 229B and more than 1 mag brighter than the other field T-dwarfs discovered to date. This object’s brightness will aid broad wavelength and high resolution study of its spectral class.
While no methane combination and overtone absorption features at 1.6 and (the features that define the T-dwarf class) are evident in 2M1507, weak fundamental methane absorption has been discovered at in 2M1507 and in an L 7.5 (Noll et al., 2000). This suggests that the transition from CO to as the primary carbon-bearing molecule as effective temperatures decrease commences as early as L 5V.
8 Conclusion
This paper described the newly built and commissioned NIR
low-resolution () prism cross-dispersed spectrograph
CorMASS in operation on the Palomar 60-inch telescope. This
instrument was designed primarily for the identification of late-M
and L-dwarf spectral features. CorMASS spectra of low-mass
objects from the L, M, and T-dwarf classes, as well as the
planetary nebula NGC 7027, were presented. Instrument
characteristics include:
1. Low-cost compact design.
2. Simultaneous coverage of the źJHK
NIR bands with R .
3. A two-position flip
mirror for imaging an alternate slit viewing train.
4.
Spectrograph sensitivity of in sec for
S/N=5.
References
- Böker et al. (2000) Böker, T., et al., 2000, NICMOS Instrument Handbook, Version 4.0, (Baltimore:STScI)
- Bowen & Rule (1966) Bowen, I. S. & Rule, B. H., 1966, S&T, 32, 184
- Burgasser et al. (2000) Burgasser, A. J., Wilson, J. C., Kirkpatrick, J. D., Skrutskie, M. F., Colonno, M. R., Enos, A. T., Smith, J. D., Henderson, C. P., Gizis, J. E., Brown, M. E., & Houck, J. R., 2000, AJ, 120, 1100
- Burrows & Sharp (1999) Burrows, A. & Sharp, C. M., 1999, ApJ, 512, 843
- Casement et al. (1993) Casement, L. S., McLean, I. S., & Fischer, R. E., 1993, Proc. SPIE, 1946, 569
- Elias et al. (1982) Elias, J. H., Frogel, J. A., Matthews, K., & Neugebauer, G., 1982, AJ, 87, 1029
- Epchtein (1997) Epchtein, N., 1997, in The Impact of Large-Scale Near-IR Sky Surveys, ed. F. Garzon (Dordrecht: Kluwer), 15
- Fegley & Lodders (1996) Fegley, B., Jr. & Lodders, K., 1996, ApJ, 472, 37
- Fukugita et al. (1996) Fukugita, M., Ichikawa, T., Gunn, J. E., Doi, M., Shimasaku, K., & Schneider, D. P., 1996, AJ, 111, 1748
- Gunn & Weinberg (1995) Gunn, J. E. & Weinberg, D. H., 1995, in Wide Field Spectroscopy and the Distant Universe, ed. S. Maddox & A. Aragòn-Salamanca (Singapore: World Scientific), 3
- Hunter et al. (1996) Hunter, T. R., Benford, D. J., & Serabyn, E., 1996, PASP, 108, 1042
- Kirkpatrick et al. (1999) Kirkpatrick, J. D., Reid, I. N., Liebert, J., Cutri, B. M., Nelson, B., Beichman, C. A., Dahn, C. C., Monet, D. G., Gizis, J. E., & Skrutskie, M. F., 1999, ApJ, 519, 802
- Kirkpatrick et al. (2000a) Kirkpatrick, J. D., Reid, I. N., Liebert, J., Gizis, J. E., Burgasser, A. J., Monet, D. G., Dahn, C. C., & Nelson, B., 2000a, AJ, 120, 447
- Kirkpatrick et al. (2000b) Kirkpatrick, J. D., 2000b, AAS 196th Meeting, Session 20.02
- Leggett (1992) Leggett, S. K., 1992, ApJS, 82, 351
- Loewen et al. (1977) Loewen, E. G., Nevière, M., & Maystre, D., 1977, Applied Optics, 16, 2711
- Martín et al. (1997) Martín, E. L., Basri, G., Delfosse, X., & Forveille, T.,1997, A&A, 327, L29
- Nakajima et al. (1995) Nakajima, T., Oppenheimer, B. R., Kulkarni, S. R., Golimowski, D. A., Matthews, K., & Durrance, S. T., 1995, Nature, 378, 463
- Noll et al. (2000) Noll, K. S., Geballe, T. R., Leggett, S. K., & Marley, M. S., 2000, ApJ, accepted
- Oliva & Gennari (1997) Oliva, E. & Gennari, S., 1997, A&A, 128, 599
- Oppenheimer et al. (1998) Oppenheimer, B. R., Kulkarni, S. R., Matthews, K., & van Kerkwijk, M. H., 1998, ApJ, 502, 932
- Murphy et al. (1995) Murphy, D. C., Persson, S. E., Pahre, M. A., Sivaramakrishnan, A., & Djorgovski, S. G., 1995, PASP, 107, 1234
- Persson et al. (1998) Persson, S. E., Murphy, D. C., Krzeminski, W., Roth, M., & Rieke, M. J., 1998, AJ, 116, 2475
- Reid et al. (1999) Reid, I. N., Kirkpatrick, J. D., Liebert, J., Burrows, A., Gizis, J. E., Burgasser, A., Dahn, C. C., Monet, D., Cutri, R., Beichman, C. A., & Skrutskie, M., 1999, ApJ, 521, 613
- Schroeder (1987) Schroeder, D. J., 1987, Astronomical Optics (San Diego: Academic Press)
- Skrutskie et al. (1997) Skrutskie, M. F., et al. 1997, in The Impact of Large-Scale Near-IR Sky Surveys, ed. F. Garzon (Dordrecht: Kluwer), 25
- Tokunaga (2000) Tokunaga, A. T., 2000, in Allen’s Astrophysical Quantities, Fourth Edition, ed. A. N. Cox (New York: Springer-Verlag)
- Toulioukian (1975) Toulioukian, Y. S., ed., 1975, Thermal Properties of Matter (New York: IFI/Plenum)
- Wilson et al. (2000) Wilson, J. C., Skrutskie, M. F., Gizis, J. E., Monet, D., Kirkpatrick, J. D., & Houck, J. R., 2000, ApJ, in preparation
| Surface | RadiusaaCold Dimensions (77K) for slit and below (mm) | Thicknessa,ba,bfootnotemark: (mm) | Material | Diameter (mm) |
|---|---|---|---|---|
| Central Obscuration | 640.08 | |||
| Tel PrimaryccConic Constant: ; Sag (mm): | -7619.977 | -2827.918 | coated Alum | 1549.40 |
| Tel SecondaryddConic Constant: ; Sag (mm): | -2750.003 | 3402.212 | coated Alum | 454.56 |
| Cass Mtg Surf | 3.917 | |||
| Dewar Window (R1) | Inf | 3.074 | AR coated | 25.40 |
| Dewar Window (R2) | Inf | 28.444 | 25.40 | |
| Reflective SliteeSlit rotated to optical axis along slit axis | Inf | 114.277 | SS 304 | 9.53 |
| f/Converter Lens 1 (R1) | -166.870 | 3.000 | AR coated Infrasil 301 | 38.10 |
| f/Converter Lens 1 (R2) | Inf | 4.189 | 38.10 | |
| f/Converter Lens 2 (R1) | Inf | 4.502 | AR coated | 38.10 |
| f/Converter Lens 2 (R2) | -79.810 | 101.600 | 38.10 | |
| Off-Axis ParaboloidffFocal Length (cold) , Decenter (cold) , Off-Axis Diameter (OAD) (cold) | -60.960 | -143.479 | Au coated Alum | 38.10 |
| Lyot Stop | -46.521 | 22.56 | ||
| Prism 1st Pass (R1)gg Prism apex angle, used in minimum deviation | Inf | -20.000 | SF-10 | |
| Prism 1st Pass (R2) | Inf | -30.000 | ||
| Gratinghh, , Blaze Angle , Richardson Grating Lab replica | Inf | 30.000 | Au coated Alum | |
| Prism 2nd Pass (R2) | Inf | 20.000 | SF-10 | |
| Prism 2nd Pass (R1) | Inf | 75.000 | ||
| Camera Lens 1 (R1) | 109.520 | 8.647 | AR coated | 50.80 |
| Camera Lens 1 (R2) | -120.289 | 4.460 | 50.80 | |
| Camera Lens 2 (R1) | -94.600 | 10.000 | AR coated Infrasil 301 | 50.80 |
| Camera Lens 2 (R2) | -287.900 | 131.430 | 50.80 | |
| Camera Lens 3 (R1)iiCamera Lens 3 is shared with the Slit Viewing path | 36.540 | 10.000 | AR coated Infrasil 301 | 50.80 |
| Camera Lens 3 (R2) | 258.750 | 23.569 | 50.80 | |
| Detector | NICMOS 3 |
| Surface | RadiusaaCold Dimensions (77K) for slit and below (mm) | Thicknessa,ba,bfootnotemark: (mm) | Material | Diameter (mm) |
|---|---|---|---|---|
| Reflective SlitccSlit rotated to optical axis along slit axis | Inf | -41.287 | SS 304 | 9.53 |
| Slit Vwr Lens 1 (R1) | Inf | -4.558 | 19.05 | |
| Slit Vwr Lens 1 (R2) | 19.018 | -45.146 | 19.05 | |
| Lyot Stop | Inf | -46.126 | 5.111 | |
| Fold Mirror 1 | Inf | 50.8 | Au coated BK7 | 19.05 |
| Filter (R1)ddFilter tilted towards side of Dewar for stray light control | Inf | 2.0 | 25.4 | |
| Filter (R2) | Inf | 193.146 | 25.4 | |
| Fold Mirror 2 | Inf | -18.170 | Au coated Pyrex | 31.42 |
| Slit Vwr Lens 2 (R1) | -59.819 | -3.390 | 25.4 | |
| Slit Vwr Lens 2 (R2) | Inf | -35.118 | 25.4 | |
| Flip Mirror | Inf | 55.494 | Au coated Pyrex | 25.4 |
| Camera Lens 3 (R1)eeCamera Lens 3 is shared with the Spectrograph path | 36.540 | 10.000 | AR coated Infrasil 301 | 50.80 |
| Camera Lens 3 (R2) | 258.750 | 23.569 | 50.80 | |
| Detector | NICMOS 3 |
| Material | aa293K-77K | Reference |
|---|---|---|
| Alum | 0.392 | Casement et al. (1993) & Toulioukian (1975) |
| 0.303 | Casement et al. (1993) & Toulioukian (1975) | |
| 0.319 | Casement et al. (1993) & Toulioukian (1975) | |
| Infrasil-301 | 0.0 | Type I (Fused), Toulioukian (1975) |
| SF-10 | 0.127 | Assume |
| Parameter | Value |
|---|---|
| Detector | NICMOS 3 |
| Bias | 0.91 V |
| Gain | 8.5 |
| Read Noise | 42.5 |
| Well Depth | x |
| Bad Pixels | |
| Spec Sensitivitya,ba,bfootnotemark: | , , |
| Spec Ave Throughputb,cb,cfootnotemark: | , , , |
| Slit Viewer SensitivitybbDistance to next face or elementDistance to next face or element | in 2 sec for |
| Slit Viewer Throughputcc, includes transmission losses from the atmosphere, telescope, instrument and detector QE. | 0.20 |