MPIfR, Auf dem Hügel 69, D-53121 Bonn
The protostellar system HH108MMS ††thanks: Based on observations with ISO, an ESA project with instruments funded by ESA Member States (especially the PI countries: France, Germany, the Netherlands and the United Kingdom) with the participation of ISAS and NASA.
Abstract
We probe the region around the protostar HH108MMS by deep mid infrared photometric and polarimetric imaging. The protostar is detected at 14m in absorption against the diffuse background. Next to HH108MMS, we find a second absorbing core, named Q1, and the young stellar object IRAS18331–0035 which is more advanced in its evolution and already seen in emission at 12m and 14m. HH108MMS, Q1 and IRAS18331–0035 form a triplet along an extended filamentary absorption feature. From the variation of the surface brightness across the source, we derive for HH108MMS and Q1 the optical depth and density profile. Along the axes which are parallel to the filament, the density distributions follow a power law. We estimate that the intensity of the background radiation at 14m is about two times stronger than the intensity of the interstellar radiation field in the solar neighborhood. The present photometric data of IRAS18331–0035 between 12m and 1.3mm can be explained by a central source with a luminosity of 2.5 L⊙ that is surrounded by a spherical cloud of 1.1 M⊙ with a density distribution. As HH108MMS is also seen in the millimeter dust emission, we can derive the ratio of the dust extinction coefficients at 14m and 1.3mm and obtain . Because models for the dust in the diffuse interstellar medium predict a ratio of around 2000, our value points to fluffy composite grains which are expected to prevail in dense and cold environments.
First mid infrared polarisation images of pre–stellar absorbing cores are presented. At 12 and 14 the polarisation of the region around HH108MMS is strong () and tightly correlated with the source triplet. We demonstrate that the high degree of polarisation can be explained by extinction of rotationally aligned dust particles of moderate elongation.
Key Words.:
ISM: dust, extinction – Stars: pre-main sequence – Stars: individual: HH108MMS – Techniques: polarimetric – Infrared: ISM: continuum1 Introduction
Herbig Haro objects mark shock regions in the outflow from very young stars. The 1.3mm continuum survey of Herbig Haro objects by Reipurth et al. (1993) indicates that the young stars, which are the energy sources of the outflow, are surrounded by dusty envelopes of about 0.1 – 3 solar masses. The circumstellar material is so massive that the stars are probably still in the accretion phase. In a follow–up study of the 1.3mm dust continuum, Chini et al. (1997) discovered in the Serpens star forming region which is at a distance pc (De Lara et al. 1991) a protostellar candidate located 71′′ (0.11pc) away from the source IRAS18331–0035. The latter is believed to be the driving engine of the two aligned nearby bow shocks HH108 and HH109 (Reipurth & Eiora 1992, Ziener & Eislöffel 1999); they lie to the South-West of IRAS18331–0035, about 0.1pc and 0.21pc away. In this paper, we present photometric and polarimetric mid infrared images of the region.
2 Observations
2.1 Photometric imaging
The protostellar system HH108MMS was photometrically imaged on 5 March 1996 with the long wavelength array of ISOCAM (Cesarsky et al. 1996) on board the infrared space observatory (ISO). The morphology of the object was studied by applying the observing template CAM01 in raster mode. A 5 5 micro-raster was performed with step size of 20 in both space craft directions; we used the broad band filter lw3 (12 – 18 m), the 6 lens and the large field mirror. After 100 stabilization frames, 33 exposures were read out at each raster position. The read–out time for each exposure was 2.1s.
The data were reduced with the ISOCAM interactive analysis (CIA). The basic reduction steps such as dark current subtraction, initial removal of cosmic ray hits, detector transient fitting and photometry are described in Siebenmorgen et al. (1999). Because in our observing strategy several detector elements saw the same part of the sky at different times, we used the redundant information to correct for the long term camera drift and to fine–tune the deglitching process (Miville–Deschenes et al. 2000). The coadded images at each raster position were then sky–projected and corrected for field distortion. The final raster map has a pixel scale of 2 which corresponds to 620AU at the distance of Serpens ( pc).
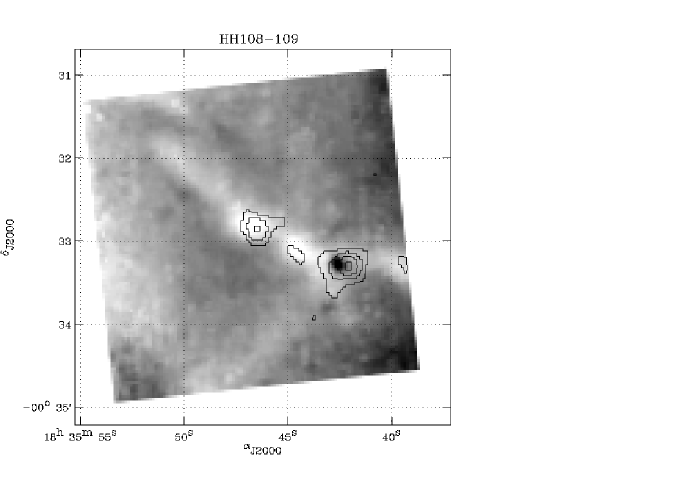
Fig. 1 displays in grey scale our lw3 image of HH108MMS and its surroundings. Superimposed are contours of the 1.3mm emission as observed by Chini et al. (1997). The brighter 1.3mm source coincides with IRAS 18331–0035. At 14 we detect this source in emission, HH108MMS itself is seen in absorption. Besides a second absorption core, Q1, and a tentative third absorbing knot, we find a filamentary structure again in absorption against the diffuse infrared background. The filament extends about 200″ (0.3 pc) along its major and 20″ (0.03 pc) along its minor axis. The major axis is oriented at a position angle PA = 45o.
Photometry of IRAS18331–0035 in a 12′′ aperture gives mJy. The fluxes have been scaled by a correction
factor for a monochromatic point spread function and color–corrected
assuming a spectrum in the band.


2.2 Polarimetric imaging
Polarimetric images of the HH108MMS region were obtained on 30 March 1998 with ISOCAM. The polarisation pattern was studied by applying the observing template CAM05 (Siebenmorgen 1996) in broad band filters lw3 (14.3 m) and lw10 (12.0 m). In each filter, a 2 2 micro-raster was performed at a step size of 54 in both space craft directions. The camera was configured in the 6 lens and the large field mirror. After 30 stabilization frames, 15 exposures were read out at each raster position. The read–out time for each exposure was 5s at gain two. After a raster without polarisers, similar rasters were taken for each of the three polarisers. The polariser rasters were repeated over three observing cycles. The nominal pointing position (18h 35m 46s.5,– 0∘ 32′ 51′′, J2000.0) of the target was corrected in the polariser rasters for the known source displacement on the detector.
The polarisation maps of HH108MMS in filters lw3 and lw10 are shown in Fig. 2 and Fig. 3. Superimposed are contours of the intensities without the polarisers. They reveal the same structure as detected in the CAM01 observations. Photometry of IRAS18331-0035 at 12 m (lw10) gives mJy and at 14 m (lw3) mJy, in accordance with the CAM01 observations.
As in the CAM01 observations described above, we applied the basic data reduction steps, such as dark current subtraction, initial removal of cosmic ray hits and transient correction. A flat field is derived by taking advantage of the fact that all detector pixels spend more time observing the background than on the source. The coadded images at each raster position were projected on the sky and corrected for field distortion to derive the final mosaics. The mosaics have a pixel scale of 3′′. The different raster maps of the same polariser are registered on the brightest pixel of IRAS18331–0035. We measure a relative shift of the source of pixel from one cycle to the next. The polarised signal is found to be consistent between the cycles, so that an average of all cycles gives the final mosaic image for each polarisers.
From each mosaic we subtract the background. Its value is estimated on the same sky area. The Stokes elements are calculated following the notation and calibration factors given by Siebenmorgen (1999). The background at 12m and 14m is mostly due to zodiacal light. By assuming the latter to be unpolarised, we get an internal calibration of the instrumental polarisation which is consistent with the numbers cited in Siebenmorgen (1999).
Fig. 4 displays the 14m fluxes of IRAS18331–0035 as measured through the three polarisers P1, P2 and P3 over three observing cycles. For a given polariser, the fluxes agree within the uncertainty limits. However, the different polarisers have different fluxes, so the mid infrared emission of IRAS18331–0035 is polarised. Fig. 5 is similar and refers to the 12m filter. Altogether we find:
-
–
12m: , .
-
–
14m: , .
Repeating the observing procedure on either an unpolarised standard star (HIC085371) or the zodiacal light, the fluxes through all polarisers are implying that the instrumental polarisation is smaller than 1.5% (Siebenmorgen 1999).
3 Results
3.1 The optical depth profiles of the protostars

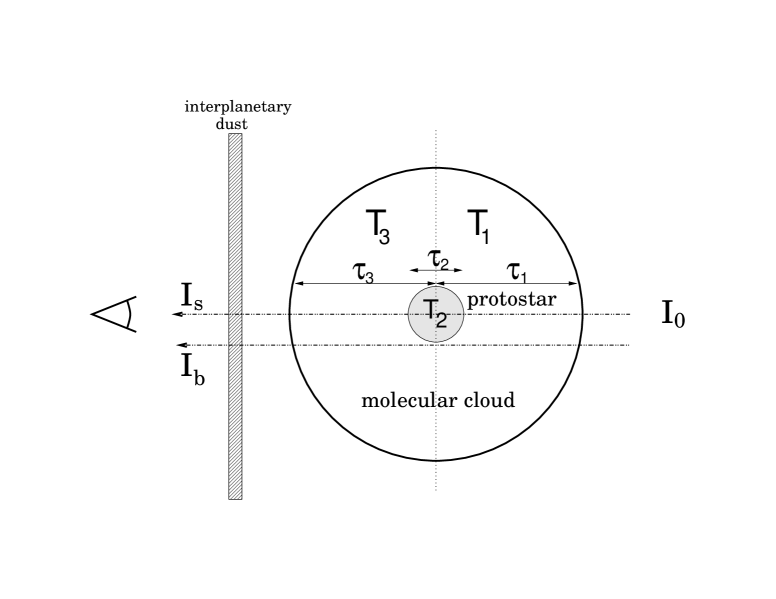
To derive the density structure of the protostellar systems, HH108 MMS and Q1, we transform the mid infrared surface brightness into an optical depth. The underlying geometrical configuration is depicted in Fig. 6. HH108 MMS is embedded in the Serpens molecular cloud and viewed from Earth through a veil of zodiacal light. We distinguish four regions that contribute to the observed flux:
-
•
The background with radiation of intensity that heats the molecular cloud from behind.
-
•
The far and near side of the molecular cloud. They have constant optical depths and constant temperatures , respectively.
-
•
The absorbing core itself with corresponding parameters and .
-
•
The interplanetary dust which is tenuous and emits zodiacal light of intensity .
To simplify the analysis, we assume:
-
•
, the absorbing core is located in the optical center of the molecular cloud;
-
•
, the temperature is uniform over the molecular cloud;
-
•
, the molecular cloud is cold and has no PAH emission;
-
•
, the absorbing core is isothermal and has also no mid infrared emission of its own.
In the direction of the absorbing core (source) we can thus write
| (1) |
Looking at a position next to the absorbing core, one receives the background intensity
| (2) |
If the zodiacal light is constant on scales of a few arcsec, this leads to
| (3) |
Of course, the optical depth varies across the absorbing core. Let us denote its maximum value by and by the observed intensity towards that position. An estimate for is obtained from the 1.3mm peak flux in a 11′′ beam of mJy (Chini et al. 1997) and the dust temperature of 13 K (Chini et al. 2000). From the formula with a solid angle , we find that . This is an average over the 11′′ beam. As the source is centrally peaked at 1.3mm, we expect the optical depth in a area, corresponding to the pixel size of the ISOCAM map, to be a few times larger. When we adopt a dust extinction coefficient of per g of interstellar matter, as would be appropriate for a class 0 object (Krügel & Siebenmorgen 1994), and the total 1.3 mm flux of 282 mJy, we derive a total gas mass of 0.5M⊙.
To convert into the maximum optical depth at 14m, , we employ the dust models by Krügel & Siebenmorgen (1994). For the diffuse interstellar medium, we read off from their Fig. 12 an optical depth ratio . For grains of the same size in cold and dense cores where they have ice mantles and a fluffy structure, the ratio is about 1000. We thus end up with an estimate for that is above 10 and thus comfortably above unity. We may now safely assume that is small so that (see Eq.(3)
| (4) |
Inserting into Eq.(3) gives the following approximate expression for the variation of the optical depth in a cut through the major axis of the core,
| (5) |
It is independent of the optical depth of the molecular cloud, . The background intensity is determined as an average over two strips that run parallel to the major axis, one above, the other below it; we find erg/s cm2 Hz ster.
We can also derive from Eq.(4) and thus the rate at
which the cloud is heated from outside if we can guess . A
rough number for in Eq.(4) comes from the H2CO
line observations in the Serpens cloud by Ungerechts & Güsten
(1984) who propose a visual extinction of 16 mag. With a ratio of
for dust in the diffuse
medium, one obtains . Our ISOCAM data then yield
an intensity at 14m: Jy arcsec-2 or
erg/s cm2 Hz ster,
which is about two times higher than in the solar vicinity where erg/s cm2 Hz ster (Perault 1987). So the value of is reasonable considering that it refers to a star forming region where the radiation field is stronger.
The combination of the ISOCAM and 1.3mm images allows to estimate the extinction ratio . When we roughly evaluate from the ISOCAM image the average optical depth of the absorbing core over the 11 beam of the 1.3mm map, we find for this average (Fig. 7). Therefore,
| (6) |
3.2 The density structure of the protostars
From the variation of the optical depth over the source (Fig. 7) one can derive the density structure of the protostellar core. Consider a spherical cloud of Radius and density . The optical depth through the cloud at an offset from its center is given by
| (7) |
where is the dust absorption coefficient. For determining the exponent of the density distribution, the product is an irrelevant proportionality factor. The value of depends on the upper boundary of the integral and thus on . From the upper panel of Fig. 7, we estimate a source size for HH108MMS of 60′′ which corresponds to a cloud radius AU.
The variation of the optical depth and the best fit density distributions are shown for the major and minor axis of HH108MMS in Fig. 8 and Fig. 9, respectively. In both cuts we derive good fits for a density distribution . The source Q1 is more difficult to analyze because of the vicinity of HH108MMS and the IRAS source.


3.3 The spectral energy distribution of IRAS18331–0035
We do a simple spherical radiative transfer calculation for
IRAS18331–0035 to derive estimates for the source structure; the dust
model is from Krügel & Siebenmorgen (1994) for fluffy and compact
particles, the numerical code is described in Siebenmorgen et
al. (1992). The few photometric points between 12m and 1.3mm are
fit by a source with a –density distribution. Its inner and
outer radius are 1012 and 1017 cm, there is a visual
extinction to the center of 220 mag, the total mass and total
luminosity are 1.1 M⊙ and 2.5 L⊙, respectively. The
spectral energy distribution is shown in
Fig. 10.
3.4 Mid–infrared polarisation images
Polarisation images are presented in Fig. 4 and Fig. 5. They have the following characteristics:
-
–
Mid–infrared polarisation is detected, but only along the absorbing filament.
-
–
The polarisation is strongly associated with the sources HH108MMS, Q1 and IRAS18331–0035.
-
–
The degree of polarisation is high and reaches 50%.
-
–
Except for the western part of IRAS18331–0035, there is definitely some alignment between the polarisation vectors and the filament.
-
–
Because of their low temperatures, HH108MMS and Q1 do not emit at 14m, so polarised emission can be ruled out.
-
–
Because the background light source, as viewed from us, is behind the protostars, we exclude the possibility of polarisation from scattering. Furthermore, scattering would require micron–sized dust particles.

3.5 The degree of polarisation in the mid–infrared
We now estimate whether an extinction optical depth at 14m of order two can polarise the light by 30% or more. This has to be checked because polarisation through extinction in the visible is always much smaller. In the visible, we have the empirical relation between the visual optical depth and the degree of polarisation .
We therefore compute the cross section of spheroids in the Rayleigh limit when the wavelength is much bigger than the particle. A spheroid has three major axes, . If it has the shape of a cigar (prolate spheroid), ; if it is like a pancake (oblate spheroid), . The absorption cross section at wavelength of a spheroid of volume when the electric field vector is parallel to axis is
| (8) |
Im signifies the imaginary part of a complex number ; denotes the complex dielectric permeability; is a shape factor which lies between zero and one and depends on the eccentricity of the grain (see, for example, Bohren & Huffman 1983). There are analogous definitions for and . For cigars, , for pancakes, .
Suppose the spheroids are aligned and rotate about the axis of greatest moment of inertia, which is axis or for cigars, and axis for pancakes. Let the light propagate in a direction perpendicular to the rotation axis and let denote the time–averaged cross sections in the case when the electric vector of a linearly polarised incident wave is parallel and perpendicular to the rotation axis, respectively.
For spinning cigars, the cross section changes periodically. Because the mean of over a rotation cycle is one half, one finds
| (9) |
If a pancake rotates about its axis of maximum moment of inertia, which is , no averaging is necessary and
| (10) |
The optical depth of a cloud for linearly polarised light changes with the direction of the electric field vector. Let be the maximum value of and its minimum. The corresponding electric field vectors are perpendicular to each other. For both cigars and pancakes, is proportional to and to with the same proportionality factor.
When unpolarised background light of intensity traverses the cloud, it is weakened to the observed intensity
| (11) |
Putting defines an effective optical depth
| (12) |
The degree of polarisation is obviously defined by
| (13) |
In case of weak extinction, and . If is large, the polarisation goes to unity.
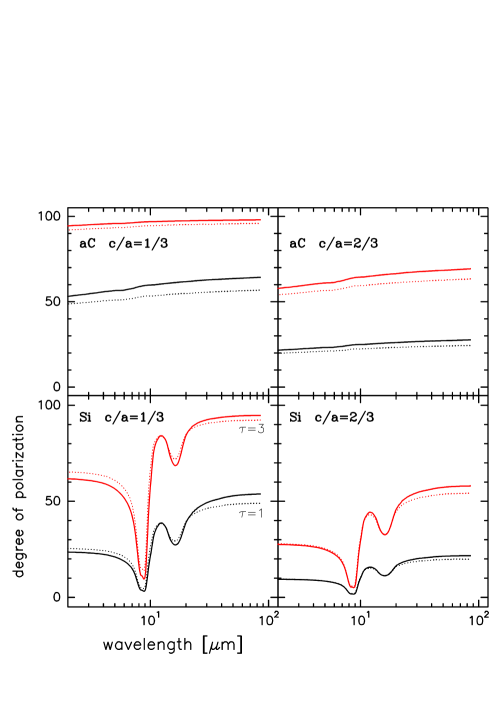
In Fig. 11 we calculate assuming an effective optical depth at all wavelengths of either 1 or 3. The frequency dependent dielectric permeability for silicate is from Laor & Draine (1993) and for carbon from Zubko et al. (1996, their type BE). We see that with an effective optical depth of two, even particles of very moderate elongation () produce very substantial polarisation, provided they are well aligned. Therefore, the observed high degree of polarisation at 14m does not seem to pose a principal problem.
4 Discussion: Pre–stellar evolution
Among many other models, the self–similarity solutions of Shu et al. (1977) for the early evolution of protostars predict in the absence of rotation and magnetic fields a profile in the outer envelope and a less steep distribution in the inner part. Basu & Mouschovias (1995), who include magnetic fields and rotation, also find a power law density distribution in the envelope with an exponent between and and a constant density central region of 50 AU size. Masunaga & Inutsuka (1999) perform calculations for the early collapse (before dissociation of H2 in the core) of a 1 M⊙ star. The luminosity stays below 0.1 L⊙, there is a core of 5 AU and the density goes like in the envelope. Their models should be applicable to HH108MMS and Q1 of the present paper which also have no mid–IR embedded source.
In a few cases, the predicted theoretical density profiles could be checked by 1.3mm observations of the dust emission (Ward–Thompson et al. 1994, André et al. 1996, Ward–Thompson et al. 1999) and were generally corroborated. In this method, the conversion of fluxes into absolute column densities depends on the dust absorption coefficient at 1.3 mm and the grain temperature, whereas the power law exponent of the density distribution is sensitive to the temperature gradient.
On the other hand, our derivation of the optical depth and the ensuing density profile from absorption measurements is temperature independent. ISOCAM observations similar to ours were also carried out by Bacmann et al. (2000). For the sources which they present, the maximum optical depth at the cloud center is much smaller than those for HH108MMS and Q1, so we probe deeper into the cloud, still the density profiles in the envelopes roughly agree with what we derive. In the cloud center (AU), they find a flattening of the column density which we do not see. Such a flattening is expected to occur in the central 1000AU of an isothermal sphere with temperature K, radius of 10000AU and mass of 1M⊙ simply by solving the hydrostatic equation (Bonnor 1956).
The measured mid infrared to millimeter dust extinction ratio of should be compared with dust models of protostellar environments. The ratio is a factor 4 lower than expected for dust in the diffuse medium and it indicates that the grains in the dense and cold environment of the protostar HH108MMS are, as expected (Ossenkopf 1993), of rather fluffy and composite nature. The measured mid infrared to millimeter dust extinction ratio of HH108MMS is already tending towards somewhat elongated grain structures: In the fluffy composite but spherical dust model by Krügel & Siebenmorgen (1994) a ratio of is found. Because elongated particles are much better antennas at 1.3mm, they can give a lower value. A proof that the dust in the absorbing cores and the IRAS source is indeed of elongated structure is found by the ISOCAM polarisation measurements.
As the filament is seen in absorption against the background and assuming that the majority of the grains are still sub-micron sized particles, one may neglect dust scattered light at 14m.
Consequently the most plausible mechanism to produce the polarisation is dichroism. For polarisation due to extinction of elongated spinning and aligned dust particles, the polarisation vectors (Figs. 4 and 5) indicate the magnetic field direction. It appears that the magnetic field vectors are roughly aligned with the absorbing filament. Such ordered fields are also detected from 850 maps of thermal dust emission of prestellar cores (Ward-Thompson et al. 2000) and FIR polarimetry on the protostar IRAS20503+6006 (Clements et al. 1999).
5 Conclusion
We study the protostellar system HH108MMS in the mid IR with ISOCAM. The 14.3m (lw3) image reveals an extended (200) structure which is seen in absorption against the diffuse background radiation. Within it, we detect IRAS18331–0035 emitting a flux of a few mJy and at least two absorbing cores, of which one coincides with the protostar HH108MMS.
We transform the 14m surface brightness of the absorbing cores into optical depth profiles from which we derive the density structure of the protostars. Along the minor and major axis of the absorbing cores the density profile is consistent with a power law.
From the comparison to the 1.3 mm map (Chini et al. 1997) we derive observationally an extinction ratio . When compared to dust models (Krügel & Siebenmorgen 1994), this ratio points towards rather fluffy and elongated grain structures, as expected for cold and dense environments.
The structure of IRAS18331–0035 is estimated by applying a radiative transfer model to fit its spectral energy distribution. A reasonable fit is obtained using a density structure, a total cloud mass of 1M⊙ and a luminosity of L⊙. The model envelope has a visual extinction of mag, where we measure from the cloud surface to the inner loci where grains are evaporating.
We also present the first mid infrared polarisation images of protostellar absorbing cores prior to the formation on a luminous shock front.
The polarisation pattern is well correlated with the triplet system and follows roughly the absorbing filament. The most plausible explanation for the polarisation is extinction of the background radiation by elongated spinning and aligned dust particles. Therefore the polarisation vectors indicate the magnetic field structure of the protostellar triplet system.
We detect a fractional polarisation which is much higher (15%) than known for optical wavelengths (). For various kinds of rotating dust particles it is shown that dichroic polarisation can indeed produce such high degree of mid infrared polarisation.
Acknowledgements.
We are grateful to L. Metcalfe for supporting us with his temporal flat fielding method. CIA is a joint development by the ESA Astrophysics Division and the ISOCAM Consortium. The ISOCAM Consortium is led by the ISOCAM PI, C. Cesarsky.References
- (1) André P., Ward–Thompson D., Motte F., 1996, A&A 314, 625
- (2) Bacmann A., André P., Puget J.-L., et al., 2000, A&A (subm.)
- (3) Basu S., Mouschovias T.Ch., 1995, ApJ 453, 271
- (4) Bohren C.F., Huffman D.R., 1983, ”Absorption and Scattering of Light by Small Particles”, John Wiley & Sons, Inc.
- (5) Bonnor W.B., 1956, MNRAS 116, 350
- (6) Cesarsky C., Abergel A., Agnèse P., et al., 1996, A&A 315, L32
- (7) Chini R., Reipurth B., Sievers A., et al., 1997, A&A 325, 542
- (8) Chini R., Ward-Thompson D., Reipurth B., et al., 2000, A&A (subm.)
- (9) Clements D., Kraemer K., Ciardi D., 1999, “Workshop on ISO polarisation observations”, R.J. Laureijs & R. Siebenmorgen (eds.), ESA (ISBN 92-9092-740-2), http://www.iso.vilspa.esa.es/, p. 7
- (10) De Lara E., Chavarria K.C., Lopez–Molina G., 1991, A&A 243, 139
- (11) Krügel E., Siebenmorgen R., 1994, A&A 288, 929
- (12) Laor A., Draine B.T., 1993, ApJ 402, 441
- (13) Miville-Deschenes M.-A., Boulanger F., Abergel A., Bernard J.-P., 2000, A&A subm.
- (14) Masunaga H., Inutsuka A.-I., 1999, ApJ 510, 822
- (15) Ossenkopf V., 1993, A&A 280, 617
- (16) Perault M., 1987, PhD dissertation, Universite de Paris VII
- (17) Reipurth B., Eiora C., 1992, A&A 256, L1
- (18) Reipurth B., Chini R., Krügel E., Kreysa E., Siebers A., 1993, A&A 273, 221
- (19) Siebenmorgen R., 1996, “Polarimetric imaging with ISOCAM: C05 Observer’s Manual” (ESA/SAI/96-238/Dc), http://www.iso.vilspa.esa.es
- (20) Siebenmorgen R., 1999, “Workshop on ISO polarisation observations”, R.J. Laureijs & R. Siebenmorgen (eds.), ESA (ISBN 92 - 9092-740-2), http://www.iso.vilspa.esa.es/, p.41
- (21) Siebenmorgen R., Krügel E., Mathis J.S., 1992, A&A 259, 614
- (22) Siebenmorgen R., Blommaert J., Sauvage M., Starck J.-L., 1999, “ISO Handbook Volume III (CAM)”, SAI-99-057/Dc, http://www.iso.vilspa.esa.es/
- (23) Shu F.H., 1977, ApJ 214, 488
- (24) Ungerechts H., Güsten R., 1984, A&A 131, 177
- (25) Ward–Thompson D., Scott P.F., Hills R.E., André P., 1994, MNRAS 268, 276
- (26) Ward–Thompson D., Scott P.F., Hills R.E., André P., 1999, MNRAS 305, 143
- (27) Ward–Thompson D., Kirk J.M., Crutcher R.M., et al., 2000, ApJ 537, 135
- (28) Ziener R., Eislöffel J, 1999, A&A 347, 565
- (29) Zubko V.G., Mennella V., Colangeli L., Bussoletti E., 1996, MNRAS 281, 1321