Models for the Origin of the Knee in the Cosmic-Ray Spectrum
Abstract
A sudden steepening of the cosmic-ray energy spectrum ( the knee ) is observed at an energy of about 3 PeV (1 PeV = 1015eV). The experimental study of the PeV cosmic rays has intensified greatly during the last 3 years. The recent results on extensive air showers allow us to conclude that: a) the knee has an astrophysical origin; b) the ‘sharpness’ and the fine structure of the knee rule out ‘Galactic Modulation’ as the origin of the knee; c) most likely the knee is the result of the explosion of a single, recent, nearby supernova.
INTRODUCTION
Cosmic rays spread over 11 decades of energy with an almost featureless power law spectrum. There are just two structures which are well established: the steepening at an energy of about GeV and the flattening near GeV. The first is called the knee, the second is the ankle. The first one was first found at Moscow University 42 years ago (Kulikov and Khristiansen, 1958), the second is younger. Both features are crucial for understanding cosmic-ray originand propagation. We concentrate on the knee origin, because there has been progress in its study during the last few years. This progress is ensured by the work of new extensive air shower ( EAS ) and Cherenkov arrays in Germany: KASCADE (Glasstetter et al., 1999), USA: CASA-MIA (Glassmacher et al., 1998), DICE (Swordy and Kieda, 2000), BLANCA (Fortson et al., 1999), South Pole: SPASE-2/VULCAN (Dickinson J.E. et al., 1999), Canary Islands: HEGRA (Arqueros et al., 2000), Russia: TUNKA (Gress et al., 1999), Armenia: MAKET ANI ( Chilingarian et al., 1999) and others. These new experimental data let us make a comprehensive analysis of the situation around the knee and this is a subject of the present paper.
MODELS FOR THE ORIGIN OF THE KNEE
Models of the knee proposed to date can be divided into two distinct classes: astrophysical and interaction models. The astrophysical models attribute the change in the spectra of the observed EAS to the change in the energy spectra of the primary cosmic rays. The interaction models imply that the primary energy spectrum has no such sharp change and the observed steepening of EAS size spectra is due to the sudden change of the nature of the interactions between the high energy particles of primary cosmic rays and the atmosphere. The astrophysical models are more numerous and developed. They might be also subdivided into two classes: the source models, with a change of sources or their acceleration mechanisms, and the propagation models, with a change of the cosmic-ray propagation between the source and the observer.
The very first model, which was proposed for the explanation of the knee immediately after its discovery (Peters, 1959; Goryunov et al., 1962) belongs to the latter class - it is the Galactic Modulation or diffusion model which still has its supporters (eg Kalmykov and Pavlov, 1999). The basic idea is that at low energies the particle giroradius in the Galactic magnetic fields is small, their motion between the magnetic irregularities is like a slow diffusion and cosmic rays are trapped inside our Galaxy. However, Galactic magnetic fields are not strong enough to trap high-energy particles which begin to escape from the Galaxy: the higher the particle energy - the stronger their leakage. This rising leakage results in the steepening of the cosmic-ray energy spectrum.
The source models associate the lack of high-energy particles beyond the knee either with the increased loss of their energy in intensive radiation fields (Hillas, 1979) or with the termination of their acceleration mechanism (Biermann, 1993). The latter is often connected with the ceasing of the shock wave produced by the supernova explosion.
The interaction models explore the fact that we still observe the knee indirectly, deep in the atmosphere, mostly by means of EAS. They argue that the slope of the EAS size spectrum steepens because interactions of high-energy particles suddenly change their character at an energy of a few PeV ( Nikolsky, 1995 ).
EAS CHARACTERISTICS IN THE KNEE REGION
The basic characteristics which are important for the analysis of the knee origin are the primary energy spectrum, the mass composition of the primary particles and the anisotropy of their arrival directions. The first two determine the spectral shape and ratios between different EAS components.
Shape of the EAS size spectra
Even the very first measurements of the EAS size spectrum revealed that the knee is surprisingly sharp. It would not be so sharp if different primary nuclei have the knee at the same rigidity, as in the Galactic Modulation model, and particularly if one takes into account the huge fluctuations of the EAS size for the showers of fixed primary energy observed in the lower part of the atmosphere. However, it is sharp indeed.
New measurements have raised the number of EAS size spectra to 40. There are also 8 low energy muon size spectra, 3 high energy muon multiplicity spectra, 3 hadron size and hadron energy spectra as well as 5 spectra of the Cherenkov light emitted by the charged particles of the shower. These measurements, in spite of the large spread of their results, clearly show that:
the spectra of all components have a sharp knee at the values corresponding to a primary energy of about 3 PeV. Traces of the knee are seen even in high energy muon multiplicity spectra, in spite of the tremendous fluctuations intrinsic for this component. Particularly important is the observation of the knee in the spectra of Cherenkov light, because these measurements give a good estimate of the total energy of the cascade, and therefore of the primary.
This is an important result because it does not leave room for the interaction models. If all the components of the shower show steepening of their spectra, then, in order to preserve the same slope of the primary spectrum in the wide energy range, it is necessary to assume that primary particles transfer their energy into some unobservable component. The only known unobservable component which remains undetectable up to date is the neutrino. However, we know that the neutrino has only a weak interaction and is born in weak decays. The energy fraction carried away by it could not rise with the energy of the cascade, so that the neutrino cannot be the component which takes away the missing energy of the cascade. The alternative hypothesis is the production of a hypothetical heavy particle above a threshold energy 3 PeV with a large and rising cross-section which escapes our detection due to exotic penetrating properties. It is in contradiction with all our knowledge of multiparticle production.
Such a conclusion does not exclude new features, which might appear in particle interactions at high energies, particularly in nucleus-nucleus collisions. It states only that such new features, if they exist, could not be the origin of the knee.
the EAS size corresponding to the knee position decreases with the atmospheric depth at which the size is measured, in accordance with expectation, if the knee occurs at a fixed primary energy ( Figure 1 ).

The sharpness of the knee exceeds that expected in the Galactic Modulation
model. If one determines the sharpness as
, where and are the EAS
intensity and size correspondingly, then the expected
sharpness in the
Galactic Modulation model should not exceed 0.3 even for the primary
spectrum itself. The real situation is shown in Figure 2. It is seen that
all measured values are above 0.3. The overall mean is about
1.30.1
for the EAS size spectra and for Cherenkov light spectra it is even
higher - around 3 ( the reason for the higher value is that it relates
more nearly to the primary spectrum ).

The increasing number of observations has given birth to another interesting finding: the fine structure of the knee. In order to study the shape of the spectra around the knee when the positions of the knee in the individual spectra spread over a decade ( Figure 1 ), the EAS sizes and energies should be normalized to those corresponding to individual knee positions. The knee position was determined as the point of the maximum sharpness of the spectrum. If all the spectra are normalized at their knee point, then, at the size which is by the factor of 4 higher than the size at the knee, there is another intensity peak with a positive sharpness (Erlykin and Wolfendale, 1997). It is not so distinct as the knee, because, due to the larger statistical and systematic errors of each individual experiment at high energies, it is often hidden within the error bars. However, superimposing individual spectra with a normalization at the knee unveils it unambiguously. The superposition in this approach is similar to the method in which any weak, but regular, signal is searched for beneath a stochastic background.
The first evidence of this peak was found on the basis of just 9 EAS size spectra. The increasing number of measurements has let us confirm its presence with much higher confidence. Moreover, the second peak is found also in Cherenkov light spectra, which proves its astrophysical origin. These results are shown in Figure 3. Here, the fine structure of the 40 EAS size and 5 Cherenkov light spectra are shown not for the sharpness, but for the excess of the intensity over the running mean (Erlykin and Wolfendale, 2000). The running mean was determined in the range of equal to around each measured point. The presence of the second peak in the excess is seen beyond the error bars both in EAS size and in Cherenkov light spectra.

These last results on the magnitude of sharpness and the existence of the second intensity peak are also important for the problem of the origin of the knee, because they leave no room for the Galactic Modulation model with its smooth and regular steepening of all the constituent nuclei spectra.
Mass composition
The primary mass composition in the knee region is still a matter of hot debate. The problem is that direct measurements in space do not yet reach the important PeV region. All the studies of the mass composition there are indirect and based on the ratios between different shower components. The range of conclusions is highly disparate; however there has been progress here in the last few years. It has become possible because more EAS arrays detect and analyse not just one but several shower components simultaneously.
Most of the experiments now give convergent results and conclude that the mass composition becomes heavier beyond the knee. The difference is confined to the estimate of the mass composition below the knee and at the knee itself. The problem is that the primary mass estimated on the basis of indirect measurements often depends on the shower components chosen for the analysis. For instance, the primary mass, derived from the electron and muon components, is lighter than that derived from electron and hadron components (Kampert et al., 1999). The analysis is always made using most reliable interaction models. Does this inconsistency indicate some drawbacks in our understanding of high-energy interactions ? This is not unlikely, particularly as far as the nucleus-nucleus interactions is concerned.
Two conclusions might be drawn on this point:
the methods used for the analysis of the mass composition at high
energies should be tested and calibrated at lower energies, where
direct measurements exist and where we are sure about our interaction
models;
the estimates of the primary mass and the most reliable
interaction model should be based on the analysis of the
maximum number of shower components.
Anisotropy
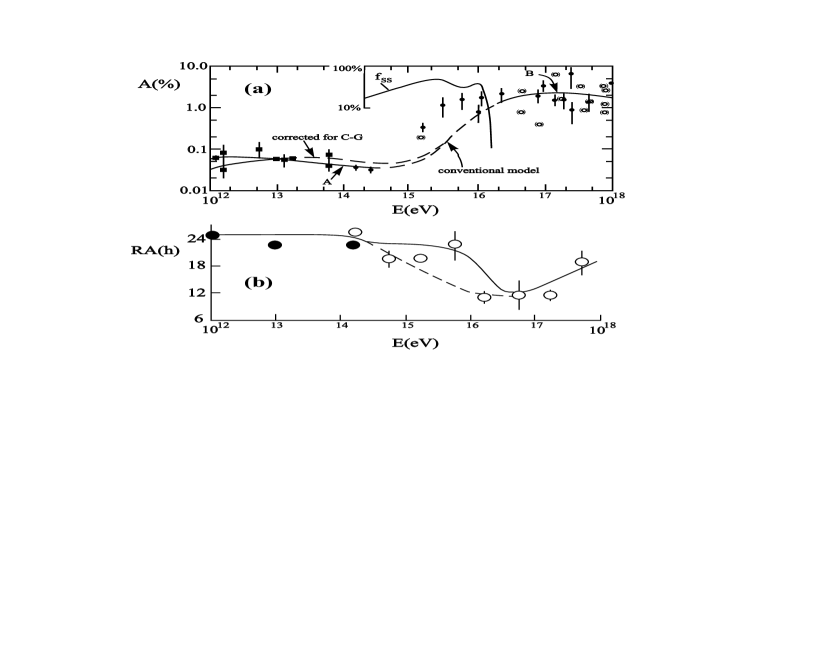
The anisotropy of the arrival directions can provide valuable information about the origin of the knee. The overall situation has been discussed by us in Erlykin, Lipsky and Wolfendale, 1998 and is shown in Figure 4, so that we shall not go into details here. We only underline that both the amplitude and the phase of the first anisotropy harmonic show sharp changes in the PeV-region. It is another argument in favour of an astrophysical origin and against the interaction model of the knee.
SINGLE SOURCE MODEL OF THE KNEE (SSM)
There is a general conjecture, based on the energy and theoretical arguments, that supernova explosions are responsible for the formation of the cosmic ray energy spectrum below, and possibly even beyond, the knee. The intensity of their explosions is correlated with the star forming regions, whose properties: density and temperature of the interstellar gas, strength and irregularity of magnetic fields etc vary over a wide range. Thus, any kind of averaging over the range of supernovae would eventually result in a smoothly varying cosmic-ray spectrum. In 1997 we put forward a model in which the knee is formed by the explosion of just a single, nearby and recent supernova. The spectrum of cosmic rays from the shock caused by that explosion protrudes through the smooth background formed by many other ( unspecified ) sources ( Figure 5 ).

The shape of the SSM energy spectrum has been taken from the theory of
supernova remnant acceleration ( Berezhko et al., 1996 ). The specific
features of that theory are a flat energy spectrum in
the shocked region, a quite high maximum energy of accelerated
particles corresponding to the rigidity about 0.4
PV and a very sharp cutoff of the spectrum beyond that rigidity. If the
explosion occured in the hot interstellar medium, which is the case of
the Local Bubble, in which our solar system is immersed, then different
nuclei should be well separated in the energy scale, because the
energies of the accelerated nuclei are proportional to their charge .
We attribute the knee to the contribution of oxygen nuclei,
because:
(i) its position at 3 PeV corresponds to the theoretical prediction of
for oxygen accelerated in the hot
interstellar medium;
(ii) its position and intensity stand well at the extrapolation from the
results of direct measurements at lower energies;
(iii) it helps to understand the sharpness of the EAS size spectra,
because the nuclei-initiated showers have smaller fluctuations in
their development and the sharp cutoff in the primary energy spectrum
should not be diluted when transferred to the EAS size spectrum.
Sharpness
The assumptions adopted in SSM help us to understand the observed sharpness of all the shower components. It is ensured by the fact that it is just one single supernova, exploded in a single environment, it is only one nucleus - oxygen, dominating at the knee energy and oxygen is heavy enough to minimize fluctuations of the shower development.
In Figure 2 there are three lines which show the expected behaviour of the sharpness as a function of the atmospheric depth in SSM, for three values of the experimental errors in the determination of the shower size . The best fit value of standard deviation is 0.16, which is quite reasonable for most of the experimental EAS arrays.
The model gives also a satisfactory description of the smooth decrease of the sharpness with atmospheric depth.
Mass composition
(i) If the knee is attributed to oxygen then the second peak is
probably
associated with iron. The fit of the experimental data requires some
medium heavy nuclei of Ne-S group to be also present. This assumption
explaines well the existence of the second peak and its separation
from the knee by a factor proportional to the charge ( see SSM
based curves in Figure 3 );
(ii) at the moment it is not possible to rule out the alternative
association of the first knee peak with helium, and the second with
oxygen ( or CNO group ). However, this alternative is less
favorable because the larger fluctuations in the helium-induced showers
lead to a stronger dilution of the sharpness in the EAS size
spectra. The smooth
decrease of the sharpness with atmospheric depth requires also the
mass composition of the background to be lighter than that of the
single source, thus in the case of helium dominating at the knee the
background should consist mostly of protons, which is unlikely.
(iii) in both versions of the SSM the primary mass should rise with
energy beyond the knee, which agrees with the results of the
experiments discussed in subsection 3.2. In Figure 5b this rise is
shown by a smooth line. It is seen that in the SSM the rise is
continuous, which agrees with the tendency found at lower energies.
Anisotropy
Despite the fact that the source in the SSM is recent and nearby it is certain that it should not create a very strong anisotropy. If our interpretation of the mass composition, i.e. the dominance of oxygen and iron in the peaks is correct, then the peak energies correspond to a rigidity of 0.4 PV. The maximum Larmor radius of all the nuclei at a rigidity of 0.4 PV in the surroundings of the solar system is about 0.1 pc. The propagation of the cosmic rays from the source is definitely by diffusion and the anisotropy is therefore determined just by the gradient of the very local cosmic-ray density. The second factor which might be important is the location of the solar system with respect to the shock front. If we are inside it, the cosmic rays are highly isotropized and even their gradient is not easy to detect. Perhaps the change of the amplitude and the phase of the first harmonic seen in Figure 4 are the only imprint of the nearby source on the generally isotropic flux of the cosmic rays at PeV energies ?
On the way to the identification of the single source
There are not many of single sources which could be classified as ‘nearby and recent’ ie within the range of a few hundred parsecs and a few hundred thousand years ( Figure 6 ).
The first step in the identification of the source responsible for the knee is to determine whether we are inside or outside the shock front. If our single source is indeed a supernova, the theory of cosmic-ray acceleration by its shock wave indicates that outside the shock region only the highest-energy cosmic rays reach the observer. This spectrum is very hard and looks like a line near the maximum energy (Berezhko et al, 1996). We tested this type of the spectrum by applying it to our model and trying to fit the observed experimental data on the sharpness and the behaviour of excess over the running mean. The sharpness of the knee in the primary energy spectrum obtained in this model grew up to 6.0, the excess over the running mean in the knee increased by a factor of 2 compared with that indicated in Figure 3 and a large region of negative excess appeared below the knee both in the Cherenkov light and in the EAS size spectra, all these features are completely inconsistent with what is observed in the experimental data. Therefore, on the basis of this analysis, we should say that the case when we are inside the shock is preferable, compared with the opposite case when we are outside it. We can remark that this conclusion helps to understand also the relatively small amplitude of the anisotropy in the knee region. The typical propagation of the shock wave from the supernova explosion, taken from the Berezhko et al., 1996 calculations, is shown in Figure 6 by the dotted line. The sources inside the shock should lie to the right of this line.

Another step in the identification of the source might be based on the analysis of the energy content of the source. The candidate for the source could not be too far from the solar system or too close to the moment of the explosion in order to have enough energy in cosmic rays and give the required contribution to the cosmic-ray flux at the knee. We have compared the energy density of the our single source, shown in Figure 5a, with that contained in the spectra calculated by Berezhko et al., 1996. The result is shown by the dashed line in Figure 6 and means that required energy density might be achieved if the supernova is to the right of this line. Thus the possible candidates for our single source might be found in the right and lower corner of the plot in Figure 6. At the moment, both the source which gave birth to the Loop I and Geminga pulsar are the most favorable contenders. However, taking into account large errors in the determination of the age and distance, other nearby sources, shown in the Figure 6 or still unknown, cannot be excluded. The problem of the identification is still with us.
CONCLUSION
The recent results on extensive air showers ( both by way of particles and Chherenkov radiation ) allow us to conclude that: a) the knee observed in the cosmic-ray spectrum at about 3 PeV has an astrophysical origin; b) the sharpness and the fine structure of the knee rule out the Galactic Modulation Model as the origin of the knee; c) the most likely model of the knee origin is the source model in which the knee appears as the result of the explosion of a single, recent, nearby supernova.
Acknowledgments
A.D.E. thanks the Organizing Committee of 33d COSPAR Assembly for the invitation to give this talk and for providing the financial support. The Royal Society and UK’s PPARC are thanked for supporting this work.
References
- [1] Arqueros F., Barrio J.A., Bernlöhr K., Bojahr H., Calle I. et al., Energy Spectrum and Chemical Composition of Cosmic Rays between 0.3 and 10 PeV Determined from the Cherenkov-Light and Charged-Particle Distributions in Air Showers, Astronomy and Astrophysics, 359, 682-694 (2000)
- [2] Berezhko E.G., Elshin V.K., Ksenofontov L.T. The Acceleration of Cosmic Rays in Supernova Remnants, Journal of Experimental and Theoretical Physics, 82, 1-18 (1996)
- [3] Biermann P.L. Cosmic Rays: Origin and Acceleration. What We learn from Radio Astronomy, 23d International Cosmic Ray Conference, Calgary, Invited, Rapporteur & Highlight Papers, 45-83 (1993)
- [4] Chilingarian A.A., Hovsepyan G., Gharagyozyan G., Kazaryan S., Melkumyan L. et al., The EAS Size Spectrum Measured at ANI Cosmic Ray Observatory in the Region of Knee, 26th International Cosmic Ray Conference, Salt Lake City, 1, 240-243 (1999)
- [5] Dickinson J.E., Gill J.R., Hart S.P., Hinton J.A., Lloyd-Evans J. et al., Studies of the Mass Composition of Cosmic Rays with the SPASE-2/VULCAN instrument at the South Pole, 26th International Cosmic Ray Conference, Salt Lake City, 3, 136-139 (1999)
- [6] Erlykin A.D. and Wolfendale A.W. A Single Source of Cosmic Rays in the Range eV, Journal of Physics G: Nuclear and Particle Physics, 23, 979-989 (1997)
- [7] Erlykin A.D., Lipsky M., Wolfendale A.W., High Energy Cosmic Ray Spectroscopy, IV: the Evidence from Direct Observations at Lower Energies and the Location of the Local SNR, Astroparticle Physics, 8, 283-292 (1998)
- [8] Erlykin A.D. and Wolfendale A.W. Structure in the Cosmic Ray Spectrum: an Update, Journal of Physics G: Nuclear and Particle Physics, ( submitted for publication ) (2000)
- [9] Fortson L.F., Fowler J.W., Jui C.H., Kieda D., Ong R.A. et al., Composition Results at the Knee from CASA-BLANCA, 26th International Cosmic Ray Conference, Salt Lake City, 3, 125-128 (1999)
- [10] Glasmacher M.A.K., Catanese M.A., Chantell M.C., Covault C.E., Cronin J. et al., The Cosmic Ray Spectrum between and eV, Astroparticle Physics,10, 291-302 (1999)
- [11] Glasstetter R., Hörandel J.R. for the KASCADE collaboration., Electron, Muon and Hadron Size Spectra of EAS in the ’Knee’ Region, Nuclear Physics B (Proc. Suppl.), 75A, 238-240 (1999)
- [12] Goryunov N.N., Dedenko L.G., Zatsepin G.T., The Nature of High-Energy Cosmic Rays and Extensive Air Showers, Izvestiya Academii Nauk SSSR, ser. fiz., 26, 685-668 (1962)
- [13] Gress O.A., Gress T.I., Korosteleva E.E., Kuzmichev L.A., Lubsandorzhiev B.K. et al., The Study of Primary Cosmic Rays Energy Spectrum and Mass Composition in the Energy Range 0.5-50 PeV with TUNKA EAS Cherenkov Array, Nuclear Physics B ( Proc. Suppl.), 75A, 299-301 (1999)
- [14] Hillas A.M. The Knee of the Cosmic Ray Spectrum: Not a Magnetic Trapping Effect ?,16th International Cosmic Ray Conference, Kyoto, 8, 7-12 (1979)
- [15] Kalmykov N.N. and Pavlov A.I., The Regular Galactic Magnetic Field and Primary Cosmic Ray Energy Spectrum at the Knee Region, 26th International Cosmic Ray Conference, Salt Lake City, 4, 263-266 (1999)
- [16] Kampert K.-H., Antoni T., Apel W.D., Badea F., Bekk K. et al., The KASCADE Air Shower Experiment: Composition Analyses and Energy Spectrum, 26th International Cosmic Ray Conference, Salt Lake City, 3, 159 (1999)
- [17] Kulikov G.V., Khristiansen G.B., On the size spectrum of Extensive Air Showers, Journal of Experimental and Theoretical Physics, 35, 635-640 (1958)
- [18] Nikolsky S.I., Break in the Cosmic Ray Spectrum or Confinement Violation near TeV, Nuclear Physics B ( Proc. Suppl.), 39A, 228-234 (1995)
- [19] Peters B. The Energy Spectrum of Primary Cosmic Rays and Extensive Air Showers, 6th Internaional Cosmic Ray Conference, Moscow, 3, 157-166 (1959)
- [20] Swordy S.P., Kieda D.B., Elemental Composition of Cosmic Rays near the Knee by Multiparameter Measurements of Air Showers, Astroparticle Physics, 13, 137-150 (2000)