XTE J1550564: A superluminal ejection during the September 1998 outburst
Abstract
In 1998 September, the X-ray transient XTE J1550564 underwent a major outburst in soft and hard X-rays, followed by a radio flare. Australian Long Baseline Array images obtained shortly after the peak in the radio flare showed evolving structure. The components observed have an apparent separation velocity of .
keywords:
stars:individual:XTE J1550564, radio continuum:starsguessConjecture {article} {opening}
1 Introduction
The X-ray transient XTE J1550564 was discovered simultaneously by the All-Sky Monitor on the Rossi X-ray Timing Explorer [Smith (1998)] and by the Burst and Transient Source Experiment on the Compton Gamma-Ray Observatory [Wilson et al. (1998)] on MJD 51063 (1998 Sept 7; MJDJD240000.5). Following the discovery of the radio counterpart [Campbell-Wilson et al. (1998)], XTE J1550564 was monitored with the Molonglo Observatory Synthesis Telescope (MOST) at 843 MHz between MJD 51065 and 51092. A flare was recorded, peaking with an estimated flux density of 380 mJy on MJD 51078. Two Very Long Baseline Interferometry (VLBI) observations using the Australian Long Baseline Array (LBA) were performed 2–3 days after the MOST flare. In this paper we present the resulting images from these observations, and discuss briefly the implications of the evolving structure observed.
2 Observations and results
The VLBI observations were carried out on 1998 Sept 24 and 25 and are summarized in Table 1. The data post-correlation used the aips task fring to find fringes and calibrate the fringe amplitude. Due to the small number of baselines, the Caltech program difmap was used to model and source fit the data, and measure the flux densities.
| Date | Tstart | Tend | Antenna | Frequency | ||
|---|---|---|---|---|---|---|
| (UT) | (UT) | (GHz) | ||||
| 1998 Sept 24 | 02:17 | 06:08 | DSS45 (34m) | 2.29 & 8.4 | ||
| Mid-point (MJD): | 51080.7 | Hobart (26m) | 2.29 & 8.4 | |||
| Mopra (22m) | 2.29 | |||||
| 1998 Sept 25 | 22:30 | 09:00 | DSS43 (70m) | 2.29 & 8.4 | ||
| Mid-point (MJD): | 51081.7 | Hobart (26m) | 2.29 & 8.4 | |||
| Mopra (22m) | 2.29 | |||||
| ATCA (622m) | 2.29 | |||||
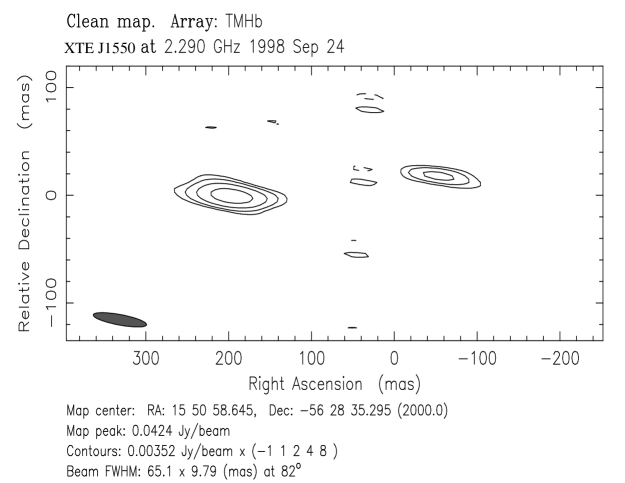
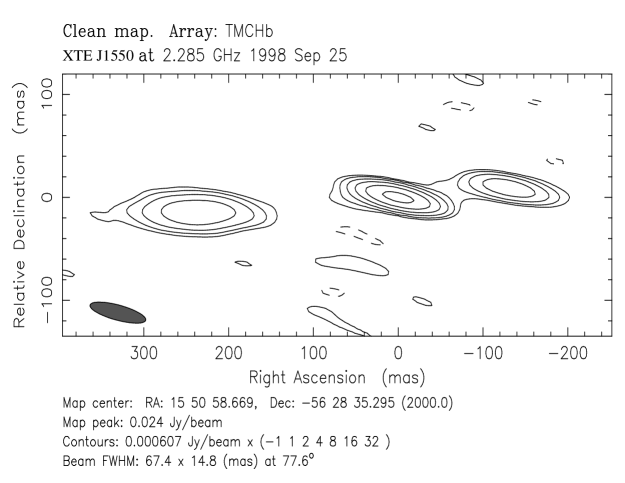
Figure 1 shows the resulting VLBI images at 2.29 GHz from 1998 Sept 24 in the top panel and from 1998 Sept 25 in the bottom panel. Phase-referenced observations were not performed on either day so the zero coordinate in the images is arbitrary. The flux densities (with uncertainties of 10–20%) of the components are summarized in Table 2.
| Flux density (mJy) | |||||
| Date | East | Central | West | Total | |
| 1998 Sept 24 | 71 | – | 20 | 91 | |
| 1998 Sept 25 | 19 | 25 | 8 | 52 | |
The image from 1998 Sept 25 clearly shows an additional component compared to the image on 1998 Sept 24. As the image center is arbitrary, it is not obvious how to relate the components seen in the two images. However, two-point spectral indices derived from Australia Telescope Compact Array data at the time of the radio flare show a flattening just prior to the first VLBI observation from about to () over the interval 4.8–8.6 GHz [Hannikainen et al. (2000a)]. This is very similar to the behavior seen in the 4.8–8.6 GHz two-point spectral index of GRO J165540 during the 1994 jet ejection episodes [Hannikainen et al. (2000b)] and strongly suggests that a new optically thick outburst occurred. If this interpretation is correct, then we associate the central component in the bottom panel with the flaring core and thus the two components in the top panel, the ejecta, can be associated with the two outermost components in the bottom panel. This interpretation is reinforced by the 1998 Sept 25 single-baseline 8.4 GHz data which shows a new unresolved component not present in the 1998 Sept 24 data. This means that in one day the ejecta have moved apart by approximately 115 mas. At an estimated distance of 3.5–5 kpc (McIntyre, in preparation) this implies a separation velocity for the ejecta, which makes XTE J1550564 the fifth Galactic source to exhibit apparent superluminal motion.
3 Conclusions
We have presented two VLBI images of XTE J1550564 from the time of the 1998 September outburst and showed that the source evolved over a period of 24 hours. The two outermost components seen in the 1998 Sept 25 image are associated with the two components in the 1998 Sept 24 image, implying an apparent separation velocity of .
Acknowledgements.
The Australia Telescope Compact Array and the Mopra Telescope are part of the Australia Telescope which is funded by the Commonwealth of Australia for operation as a National Facility managed by CSIRO. We thank the staff of both the University of Tasmania, Hobart, and the Canberra Deep Space Communications Complex, Tidbinbilla. DH acknowledges the support of a PPARC postdoctoral research grant to the University of Southampton.References
- Campbell-Wilson et al. (1998) Campbell-Wilson, D., McIntyre, V., Hunstead, R., and Green, A.: 1998, IAUC 7010
- Hannikainen et al. (2000a) Hannikainen, D., Wu, K., Campbell-Wilson, D., Hunstead, R., Lovell, J., McIntyre, V., Reynolds, J., and Tzioumis, T.: 2000a, submitted to Proceedings of the 4th INTEGRAL Workshop, ESA-SP
- Hannikainen et al. (2000b) Hannikainen, D.C., Hunstead, R.W., Campbell-Wilson, D., Wu., K., McKay, D.J., Smits, D.P., and Sault, R.J.: 2000b, ApJ, 540, 521
- Smith (1998) Smith, D.A.: 1998, IAUC 7008
- Wilson et al. (1998) Wilson, C.A., Harmon, B.A., Paciesas, W.S., and McCollough, M.: 1998, IAUC 7010