Surrey, RH5 6NT, UK 55institutetext: SRON Laboratory for Space Research, Sorbonnelaan 2, 3584 CA Utrecht, the Netherlands
First XMM-Newton observations of an isolated neutron star: RXJ0720.43125 ††thanks: Based on observations obtained with XMM-Newton, an ESA science mission with instruments and contributions directly funded by ESA Member States and the USA (NASA).
We present the high resolution spectrum of the isolated neutron star RXJ0720.43125, obtained with the Reflection Grating Spectrometer on XMM-Newton, complemented with the broad band spectrum observed with the EPIC PN camera. The spectrum appears smooth, with no evidence for strong photospheric absorption or emission features. We briefly discuss the implications of our failure to detect structure in the spectrum.
Key Words.:
stars: atmospheres – stars: individual (RXJ0720.43125) – stars: neutron – X-rays: stars1 Introduction
There is now compelling evidence that the ROSAT source RXJ0720.4-3125, first discovered in a systematic survey of the galactic plane (Haberl et al. 1997), is a nearby isolated neutron star. Its spectrum appears very soft ( eV), and there is little attenuation of the X-ray flux by interstellar absorption. There is a plausible optical counterpart (Motch & Haberl 1998; Kulkarni & van Kerkwijk 1998), and the measured X-ray to optical flux ratio basically rules out an accreting (low-mass) X-ray binary, or an isolated white dwarf. Perhaps the strongest piece of evidence is the detection of a fairly shallow, quasi-sinusoidal modulation of the X-ray flux, at a period of 8.39 sec (Haberl et al. 1997). The stability of this period, as measured with ROSAT over the period 1993-1996, suggests that we are seeing modulation by the spin of a compact object, most likely a neutron star.
The sinusoidal shape of the modulation in turn suggests that it is due to changing visibility, and possibly limb-darkening effects, of a hot polar cap (or polar caps), against a cooler atmosphere. Such a region could be heated by accretion from the interstellar medium, with the accretion stream focused by a magnetic field of order G (the field can be no stronger, or else it would prevent accretion onto the surface, given the spin period and likely values for the density of the insterstellar medium). Alternatively, the object could be releasing heat from decay of a very strong magnetic field, which would at the same time modulate the heat flow through the atmosphere due to the influence of the field on the thermal conduction in the direction transverse to the field (Greenstein & Hartke 1983).
These issues can be directly addressed by studying both the spin history, as well as the detailed photospheric emission spectrum of the object. With XMM-Newton, we have recently obtained data of superior sensitivity that will allow us to pursue both these possibilities.
In this Letter we present a preliminary analysis of the high-resolution spectrum of RXJ0720.43125, obtained with the Reflection Grating Spectrometer (RGS; den Herder et al. 2001), which covers the range 5-35 Å at an approximately constant resolution Å. Data were obtained simultaneously with the EPIC focal plane imaging cameras (Turner et al. 2001), of which the PN camera (Strüder et al. 2001) offers the combination of high sensitivity and high time resolution. This latter dataset will be used to investigate the evolution of the spin period. Unfortunately, however, we currently lack the satellite dynamical data to perform an accurate barycentric correction to the photon arrival times, and we defer an accurate measurement of the spin period to a forthcoming paper.
2 Photospheric spectroscopy
2.1 Data analysis
XMM-Newton (Jansen et al. 2001) observed our target RXJ0720.43125 on 13 May 2000, during the Calibration/Performance Verification phase of the mission, for a total of 62.5 ksec (continous viewing). The data were processed using the standard RGS pipeline software, provided within the SAS (Scientific Analysis System) package. Reconstructed events are placed on a common dispersion-angle and CCD pulse height scale. Bad pixels are removed from the data, and an exposure map is calculated to correct for the resulting spatial modulation of the sensitivity. Based on the known geometry of the spectrometers, dispersion angles are converted to wavelength (for details of the preflight and in-flight wavelength calibration, we refer to den Herder at al. [2001]). The resulting photon list is four dimensional: each event is labeled with wavelength (or dispersion angle), cross-dispersion coordinate, CCD pulse height, and CCD frame number (time). A spectrum is assembled by imposing a joint spatial/CCD-spectral filter on the data. This filter also effectively selects between spectral orders, which appear offset in dispersion angle/CCD pulse height space. Background is determined from repeating this extraction for a region on the focal plane detector parallel to the source spectrum, but offset in the cross-dispersion direction. The response of the spectrometer associated with the choice of spatial/pulse height filters can be generated automatically from an explicit model for the spectrometer (optics and detectors).
Given the 8.39 sec periodicity of the source, we tried to optimize time resolution and sensitivity of the RGS, in order to perform phase-resolved spectroscopy. In principle, the RGS focal plane CCD detectors can be read out in the cross-dispersion direction in continuous clocking mode. This provides a photon arrival time resolution of msec, but at the expense of the cross-dispersion imaging information. This limits the application of this High Time Resolution mode to bright sources only. On the other hand, the standard readout sequence of the nine CCD chips that make up one focal plane detector requires 5.7 sec, which is too long to allow for a meaningful phase resolution in the case of RXJ0720.43125. We therefore decided to operate one spectrometer (RGS1) in standard imaging mode (5.7 sec time resolution), while we chose a custom readout sequence for the other spectrometer. We interleaved a readout of CCD chip nr 3 in RGS2 with the sequential readouts of the other chips. This chip covers the approximate wavelength range 24-28 Å, which is therefore read out every 1.1 sec. This compromise between time resolution and spectral coverage was based on the fact that the spectrum appears as a very soft ( eV) blackbody in the ROSAT PSPC, which we expected to peak around 20 Å in the RGS. In principle, therefore, we can phase resolve the 24-28 Å region of the spectrum. In this paper, however, we will restrict the discussion to the phase-averaged RGS spectrum.

2.2 Blackbody fits
Figure 1 shows the spectra from the two RGS’s. Overlaid on the data is a simple blackbody spectrum, which, somewhat suprisingly and disappointingly, turns out to be an acceptable fit to the data. The best fitting parameters for a joint RGS1/2 fit are eV, and a column density of cm-2. At first sight, one might be tempted to identify coherent features in the post-fit residuals. But careful inspection shows that none of these appear significantly in both spectrometers simultaneously, and so we conclude that the spectrum appears smooth, to within the limits implied by the counting statistics fluctuations in this observation. Based on our experience with similarly smooth continuum spectra in the RGS, we roughly estimate that features with an equivalent width larger than approximately one-fifth of the spectral resolution (or Å) should have been detectable.
The spectrum obtained with the PN camera, although of lower spectral resolution than the RGS spectrum, covers a wider band than RGS, and has higher signal to noise per resolution element, and we use it to investigate possible subtle broad-band deviations from the simple black-body shape. A PN spectrum was accumulated using single-pixel events for which a relatively advanced response matrix exists. From the total exposure of 62.5 ks the last 10 ks and some shorter intervals could not be used for the analysis due to strong background flaring which saturated the data handling system. The total average source count rate is 6.1 counts s-1 (not yet corrected for deadtime). The spectrum was satisfactory fit with an absorbed blackbody model. The best fit parameters are a column density of cm-2, and a temperature of eV with formal 1 errors. The column density is a factor of two lower than derived from the ROSAT PSPC spectrum by Haberl et al. (1997), which is probably caused by calibration uncertainties at the very low energies in both instruments. There is also a formal discrepancy between the column densities measured with RGS and PN, probably due to the fact that RGS is less sensitive to small column densities, and the presence of a small remaining calibration uncertainty around the O K edge in RGS. Fixing the column density at the best fitting PN value would slightly increase the RGS blackbody temperature, to eV.
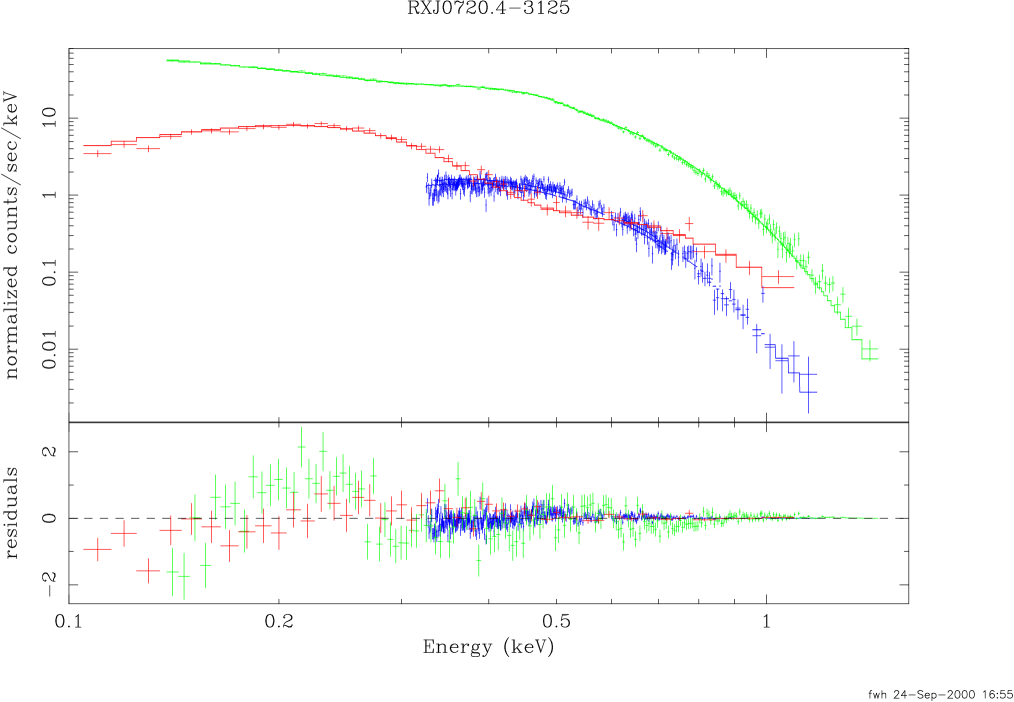
A combined fit of the RGS, EPIC-PN, and ROSAT PSPC spectra is shown in Figure 2. Both RGS spectra are superimposed, and all spectra have been rebinned such that each spectral bin contains at least 20 counts. The best fit column density and temperature are cm-2 and eV, and these values are dominated by the PN spectrum due to its high statistical quality. The absolute normalizations are still preliminary as accurate exposure and deadtime calculations are not finalized yet. Residuals in the PN fit around 0.28 keV are caused by inaccurate filter transmission data near the carbon K-edge of the thin filter.
2.3 Neutron star atmospheres
We also applied neutron star atmosphere models to the RGS and PN data. The X-ray spectra emitted by strongly magnetized atmospheres should exhibit a number of spectral features. First of all, there are electron and proton cyclotron resonances, at energies of keV and eV, respectively, where G is the neutron star surface magnetic field (cf. Pavlov et al. 1995; Zane et al. 2000). Absence of any significant absorption features in the RGS spectra in the keV range would appear to exclude magnetic fields of and G. Similarly, we do not detect a significant cyclotron emission feature, such as has been predicted by Nelson et al. (1993), for a Coulomb heated neutron star atmosphere. We note that these conclusions are relatively robust, because cyclotron features are expected to appear in the spectrum regardless of the surface composition, assuming that the atmosphere is not predominantly neutral (which may be the case for very strong fields).
As far as atomic transitions are concerned, their energies and shapes are of course strongly dependent on the conditions in the atmosphere, and our non-detection of any strong spectral features can therefore only place model-dependent constraints on the stellar parameters. Roughly speaking, there are four possible classes of atmospheric models: those with, and without a strong magnetic field, and those of pure hydrogen composition as opposed to metal-enriched or even pure metal composition. We regard any predictions with respect to either of these parameters as sufficiently uncertain that it makes sense to compare our spectrum to predictions for all four cases.
We start with pure hydrogen atmospheres. At temperatures below K, the spectra of magnetized hydrogen atmospheres have pronounced features in the soft X-ray range due to bound-bound transitions in the hydrogen atom (Pavlov & Zavlin 2001). The energy of the strongest transition is estimated by the formula keV. This excludes magnetic fields of G. On the other hand, fits with hydrogen atmosphere models for G and G (which have no discrete structure in our band) require a surface temperature of K, significantly lower than that given by the blackbody fit. However, the shapes of these very low or high B-field atmospheric spectra are sufficiently similar to blackbodies (of very different effective temperature, however) that we cannot distinguish between blackbody and hydrogen atmosphere models on statistical grounds.
Low-field models with significant metal abundance (either solar abundances, or pure iron) do not fit the data because of the strong atomic absorption features in the spectra (Rajagopal & Romani 1996; Zavlin et al. 1996). The case of strongly magnetized metal-enriched atmospheres is more difficult to assess due to the relative scarcity of relevant calculations. The strongly magnetized pure Fe spectra presented by Rajagopal et al. (1997) show significant absorption structure in the RGS band (for sufficiently high that the radiation is detectable), but the structure may be subtle enough (dense, and small contrast) that it may not be easy to detect in data of finite resolution and statistical quality. We regard the absence of strong features in our spectrum as inconclusive in this respect.
3 The X-ray pulsation
We have accumulated counts from the EPIC-PN detector over the energy ranges 0.1–0.4, 0.4–0.8 and 0.8–1.2 keV and phase-averaged them over 42 phase intervals on the 8.391 sec ephemeris of Haberl et al. (1997). We show the intensity curve in the 0.1–1.2 keV energy band together with the hardness ratio (soft/medium) in Figure 3. Because of its poorer time resolution we have not used the EPIC-MOS data.
The general shape of the phased intensity curve is similar to that found by Haberl et al. (1997) although the uncertainties are smaller. It appears approximately symmetrical and sinusoidal; the amplitude is %. Very interestingly, the hardness ratio is also seen to vary, in the sense that it is softest around flux maximum, but the amplitude is smaller (%). The phasing of the hardness ratio curve is slightly but significantly earlier than the intensity curve. A cross-correlation of the two curves indicates that the phase difference between maximum intensity and maximum hardness is .

Because of the uncertainty in absolute timing for our data, we are currently unable to refine the ephemeris to the level required to discern any changes in the period of the X-ray pulsation with respect to the period as measured with ROSAT. A Fourier analysis of the data using an arbitrary starting time yields only one significant period, at 8.3912 sec, consistent with that reported by Haberl et al. (1997).
The high S/N ratio of the X-ray pulsation in these data provides the opportunity for a more detailed modeling of the angular and spatial distribution of the radiation than was possible from the ROSAT data, and this analysis will be presented in a companion paper (Cropper et al. 2001).
4 Conclusions
We present the atmospheric spectrum of the isolated neutron star RXJ0720.43125, as measured with the RGS and EPIC-PN instruments on XMM-Newton. We find that the spectral shape is smooth, without evidence for strong spectral features. The absence of electron or proton cyclotron resonances in the RGS band would appear to exclude average surface magnetic field strengths of and G. The implications of the apparent absence of atomic transitions are strongly model dependent, and we can therefore not rule out either a pure hydrogen atmosphere or a metal-rich atmosphere, if the magnetic field strength satisfies certain restrictions.
Acknowledgements.
The Columbia group is supported by the US National Aeronautics and Space Administration. We gratefully acknowledge comments from the referee, George Pavlov.References
- (1) Cropper, M., Zane, S., Ramsay, G., Haberl, F., Motch C. 2001, A&A, 365 (this issue).
- (2) Greenstein, G., Hartke, G. J. 1983, ApJ, 271, 283.
- (3) Haberl, F., Motch, C., Buckley, D. A. H., Zickgraf, F.-J., Pietsch, W., 1997, A&A, 326, 662
- (4) den Herder, J.-W., Brinkman, A. C., Kahn, S. M., et al. 2001, A&A, 365 (this issue).
- (5) Jansen, F., Lumb, D., Altieri, B. et al. 2001, A&A, 365 (this issue).
- (6) Kulkarni, S. R., van Kerkwijk, M H. 1998, ApJ, 507, L49.
- (7) Motch, C., Haberl, 1998, A&A, 333, L59.
- (8) Nelson, R. W., Salpeter, E. E., Wasserman, I. 1993, ApJ, 418, 874.
- (9) Pavlov G. G., Shibanov Yu. A., Zavlin V. E., Meyer R. D. 1995, in ’The Lives of the Neutron Stars’, ed. M. A. Alpar, Ü. Kiziloğlu, J. van Paradijs, (Dordrecht: Kluwer), p. 71
- (10) Pavlov G. G., Zavlin V. E. 2001, in preparation
- (11) Rajagopal M., Romani R. W. 1996, ApJ, 461, 327
- (12) Rajagopal M., Romani R. W., Miller, M. C. 1997, ApJ, 479, 347.
- (13) Strüder, L. et al. 2001, A&A, 365 (this issue).
- (14) Turner, M. et al. 2001, A&A, 365 (this issue).
- (15) Zane, S., Turolla, R., Treves, A. 2000, ApJ, 537, 387.
- (16) Zavlin V. E., Pavlov G. G., Shibanov Yu. A. 1996, A&A 315, 141