RADIO SUPERNOVA 1987A AT 843 MHz
Lewis Ball1, D. F. Crawford1,
R. W. Hunstead1, I. Klamer1,
& V. J. McIntyre1,2
1School of Physics, University of Sydney, N.S.W. 2006, Australia;
ball@physics.usyd.edu.au
2 Australia Telescope National Facility, CSIRO, PO Box 76,
Epping, N.S.W. 2121, Australia
The Astrophysical Journal; in press
Submitted: 6 June 2000
Revised: 14 July 2000; 30 October 2000
Accepted: 31 October 2000
Abstract
We report here the flux densities of the evolving radio source SN1987A at 843 MHz measured from observations made with the Molonglo Observatory Synthesis Telescope between 1994 September and 2000 May. The radio light curve shows that the rate of increase of the flux density jumped markedly around days 2800-3000 (i.e. in the first half of 1995), and that since then the radio evolution has been remarkably well fitted by a simple linear increase of . We discuss in detail the relationship between the radio light curve and the recent brightening of the system at optical wavelengths.
keywords:
supernovae: general, supernovae: individual: SN1987A, supernova remnants, radio continuum: generalAstrophysical Journal, in press
Submitted: 6 June 2000. Revised: 14 July 2000; 30 October 2000. Accepted: 31 October 2000
1 Introduction
Supernova 1987A (SN1987A) in the Large Magellanic Cloud is the nearest supernova explosion detected in over 300 years. Although not particularly bright, its proximity has facilitated studies at a level of detail unprecedented in supernova research, and rivalled only by the bright SN1993J.
We report here on observations of the radio emission from SN1987A at 843 MHz using the Molonglo Observatory Synthesis Telescope (MOST). Our results cover the period 1994 September – 2000 May, extending previously published data for 1987 February – 1994 September (Ball et al. 1995). Together these data sets from the MOST comprise a unique time series, sampled at intervals of 2 to 6 weeks.
Radio emission from SN1987A was first detected with the MOST on 1987 February 25.23 UT (Turtle et al. 1987), just two days after the arrival of neutrinos on February 23.32 (Bionta et al. 1987). After rising quickly to a peak flux density of mJy at 843 MHz the emission decayed rapidly and was undetectable at radio frequencies after 1987 September. On 1990 July 5 MOST observations indicated the reappearance of radio emission from SN1987A (Ball et al. 1995), an event confirmed about a month later by observations at 4.8 GHz with the Australia Telescope Compact Array (Staveley-Smith et al. 1992). These observations were the first indications that the expanding shock from the supernova explosion had encountered a dramatic change in the circumstellar material (CSM) it was passing through, an interpretation first suggested on the basis of modelling of the radio emission (Ball & Kirk 1992). Confirmation of this scenario followed from measurement of the low expansion speed of the radio source (Staveley-Smith et al. 1993; Gaensler at al. 1997) which required a dramatic deceleration of the supernova shock at or prior to the onset of the second phase of radio emission. More detailed models for the radio emission (Duffy, Ball & Kirk 1995) and for the hydrodynamics of the interaction of the supernova ejecta with the CSM (e.g. Chevalier & Dwarkadas 1995; Borkowski, Blondin & McCray 1997) all attribute the radio emission to the interaction of the SN shock with a density jump in the CSM.
The implied radius of the circumstellar density jump responsible for the reappearance of the radio emission is smaller than that of the dense ring surrounding SN1987A (Jakobsen et al. 1991; Plait et al. 1995; Sonneborn et al. 1997). Spatially-resolved spectra of SN1987A from the STIS instrument on the Hubble Space Telescope indicated that on 1997 April 26 (day number 3714) the reverse supernova shock radius was of that of the ring (Sonneborn et al. 1998). HST images from the WFPC2 instrument show that line emission from a local ‘knot’ on the inner edge of the ring brightened by tens of percent between early-1996 and mid-1997 (days 3200–3750; Garnavich, Kirshner & Challis 1997). There are now clear indications that similar brightenings are taking place over a large fraction of the ring (Bouchet et al. 2000; Lawrence & Crotts 2000; Maran, Pun & Sonneborn 2000; Garnavich, Kirshner & Challis 2000), suggesting that the interaction of the supernova shock and the inner edge of the ring is underway. Further analysis of archival WFPC2 images shows that the optical signatures of the interaction between material from the supernova explosion and the inner edges of the ring have been detectable since early 1995 (Lawrence et al. 2000).
The radio data we report here show that the emission from SN1987A at 843 MHz has continued to increase monotonically from 1990 July until May 2000. We present 106 new flux density determinations for the radio emission from SN1987A at 843 MHz between 1994 September and 2000 May. In §2 we briefly describe the observations themselves. In §3 (and Appendix A) we explain the approach used to reduce the observations of this time-varying source. The reduced data are described in §4 and tabulated in Appendix B. In Appendix C we discuss an alternative, more direct data reduction method, and compare the results with those given in Appendix B. In §5 we discuss the implications of the observed evolution of the 843 MHz radio flux density from SN1987A. In particular we investigate the evidence for features in the 843 MHz radio light curve that may be related to the dramatic changes in the optical line emission from this source that herald the collision of the supernova shock with the ring.
2 Observations
The MOST is a synthesis telescope comprising two colinear, cylindrical-paraboloid reflectors each m wide and m long (Mills 1981; Robertson 1991). It operates at 843 MHz (a wavelength of m) and measures right circular polarization. The telescope is unique in that it forms a comb of 64 fan beams in real time, and an image is available immediately following a 12-hour observation. The synthesised beam of the telescope at the declination of SN1987A is FWHM, so the supernova is recorded as a point source.
We report here on the results of 106 12-hour synthesis observations of the field including SN1987A. All the observations reported here were made with the same pointing center, using the standard field of the telescope. A small number of observations which were incomplete, or of low quality due to technical problems, have been discarded.
3 Data analysis
The flux density of any unresolved source, such as SN1987A, can be estimated directly from the image produced automatically at the end of a 12-hour MOST synthesis observation. However, the precision of such direct estimates is limited by contributions from out-of-field sources which cancel imperfectly as a result of variations in ambient conditions and telescope characteristics during the observation.
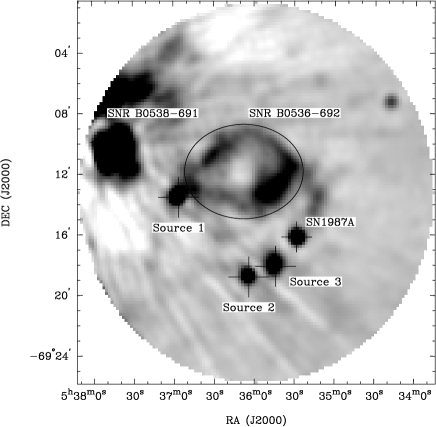
SN1987A is situated in a complex region of the radio sky, as can be seen from the MOST image of the field presented in Figure 1. The complexity of the radio emission surrounding SN1987A and, in particular, its proximity to the bright Hii complex 30 Doradus and the supernova remnant SNR B0538691, degrade the accuracy of direct estimates of the flux density of SN1987A. This was especially true in the first few years of observations when the supernova was a relatively weak source. As a result a novel and complex method of analysing the data was developed specifically for this unique object (Ball et al. 1995) involving correcting each 24-second record of a 12-hour observation. Although less transparent than procedures that aim to correct the synthesised image, correction of each record in the data set can provide flux density estimates with considerably lower scatter, approaching the limiting thermal noise of the telescope.
While the same method still provides accurate estimates of the flux density of SN1987A, the effects of differential precession (with respect to a reference data set made from observations before the appearance of the supernova) have become important. The increasing flux density of the supernova itself was also beginning to affect the calibration procedure. To address these effects some details of the analysis procedure have been modified while retaining the significant features of the method, particularly the reliance on correcting each 24-second record in an observation to be as close as possible to that from the reference. The changes to the analysis from that of Ball et al. (1995) are detailed in Appendix A.
The consistency between the flux density estimates obtained by the revised data analysis described in Appendix A and those published in Ball et al. (1995), is very good. For the observations of the standard field up to 1994 September 3, 60% of the estimates agree within , 90% within and 97% within , where is the uncertainty quoted by Ball et al. (1995) in their Equation (2).
The internal consistency of the flux density measurements can be estimated by analysing the scatter about a linear trend for periods of up to a few hundred days over which such a trend is a good fit to the data. This suggests that the uncertainty at epochs after 1994 September is dominated by a flux dependent term which is conservatively estimated at 2%, the same as the flux-dependent contribution reported by Ball et al. (1995).
4 Flux density estimates
A total of 106 independent measurements of the 843 MHz flux density from SN1987A are tabulated in Appendix B. These comprise the MOST data set from 1994 September 17 (day 2763) until 2000 May 05 (day 4820). The quoted uncertainties for the record-corrected estimates are simply 2%, based on the scatter of the estimates about a linear increase.
The entire evolution of the radio emission from SN1987A at 843 MHz, based on the flux densities tabulated in Appendix B together with those from Ball et al. (1995), is shown in Figure 2. This ‘light curve’ illustrates dramatically the two distinct phases of radio emission, separated by almost 3 years during which SN1987A was undetected at radio frequencies.

The most striking feature of the second phase of radio emission is its continued steady increase over an interval of 10 years, quite unlike the behaviour of any other radio supernova observed to date (e.g. Chevalier 1998 and references therein). Some structure is visible in the light curve, including a distinct jump in the rate of increase around days 2800–3000 which has not previously been reported. A simple linear increase at a rate of fits the observed flux densities from day 3000 onwards remarkably well. This rate of increase is significantly higher than that of observed between days 2100 and 2700, but not quite as high as the increase seen between days 1500 and 2100 (Ball et al. 1995). The 843 MHz light curve shows no evidence of any departure from the linear increase between day 3000 (1995 May) and 4820 (2000 May).
4.1 Template image subtraction
The need for a complex treatment of the observations of SN1987A has diminished as the supernova has increased in strength. A simpler alternative method based on the subtraction of a template image representing the observed field in the absence of emission from SN1987A now provides reliable flux density estimates, albeit with somewhat higher uncertainties. This simplified analysis uses the standard data pipeline developed for the Sydney University Molonglo Sky Survey (SUMSS; Bock et al. 1999), and a comparison of the technique with the more complicated record-correction procedures developed for SN1987A provides an invaluable test of its reliability. Details of the template image subtraction estimates of the flux densities of SN1987A for 48 observations between 1997 January 1 and 2000 May 05 are presented in Appendix C.
5 Discussion
5.1 Up to 1995
The reappearance of radio emission from SN1987A in 1990 July was first revealed by MOST observations at 843 MHz, and is now attributed to the encounter of the expanding supernova shock with a circumstellar density jump well inside the circumstellar ring (Ball & Kirk 1992 – hereafter BK92; Chevalier 1992; Duffy, Ball & Kirk 1995 – hereafter DBK95). This interpretation is supported by the analysis of images of the radio emission from SN1987A made at using the Australia Telescope Compact Array (Staveley-Smith et al. 1993; Gaensler et al. 1997). In particular, model fits to super-resolved images of the radio emission suggest that the source of the radio emission was expanding at only in the period 1992–1995, much lower than the average speed of required between the time of explosion and the first imaging observations in 1992 (Gaensler et al. 1997). While this expansion speed is not a direct measurement of the speed of the supernova shock, it clearly indicates that the shock had undergone a dramatic deceleration from its initial speed of greater than (Hanuschik & Dachs 1987), as would occur if the shock encountered a significant jump in the density of circumstellar material (Chevalier & Dwarkadas 1995; Borkowski, Blondin & McCray 1997) associated with a dense Hii region inside the circumstellar ring. The interpretation is also consistent with the observed soft X-ray emission from SN1987A (Beuermann, Brandt & Pietsch 1994; Gorenstein, Hughes & Tucker 1994; Hasinger, Aschenbach & Trümper 1996), though the X-ray evolution is relatively poorly sampled.
The only attempts to model the evolving second phase of radio emission from SN1987A are those of BK92 and DBK95. Based on diffusive acceleration of electrons at an evolving supernova shock, including modification of the shock hydrodynamics by the pressure of accelerated protons, their model fits very well from switch-on to around day 2600 (as shown in Figure 2). BK92 and DBK95 proposed that the switch on and subsequent rise of the radio emission resulted from the supernova shock encounter with a significant jump in the density of the circumstellar material. Chevalier & Dwarkadas (1995) placed this suggestion on a firmer footing, indicating that a very large density jump was expected at the inner boundary of a dense Hii region surrounding the progenitor. At times later than those considered by DBK95 (i.e. after about day 2600 or May 1995) the model flux density reaches a plateau and then decreases slowly – contrary to the observations. The DBK95 model has many limitations (such as assuming spherical symmetry) which rapidly become less tenable at such epochs. No detailed model that combines a plausible distribution of the circumstellar material with a calculation of the supernova shock hydrodynamics and which treats the particle acceleration self consistently has yet been developed.
5.2 1995 on
The optical brightening of the inner edge of the circumstellar ring that has been observed from mid-1996 on (Pun et al. 1997; Garnavich, Kirshner & Challis 1997, 1999 & 2000; Bouchet et al. 2000; Lawrence & Crotts 2000; Maran, Pun & Sonneborn 2000) clearly indicates that the interaction of the supernova shock and the ring is underway. H images show that an isolated spot just inside the main ring brightened by roughly 50% between 1994 February (day ) and 1997 July (day ) and broad band (R) images indicate a brightening by %, occurring between 1996 February (day ) and 1997 July (Garnavich, Kirshner & Challis 1997). More recent reports of R-band observations state that the brightening over the four years prior to 1999 February are well fitted by a steady increase in brightness, suggesting that the optical signature of the interaction may have begun as early as 1995 February (day ; Garnavich, Kirshner & Challis 1999). This has been confirmed by the analysis of archival HST data by Lawrence et al. (2000).
It is possible that the jump in the rate of increase of the radio emission around days 2800 – 3000 and the subsequent long-lived linear rise is associated with the impact of the supernova shock with the ring material. If not, the lack of features in the 843 MHz light curve between days 2800 and 4820 implies that there is no significant radio emission from the impact sites evident in the optical images. Unfortunately, the highest resolution presently available at radio wavelengths with sufficient sensitivity is arcsec at 9 GHz (Gaensler et al. 1997) so direct comparison of radio and optical images is not definitive in this regard.
5.2.1 Timing and the shock radius
The optical ‘hot spots’ which were the first indications of the shock-ring interaction have been reported as being at position angle and arcsec from the supernova (% of the ring radius; Garnavich, Kirshner & Challis 1997) and at p.a. and arcsec (around 80% of the ring radius; Bouchet et al. 2000; Lawrence & Crotts 2000). Lawrence et al. (2000) have shown that there was detectable optical emission from the first hot spot (near p.a. ) since at least March 1995 (day ). This first optical hot spot is not coincident with either radio lobe seen in the GHz images of Gaensler et al. (1997). The brightening first seen around p.a. has now been shown to extend over position angles from to (Maran, Pun & Sonneborn 2000), which is roughly coincident with the brighter of the two radio ‘lobes’ or ‘hot spots’ seen in the GHz images of Gaensler et al. (1997) – and with the major axis of the ring. Lawrence et al. (2000) have shown that the emission from this region began no later than 1999 January (day ) and probably as early as 1998 February (day ).
If the first optical hot spot is in the ring plane, its projected radial distance of arcsec and p.a. of imply a true radial distance from the progenitor of arcsec. The appearance of this emission in early 1995 (around day 3000) therefore suggests a shock radius which is consistent with or perhaps slightly larger than that inferred from model fits of a spherical source to the radio images (Gaensler et al. 1997, Figure 10), given the significant uncertainties in both estimates. The near coincidence of the second more extended region of optical emission with the major axis of the ring implies that if the radiating material is in the ring plane, its true radial distance from the progenitor is the same as its projected radial distance in the plane of the sky. The appearance of this optical emission at a radial distance of arcsec around the beginning of 1998 is again consistent with the radius of model fits to the radio images. Furthermore, the very similar radial distances to the first and second optical hot spots, and the significant delay between their appearance, are broadly consistent with the low expansion speed inferred from the fits to the radio images (Gaensler et al. 1997).
5.2.2 Acceleration times
The acceleration time required for electrons to attain sufficient energy to produce radio frequency synchrotron emission is an important physical parameter. The appearance of optical hot spots suggest that the shock impact with the ring began at least as early as March 1995 (day ; Lawrence et al. 2000). If the change in the evolution of the 843 MHz radio emission around day 3000 is related to the ring impact, the implied acceleration time is less than a few hundred days. The alternative, that a change in the radio emission associated with the ring impact is yet to be observed, may indicate an acceleration time greater than days, the interval from 1995 February to 2000 May. The model for the radio reappearance of SN1987A in 1990 July (BK92; DBK95) suggested that the acceleration time was .
Theory suggests that the time required for diffusive shock acceleration scales as where is the magnetic field and is the shock speed. Given that the shock speed is most probably decreasing with time, the first scenario suggests a significant increase in between the first circumstellar density jump and the ring, while the latter suggests a decrease. If the field is that of the stellar wind, an increase in with radial distance occurs if the wind is confined (as it is in SN1987A), but more detailed modelling is required to address such issues adequately.
6 Future outlook
The very good fit of a simple linear increase to the evolving 843 MHz emission from early 1995 to mid-2000 is remarkable given the inherent complexity of this source. Modelling of this dependence is beyond the scope of the present paper, but its simplicity is encouraging. We propose that the transition to the linear increase at 843 MHz in early 1995 is related to the impact of the supernova shock with circumstellar ring material seen at optical wavelengths by the HST, or at least with fingers of very dense material which intrude from the inner edge of the ring. On the other hand, if the onset of radio emission associated with the ring impact has not yet occurred, it is likely that the first detection of this event will result from the ongoing regular monitoring of SN1987A with the MOST. Comparisons of the 843 MHz light curves with Australia Telescope Compact Array data – comprising light curves at higher radio frequencies and images of the GHz emission – are underway. Analysis aimed at identifying possible changes in the radio spectral index are also underway.
There is ample evidence from observations of the CSM, the explosion ejecta, images of the radio emission and now the brightening of the ring material that the SN1987A system is now far from spherically symmetric. The relationship between the radio emission, the optical emission and the shock evolution is likely to carry strong signatures of this geometry. It is also possible that the radio and optical emission originate from distinct regions of the shock which are encountering different circumstellar environments, and are at different radii. The imminent upgrade of the Australia Telescope Compact Array to 25 GHz will provide higher angular resolution radio images; and comparison with optical and new X-ray images from Chandra may help to clarify such issues.
Acknowledgements
The authors thank Duncan Campbell-Wilson, the Site Manager at the Molonglo Radio Observatory, for his continued efforts and enthusiasm in pursuing the monitoring program for SN1987A. We also thank Bryan Gaensler for numerous ongoing productive and stimulating discussions. The MOST is operated by the University of Sydney and supported in part by grants from the Australian Research Council.
Appendix A Data reduction
Each 12-hour MOST synthesis observation of a field consists of approximately 1795 24-second records comprising 128 beam responses. The analysis used by Ball et al. (1995) involved correcting each record of an observation to be as close as possible to that from a reference data set generated by combining 50 observations of the same field. The analysis used to calculate the flux densities presented here is very similar but with the following differences.
The flux density of SN1987A in a given observation was first estimated directly from the observed data by fitting a point source at the appropriate location to each record. A point source with the mean flux density determined by this method was added to the reference data set at the position of SN1987A. The observed data were then interpolated to the hour angle of the amended reference data set. (In the earlier analysis of Ball et al. 1995 the reference data were interpolated to the hour angle of each observation.) Records with an unacceptably high noise level were rejected at this stage. A gain correction was then determined for each record in the interpolated observation by performing a least squares fit of the beam responses in the data to those in the corresponding amended reference record.
The amended reference data were then subtracted from the interpolated observed data. If the direct estimate of the supernova flux density was accurate, the difference data should contain only noise. We test that assumption by fitting a point source to each record of the difference data, at the position of SN1987A. If the assumption is correct, the mean flux density will be zero, and the record-to-record rms variation will indicate the uncertainty. In general the mean is small but not zero, indicating the effects of imperfect cancellation of out of field sources due to variations in telescope performance during the observation. To correct for these effects we sum the direct estimate of the flux density and the non-zero mean of the fits to the difference data.
The flux density was then scaled by the factor required to ensure that the sum of the flux densities of the nearby reference sources (Sources 1, 2 & 3) was constant. The final estimate of the flux density of SN1987A was obtained by applying a fixed offset to correct for a non-zero base level in the reference data at the supernova position.
In the analysis of Ball et al. (1995) correction terms for the gain, a phase difference and a phase gradient were obtained through a least-squares fit of the Fourier transform of each 24-second record to the corresponding transform of the reference data. The reference data were then subtracted from the inverse transform of the corrected data, and a difference image was synthesised. The flux density of SN1987A was estimated by fitting a source to the difference image. In the new analysis, the comparison was made without performing the Fourier transforms, and the fitting to the difference data was performed for each record, not for the synthesised image. The decision to avoid Fourier transforming the data has the advantage that it avoids the scattering of spurious signal across the data sets that sometimes occurs in the inverse transform (primarily when the untransformed data have much more power at one end of the vector), increasing the noise levels.
Appendix B Flux densities
The table contains the observed flux densities from SN1987A at 843 MHz from 1994 September 17 to 2000 May 05. The day number refers to the midpoint of the observation in UT, relative to the geocentric time of the explosion on 1987 February 23.32 (UT) or JD 2446849.82. The uncertainty estimates are 2% of the flux density.
A complete file of the 843 MHz flux densities of SN1987A is available from
http://www.physics.usyd.edu.au/astrop/SN1987A
Date Day (UT) Number (mJy) (mJy) 1994 Sep 17 2763.5 77.5 1.5 1994 Oct 01 2777.5 76.2 1.5 1994 Oct 15 2791.4 77.7 1.6 1994 Dec 09 2846.3 84.2 1.7 1994 Dec 17 2854.3 83.4 1.7 1995 Jan 08 2876.2 82.5 1.7 1995 Jan 15 2883.2 84.3 1.7 1995 Feb 05 2904.1 85.4 1.7 1995 Mar 11 2938.0 85.9 1.7 1995 Mar 18 2945.0 86.9 1.7 1995 Mar 26 2953.0 87.3 1.7 1995 Apr 08 2966.0 86.4 1.7 1995 Apr 14 2971.9 88.7 1.8 1995 Apr 16 2973.9 86.8 1.7 1995 Apr 22 2979.9 88.0 1.8 1995 Apr 25 2982.9 87.7 1.8 1995 May 06 2993.9 85.5 1.7 1995 May 20 3007.8 88.7 1.8 1995 Jun 10 3028.8 87.7 1.8 1995 Jun 18 3036.8 88.3 1.8 1995 Jul 09 3057.7 92.4 1.8 1995 Jul 16 3064.7 92.6 1.9 1995 Aug 25 3105.6 94.1 1.9 1995 Aug 26 3106.6 93.8 1.9 1995 Sep 02 3113.6 94.7 1.9 1995 Sep 08 3119.5 94.8 1.9 1995 Sep 23 3134.5 96.6 1.9 1995 Oct 27 3168.4 96.4 1.9 1995 Nov 10 3182.4 97.8 2.0 1995 Nov 24 3196.3 97.6 2.0 1995 Dec 05 3207.3 97.8 2.0 1995 Dec 15 3217.3 99.8 2.0 1996 Jan 01 3234.2 100.6 2.0 1996 Jan 26 3259.2 103.1 2.1 1996 Feb 24 3288.1 104.2 2.1 1996 Mar 16 3309.0 103.6 2.1 1996 Mar 30 3323.0 108.3 2.2 1996 Apr 13 3336.9 107.2 2.1 1996 Apr 25 3348.9 105.5 2.1 1996 May 04 3357.9 107.1 2.1 1996 Jun 07 3391.8 112.4 2.2 1996 Jun 08 3392.8 111.8 2.2
Date Day No. (UT) Number (mJy) (mJy) 1996 Jul 06 3420.7 111.7 2.2 1996 Jul 19 3434.7 115.2 2.3 1996 Aug 09 3455.6 115.5 2.3 1996 Aug 17 3463.6 114.6 2.3 1996 Aug 23 3469.6 114.1 2.3 1996 Sep 27 3504.5 120.0 2.4 1996 Oct 14 3521.4 117.1 2.3 1996 Oct 26 3533.4 120.4 2.4 1996 Nov 09 3547.4 122.1 2.4 1996 Dec 08 3576.3 122.5 2.4 1996 Dec 15 3583.3 127.8 2.6 1996 Dec 19 3587.3 126.3 2.5 1997 Jan 02 3601.2 125.5 2.5 1997 Jan 13 3612.2 125.3 2.5 1997 Jan 17 3616.2 127.9 2.6 1997 Jan 29 3628.2 129.6 2.6 1997 Mar 16 3674.0 129.4 2.6 1997 Mar 28 3686.0 127.8 2.6 1997 Apr 12 3700.9 128.0 2.6 1997 May 10 3728.9 130.7 2.6 1997 May 24 3742.8 130.8 2.6 1997 May 31 3749.8 131.3 2.6 1997 Jun 29 3778.7 133.3 2.7 1997 Jul 13 3792.7 137.1 2.7 1997 Aug 01 3812.6 140.9 2.8 1997 Aug 15 3826.6 135.8 2.7 1997 Sep 05 3847.5 136.5 2.7 1997 Sep 12 3854.5 139.0 2.8 1997 Sep 26 3868.5 139.5 2.8 1997 Oct 10 3882.4 146.1 2.9 1997 Oct 25 3897.4 144.2 2.9 1997 Nov 14 3917.3 144.7 2.9 1997 Nov 28 3931.3 143.8 2.9 1997 Dec 16 3949.3 143.1 2.9 1997 Dec 24 3957.2 146.9 2.9 1998 Jan 09 3973.2 144.8 2.9 1998 Feb 28 4023.1 147.5 3.0 1998 Mar 07 4030.0 148.1 3.0 1998 Mar 21 4044.0 152.6 3.1 1998 May 02 4085.9 153.0 3.1 1998 May 10 4093.9 155.1 3.1 1998 May 23 4106.8 153.4 3.1 1998 Jun 08 4122.8 156.9 3.1
Date Day No. (UT) Number (mJy) (mJy) 1998 Jul 05 4149.7 156.5 3.1 1998 Jul 24 4169.7 158.3 3.2 1998 Aug 09 4185.6 162.3 3.2 1998 Aug 23 4199.6 162.3 3.2 1998 Oct 10 4247.4 162.2 3.2 1998 Nov 15 4283.3 169.9 3.4 1998 Dec 16 4314.3 172.1 3.4 1999 Jan 25 4354.2 172.2 3.4 1999 Feb 28 4388.1 172.9 3.5 1999 Mar 14 4402.0 174.3 3.5 1999 Apr 27 4445.9 179.1 3.6 1999 Jun 05 4484.8 181.6 3.6 1999 Jul 05 4514.7 179.9 3.6 1999 Sep 04 4576.5 190.7 3.8 1999 Nov 27 4660.3 193.8 3.9 1999 Dec 17 4680.3 192.8 3.9 2000 Jan 13 4707.2 192.0 3.8 2000 Feb 28 4753.1 196.0 3.9 2000 Mar 18 4772.0 197.3 3.9 2000 Apr 15 4799.9 199.8 4.0 2000 May 05 4819.9 202.3 4.0
Appendix C Template image subtraction
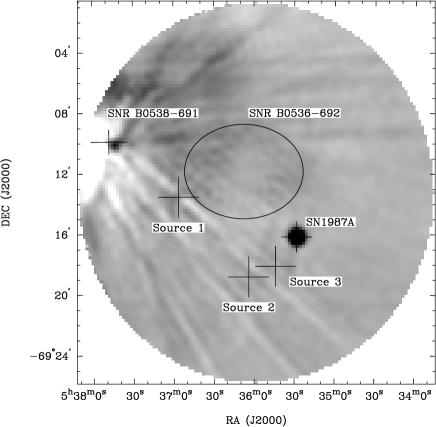
This simplified analysis uses a template image constructed from observations performed in the period between the prompt and second phases of radio emission from SN1987A. Four full 12-hour synthesis observations (on 1989 Feb 15, 1989 Apr 15, 1989 Dec 20 and 1990 Apr 08) were selected, scaled and combined to produce the template. A set of scaled versions of the template image was then constructed, stepping the scaling factor from 0.9 to 1.1 in increments of 0.02.
The object denoted in Figure 1 as ‘Source 2’ – the only point source close to SN1987A and reasonably free of background confusion – is of primary importance in the calibration. The scaling of the template was such that the flux density determined by a point source fit to Source 2 had a flux density of . The other background objects denoted ‘Source 1’ and ‘Source 3’ were also used for calibration but were given less weight; Source 1 sits on a radial artifact from 30 Doradus and Source 3 is marginally extended.
The simplified process of measuring the flux density from a given observation involves the following steps:
-
1.
A set of difference images is constructed by subtracting the scaled templates from the observed image.
-
2.
The pair of difference images in which the flux densities in the peak pixel of the chosen reference source (Source 1, 2 or 3) are closest to zero (one negative and one positive) is identified. One such difference image is presented in Figure 3. The scaling factor for which the peak flux density of the reference source would be zero is then determined by simple linear interpolation.
-
3.
Step 2 is repeated for each of the other two reference sources.
-
4.
The three estimates of the scaling factor are averaged, with the estimate based on Source 2 given double the weight of the estimates based on Sources 1 and 3.
-
5.
The nominal peak flux density of the source at the position of SN1987A is determined by fitting a Gaussian profile to the relevant region of the previously-chosen difference images.
-
6.
The nominal flux density is divided by the appropriate mean scale factor.
The scale factors determined by this process show an RMS scatter of 4.3% about unity which is consistent with the calibration uncertainty of the Molonglo telescope. We estimate the total random uncertainty in the flux density estimates obtained by template image subtraction to be %.
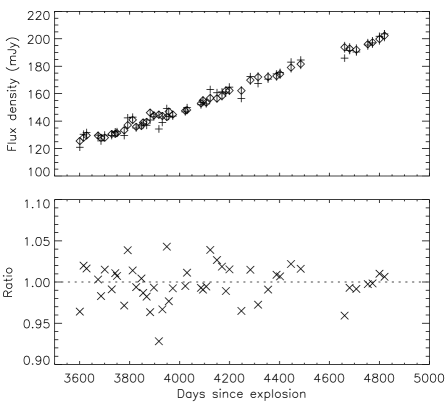
Figure 4 shows a comparison between the two alternative estimates of the flux density of SN1987A for 48 epochs between 1997 January and 2000 May. The consistency between the two methods is very good. The template image subtracted estimates have slightly larger uncertainties than the record-corrected data, as reflected in a larger scatter about the trend in Figure 4. The flux densities estimated by template image subtraction differ by at most 6% from those determined by record correction, which is consistent with the combined uncertainties in the two data sets. The ratios of the two estimates are plotted in the lower panel of Figure 4; the mean ratio and its standard error is . We conclude that there is no significant systematic difference between the two methods of analysis when applied to post 1997 January observations.
References
- [] Ball, L., Kirk, J. G. 1992, ApJ, 396, L39
- [] Ball, L., Campbell-Wilson, D., Crawford, D. F. Turtle, A. J. 1995, ApJ, 453, 864
- [] Ball, L., Campbell-Wilson, D., Staveley-Smith, L. 1995, MNRAS, 276, 944
- [] Bionta, R. M., Blewitt, G., Bratton, C. B., Caspere, D., Ciocio, A. 1987, Phys. Rev. Lett., 58, 1494
- [] Bock, D. C.-J., Large, M. I., Sadler, E. M. 1999, AJ, 117, 1578
- [] Borkowski, K., Blondin, J., & McCray, R. 1997, ApJ, 476, L31
- [] Bouchet, P., et al. 2000, IAUC 7354
- [1992b] Chevalier, R. A. 1992, Nature, 355, 691
- [1998] Chevalier, R. A. 1998, ApJ, 499, 810
- [] Chevalier, R. A., & Dwarkadas, V. 1995, ApJ, 452, L45
- [] Chevalier, R. A., Fransson, C. 1987, Nature, 328, 44
- [] Duffy, P., Ball, L., Kirk, J. G. 1995, ApJ, 447, 364
- [] Gaensler, B. M., Manchester, R. N., Staveley-Smith, L., Tzioumis, A. K., Reynolds, J. E., Kesteven, M. J. 1997, ApJ, 479, 845
- [] Garnavich, P., Kirshner, R., Challis, P. 1997, IAUC 6710
- [] Garnavich, P., Kirshner, R., Challis, P. 1999, IAUC 7102
- [] Garnavich, P., Kirshner, R., Challis, P. 2000, IAUC 7360
- [] Hanuschik, R. W., & Dachs, J. 1987, A&A, 182, L29
- [1991] Jakobsen, P., et al. 1991, ApJ, 369, L63
- [] Lawrence, S., Crotts, A. 2000, IAUC 7359
- [] Lawrence, S. S., Sugerman, B. E., Bouchet, P., Crotts, A. P. S., Uglesich, R., Heathcote, S. 2000, /astro-ph/0004191
- [] Long, K. S., Helfand, D. J., Grabelsky, D. A. 1981, ApJ, 248, 925L
- [] Maran, S., Pun, C. S. J., Sonneborn, G. 2000, IAUC 7359
- [] Mills, B. Y. 1981, Proc. Astron. Soc. Australia, 4, 156
- [] Plait, P. C., Lundqvist, P., Chevalier, R. A., Kirshner, R. P. 1995, ApJ, 439, 730
- [] Pun, C. S. J., et al. 1997, IAUC 6665
- [] Robertson, J. G. 1991, Australian J. Phys., 44, 729
- [] Sonneborn, G., et al. 1997, ApJ, 477, 848
- [] Sonneborn, G., et al. 1998, ApJ, 492, L139
- [1992] Staveley-Smith, L., et al. 1992, Nature, 355, 147
- [] Staveley-Smith, L., Briggs, D. S., Rowe, A. C. H., Manchester, R. N., Reynolds, J. E., Tzioumis, A. K., Kesteven, M. J. 1993, Nature, 366, 136
- [1987] Turtle, A. J., et al. 1987, Nature, 327, 38
- [] Weiler, K. W., Sramek, R. A. 1988, ARA&A, 26, 295