Extensive Serendipitous X-ray Coverage of a Flare Star with ROSAT
Abstract
We report the serendipitous discovery of a flare star observed with the ROSAT X-ray observatory. From optical spectra, which show strong and variable emission lines of the hydrogen Balmer series and neutral helium, we classify this object as a M3.0Ve star, and estimate a distance of 52 pc from published photometry. Due to the star’s close proximity (13.6′ ) to the calibration source and RS CVn binary AR Lacertae, long term X-ray coverage is available in the ROSAT archive (50 hours spanning 6.5 years). Two large flare events occurred early in the mission (6-7/1990), and the end of a third flare was detected in 6/1996. One flare, observed with the Position Sensitive Proportional Counter (PSPC), had a peak luminosity LX=1.1 erg s-1, an e-folding rise time of 2.2 hours and a decay time of 7 hours. This decay time is one of the longest detected on a dMe star, providing evidence for the possibility of additional heating during the decay phase. A large HRI flare (peak LX=2.9 erg s-1) is also studied. The “background” X-ray emission is also variable - evidence for low-level flaring or microflaring. We find that 59% of the HRI counts and 68% of the PSPC counts are due to flares. At least 41% of the HRI exposure time and 47% of the PSPC are affected by detectable flare enhancement.
keywords:
stars:flare – stars:late-type – X-rays:stars.1 Introduction
X-ray emission from late-type M dwarfs has been studied extensively to investigate the structure and emission mechanisms of stellar coronae. Coronal heating to X-ray emitting temperatures is attributed to either impulsive flares or quiescent energy release in magnetic structures. The corona of these stars are thought to be similar to the sun but often with luminosities orders of magnitude higher. The high magnetic activity of these flare stars is also seen in their optical spectra. Continuum enhancement and strong emission lines of the H Balmer series, Ca II and neutral He are often evident (Montes et al., 1999).
An EXOSAT study (Pallavicini et al. 1990) showed flares have a wide range of energies and timescales. Most outbursts can be described as either implusive (decay time 1 hr) or long decay flares (decay time 1 hr) and have thermal X-ray spectra with temperatures similar to solar X-ray flares. The impulsive stellar flares have timescales similar to the compact solar flares. The long duration flares have greater total energy and are more similar to two-ribbon flare events.
From ROSAT observations, coronal emission from dMe stars has been shown to have two distinct spectral components, a low temperature component attributed to quiescent active regions and a variable, high temperature component due to compact flaring regions (Giampapa et al. 1996).
Schmitt (1994) has shown conclusively the existence of long duration flares on M stars using the ROSAT all-sky survey. In some flaring stars, the long decay can be attributed to continual heating of the flaring region (Schmitt & Favata, 1999; Ottmann & Schmitt, 1996). New flare models have been developed (Reale et al., 1997) in which the additional heating determines the characteristics of the decay. Using this model, an analysis of long duration flares on AD Leo (Favata, Micela & Reale, 2000) and EV Lac (Favata et al., 2000), have shown the emitting regions to be compact with length scales less than the stellar radius and similar in size to solar flares, thereby providing evidence that long duration flares are produced in high pressure structures.
During an analysis of observations with the ROSAT High Resolution Imager (HRI) of the RS CVn binary AR Lac, we noticed an X-ray source within the field of view to be highly variable and undetected in many fields. The first X-ray detection of this source was with the Einstein observatory (hence the catalogue name, 2E 2206.6+4517; Harris et al., 1993). Coaddition of six IPC observations spanning 26.6 ksec yield a 4 detection with 115 net counts. The source is undetected in a 1.5 ksec HRI observation. No flaring activity is evident during these observations.
We analyzed thirty nine observations from the ROSAT public data archive (16 PSPC; 23 HRI) which included this source position within the field of view. The total observing time was 50 hours. The observations span two flares with almost complete light curves, the tail end of a third flare, and show variability in the low-level X-ray emission. The flare detected with the PSPC has a long decay time, possibly providing evidence for significant continual heating during the flare decay. Thus, a further in-depth study of flares and quiescent emission from 2E 2206.6+4517 could provide a useful test of current models.
2 Observations and Data Reduction
We detect the X-ray source 2E 2206.6+4517 in 16 observations with the ROSAT Position Sensitive Proportional Counter (PSPC) and 23 observations with the HRI, within the instrument bandpass of 0.1 - 2.4 keV. Extensive and continuous X-ray observations (17 hrs) were made with the PSPC between 18-22 June 1990 (during the ROSAT in-orbit calibration period), 30-31 December 1991 , and 29 May 1993 and 02 June. The HRI calibration observations of AR Lac began thirteen days after the completion of the PSPC observations. Fourteen HRI pointings between 2-8 July 1990, include the source 2E 2206.6+4517. Eight additional HRI observations are available in the archive over the period of June 1992 through November 1996 for a total observing time of 33 hours.
We measured count rates using the IRAF/PROS data analysis software and corrected for vignetting due to the large range of off-axis angles (2′ 47′ ). The observations were subdivided into multiple time bins to achieve a higher temporal resolution while preserving a minimal 2 detection for each bin. An annular region was centered on the source to correct for the background count rate for most cases. For detections near the edge of the field, a nearby circular background region was chosen. A log of the ROSAT observations is given in Table 1 which includes the exposure time and off-axis angle.
Spectral fitting of the PSPC data was done with the XSPEC software package. Source and background counts were extracted using the XSELECT task from the FTOOLS package, and the ancillary response files were constructed with PCARF to account for off-axis vignetting. We ignored the lowest 11 spectral energy bins to avoid scattered solar EUV contamination. The highest 56 spectral channels were also omitted due to poor statistics, a result of a marked decrease in the effective area of the instrument at these energies. The energy bin distribution oversamples the intrinsic spectral resolution of the PSPC, so we grouped the bins by a factor of 5 to improve the statistics.
Multiple optical spectra were taken by Perry Berlind with the Tillinghast 60” telescope and FAST spectrograph (Fabricant et al., 1998) at the Fred Lawrence Whipple Observatory on Mount Hopkins. A slit width of 3′′ , a 300 lines/mm grating, and the Loral CCD with 15m pixels provided a resolution of . A 3.5 minute exposure was taken on UT 16 May 1998 and two ten minute exposures were acquired on UT 30 May 1998 and UT 24 June 1998. An observation of Feige 34 was used for extinction correction and flux calibration. Standard bias subtraction, flat-fielding, the extraction of one-dimensional spectra, and wavelength calibration were performed in IRAF.
| Seq. Name | Obs. Date | MJD | Exp. time | Off-axis |
|---|---|---|---|---|
| (s) | angle(′ ) | |||
| rp100588 | 18/06/90-29/06/90 | 48060.13 | 27843.3 | 16.5 |
| rp110586 | 19/06/90 | 48061.25 | 1945.2 | 29.3 |
| rp110591 | 19/06/90 | 48061.53 | 1919.7 | 4.4 |
| rp110599 | 19/06/90 | 48061.85 | 1986.5 | 19.2 |
| rp110589 | 19/06/90-20/06/90 | 48061.85 | 1826.9 | 37.2 |
| rp110592 | 20/06/90 | 48062.19 | 13932.7 | 28.3 |
| rp110601 | 19/06/90-22/06/90 | 48061.98 | 3330.2 | 47.1 |
| rp110590 | 20/06/90 | 48062.48 | 1885.0 | 10.5 |
| rp110602 | 20/06/90 | 48062.79 | 2340.6 | 20.8 |
| rp110595 | 20/06/90-21/06/90 | 48062.92 | 2132.7 | 27.4 |
| rp110598 | 21/06/90- 22/06/90 | 48063.85 | 2542.1 | 9.0 |
| rp110596 | 20/06/90 | 48062.12 | 1838.5 | 39.3 |
| rp110597 | 20/06/90 | 48062.05 | 2255.3 | 34.7 |
| rp110600 | 19/06/90 | 48061.91 | 2011.2 | 45.5 |
| rp1600991 | 30/12/91-31/12/91 | 48620.26 | 13062.9 | 16.3 |
| rp4002781 | 29/05/93-02/06/93 | 49136.37 | 4702.8 | 16.3 |
| rh100247 | 02/07/90 | 48074.14 | 20667.5 | 13.6 |
| rh110249 | 02/07/90 | 48074.28 | 1419.7 | 17.7 |
| rh110251 | 02/07/90 | 48074.48 | 1972.8 | 10.1 |
| rh110252 | 02/07/90 | 48074.59 | 1687.1 | 13.5 |
| rh110253 | 02/07/90 | 48074.66 | 2208.0 | 15.2 |
| rh110254 | 02/07/90 | 48074.73 | 1933.6 | 8.7 |
| rh110255 | 02/07/90 | 48074.80 | 1987.0 | 14.2 |
| rh110259 | 03/07/90 | 48075.07 | 1700.6 | 16.2 |
| rh110260 | 03/07/90 | 48075.14 | 1664.4 | 8.8 |
| rh110261 | 03/07/90 | 48075.66 | 2264.7 | 4.0 |
| rh110262 | 03/07/90 | 48075.86 | 2501.1 | 9.2 |
| rh110267 | 04/07/90-05/07/90 | 48076.88 | 2124.4 | 17.8 |
| rh110268 | 04/07/90 | 48076.94 | 1660.4 | 10.0 |
| rh110269 | 05/07/90 | 48077.01 | 1619.7 | 1.6 |
| rh110270 | 05/07/90 | 48077.07 | 1718.8 | 10.8 |
| rh141876 | 10/06/92 | 48783.53 | 2437.5 | 13.6 |
| rh202061 | 10/12/95 | 50061.04 | 5515.6 | 13.5 |
| rh202062 | 11/12/95 | 50062.90 | 1919.7 | 13.5 |
| rh202063 | 12/01/96-13/01/96 | 50094.89 | 19142.9 | 11.7 |
| rh202159 | 03/06/96-04/06/96 | 50237.73 | 13664.0 | 13.5 |
| rh202160 | 06/06/96 | 50240.05 | 4488.0 | 13.5 |
| rh202161 | 09/07/96 | 50273.20 | 21157.0 | 13.6 |
| rh180166 | 25/11/96-27/11/96 | 50413.38 | 3218.4 | 13.4 |
Notes: rp=PSPCC; rp1=PSPCB; rh=HRI
3 Source Identification and Optical Spectra
After obtaining an X-ray source position from a nearly on-axis HRI observation, we identified two candidate optical counterparts within 10′′ on the Digitized Sky Survey red plates.
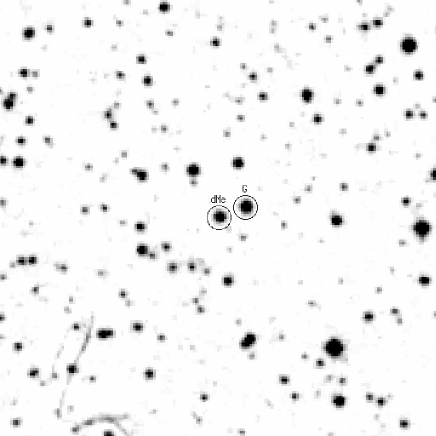
Two short observations were adequate to classify candidate 1 as an active Me star based on its Balmer emission, and candidate 2 as a normal G dwarf, with no evidence for a composite spectrum. We thus identify the Me star as the optical counterpart to 2E 2206.6+4517. Coordinates from the USNO-A2.0 catalog (Monet et al., 1998) are 22:08:37.5, 45:31:27.9 (J2000), and a 5′ finder chart is provided in Figure 1.
To facilitate an accurate spectral classification, the emission-line star was observed again on UT 30 May 1998 and UT 24 June 1998 for 10 min each. Both spectra showed strong emission lines, typical of a dMe flare star.
The first long spectrum (Figure 2) showed strong emission lines, typical of a dMe flare star in an active flaring state. The second observation (Figure 3) showed a marked decrease in the strength of the emission lines, indicating that the flare star was either in or close to quiescence. Table 2 lists the measured emission line equivalent widths. The strength of chromospheric heating due to the flare is evident by the increase in the hydrogen line emission by a factor of 1.6 (H )- 4.1 (H ).


| Date | 30 May 1998 | 24 June 1998 |
|---|---|---|
| ID | eqw | eqw |
| (Å) | (Å) | |
| H11a 3771 | 6.7 | — |
| H10a 3798 | 13.6 | — |
| H9 3835 | 23.0 | 7.6 |
| H8+He I 3889 | 26.6 | 9.2 |
| Ca II(K) 3934 | 24.1 | 22.7 |
| H+Ca II(H) 3970 | 48.6 | 19.6 |
| H 4102 | 33.8 | 9.4 |
| H 4340 | 43.4 | 10.6 |
| He I 4471 | 2.3 | — |
| H 4861 | 26.2 | 8.4 |
| He Ia 5876 | 1.4 | — |
| H 6563 | 13.0 | 8.0 |
Note: a continuum difficult to define
The optical magnitudes from the USNO catalogue are B=16.5 and R=14.2 for this source, colors consistent with a late-type star. However, these colors may be affected by the star’s strong emission lines. To derive an accurate spectral classification, we first removed the emission lines from the spectra by interpolating to the adjacent ‘continuum’. We then cross-correlated the resulting spectrum (using the IRAF fxcorr task) with a sample of digital spectra of M dwarfs from the Gliese catalog (Henry, Kirkpatrick, & Simons, 1994). By far the best correlation, and a very close match was with the M3.0V star Gliese 251 (cross-correlation peak height 0.99).
For an M3.0V star, we find from equation 1 of Henry et al. (1994; note that this error is the empirical rms value, more representative of the actual error than ). Bessell (1991) tabulates and for an M3.0V star. From this we derive for comparison to the USNO red magnitude, to obtain a distance of 52 pc.
4 ROSAT X-ray Observations
4.1 Flare Activity-Light curve
The PSPC light curve (Figure 4) shows prominent X-ray flare activity on 19 June 1990. Using the parameters for the best fit spectral model (section 4.3), the peak flare luminosity is LX=1.1 erg s-1, a 24 fold increase over the mean quiescent luminosity LX=4.6 erg s-1 (Section 4.2). The outburst can be characterized by an e-folding rise time r2.2 hours and decay time d7 hours. The total rise and decay time for the flare is trise6 hours and 30 hours as measured from the quiescent to peak count rate. The tail end of the flare significantly departs from the exponential decay of the flare (Figure 4).
This flare is evidently a long duration event. Most long decay flares on dMe stars have hour (Pallavicini et al., 1990). Recently, long duration flares have been detected on EV Lac (d=10.5 hours; Schmitt 1994) and AD Leo (d=2.2 hours; Favata, Micela & Reale, 2000). Continual heating of the flaring region during the decay has been proposed to explain such long decaying events. Due to the long decay time, the total energy ETOT=3.5 erg (Table 3) released is similar to the flare seen on EV Lac (ETOT=9 erg; Schmitt 1994) and large as compared to other dMe flare stars ( - ; Pallavicini et al., 1990). These long decay flares on dMe stars are, however, 2 - 3 orders of magnitude less energetic than giant X-ray flares on RS CVn stars such as Algol (d=8.4 hours; ETOT=7 erg; Ottmann & Schmitt, 1996), and CF Tucanae (d=22 hours; ETOT=1.4 erg; Krster & Schmitt, 1996).
On 04 July 1990 at 21:11:35 UT, a flare with a peak luminosity, about the same magnitude as the PSPC outburst (Figure 5), was detected with the HRI. Since the HRI has extremely limited spectral resolution, we input the model fit to the PSPC flare and the HRI count rate into the IRAF/PROS task hxflux to convert counts to luminosity. The peak flare luminosity was LX=2.9 erg s-1 a factor of 54 larger than the mean quiescent luminosity LX=5.4 erg s-1. The outburst can be characterized by an e-folding rise time r15 minutes and decay time d1.2 hours. The total rise and decay time for the flare is trise40 minutes and 4.6 hours. The total energy released during the flare is ETOT=1.6 erg (Table 3).
We also discovered the tail end of an additional flare observed on 03 June 1996 with a two-fold rise above the background level. Due to our incomplete light curve, we can only provide an approximation to the decay time ( 9 hours). The X-ray characteristics of these flares are listed in Table 3.


4.2 Count Rate Distribution Analysis: Quiescent Level and Flaring Fraction
The “quiescent” X-ray emission outside the large flares is clearly itself variable. Fig. 4 shows a factor of 3 change in the level outside of flares, and three long HRI observations between 12/95 and 7/96 show average of LX = 15.4, 6.6, and erg s-1.
To investigate this further, we performed a statistical analysis of the complete X-ray light curve to determine the minimum fraction of counts due to flares, and the minimum fraction of time spent in a flaring state. We assumed a truly non-variable, quiescent background rate exists that can be described by a Poisson distribution. We then determined the fraction of counts due to flares by integrating the counts left unexplained by a least squares fit of a Poisson function to the low end of the count rate distribution (Saar & Bookbinder 1998). We averaged the results of fits using several reasonable count rate binning sizes. This analysis yields the minimum fraction of flare counts, since flares below the instrument sensitivity, and possible quiescent level changes due to rotation and evolution of magnetic regions are all included in the derived quiescent level. We find that (at least) 68 2% of the PSPC counts and 59 2% of the HRI counts are due to flares. Upper limits to the quiescent flux level and the fraction of time that the star is quiescent are also derived from the analysis. We find that the (Poisson) mean quiescent count level is 0.022 0.001 counts s-1 for the PSPC ( erg s-1) and 0.0056 0.0006 counts s-1 for the HRI ( erg s-1). The minimum fraction of time with a detectable flare contribution to the observed flux is 47 5% (PSPC) and 41 8% (HRI).
All of the PSPC data was taken between 1990 and 1993, while the HRI data include a significant fraction from 1995 and 1996, with an exposure time weighted time difference of 1200 d. Thus it is possible that the small (15%) difference in the PSPC and HRI quiescent fluxes may be explained by time evolution of the quiet emission, due to e.g., long-term evolution in the numbers of active regions. Unfortunately, there are relatively few quiescent counts in the 1995-96 HRI data, making a direct test of time variation inconclusive. Further data over a longer timescale would help decide the level of the star’s quiescent coronal variablility.
We find that the quiescent and bolometric luminosity agree with the linear correlation between these quantities, as noted by previous studies of flare stars (Pallavicini et al., 1990; Agrawal et al., 1986). We estimate a bolometric luminosity of 6.74 erg s-1, using and the bolometric correction of Pettersen (1983).
4.3 Spectral Analysis
We extracted spectra from the brightest quiescent and flare PSPC images. During the longest pointing of this field, the source 2E 2206.6+4517 was in quiescence (rp100588) and 16.5′ off-axis. The data set corresponding to a flare event with the highest number of source counts was rp110591, for which the source was nearly on-axis (4.4′ ).
For the quiescent X-ray emission, we found that no single-component thermal plasma (Raymond and Smith 1978) model could adequately fit the data. Unfortunately, the signal to noise of our spectrum was not sufficient to uniquely constrain a two-component model. However, we found that models that did not contain a Raymond-Smith component of keV could be rejected (i.e. ). These models significantly underpredict emission from approximately 0.85-1.0 keV, corresponding to the Fe L-shell blend. However, with an appropriate ”high” temperature thermal plasma model, the remaining low temperature emission has statistics much less than one, indicating that the models are not well constrained. Despite the poorly constrained two component model, the spectral fit suggests the existence of a coronal plasma of keV. A comparison of the normalizations of the two models shows that the “hot” and “cool” components contribute nearly equal flux in the PSPC band (Table 4).
Because of the fewer counts in the flare observation, a larger binning factor was necessary to provide a significant S/N for spectral fitting. However, we could not fit the resulting spectrum with any one or two component model. The heavy binning broadens the effect of uncertain calibration features, particularly the PSPC window carbon edge at 0.4 keV. To compare the quiescent and flare spectra, we must mitigate this effect. The peaks and troughs in the spectra most affected by binning all occur below about 1 keV. Using only the photons above 1 keV has the added advantage that the ”hot” component dominates in this regime, so we may use a single temperature model. We fit both spectra in the energy range 1.0-1.8 keV with single temperature Raymond-Smith model, using the value of from the full quiescent spectrum.
A direct comparison of the flare and quiescent normalization shows an increase by nearly a factor of 20 in emission measure. In addition, though the temperatures are not very well constrained, their errors just barely overlap, indicating that the increase in X-ray emission was likely accompanied by an increase in the plasma temperature. This is consistent with behavior seen during flares in late-type active stars ( e.g., Giampapa et al., 1996, Singh et al., 1999).
The small number of counts does not allow a determination of a temperature variation during the flare decay. To investigate the spectral evolution of the flare, we calculated hardness ratios (Figure 4). The count distribution appears to harden by about during the onset of the flare. A decrease of the hardness ratio during the decay is evident without certainty due to limited count statistics.
Singh et al. (1999) found that Fe abundances for active dwarf stars with log are strongly subsolar, whereas the Fe abundances in the less active stars are within a factor of 2 of the solar value. Since the quiescent luminosity ratio for 2E 2206.6+4517 hovers near this value, low abundances may also affect our X-ray spectral fits. On the other hand, flare activity has been observed to increase the apparent elemental abundances (Ottman & Schmitt 1996).
| Instrument | Date | Peak(UT) | trise | r | d | Lx(peak) | ETOT | |
| PSPC | 19 June 1990 | 12:45:22 | 6 hrs | 2.2 hrs | 30 hrs | 7 hrs | 1.1 erg s-1 | erg |
| HRI | 4 July 1990 | 21:11:35 | 40 min | 15 min | 4.6 hrs | 1.2 hrs | 2.9 erg s-1 | erg |
| HRI | 3 June 1996 | — | — | — | 9 hrs | — | — | — |
| Model | NH | kT(1) | Norm(1) | kT(2) | Norm(2) | ||
| (cm-2) | (keV) | (keV) | |||||
| Quiescence | RS + RS | 5.0 | 0.16a | 4.8 | 0.97a | 6.8 | 0.66 |
| Quiescence | RS | 5.0 | 0.99 | 6.8 | — | — | 0.33 |
| Flare | RS | 5.0 | 1.32 | 1.3 | — | — | 0.66 |
Note: (a) The one sigma error is not bounded.
5 Conclusion
In this paper, we have identified a new flare star 2E 2206.6+4517 using extensive ROSAT X-ray observations and optical spectra. The object has been classifed as a M3.0Ve star. Three large X-ray flare events are seen with light curves characteristic of outbursts detected in other flare stars. Two flares with almost complete X-ray coverage show a variation in strength and timescales. A flare detected with the PSPC had a peak luminosity LX=1.1 erg s-1, an e-folding rise time of 2.2 hours and a decay time of 7 hours. We interpret this long decay time (one of the longest ever observed) as possible evidence for continual heating as similar to recent observations and analysis of AD Leo and EV Lac (Favata et al., 2000; Schmitt, 1994). An observation with the HRI detected a flare with a higher peak luminosity of LX=2.9 erg s-1, an e-folding rise time of 15 minutes, and a decay time of 1.2 hours.
We used a statistical analysis of the X-ray light curves to measure the quiescent X-ray level, the (minimum) fraction of counts in flares and (minimum) fraction of time that the star exhibits flare or microflare activity. The PSPC data showed a quiescent luminosity of erg s-1, with 682% of counts coming from flares, and significant flare contribution to at least 475% of the time observed. The HRI data, taken on average almost three years later, show a quiescent luminosity of erg s-1, with 592% of counts coming from flares, and significant flare contribution to at least 418% of the time observed.
We obtained two optical spectra that show strong and variable emission lines of the hydrogen Balmer series and neutral helium which is further evidence for flare activity.
With the large amount of X-ray coverage of the source 2E 2206.6+4517 in the ROSAT data archive, this object provides an excellent opportunity to facilitate in the understanding of the physical properties of these flare stars including the flare, quiescent and long term activity. Further measurements of this object may be afforded by calibration observations of AR Lac by Chandra or XMM-Newton.
Acknowledgements
We would like to thank the reviewer, J. Schmitt, and J. Drake for their
useful comments on this manuscript, and Rick Harnden and Andrea
Prestwich for their advice and useful discussions. Many thanks to
Perry Berlind for obtaining the optical spectra, and to Susan Tokarz
for their preliminary reduction.
This research has made use of data obtained through the High Energy
Astrophysics Science Archive Research Center Online Service, provided
by the NASA/Goddard Space Flight Center.”
References
- [1] Agrawal, P.C., Rao, A.R., Sreekantan, B.V. 1986, MNRAS, 219, 225
- [2] Bessell, M.S. 1991, AJ, 101, 662
- [3] Fabricant, D., Cheimets, P., Caldwell N., Geary J. 1998, PASP, 110, 79F
- [4] Favata, F, Reale, F., Micela, G., Sciortino, S., Maggio, A., Matsumoto, H. 2000, A&A, 353, 987
- [5] Favata, F., Micela, G., Reale, F. 2000, A&A, 354 1021
- [6] Giampapa, M.S., Rosner, R., Kashyap, V., Fleming, T.A., Schmitt, J.H.M.M., Bookbinder, J.A. 1996, ApJ, 463, 707
- [7] Harris, D. E., Forman, W., Gioia, I. M., Hale, J. A., Harnden, F. R., Jr., Jones, C., Karakashian, T., Maccacaro, T., McSweeney, J. D., Primini, F. A. 1993, EOSC, 7, H
- [8] Henry, T. J., Kirkpatrick, J. D., & Simons, D. A. 1994 AJ, 108, 1437
- [9] Krster, M., Schmitt, J.H.M.M. 1996, A&A, 311, 211
- [10] Monet, D. G. et al. 1998, BAAS, 193, 12003
- [11] Montes, D., Saar, S.H., Collier Cameron, A., Unruh, Y.C. 1999 MNRAS, 305, 45
- [12] Ottmann, R., Schmitt, J.H.M.M. 1996, A&A, 307, 813
- [13] Pallavicini R., Tagliaferri G., Stella L. 1990, A&A, 228, 403
- [14] Pettersen, B.R. 1983, in Activity in Red-dwarf Stars, eds. P.B. Byre, M. Rodono, Reidel, Dordrecht, p.17
- [15] Raymond, J.C., Smith, B.W. 1977, ApJS, 35, 419
- [16] Reale, F., Micela, G. 1998, A&A, 334, 1028
- [17] Saar, S.H., Bookbinder, J.A. 1998, in The Tenth Cambridge Workshop on Cool Stars, Stellar Systems, and the Sun, eds. R.A. Donahue, J.A. Bookbinder (ASP CD ROM), 1560
- [18] Singh K.P., Drake, S.A., Gotthelf, E.V., White, N.E. 1999, ApJ, 512, 874
- [19] Schmitt, J.H.M.M., 1994, ApJ, 90, 735
- [20] Schmitt, J.H.M.M., Favata, F. 1999 Nature, 401, 44