UniTabNet: Bridging Vision and Language Models for Enhanced
Table Structure Recognition
Abstract
In the digital era, table structure recognition technology is a critical tool for processing and analyzing large volumes of tabular data. Previous methods primarily focus on visual aspects of table structure recovery but often fail to effectively comprehend the textual semantics within tables, particularly for descriptive textual cells. In this paper, we introduce UniTabNet, a novel framework for table structure parsing based on the image-to-text model. UniTabNet employs a “divide-and-conquer” strategy, utilizing an image-to-text model to decouple table cells and integrating both physical and logical decoders to reconstruct the complete table structure. We further enhance our framework with the Vision Guider, which directs the model’s focus towards pertinent areas, thereby boosting prediction accuracy. Additionally, we introduce the Language Guider to refine the model’s capability to understand textual semantics in table images. Evaluated on prominent table structure datasets such as PubTabNet, PubTables1M, WTW, and iFLYTAB, UniTabNet achieves a new state-of-the-art performance, demonstrating the efficacy of our approach. The code will also be made publicly available.
UniTabNet: Bridging Vision and Language Models for Enhanced
Table Structure Recognition
Zhenrong Zhang1111Equal contribution., Shuhang Liu1111Equal contribution., Pengfei Hu1, Jiefeng Ma1, Jun Du1222Correspondence author. jundu@ustc.edu.cn, Jianshu Zhang2, Yu Hu2 1University of Science and Technology of China, 2iFLYTEK AI Research,
1 Introduction
In this era of knowledge and information, documents serve as crucial repositories for various cognitive processes, including the creation of knowledge databases, optical character recognition (OCR), and document retrieval. Among the various document elements, tabular structures are particularly notable. These structures distill complex information into a concise format, playing a pivotal role in fields such as finance, administration, research, and archival management (Zanibbi et al., 2004). Table structure recognition (TSR) focuses on converting these tabular structures into machine-readable data, facilitating their interpretation and utilization. Therefore, TSR as a precursor to contextual document understanding will be beneficial in a wide range of applications (Siddiqui et al., 2018; Schreiber et al., 2017).
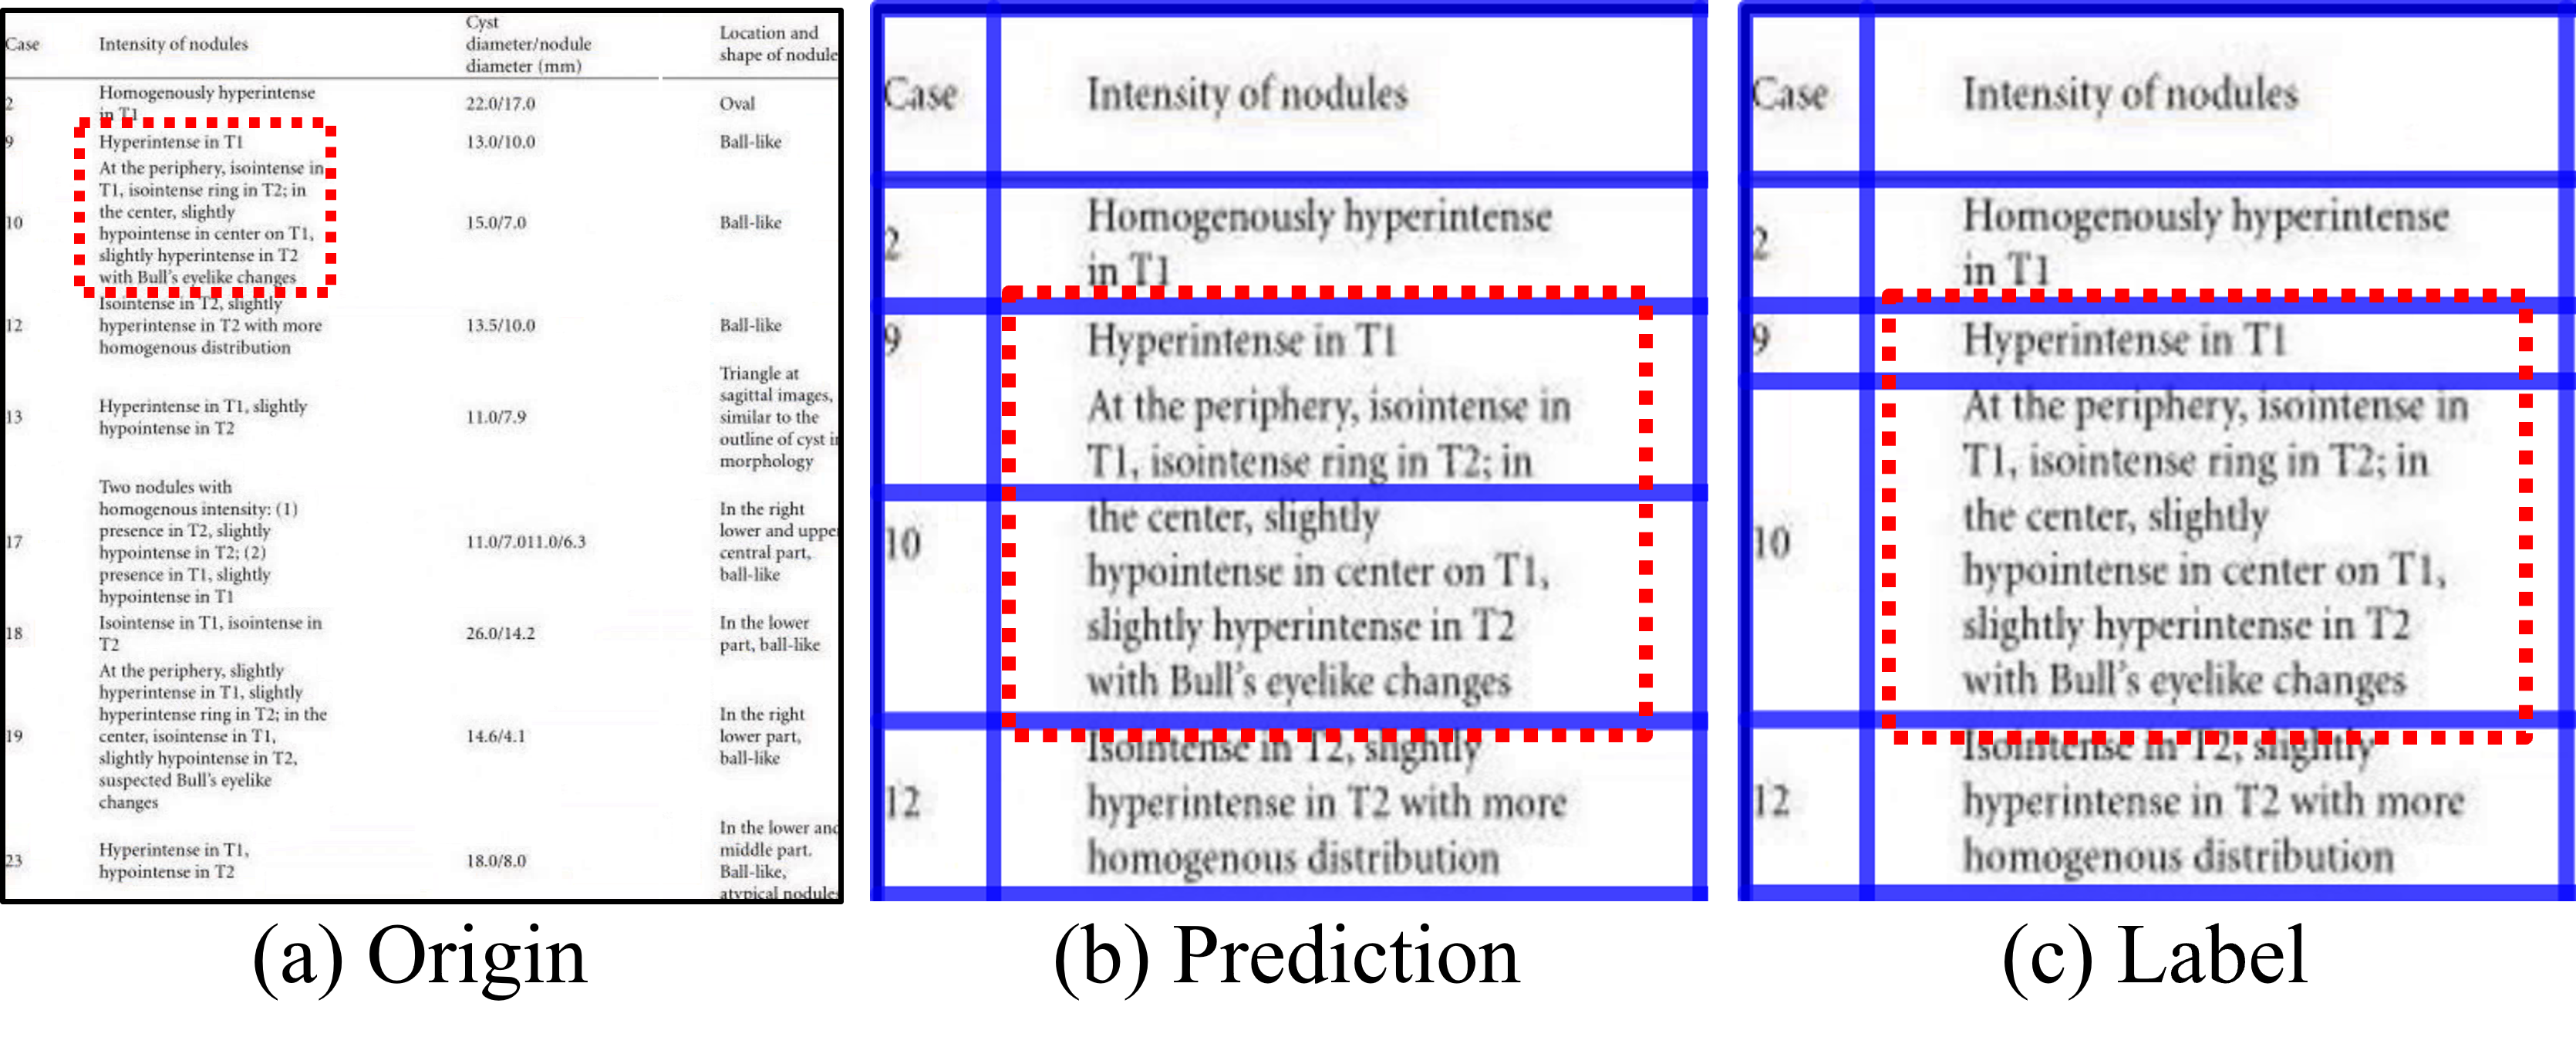
Table images efficiently convey information through visual clues, layout structures, and plain text. However, most previous methods(Chi et al., 2019; Long et al., 2021; Zhang et al., 2024) in TSR primarily utilize visual or spatial features, neglecting the textual content within each table cell. The structures of some tables exhibit inherent ambiguities when assessed solely based on visual appearance, especially for wireless tables which contain cells with descriptive content, as illustrated in Figure 1. To enhance accuracy in TSR, it is crucial to leverage the cross-modality characteristics of visually-rich table images by jointly modeling both visual and textual information (Peng et al., 2022).
Recent advancements in document understanding, exemplified by methods such as Donut (Kim et al., 2022) and Pix2Struct (Lee et al., 2023), have embraced an end-to-end image-to-text paradigm. These approaches leverage the Transformer architecture (Vaswani et al., 2017) during pre-training to decode OCR results, demonstrating superior perception of image content. By diminishing reliance on traditional OCR engines, they exhibit remarkable adaptability across diverse document understanding tasks, highlighting their robust ability to comprehend text embedded in images. Despite these advancements, the application of this framework to TSR remains unexplored. While there are related works (Nassar et al., 2022; Huang et al., 2023) that employ this framework, they primarily focus on reconstructing table structures from a visual perspective, without adequately addressing the depth of textual understanding in images.
In this work, we adopt the image-to-text framework and introduce a visually linguistic unified model for TSR, named UniTabNet. This model is built on a “divide and conquer” design philosophy, initially using the image-to-text model to decouple table cells. According to the attributes of the table structure (Zanibbi et al., 2004), the decoupled cells contain two types of attributes: logical and physical. The logical attributes cover the row and column span information of each cell, while the physical attributes include the bounding box coordinates of the cells. To parse these attributes independently, we design a logical decoder and a physical decoder. Since table images differ significantly from regular document images, each step of the decoding output is grounded in a clear visual basis, specifically visual cues from rows, columns, and cells. Therefore, we design a Vision Guider module, which directs the model to focus on relevant areas and make more precise predictions. Furthermore, to enhance the UniTabNet’s understanding of text content in images, we develop a Language Guider. This module enables the model to perceive the corresponding text content at each decoding step, thereby understanding the textual semantics within the image. Experimental results on multiple public TSR datasets, such as PubTables1M (Smock et al., 2022), PubTabNet (Zhong et al., 2020a), iFLYTAB (Zhang et al., 2024), and WTW Long et al. (2021), demonstrate that our approach achieves state-of-the-art performance, validating the effectiveness of our method. The main contributions of this paper are as follows:
-
•
We introduce UniTabNet, a unified visually linguistic model for TSR that adheres the “divide and conquer” strategy by first separating table cells, then using both logical and physical decoders to reconstruct the table structure.
-
•
We develop the Vision Guider module, designed to direct the model’s focus towards critical areas such as rows and columns, thereby enhancing the overall prediction accuracy.
-
•
We enhance UniTabNet with the Language Guider module, which enhances the model’s ability to perceive textual content within images, thereby improving its accuracy in predicting the structure of tables rich in descriptive content.
-
•
Based on our proposed method, we achieve state-of-the-art performance on publicly available datasets such as PubTabNet, PubTables1M, WTW and iFLYTAB.
2 Related Work
Due to the rapid development of deep learning in documents, many deep learning-based TSR approaches have been presented. These methods can be roughly divided into three categories: bottom-up methods, split-and-merge based methods and image-to-text based methods.
One group of bottom-up methods (Chi et al., 2019; Xue et al., 2019; Liu et al., 2022) treat words or cell contents as nodes in a graph and use graph neural networks to predict whether each sampled node pair belongs to the same cell, row, or column. These methods depend on the availability of bounding boxes for words or cell contents as additional inputs, which are challenging to obtain directly from table images. To eliminate this assumption, another group of methods (Raja et al., 2020; Qiao et al., 2021) has proposed directly detecting the bounding boxes of table cells. After cell detection, they design some rules to cluster cells into rows and columns. However, these methods regard the cells as bounding box, which is difficult to handle the cells in distorted tables. Other methods (Xing et al., 2023; Long et al., 2021) detect cells through detecting the corner points of cells, making them more suitable for handling distorted cells. Nevertheless, they suffer from tables containing a lot of empty cells and wireless tables.
Split-and-merge based methods initially split a table into basic grid pattern, followed by a merging process to reconstruct the table cells. Previous methods (Tensmeyer et al., 2019; Zhang et al., 2022) utilize semantic segmentation (Long et al., 2015) for identifying rows, columns within tables in the “split” stage. However, segmenting table row/column separation lines in a pixel-wise manner is inaccurate due to the limited receptive field, and heuristic mask-to-line modules designed with strong assumptions in split stage make these methods work only on tables in digital documents. To enhance the accuracy of grid splitting in distorted tables, RobustTabNet (Ma et al., 2023) uses a spatial CNN-based separation line predictor to propagate contextual information across the entire table image in both horizontal and vertical directions. SEMv2 (Zhang et al., 2024) formulates the table separation line detection as the instance segmentation task. The table separation line can be accurately obtained by processing the table separation line mask in a row-wise/column-wise manner. TSRFormer with SepRETR (Lin et al., 2022) formulates the table separation line prediction as a line regression problem and regresses separation line by DETR (Carion et al., 2020), but it can’t regress too long separation line well. TSRFormer with DQ-DETR (Wang et al., 2023) progressively regresses separation lines, which further enhances localization accuracy for distorted tables.
Image-to-text based methods conceptualize the structure of tables as sequential data (HTML or LaTeX), utilizing an end-to-end image-to-text paradigm to decode table structures. The EDD model Zhong et al. (2020a) employs an encoder-dual-decoder architecture to generate both the logical structure and the cell content. During the decoding phase, EDD utilizes two attention-based recurrent neural networks; one is tasked with decoding the structural code of the table, while the other decodes the content. Building on this framework, TableFormer Nassar et al. (2022) employs a transformer-based decoder to enhance the capabilities of EDD’s decoder. Additionally, it introduces a regression decoder that predicts bounding boxes rather than content, thus refining the focus on spatial elements. Addressing the challenge of limited local visual cues, VAST Huang et al. (2023) redefines bounding box prediction as a coordinate sequence generation task and incorporates a visual alignment loss to achieve more accurate bounding box outcomes.
3 Task Definition
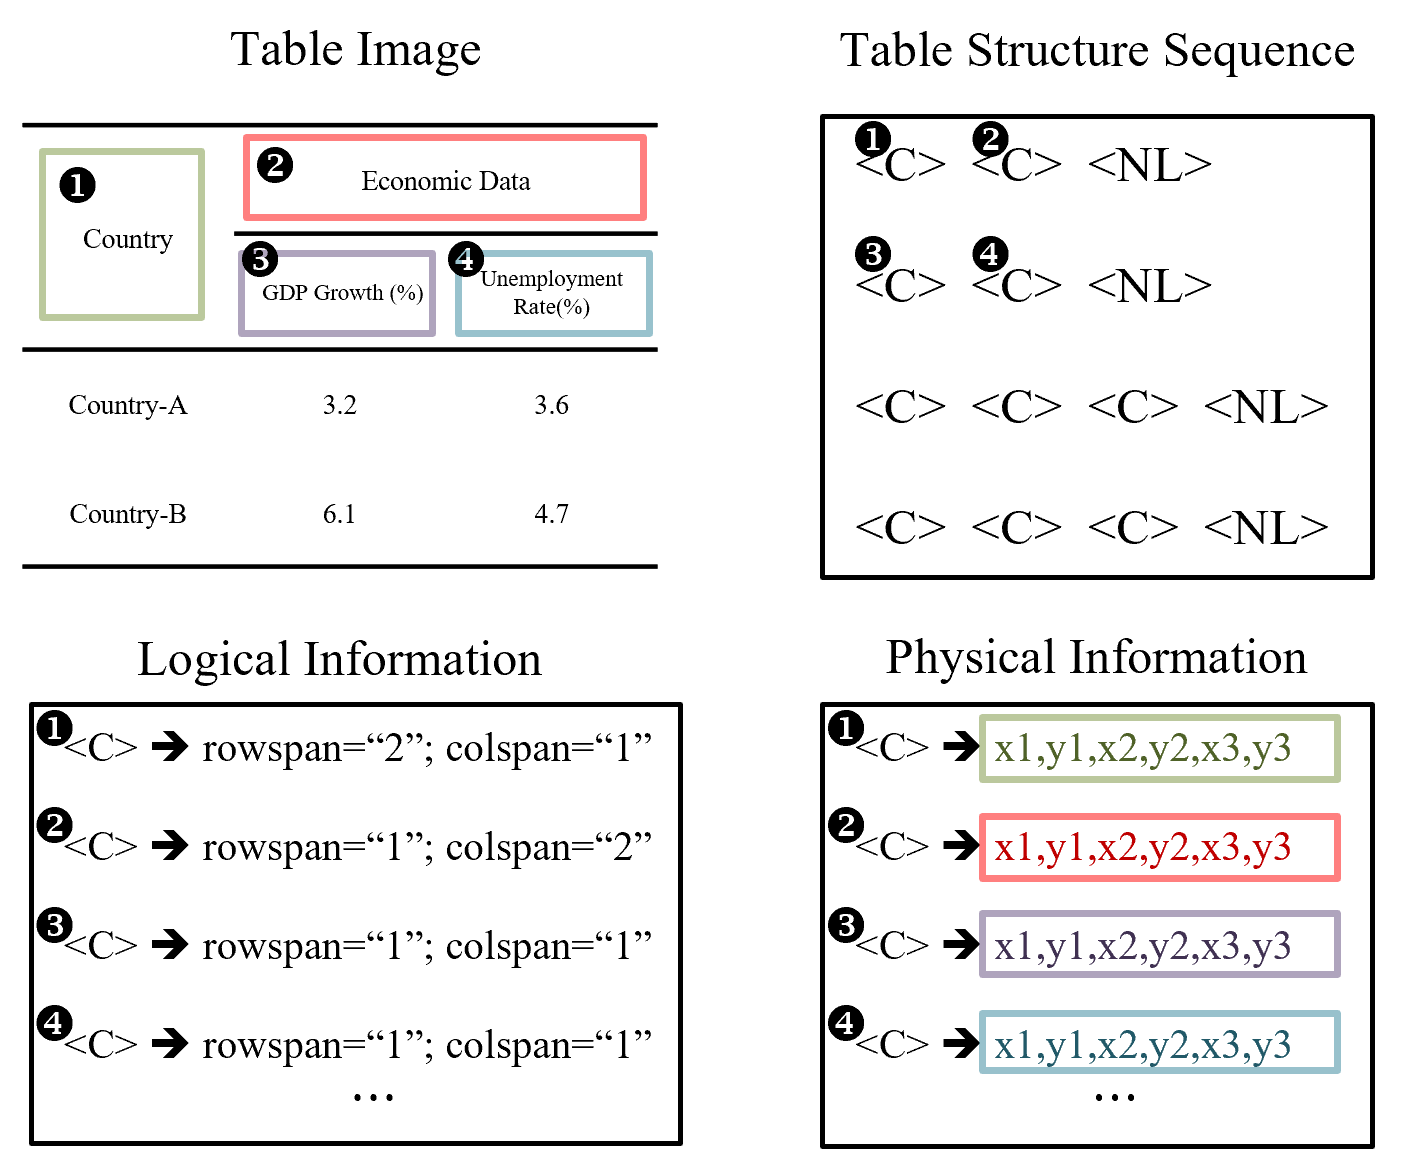
As illustrated in Figure 2, given a table image , our objective is to enable the model to predict the table structure sequence , where is the length of the sequence and is the the size of token vocabulary, to reconstruct the table’s layout. Previous methods (Zhong et al., 2020b; Nassar et al., 2022; Huang et al., 2023) have employed various formats for the output table structure sequence , such as HTML and LaTeX. In contrast, our approach simplifies the decoding process significantly by using only two types of tokens: <C> and <NL>. <C> denotes a table cell, and <NL> indicates a newline, facilitating a concise representation of the table structure. According to the attributes of the table structure (Zanibbi et al., 2004), each table cell encompasses both logical attribute and physical attribute . The logical attribute specifies the cell’s span across rows and columns, while the physical attribute defines the spatial positioning of the cell within the image. Consequently, the output of our proposed model, UniTabNet, includes the structure sequence , along with logical attributes and physical attributes , providing a comprehensive description of the table’s layout.
4 Methodology
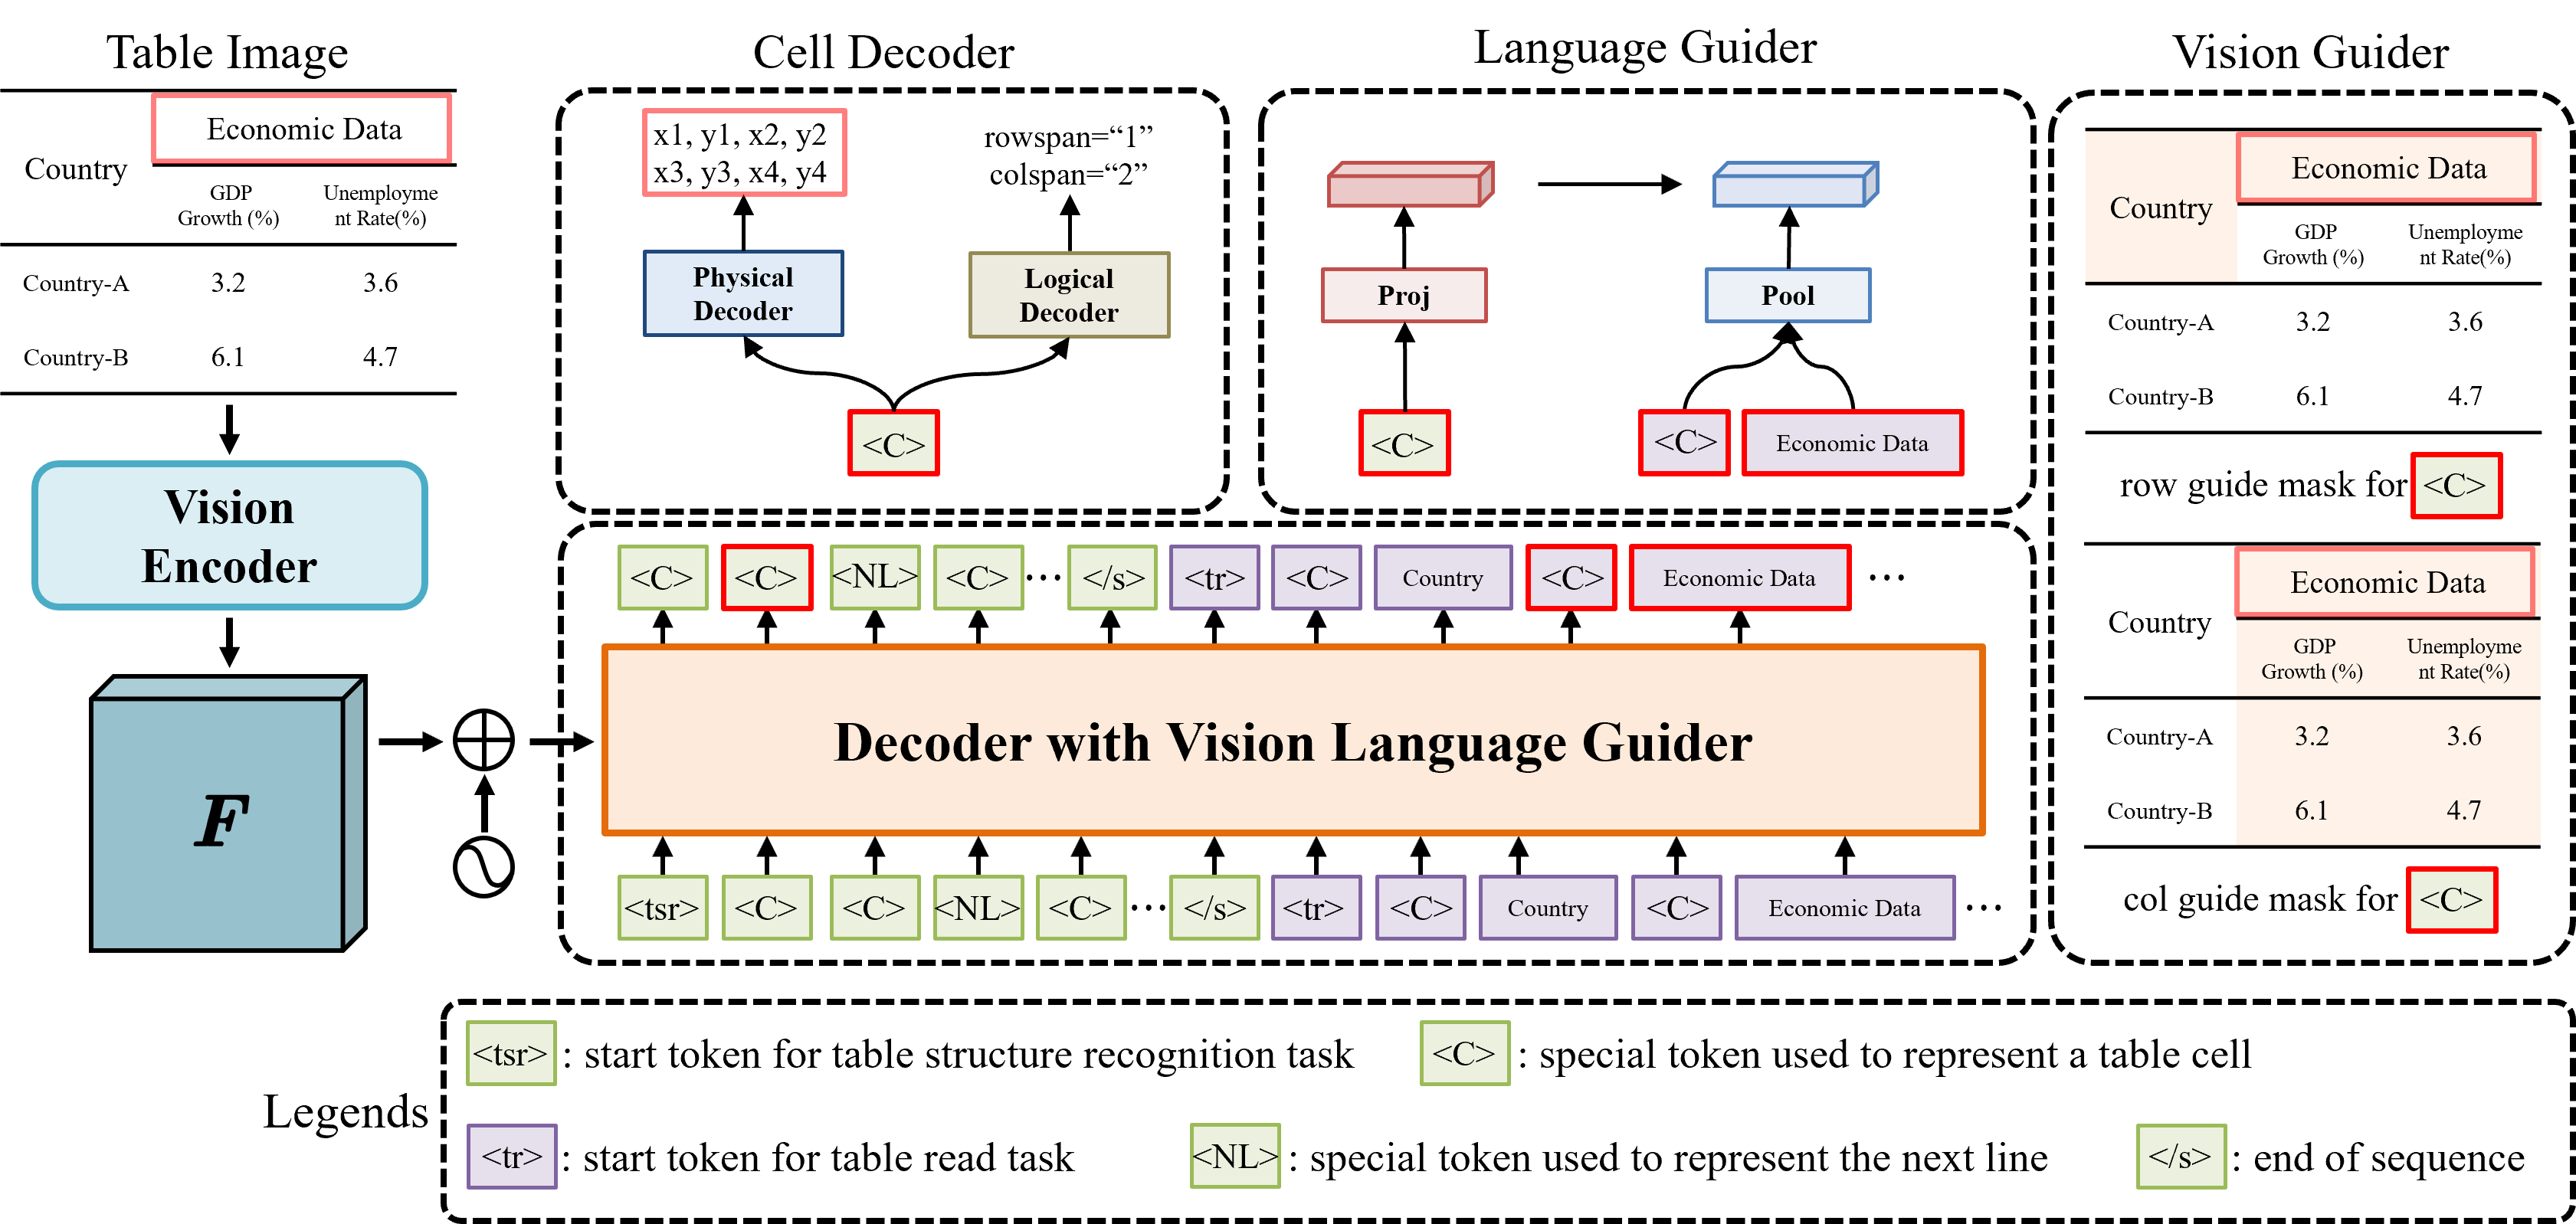
As illustrated in Figure 3, UniTabNet is built upon the Donut (Kim et al., 2022) and primarily consists of a vision encoder and a text decoder, which decodes image features to generate the table structure sequence . To further decode the logical and physical attributes contained within each cell, we additionally design a logical decoder and a physical decoder to predict the cell attributes and , respectively. Considering the nature of table images, we incorporate a Vision Guider and a Language Guider at the output of the text decoder. The Vision Guider directs the model to focus on relevant areas during cell decoding, while the Language Guider aids in understanding the corresponding textual information within the cells. Detailed descriptions of these modules will follow.
Vision Encoder. The vision encoder converts the table image into a set of embeddings , where is feature map size and is the dimension of the latent vectors of the encoder. As depicted in Figure 3, we adopt the Swin Transformer (Liu et al., 2021) as our primary vision backbone, following the Donut, to encode into feature map . Additionally, we incorporate positional encoding (Vaswani et al., 2017) into to generate the final vision embeddings .
Text Decoder. Similar to Donut, we utilize the BART (Lewis et al., 2020) decoder to generate the table structure sequence , conditioned on the . Since UniTabNet is trained to predict the next tokens like LLMs (OpenAI, 2023), it only requires maximizing the likelihood of loss at training time.
| (1) |
Physical Decoder. Given the output from the last layer of the text decoder, the physical decoder decodes these hidden states to obtain the polygon coordinates in the image. To facilitate this prediction, we introduce a set of 1,000 special tokens—<0>, <1>, …, <999>—which are utilized for quantizing the coordinates of the polygons, forming a specialized vocabulary . Specifically, for each coordinate point in the polygon , the prediction process is as follows: The corresponding hidden state is transformed via a linear mapping to produce the , which serves as a query against the vocabulary . Unlike previous method (Chen et al., 2022), which perform direct classification over the location vocabulary, we define the final position of as the expected location based on the distribution given by over :
| (2) |
| (3) |
| (4) |
The polygon regression loss is defined as follows:
| (5) |
where denotes the ground truth label.
Logical Decoder. The logical decoder predicts the rowspan and colspan information for table cells based on the output from the final hidden state of the text decoder. To illustrate, for predicting the rowspan information within , the hidden state is first mapped through a matrix transformation to a vector . The then serves as a query, computing the dot product with entries in the vocabulary , resulting in a score vector . The rowspan information is then determined by locating the index of the maximum value in the score vector .
| (6) |
| (7) |
| (8) |
Given the extreme imbalance in the distribution of rowspan and colspan across cells, we optimize our model using sigmoid focal loss (Lin et al., 2017). The span prediction loss for the logical decoder is defined as follows:
| (9) |
where represents the sigmoid focal loss function. The vectors and are one-hot representations of the ground truth span information for rowspan and colspan, respectively.
Vision Guider. Unlike conventional document images, table images exhibit significant interdependencies among cells within the same row, column, or cell block. To enhance the model’s ability to accurately capture these details during the decoding process, we develop the Vision Guider. This mechanism enables the model to focus more on the row and column information for each cell during decoding. Specifically, to capture the same row visual cues, we input the last layer’s output of the decoder into a matrix mapping to generate vector . The vector , serving as the query, is then used to fetch attention scores from the visual embedding . A similar approach is adopted for the same column information .
| (10) |
| (11) |
The loss function for the Vision Guider is defined as:
| (12) |
where denotes the sigmoid focal loss function, and and represent the row and column mask maps, respectively.
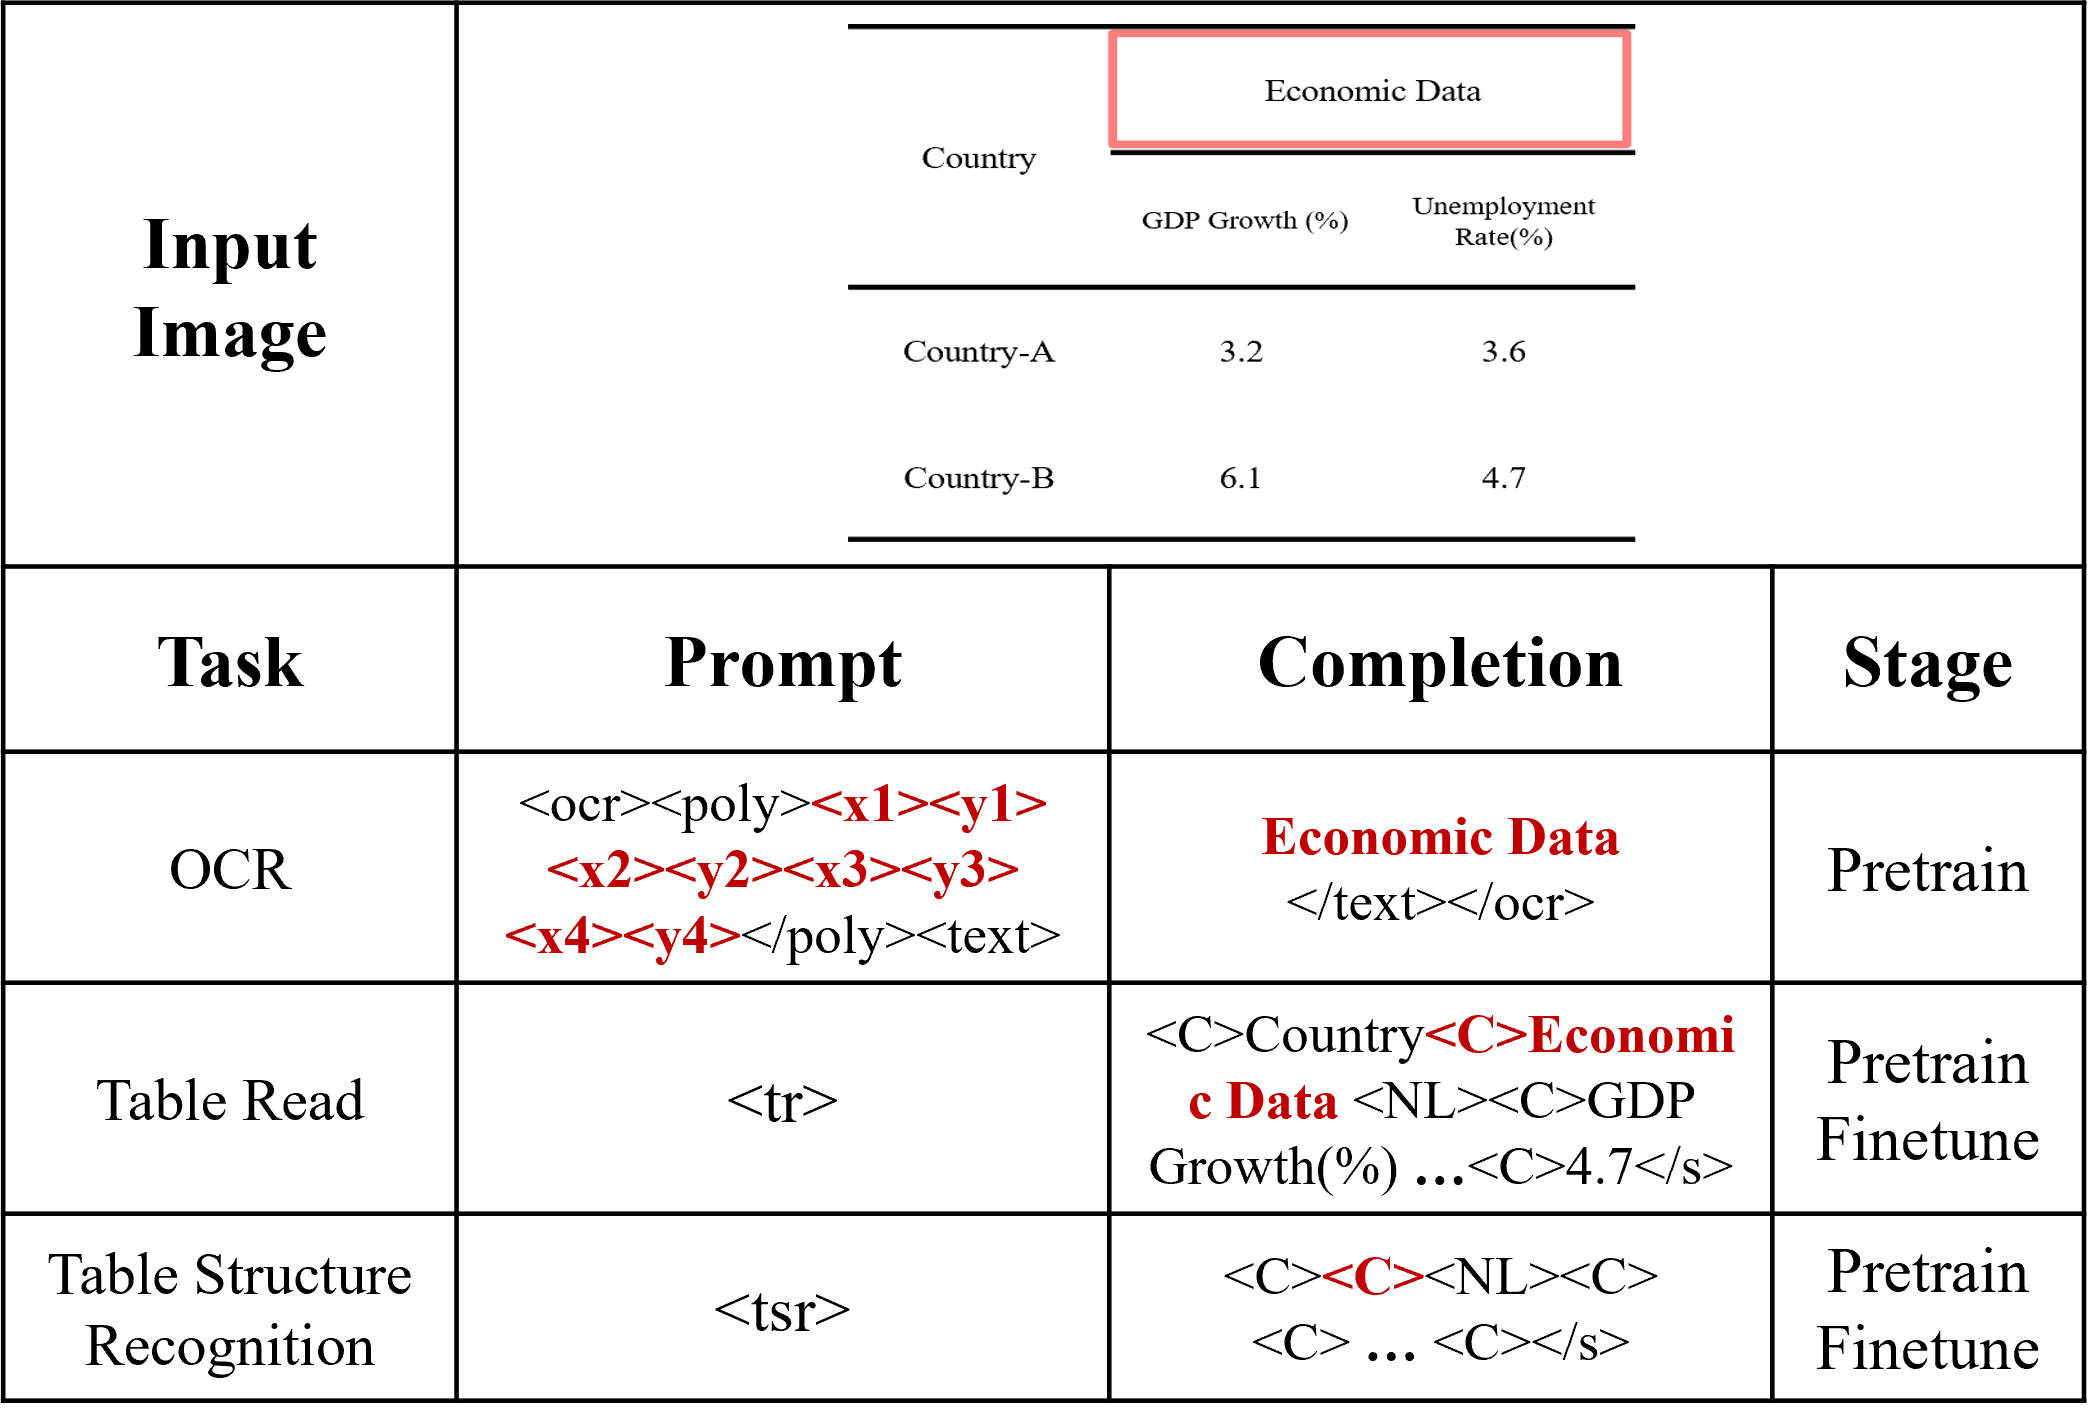
Language Guider. Tables present data relationships in an exceedingly concise format. Beyond the prevalent numerical tables, there are also descriptive table images. To accurately recognize these descriptive tables, it is imperative that the model comprehends the content within the table to make more precise structural predictions. To this end, we introduce the Language Guider, which directs the model to understand the textual semantic information in the table. As illustrated in Figure 4, during the training phase, in addition to the essential Table Structure Recognition (TSR) task, we design an additional task named Table Read (TR), which prompts the model to sequentially output the content within table images, thereby enhancing the model’s understanding of the text in the images. To ensure that the tokens in TSR possess text comprehension abilities similar to those in TR, we align the tokens from both tasks. Specifically, suppose a token <C> in TSR produces an output at the decoder’s last layer; we first map to using a matrix mapping. The corresponding token for <C> in TR, represented as at the decoder’s last layer, is then subject to mean pooling to produce . Subsequently, a mean squared-error (MSE) loss is applied between and , thus endowing TSR tokens with substantial text perception capabilities.
| (13) |
| (14) |
| (15) |
5 Implementation Details
Our methodology employs the following hyperparameters: The longest side of the image is resized to 1600 while maintaining the original aspect ratio. The downsampling factor of the visual backbone is set to 32. The dimension of the feature is set to 1024. The decoders consist of a stack of 4 identical layers, and the number of multi-heads is set to 16.
Training. To train UniTabNet, we design three training tasks as depicted in Figure 4. These tasks aim to enable the model to comprehensively perceive tabular images. Specifically, the training process is divided into two phases. Initially, during the pre-training phase, we use a synthetic dataset comprising 1.4 million Chinese and English entries from SynthDog (Kim et al., 2022), along with the training set from PubTables1M (Smock et al., 2022). After pre-training, the model is fine-tuned on specialized datasets dedicated to table structure recognition. We fine-tune UniTabNet using the Adam (Kingma and Ba, 2015) optimizer with the learning rate of .The learning rate is linearly warmed up over the first 10% steps then linearly decayed. The training is conducted on 8 Telsa A40 48GB GPUs. The model is trained for 100 epochs on the iFLYTAB (Zhang et al., 2024) and WTW (Long et al., 2021) datasets, and for 10 epochs on the PubTables1M and PubTabNet (Zhong et al., 2020b) datasets.
In the overall loss of UniTabNet, there are primarily two categories: regression losses (, ) and classification losses (, , ). Given the significant scale differences among these losses, it is necessary to adjust their coefficients. Inspired by (Kendall et al., 2018) , we optimize the model by maximising the Gaussian likelihood with homoscedastic uncertainty.
| (16) |
The is a learnable factor that adaptively adjusts the weight ratios among these losses. represents the five losses mentioned above.
Inference. During the inference phase, we feed the <tsr> token into UniTabNet and utilize a greedy search algorithm to decode the table structure sequence . Relying on the hidden states from the last layer of the decoder, we can decode the physical and logical information corresponding to each cell. This allows for the complete reconstruction of the table structure.
6 Experiments
6.1 Datasets and Evaluation Metrics
To fully demonstrate the effectiveness of the UniTabNet, we conduct experiments across four datasets. Firstly, for single-scene electronic document table images, we select two representative datasets, PubTabNet (Zhong et al., 2020b) and PubTables1M (Smock et al., 2022), for evaluation. We assess these datasets using the TEDS-Struct (Zhong et al., 2020b) and GriTS (Smock et al., 2023) metrics to ensure comprehensive and comparative results. For complex scene table images, we chose the WTW (Long et al., 2021) and iFLYTAB (Zhang et al., 2024) datasets for evaluation, employing the F1-Measure (Hurst, 2003) and TEDS-Struct metrics to quantify the model’s performance. Notably, we also extract a subset from the iFLYTAB validation set, termed iFLYTAB-DP, which comprises 322 descriptive table images. For more details on the datasets and evaluation metrics, please refer to the Appendix A.1.
| Type | Method | GriTS-Top | GriTS-Loc |
|---|---|---|---|
| Bottom-up | Faster RCNN | 86.16 | 72.11 |
| DETR | 98.45 | 97.81 | |
| Image-to-Text | VAST | 99.22 | 94.99 |
| Ours | 99.43 | 95.37 |
| Type | Method | PubTabNet | WTW | iFLYTAB | ||
|---|---|---|---|---|---|---|
| TEDS-Struct | P | R | F1 | TEDS-Struct | ||
| Bottom-up | Cycle-CenterNet (Long et al., 2021) | - | 93.3 | 91.5 | 92.4 | - |
| LORE (Xing et al., 2023) | - | 94.5 | 95.9 | 95.1 | - | |
| LGPMA (Qiao et al., 2021) | 96.70 | - | - | - | - | |
| Split-and-merge | SEM (Zhang et al., 2022) | 96.30 | - | - | - | 75.9 |
| RobustTabNet (Ma et al., 2023) | 97.00 | - | - | - | - | |
| TSRFormer (Lin et al., 2022) | 97.50 | 93.7 | 93.2 | 93.4 | - | |
| SEMv2 (Zhang et al., 2024) | 97.50 | 93.8 | 93.4 | 93.6 | 92.0 | |
| TRUST (Guo et al., 2022) | 97.10 | - | - | - | - | |
| SEMv3 (Qin et al., 2024) | 97.50 | 94.8 | 95.4 | 95.1 | 93.2 | |
| Image-to-Text | EDD (Zhong et al., 2020b) | 89.90 | - | - | - | - |
| TableFromer (Nassar et al., 2022) | 96.75 | - | - | - | - | |
| VAST (Huang et al., 2023) | 97.23 | - | - | - | - | |
| Ours | 97.50 | 95.6 | 94.7 | 95.1 | 94.0 | |
6.2 Results
In this section, we evaluate the effectiveness of UniTabNet from three different perspectives. More details are provided in the Appendix A.2.
Results from Electronic Document. As shown in Table 1, compared to Image-to-Text approaches, our method has achieved a new state-of-the-art level. Although the bottom-up method (Carion et al., 2020) performs better on the GriTS-Loc metric, this is due to their use of the bounding box of the content within the cell to adjust the predicted bounding box of the cell. As illustrated in Table 2, UniTabNet also performs comparably to the current advanced methods on the PubTabNet dataset.
Results from Complex Scenarios. As shown in Table 2, to demonstrate the robustness of UniTabNet in visual scenarios, we conduct experiments on the WTW and iFLYTAB datasets. On the WTW dataset, our method exhibits high precision but lower recall, primarily constrained by the maximum decoding length of the model. Therefore, compared to other non-autoregressive methods (Bottom-up and Split-and-merge), it achieves lower recall but comparable overall F1 scores with current methods. On the iFLYTAB dataset, UniTabNet achieves a new state-of-the-art performance.
Results from Descriptive Tables. To demonstrate the effectiveness of UniTabNet in addressing descriptive tables, as shown in Table 3, we compare UniTabNet with the previously state-of-the-art SEMv3 (Qin et al., 2024) on the iFLYTAB-DP dataset. SEMv3 is a purely visual approach for reconstructing table structures. However, iFLYTAB-DP contains a large number of tables with descriptive cells, requiring the model to understand the textual information within to make accurate structural predictions. The comparison shows that UniTabNet significantly outperforms SEMv3 in this scenario.
6.3 Ablation Study
| System | UL | VG | LG | D1 | D2 |
|---|---|---|---|---|---|
| SEMv3 | - | - | - | 93.2 | 82.6 |
| T1 | ✗ | ✗ | ✗ | 92.4 | 82.9 |
| T2 | ✓ | ✗ | ✗ | 93.2 | 83.3 |
| T3 | ✓ | ✓ | ✗ | 93.7 | 83.6 |
| T4 | ✓ | ✓ | ✓ | 94.0 | 84.9 |
As shown in Table 3, to demonstrate the effectiveness of each module within the model, we design systems T1 through T4, which were evaluated on both iFLYTAB and iFLYTAB-DP datasets.
The Effectiveness of Loss Design. During the entire training process of UniTabNet, the primary losses include regression loss and classification loss, which differ significantly in scale. Inspired by (Kendall et al., 2018), we optimize the model by maximizing the Gaussian likelihood with homoscedastic uncertainty, as described in Eq. 16. Comparing systems T1 and T2 demonstrates the effectiveness of this loss design.
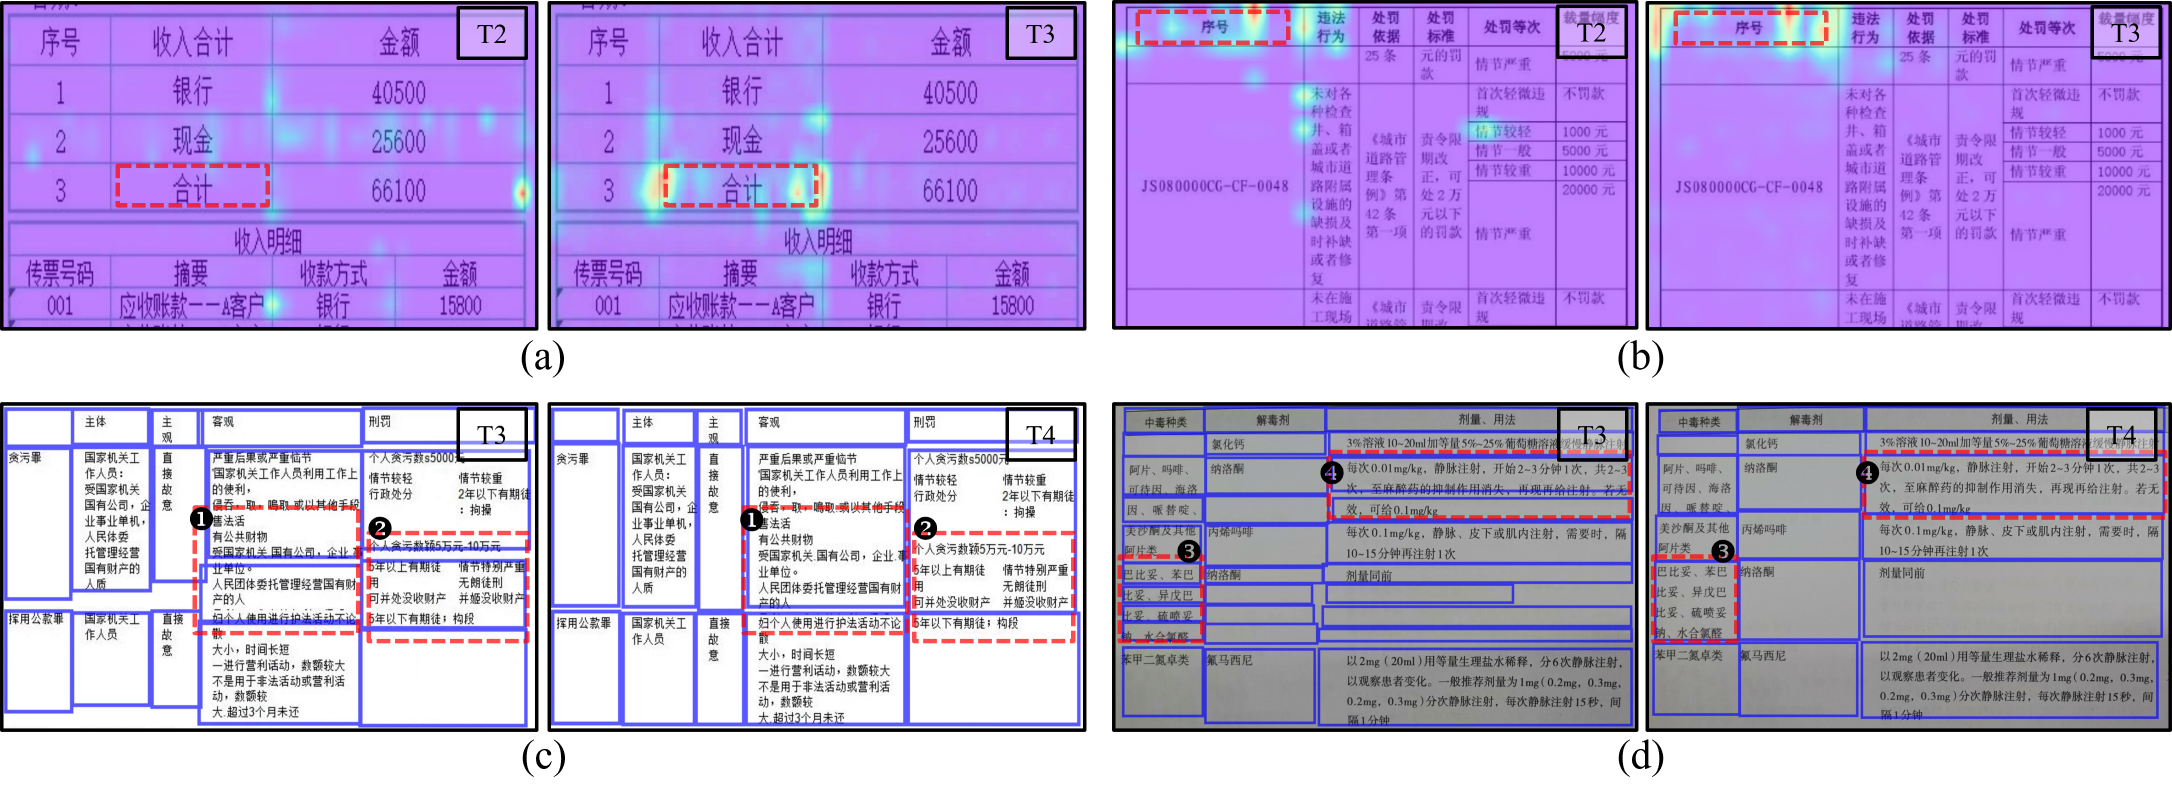
The Effectiveness of Vision Guider. Table images are distinct from conventional document images, as each table cell provides unique visual cues linked to the corresponding row or column. In UniTabNet, we incorporate a Vision Guider at the final decoder layer to steer the model’s focus towards pertinent visual segments of the table image. Figure 5 illustrates the cross-attention mechanisms (averaged across the heads of the final layer) during the decoding stages of systems T2 and T3. The visualizations reveal that T3 more effectively concentrates on the regions pertaining to table cells throughout the decoding process. Furthermore, as shown in Table 3, T3 outperforms T2, demonstrating the effectiveness of the Vision Guider.
The Effectiveness of Language Guider. Most previous methods for table structure recognition focus on reconstructing the table structure from a visual perspective. However, for tables rich in descriptive content, relying solely on visual cues can introduce ambiguities. In UniTabNet, we integrate a Language Guider into the final layer of the decoder, enhancing the model’s capability to interpret the semantic content of the text. Figure 5 displays the prediction results for systems T3 and T4 on the iFLYTAB-DP dataset, illustrating that T4 effectively mitigates visual ambiguities and improves text comprehension. Furthermore, as demonstrated in Table 3, T4 significantly outperforms T3 on the iFLYTAB-DP dataset, highlighting the effectiveness of the Language Guider.
7 Conclusion
In this paper, we present UniTabNet, a novel table structure recognition model leveraging the image-to-text paradigm, consisting of a vision encoder and a text decoder. UniTabNet employs a “divide-and-conquer” strategy to initially separate table cells, then uses physical and logical decoders to reconstruct cell polygon and span information. To improve visual focus and textual understanding within cells, we integrate a Vision Guider and a Language Guider in the text decoder. Comprehensive experiments conducted on publicly available datasets, including PubTables1M, PubTabNet, WTW, and iFLYTAB, demonstrate that UniTabNet achieves state-of-the-art performance in table structure recognition.
8 Limitations
Although UniTabNet has significantly streamlined the structure sequence of table outputs to only include two tokens: <C> and <NL>, its inference efficiency decreases as the number of table cells increases. Furthermore, due to limitations on maximum decoding length, UniTabNet exhibits relatively lower recall rates for table images with a large number of cells. Moreover, unlike the split-and-merge approach which utilizes a carefully designed merge module to handle a variety of table grid structures, UniTabNet employs classification to predict the span of rows and columns. This approach renders UniTabNet ineffective at dealing with previously unseen spans.
References
- Carion et al. (2020) Nicolas Carion, Francisco Massa, Gabriel Synnaeve, Nicolas Usunier, Alexander Kirillov, and Sergey Zagoruyko. 2020. End-to-end object detection with transformers. In ECCV, volume 12346, pages 213–229.
- Chen et al. (2022) Ting Chen, Saurabh Saxena, Lala Li, David J. Fleet, and Geoffrey E. Hinton. 2022. Pix2seq: A language modeling framework for object detection. In ICLR.
- Chi et al. (2019) Zewen Chi, Heyan Huang, Heng-Da Xu, Houjin Yu, Wanxuan Yin, and Xian-Ling Mao. 2019. Complicated table structure recognition. arXiv.
- Göbel et al. (2012) Max C. Göbel, Tamir Hassan, Ermelinda Oro, and Giorgio Orsi. 2012. A methodology for evaluating algorithms for table understanding in PDF documents. In ACM Symposium on Document Engineering, DocEng ’12, Paris, France, September 4-7, 2012.
- Guo et al. (2022) Zengyuan Guo, Yuechen Yu, Pengyuan Lv, Chengquan Zhang, Haojie Li, Zhihui Wang, Kun Yao, Jingtuo Liu, and Jingdong Wang. 2022. TRUST: an accurate and end-to-end table structure recognizer using splitting-based transformers. CoRR, abs/2208.14687.
- Huang et al. (2023) Yongshuai Huang, Ning Lu, Dapeng Chen, Yibo Li, Zecheng Xie, Shenggao Zhu, Liangcai Gao, and Wei Peng. 2023. Improving table structure recognition with visual-alignment sequential coordinate modeling. In CVPR, pages 11134–11143.
- Hurst (2003) Matthew Hurst. 2003. A constraint-based approach to table structure derivation. In ICDAR.
- Kendall et al. (2018) Alex Kendall, Yarin Gal, and Roberto Cipolla. 2018. Multi-task learning using uncertainty to weigh losses for scene geometry and semantics. In CVPR.
- Kim et al. (2022) Geewook Kim, Teakgyu Hong, Moonbin Yim, JeongYeon Nam, Jinyoung Park, Jinyeong Yim, Wonseok Hwang, Sangdoo Yun, Dongyoon Han, and Seunghyun Park. 2022. Ocr-free document understanding transformer. In ECCV, volume 13688, pages 498–517.
- Kingma and Ba (2015) Diederik P. Kingma and Jimmy Ba. 2015. Adam: A method for stochastic optimization. In ICLR.
- Lee et al. (2023) Kenton Lee, Mandar Joshi, Iulia Raluca Turc, Hexiang Hu, Fangyu Liu, Julian Martin Eisenschlos, Urvashi Khandelwal, Peter Shaw, Ming-Wei Chang, and Kristina Toutanova. 2023. Pix2struct: Screenshot parsing as pretraining for visual language understanding. In ICML, volume 202, pages 18893–18912.
- Lewis et al. (2020) Mike Lewis, Yinhan Liu, Naman Goyal, Marjan Ghazvininejad, Abdelrahman Mohamed, Omer Levy, Veselin Stoyanov, and Luke Zettlemoyer. 2020. BART: denoising sequence-to-sequence pre-training for natural language generation, translation, and comprehension. In ACL.
- Lin et al. (2017) Tsung-Yi Lin, Priya Goyal, Ross B. Girshick, Kaiming He, and Piotr Dollár. 2017. Focal loss for dense object detection. In ICCV.
- Lin et al. (2022) Weihong Lin, Zheng Sun, Chixiang Ma, Mingze Li, Jiawei Wang, Lei Sun, and Qiang Huo. 2022. Tsrformer: Table structure recognition with transformers. In ACM MM.
- Liu et al. (2022) Hao Liu, Xin Li, Bing Liu, Deqiang Jiang, Yinsong Liu, and Bo Ren. 2022. Neural collaborative graph machines for table structure recognition. In CVPR.
- Liu et al. (2021) Ze Liu, Yutong Lin, Yue Cao, Han Hu, Yixuan Wei, Zheng Zhang, Stephen Lin, and Baining Guo. 2021. Swin transformer: Hierarchical vision transformer using shifted windows. In ICCV.
- Long et al. (2015) Jonathan Long, Evan Shelhamer, and Trevor Darrell. 2015. Fully convolutional networks for semantic segmentation. In CVPR.
- Long et al. (2021) Rujiao Long, Wen Wang, Nan Xue, Feiyu Gao, Zhibo Yang, Yongpan Wang, and Gui-Song Xia. 2021. Parsing table structures in the wild. In ICCV.
- Ma et al. (2023) Chixiang Ma, Weihong Lin, Lei Sun, and Qiang Huo. 2023. Robust table detection and structure recognition from heterogeneous document images. Pattern Recognition.
- Nassar et al. (2022) Ahmed Nassar, Nikolaos Livathinos, Maksym Lysak, and Peter Staar. 2022. Tableformer: Table structure understanding with transformers. In CVPR.
- OpenAI (2023) OpenAI. 2023. GPT-4 technical report. CoRR.
- Peng et al. (2022) Qiming Peng, Yinxu Pan, Wenjin Wang, Bin Luo, Zhenyu Zhang, Zhengjie Huang, Yuhui Cao, Weichong Yin, Yongfeng Chen, Yin Zhang, Shikun Feng, Yu Sun, Hao Tian, Hua Wu, and Haifeng Wang. 2022. Ernie-layout: Layout knowledge enhanced pre-training for visually-rich document understanding. In Findings of the Association for Computational Linguistics: EMNLP 2022, pages 3744–3756.
- Qiao et al. (2021) Liang Qiao, Zaisheng Li, Zhanzhan Cheng, Peng Zhang, Shiliang Pu, Yi Niu, Wenqi Ren, Wenming Tan, and Fei Wu. 2021. Lgpma: Complicated table structure recognition with local and global pyramid mask alignment. In ICDAR.
- Qin et al. (2024) Chunxia Qin, Zhenrong Zhang, Pengfei Hu, Chenyu Liu, Jiefeng Ma, and Jun Du. 2024. Semv3: A fast and robust approach to table separation line detection. arXiv preprint arXiv:2405.11862.
- Raja et al. (2020) Sachin Raja, Ajoy Mondal, and C. V. Jawahar. 2020. Table structure recognition using top-down and bottom-up cues.
- Schreiber et al. (2017) Sebastian Schreiber, Stefan Agne, Ivo Wolf, Andreas Dengel, and Sheraz Ahmed. 2017. Deepdesrt: Deep learning for detection and structure recognition of tables in document images. In ICDAR.
- Siddiqui et al. (2018) Shoaib Ahmed Siddiqui, Muhammad Imran Malik, Stefan Agne, Andreas Dengel, and Sheraz Ahmed. 2018. Decnt: deep deformable cnn for table detection. IEEE Access.
- Smock et al. (2022) Brandon Smock, Rohith Pesala, and Robin Abraham. 2022. Pubtables-1m: Towards comprehensive table extraction from unstructured documents. In CVPR.
- Smock et al. (2023) Brandon Smock, Rohith Pesala, and Robin Abraham. 2023. Grits: Grid table similarity metric for table structure recognition. In ICDAR, volume 14191, pages 535–549. Springer.
- Tensmeyer et al. (2019) Chris Tensmeyer, Vlad I. Morariu, Brian Price, Scott Cohen, and Tony Martinez. 2019. Deep splitting and merging for table structure decomposition. In ICDAR.
- Vaswani et al. (2017) Ashish Vaswani, Noam Shazeer, Niki Parmar, Jakob Uszkoreit, Llion Jones, Aidan N. Gomez, Lukasz Kaiser, and Illia Polosukhin. 2017. Attention is all you need. In NIPS.
- Wang et al. (2023) Jiawei Wang, Weihong Lin, Chixiang Ma, Mingze Li, Zheng Sun, Lei Sun, and Qiang Huo. 2023. Robust table structure recognition with dynamic queries enhanced detection transformer. Pattern Recognition.
- Xing et al. (2023) Hangdi Xing, Feiyu Gao, Rujiao Long, Jiajun Bu, Qi Zheng, Liangcheng Li, Cong Yao, and Zhi Yu. 2023. LORE: logical location regression network for table structure recognition. In AAAI, pages 2992–3000.
- Xue et al. (2019) Wenyuan Xue, Qingyong Li, and Dacheng Tao. 2019. Res2tim: Reconstruct syntactic structures from table images. In ICDAR.
- Zanibbi et al. (2004) Richard Zanibbi, Dorothea Blostein, and R. Cordy. 2004. A survey of table recognition: models, observations, transformations, and inferences. IJDAR.
- Zhang et al. (2024) Zhenrong Zhang, Pengfei Hu, Jiefeng Ma, Jun Du, Jianshu Zhang, Baocai Yin, Bing Yin, and Cong Liu. 2024. Semv2: Table separation line detection based on instance segmentation. Pattern Recognition, 149:110279.
- Zhang et al. (2022) Zhenrong Zhang, Jianshu Zhang, Jun Du, and Fengren Wang. 2022. Split, embed and merge: An accurate table structure recognizer. Pattern Recognition.
- Zhong et al. (2020a) Xu Zhong, Elaheh ShafieiBavani, and Antonio Jimeno Yepes. 2020a. Image-based table recognition: Data, model, and evaluation. In ECCV.
- Zhong et al. (2020b) Xu Zhong, Elaheh ShafieiBavani, and Antonio Jimeno Yepes. 2020b. Image-based table recognition: Data, model, and evaluation. In ECCV.
Appendix A Appendix
A.1 Datasets and Evaluation Metrics
As shown in Table 4, we summarize the datasets used during our experiments, along with the evaluation metrics employed to assess our model’s performance on each dataset. We will detail each of these in the subsequent sections.
PubTabNet. PubTabNet is a large-scale table recognition dataset. PubTabNet annotates each table image with information about both the structure of table and the text content with position of each non-empty table cell. All tables are also axis-aligned and collected from scientific articles. The authors also proposed a new Tree-Edit-Distance-based Similarity (TEDS) metric for table recognition task, which can identify both table structure recognition and OCR errors. TEDS measures the similarity of the tree structure of tables. While using the TEDS metric, we need to present tables as a tree structure in the HTML format. Finally, TEDS between two trees is computed as:
| (17) |
where and are the tree structure of tables in the HTML formats. EditDist represents the tree-edit distance, and is the number of nodes in . Since taking OCR errors into account may lead to an unfair comparison due to the different OCR models used by various TSR methods, we also employ a modified version of TEDS, called TEDS-Struct. The TEDS-Struct assesses the accuracy of table structure recognition, while disregarding the specific outcomes generated by OCR.
| Datasets | Digital | Camera-captured | Num | Metric | ||
|---|---|---|---|---|---|---|
| Wired | Wireless | Wired | Wireless | |||
| PubTabNet (Zhong et al., 2020b) | ✓ | ✓ | ✗ | ✗ | 568,000 | TEDS-Struct |
| PubTables1M (Smock et al., 2022) | ✓ | ✓ | ✗ | ✗ | 948,000 | GriTS |
| WTW (Long et al., 2021) | ✓ | ✗ | ✓ | ✗ | 14,581 | F1-Measure |
| iFLYTAB (Zhang et al., 2024) | ✓ | ✓ | ✓ | ✓ | 17,291 | TEDS-Struct |
| iFLYTAB-DP | ✗ | ✓ | ✗ | ✓ | 322 | TEDS-Struct |


PubTables1M. Both the PubTables1M and PubTabNet datasets are sourced from the PubMed Central Open Access (PMCOA) database. The primary distinction between the two lies in the richness of annotation provided by PubTables1M. This dataset includes detailed annotations for projected row headers and bounding boxes for all rows, columns, and cells, encompassing even the blank cells. Additionally, it introduces a novel canonicalization procedure aimed at correcting oversegmentation. The purpose of this procedure is to ensure that each table is presented with a unique and unambiguous structural interpretation. To contrast our method with others, we evaluated it using the GriTS metric on this dataset. The recently proposed GriTS metric (Smock et al., 2023) directly compares predicted tables with the ground truth in matrix form and can be interpreted as an F-score reflecting the accuracy of predicted cells. Exact match accuracy is assessed by the percentage of tables for which all cells, including blank cells, are perfectly matched.
WTW. WTW dataset comprises 10,970 training images and 3,611 testing images, collected from wild and complex scenes. This dataset is specifically tailored to wired tabular objects and provides annotated information including tabular cell coordinates, and row/column data. We utilize the F1-Measure to evaluate our method on this dataset. To apply the F1-Measure, it is essential to detect the adjacency relationships among the table cells. The F1-Measure calculates the percentage of correctly detected pairs of adjacent cells, where both cells are accurately segmented and identified as neighbors. When evaluating on the WTW dataset, we employ the cell adjacency relationship metric Göbel et al. (2012), a variant of the F1-Measure. This metric aligns a ground truth cell with a predicted cell based on the Intersection over Union (IoU) criterion. For our assessments, we set the IoU threshold at 0.6.
iFLYTAB. The iFLYTAB dataset comprises 12,104 training samples and 5,187 testing samples. It offers comprehensive annotations for each table image, including physical coordinates and structural information. This dataset not only includes axis-aligned digital documents but also images captured by cameras, which present more challenges due to complex backgrounds and non-rigid image deformations. For evaluating our method on this dataset, we employ the official TEDS-Struct metric***https://github.com/ZZR8066/SEMv2. Specifically, during the evaluation process on iFLYTAB, we assign a distinctive marker to each text line, which signifies its individual content.
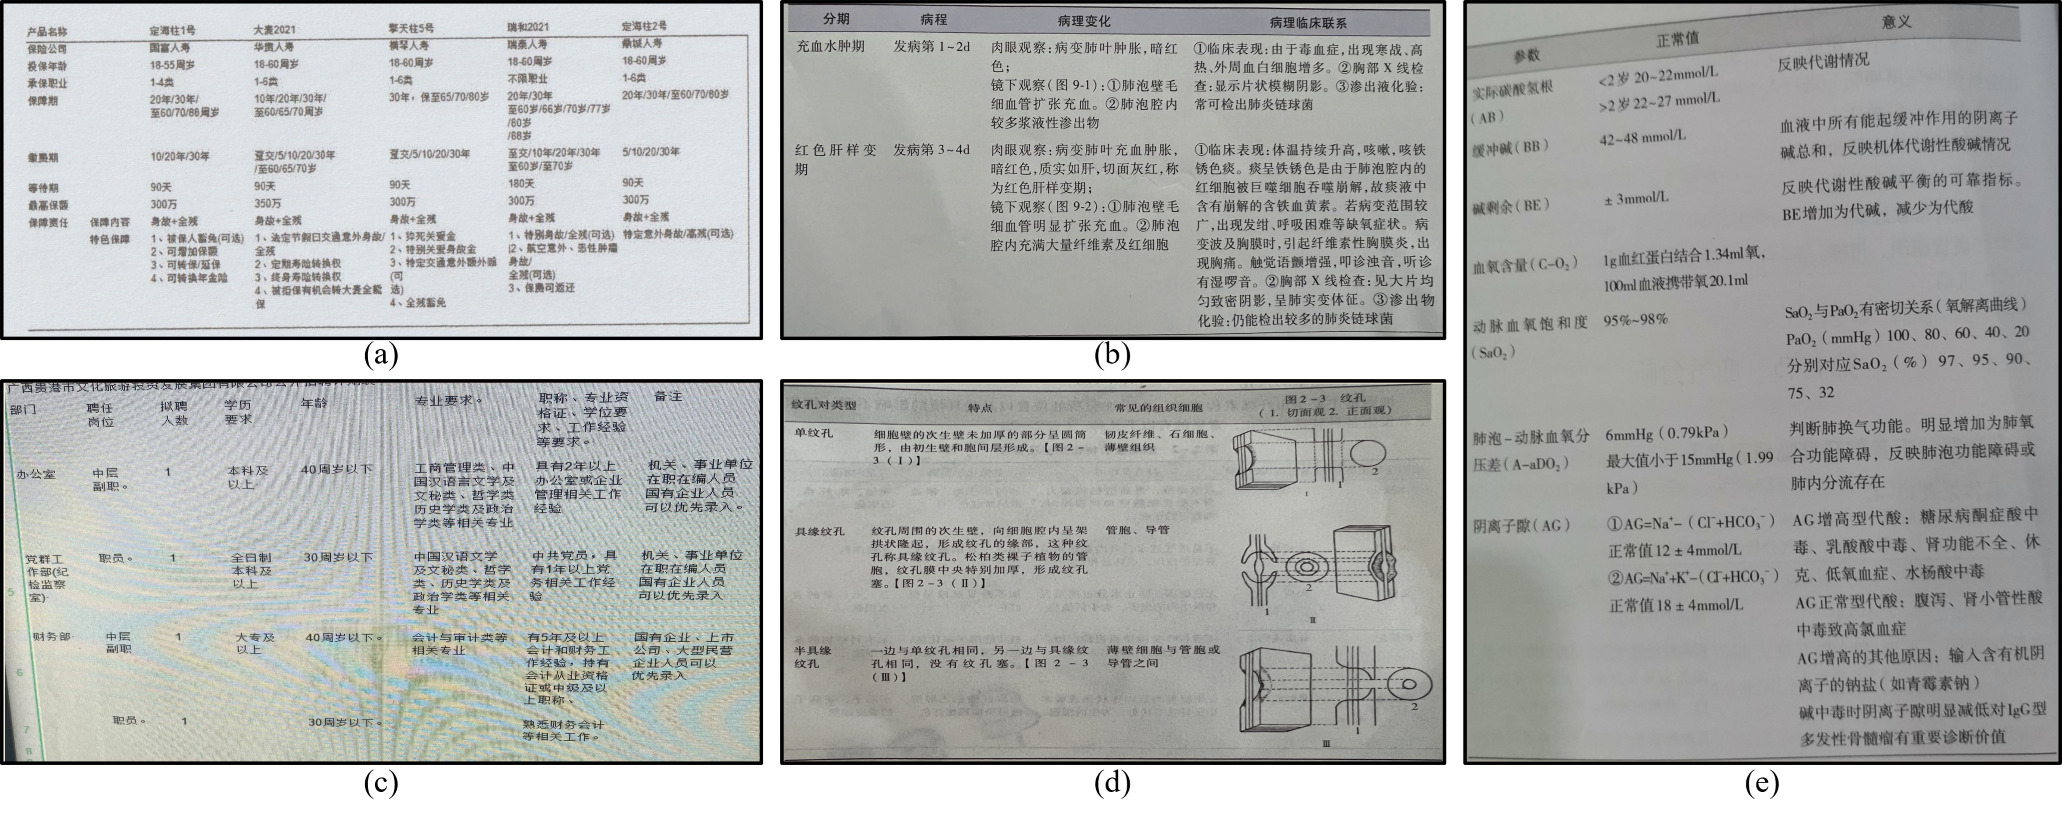
iFLYTAB-DP. To more precisely evaluate our model’s performance on descriptive table images, we select 322 images from the iFLYTAB validation dataset, as shown in Figure 6. To minimize the influence of visual cues such as table lines, which could assist the model’s predictions, we specifically chose images of wireless tables. Our selection criteria primarily focuses on the presence of extensive textual descriptions within the cells. Additionally, we have contacted the authors of iFLYTAB, and they have agreed to make this subset of the dataset available on the official website soon.
A.2 Results
In this section, we explain the issue of the relatively low recall rate exhibited by UniTabNet due to the limitation imposed by the maximum decoding length. As illustrated in Figure 7, we select some table images from the WTW dataset that contain a large number of cells. Due to the maximum decoding length constraint set at 500, this limitation significantly impacts the model’s recall performance. However, as shown in Table 2, UniTabNet achieves relatively high precision. When considering both precision and recall, UniTabNet’s performance on the WTW dataset is comparable to current methods.
Additionally, as depicted in Figure 8, we visualize the row and column information learned by UniTabNet through the Vision Guider. The Vision Guider enables UniTabNet to focus more effectively on cell-related areas during the cell decoding process, as demonstrated in Figure 5.
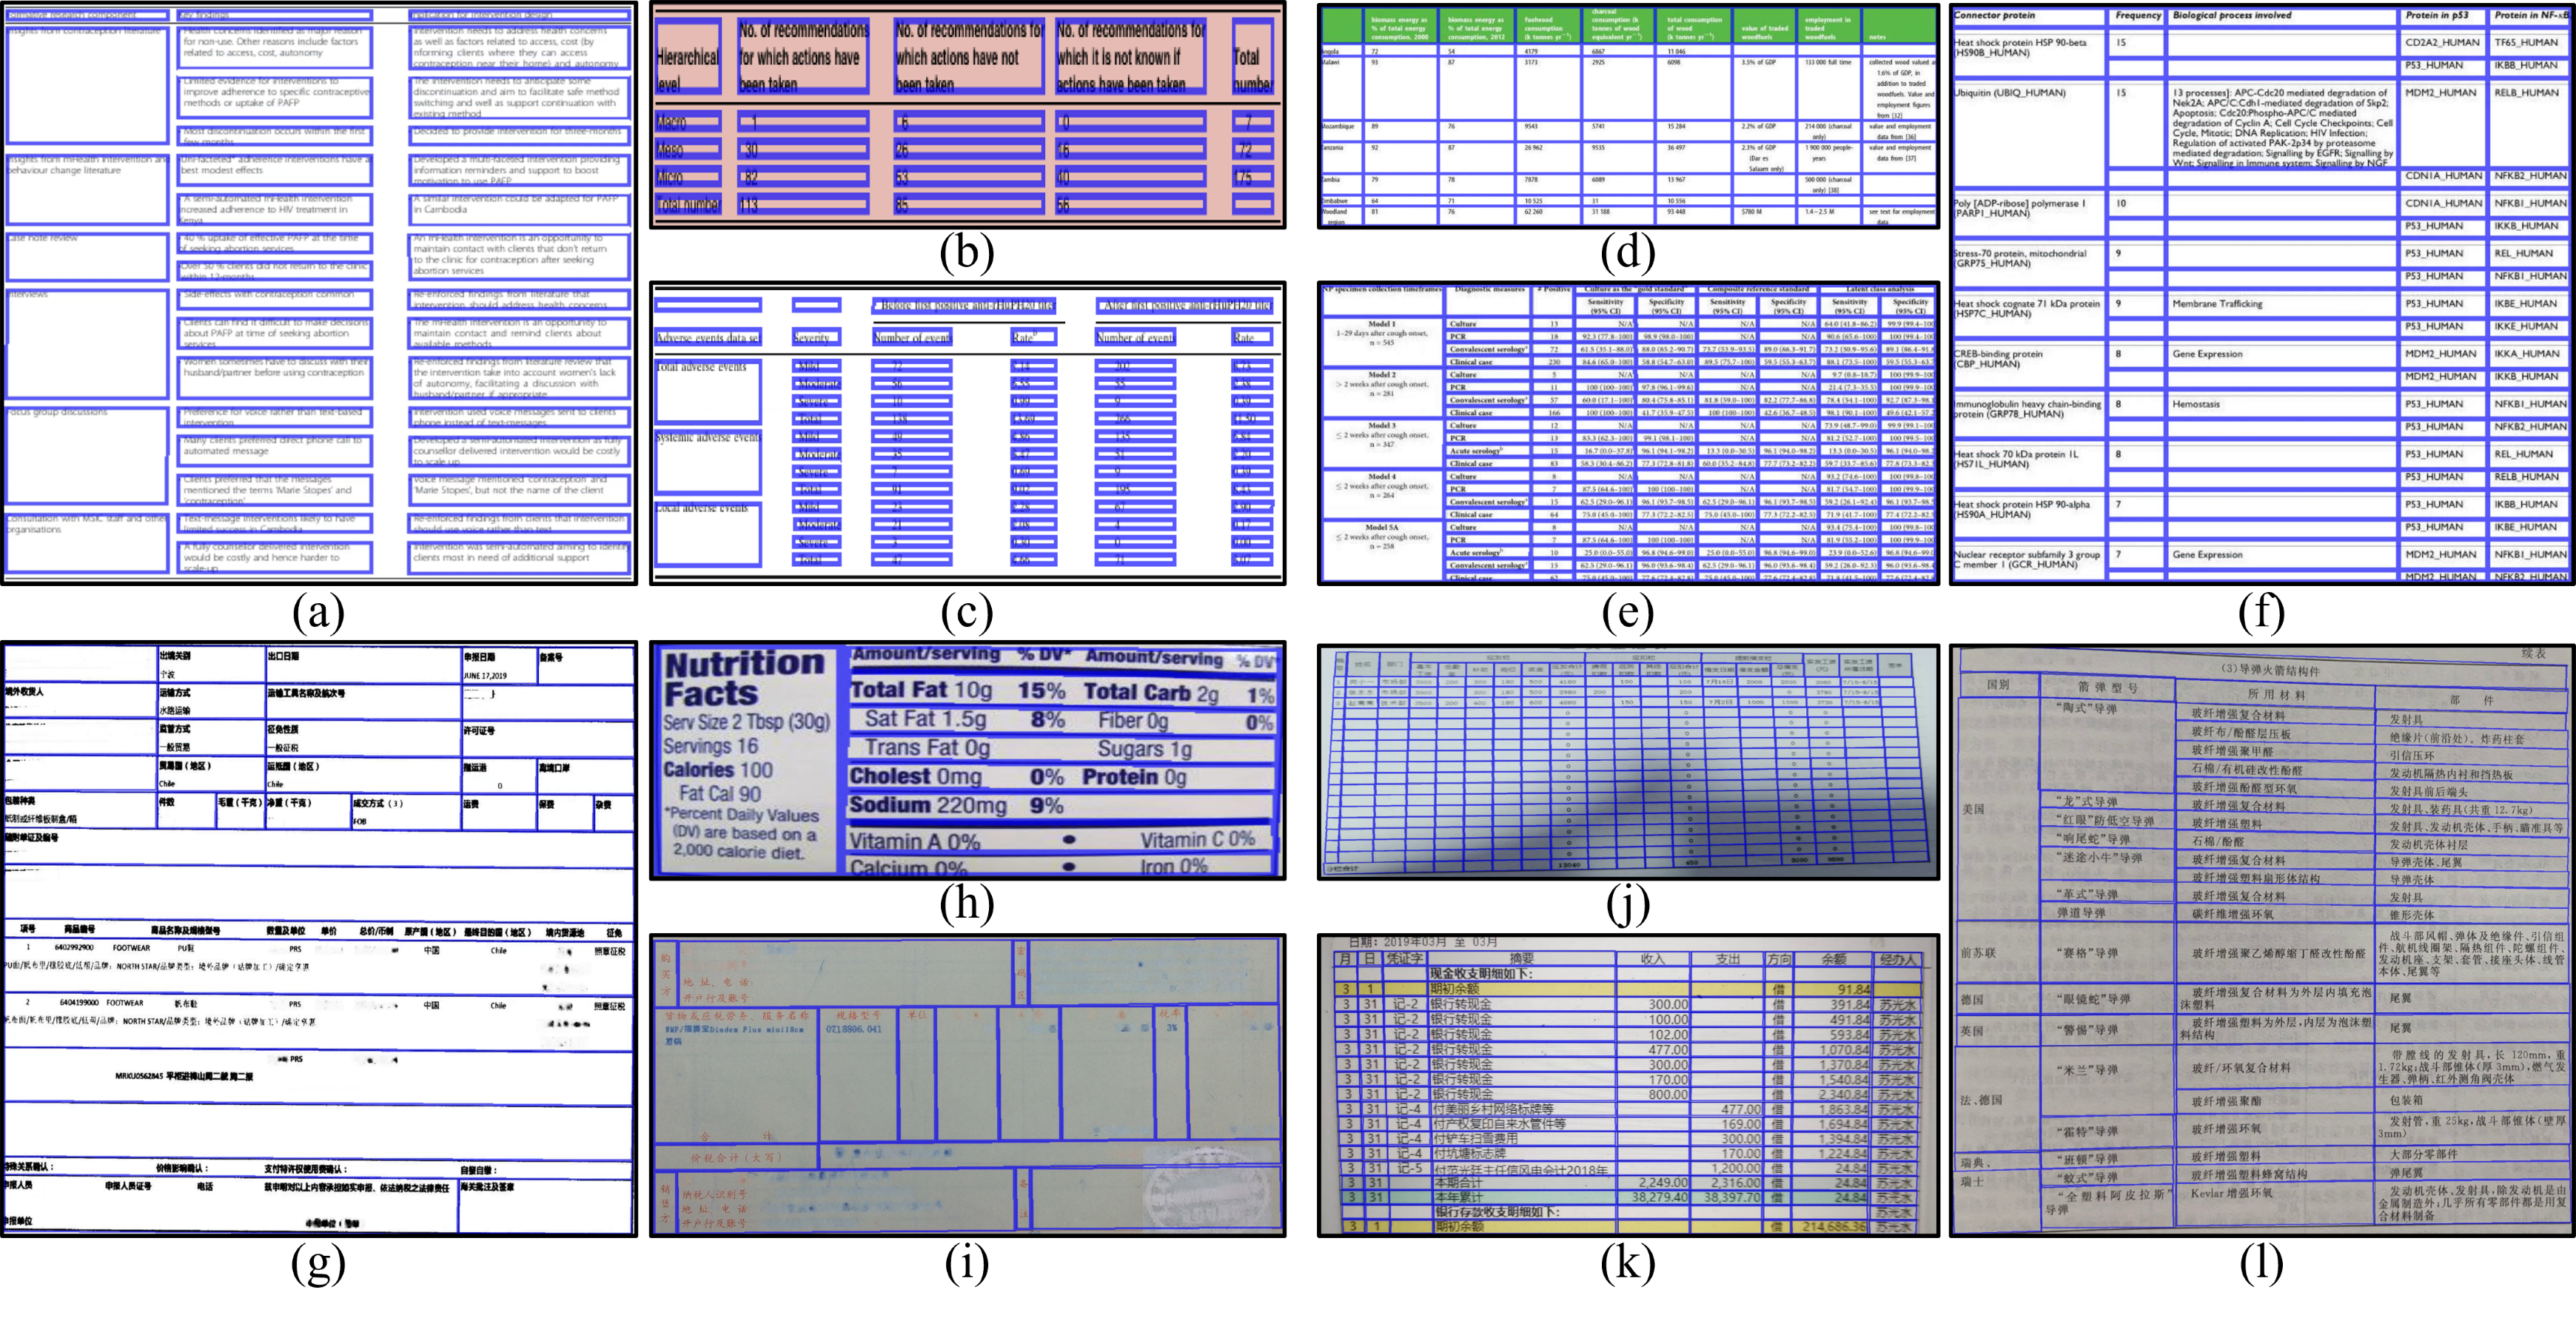
Finally, Figure 9 presents the prediction results of UniTabNet on the experimental datasets used. The model effectively processes both both simple and complex scenarios of table images. Notably, the cell polygons detected by UniTabNet in the PubTabNet dataset significantly differ from those in other datasets. This discrepancy arises because we directly use the official cell bounding box annotations provided, without any postprocessing.