XEQ Scale for Evaluating XAI Experience Quality Grounded in Psychometric Theory
Abstract
Explainable Artificial Intelligence (XAI) aims to improve the transparency of autonomous decision-making through explanations. Recent literature has emphasised users’ need for holistic “multi-shot” explanations and the ability to personalise their engagement with XAI systems. We refer to this user-centred interaction as an XAI Experience. Despite advances in creating XAI experiences, evaluating them in a user-centered manner has remained challenging. To address this, we introduce the XAI Experience Quality (XEQ) Scale (pronounced "Seek" Scale), for evaluating the user-centered quality of XAI experiences. Furthermore, XEQ quantifies the quality of experiences across four evaluation dimensions: learning, utility, fulfilment and engagement. These contributions extend the state-of-the-art of XAI evaluation, moving beyond the one-dimensional metrics frequently developed to assess single-shot explanations. In this paper, we present the XEQ scale development and validation process, including content validation with XAI experts as well as discriminant and construct validation through a large-scale pilot study. Out pilot study results offer strong evidence that establishes the XEQ Scale as a comprehensive framework for evaluating user-centred XAI experiences.
66
1 Introduction
Explainable Artificial Intelligence (XAI) describes a range of techniques to elucidate autonomous decision-making and the data that informed that AI system [19, 12, 2]. Each technique typically provides explanations that focus on a specific aspect of the system and its decisions. Accordingly, the utility of employing multiple techniques for a holistic explanation of a system becomes increasingly clear [2, 27]. The collection of explanations, provided by different techniques and describing different components of the system, forms what we describe as “multi-shot” explanations. Previous work has demonstrated the effectiveness of delivering multi-shot explanations using graphical user interfaces [2] and conversation [18, 27].
While the utility of user-centred interactive explanations is evident in recent literature, the evaluation of these interactions remains a key research challenge. Current works primarily target the development of objective metrics for single-shot techniques [24, 28], emphasising the need for reproducible benchmarks on public datasets [16]. Such metrics are system-centred and model-agnostic, giving the advantage of generalisability. However, objective metrics fail to acknowledge the requirements of different stakeholder groups. A satisfactory explanation is reliant on the recipient’s expertise within that domain and of AI in general [20]. Subjective metrics, such as those described in [10, 11], allow an evaluation which is personalised to the individual and domain. However, existing subjective evaluations lack the capacity to measure the interactive process that underpins multi-shot explanations and how they impact user experience.
| Term | Definition |
|---|---|
| XAI System | An automated decision-making system that is designed and developed to provide information about its reasoning. |
| Stakeholder | An individual or group with a vested interest in the XAI system. Stakeholders are a diverse group, encompassing system designers and developers, who hold an interest in the system’s technical functionality, the end consumers relying on its decisions, and regulatory authorities responsible for ensuring fair and ethical use. |
| XAI Experience (XE) | A user-centred process of a stakeholder interacting with an XAI system to gain knowledge and/or improve comprehension. |
| XE Quality (XEQ) | The extent to which a stakeholder’s explanation needs are satisfied by their XE. |
We address this challenge by introducing the XAI Experience Quality (XEQ) Scale (pronounced: "seek" Scale). We define an XAI Experience as the user-centred process of a stakeholder interacting with an XAI system to gain knowledge and/or improve comprehension. XAI Experience Quality (XEQ) is defined as the extent to which a stakeholder’s explanation needs are satisfied by their XAI Experience. A glossary of all related terminology used throughout this paper is included in Table 1. Specifically, we ask the research question: “How to evaluate an XAI experience, in contrast to assessing single-shot (non-interactive) explanations?”. To address this, we follow a formal psychometric scale development process [3] and outline the following objectives:
-
1.
conduct a literature review to compile a collection of XAI evaluation questionnaire items;
-
2.
conduct a content validity study with XAI experts to develop the XEQ scale; and
-
3.
perform a pilot study to refine and validate the XEQ scale for internal consistency, construct and discriminant validity.
The rest of this paper expands on each objective. We discuss related work in Section 2. Section 3 presents key previous publications and the creation of the initial items bank. The Content Validity study details and results are presented in Section 4 followed by Section 5 presenting pilot study details for the refinement and validation of the XEQ Scale. Key implications of the XEQ Scale are discussed in Section 6. Finally, we offer conclusions in Section 7.
2 Related Work
In the literature, there are several methodologies for developing evaluation metrics or instruments for user-centred XAI.
Hoffman et al. [9] employed Psychometric Theory to construct the Satisfaction Scale, evaluating both content validity and discriminant validity. A similar methodology was adopted in [17] to develop the Madsen-Gregor human-machine trust scale, relying on pre-existing item lists from previous scales in conjunction with expert insights [21]. Jian et al. [13] pursued a factor analysis approach involving non-expert users to formulate a human-machine trust scale. They compiled words and phrases associated with trust and its variants, organising them based on their relevance to trust and distrust, which were then clustered to identify underlying factors and formulate corresponding statements. This methodology is particularly suitable in cases where no prior items exist for initial compilation. While these methodologies are robust to produce reliable scales they are resource and knowledge-intensive processes.
A more frequent approach to scale development is deriving them from existing scales in psychology research. For instance, the System Causability Scale [11] draws inspiration from the widely used System Usability Scale [4], while the Hoffman Curiosity Checklist originates from scales designed to assess human curiosity [9]. Similarly, the Cahour-Forzy Trust Scale [5] selected questions from research on human trust, and the Hoffman Trust Scale incorporates items from previous trust scales [5, 13]. Notably, these derived scales were not evaluated for reliability or other desirable factors, they rely on the quality of the original scales for validity. In this paper, we opt for the psychometric theory approach to establish the content, construct and discriminant validity of the resulting scale. While this approach is resource-intensive, the complexity and the novelty of the evaluation task necessitate a rigorous approach to scale development.
3 Literature Review and Initial Items Bank Compilation
This section presents the literature review findings that led to the compilation of the initial items bank for the XEQ Scale.
3.1 Methodology
To scope the existing work and form the initial item bank, we conducted a targeted literature review in the domain of XAI evaluation metrics. The reasoning for a targeted review instead of a systematic review is two fold: 1) the purpose of the review is to form the initial item bank which involves in depth analysis of selected literature (depth over breadth); and 2) literature under this topic is significantly limited. The initial findings highlighted that while many publications discuss and emphasise the importance of evaluation dimensions (what should be or is evaluated), only a few actually propose and systematically develop metrics for XAI evaluation.
3.2 Findings: Evaluation Dimensions and Metrics
Hoffman et al. [9] are one of the leading contributors and their work has been widely utilised in many user-centred XAI research. They conceptually modelled the “process of explaining in XAI” outlining dimensions and metrics for evaluating single-shot explanations from stakeholders’ perspectives. They considered six evaluation dimensions: goodness, satisfaction, mental model, curiosity, trust and performance, For each dimension, they either systematically developed an evaluation metric or critiqued metrics available in literature offering a comprehensive evaluation methodology for XAI practitioners. System Causability Scale [11] is the other most prominent work in XAI evaluation. We discuss each scale briefly below.
- Hoffman’s Goodness Checklist
-
is utilised to objectively evaluate explanations with an independent XAI expert to improve the “goodness”. It consists of 7 items answered by either selecting ’yes’ or ’no’. It was developed by referring to literature that proposes “goodness” properties of explanations.
- Hoffman Satisfaction Scale
-
was designed using psychometric theory to evaluate the subjective “goodness” of explanations with stakeholders. It consists of 8 items responded in a 5-step Likert Scale. It is viewed as the user-centred variant of the Goodness Checklist with many shared items. However, conversely, it has been evaluated for content validity with XAI experts as well as construct and discriminant validity in pilot studies.
- Hoffman Curiosity Checklist
-
is designed to elicit stakeholder explanation needs, i.e. which aspects of the system pique their curiosity. This metric consists of one question Why have you asked for an explanation? Check all that apply. and the responses inform the design and implementation of the XAI system.
- Hoffman Trust Scale
-
measures the development of trust when exploring a system’s explainability. The authors derived this trust scale by considering the overlaps and cross-use of scales from trust scales in literature for measuring trust in autonomous systems (not in the presence of explainability, e.g. trust between human and a robot) [13, 1, 25, 5].
- System Causability Scale
-
measures the effectiveness, efficiency and satisfaction of the explainability process in systems involving multi-shot explanations [11]. Derived from the widely-used System Usability Scale [4], this scale comprises 10 items rated on a 5-step Likert scale. Notably, it includes items that measure stakeholder engagement, addressing a gap in previous scales designed for one-shot explainability settings. However, the validation of the scale is limited to one small-scale pilot study in the medical domain.
3.2.1 Other Dimensions
Many other publications emphasised the need for user-centred XAI evaluations and explored evaluation dimensions. Two other dimensions considered in [9] are mental model and performance concerning task completion. Hoffman et al. recommended eliciting the mental model of stakeholders in think-aloud problem-solving and question-answering sessions. Performance is measured by observing the change in productivity and change in system usage. The evaluation of these dimensions requires metrics beyond questionnaire-based techniques. Another domain-agnostic survey finds many overlaps with Hoffman et al., defining 4 user-centred evaluation dimensions: mental model, usefulness and satisfaction, trust and reliance and human-task performance [20]. Zhou et al., [29] summarise previous literature, emphasising three subjective dimensions - trust, confidence and preference that overlap with dimensions identified in [9]. Conversely to Hoffman et al., they consider task completion to be an objective dimension in user-centred XAI evaluation.
Carvalho et al., delineate characteristics of a human-friendly explanation in the medical domain, including some subjective or user-centred properties such as comprehensibility, novelty, and consistency with stakeholders’ prior beliefs [6]. Notably, consistency with stakeholders’ prior beliefs aligns with the mental model from Hoffman et al. [9], while novelty can influence stakeholder engagement [11]. Nauta and Seifert [22] recognise 12 properties of explanation quality for image classification applications. They identify three user-centred properties: context - how relevant the explanation is to the user; coherence - how accordant the explanation is with prior knowledge and beliefs; and controllability - how interactive and controllable the explanation is. In comparison to other literature, controllability aligns with engagement [11] and coherence aligns with the mental model [9, 6]. Context can be associated with several properties such as curiosity, satisfaction, and preference [9, 29].
These findings highlighted that there are many overlaps between evaluation dimensions identified in recent years. However, we highlight two main gaps in this current work: 1) there is no consensus in previous literature regarding the applicable metrics to measure these evaluation dimensions; and 2) the majority of the existing dimensions and metrics focus on evaluating individual explanations, not the XAI experiences.
3.3 Compiling the Initial Item Bank
The initial item bank of 40 items included 7 from the Goodness Checklist [10]; 8 from the Satisfaction Scale [10]; 8 from the Trust Scale [10]; and 10 from the System Causability Scale [11]. Seven additional items were authored and included by the research team. These were designed to capture stakeholder views on the interactive experience which is less explicitly addressed in previous literature.
This initial list underwent a rigorous review and revision process, during which the research team eliminated duplicates, consolidated similar items, and rephrased items to reflect the measurement of XAI experiences instead of explanations. The resulting 32 statements formed the initial XEQ Scale (included in Supplementary Material). Response for each item is recorded on a 5-point Likert scale, ranging from “I Strongly Agree” to “I Strongly Disagree”.
3.3.1 Evaluation Dimensions
We reviewed evaluation dimensions from previous literature and consolidated XEQ items into four evaluation dimensions representing XAI experience quality: learning, utility, fulfillment, and engagement. These dimensions are relevant to capturing personalised experiences for a given stakeholder. We define them as follows:
- Learning:
-
the extent to which the experience develops knowledge or competence;
- Utility:
-
the contribution of the experience towards task completion;
- Fulfilment:
-
the degree to which the experience supports the achievement of XAI goals; and
- Engagement:
-
the quality of the interaction between the user and the XAI system.
In the next sections, we describe the development, refinement and validation of the XEQ Scale following Psychometric Theory [23].
4 XEQ Scale Development
This section presents the details and results of an expert user study performed to establish the content validity of the XEQ Scale.
4.1 Study Design
In this study, participants evaluated the initial set of 32 items using the Content Validity Ratio (CVR) method [15]. The CVR method is recommended for quantifying the strength of psychometric scale items with a small group of experts (5-10).
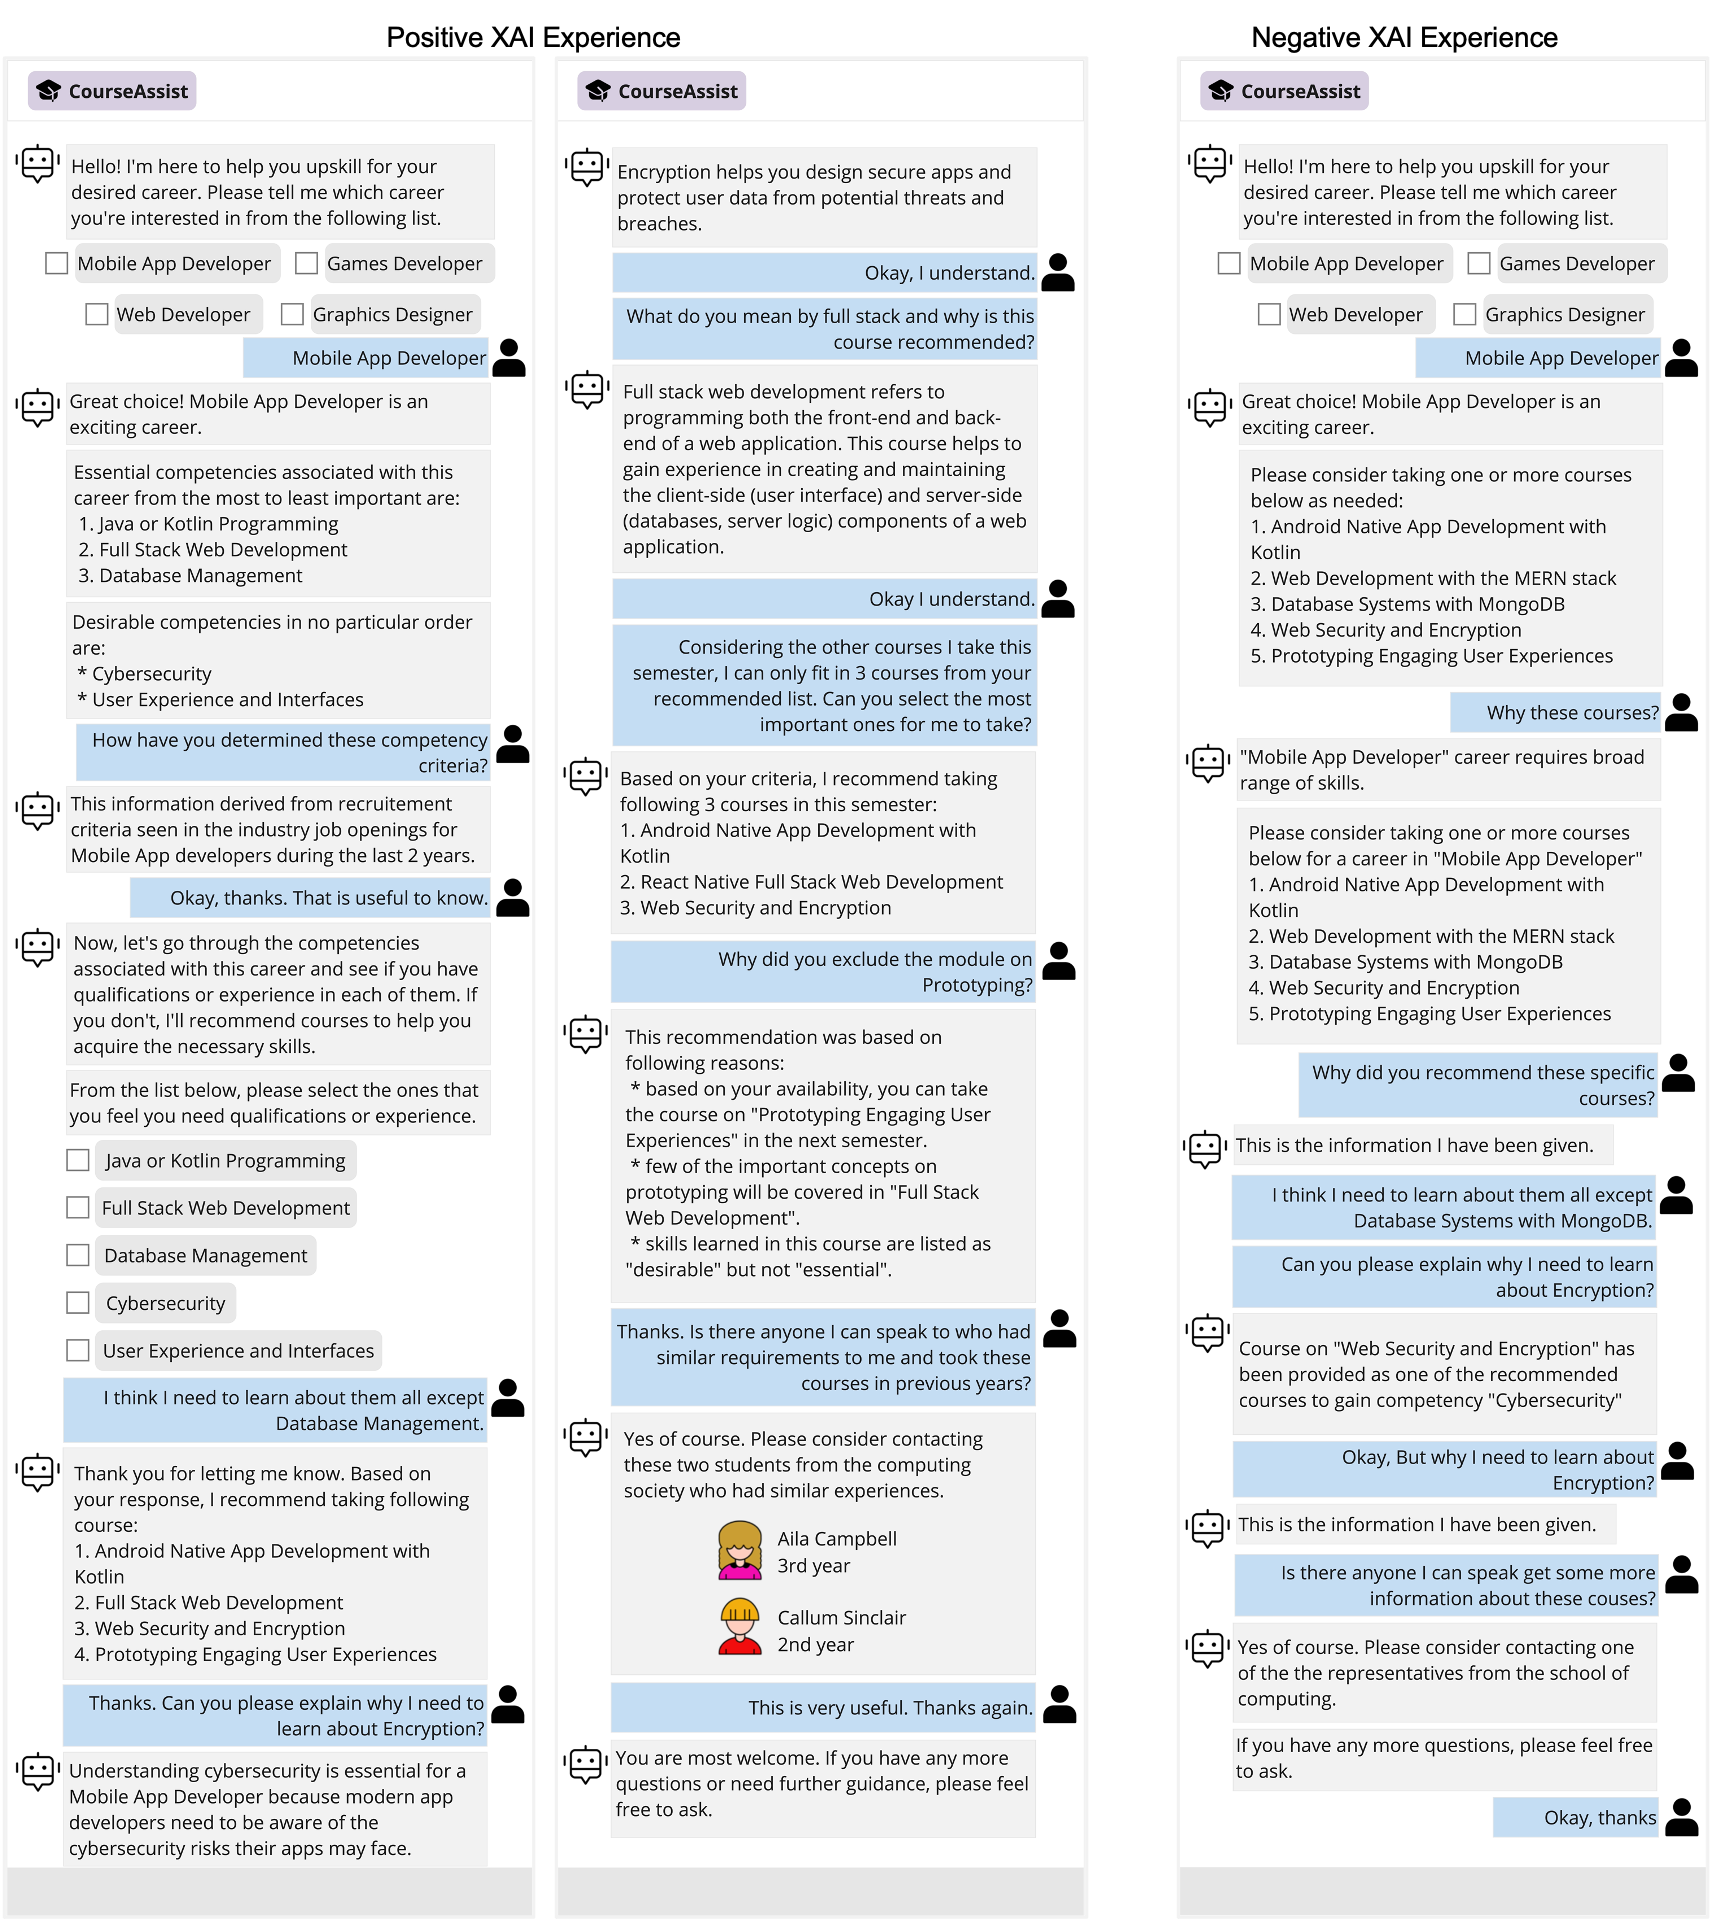
At the start, participants are familiarised with the terminology and they explore 3 sample XAI experiences: 1) a student interacting with a chatbot that assists with course recommendations and support; 2) a clinician interacting with the graphical interface of a radiograph fracture detection system for clinical decision support; and 3) a regulatory officer interacting with a local council welfare web page to explore the fairness and biases with the recommender system used for predicting application outcomes. A sample dialogue with the interactive Course Assist chatbot is shown in Figure 1. This dialogue, in its entirety, captures the explanation experience that we wish to evaluate. Next, participants are asked to rate the 32 items in terms of their relevance for measuring XAI experience quality using a 5-point Likert scale. The relevance scale ranges from Not Relevant at All to Extremely Relevant. Additionally, we included ratings related to clarity, which also use a Likert scale ranging from Not Clear at All to Extremely Clear. This clarity rating was added to get feedback on how easily the items are understood by the participants. Finally, we provided participants the opportunity to suggest rephrasing for items they found relevant but not clear.
4.2 Recruitment Details
The participants of this study consisted of XAI experts both from academia and the industry. 38 experts were contacted via email and 13 participated in the study.The 13 participants represented a diverse set of interests in the human-centred XAI research domain and are either actively conducting research or have published XAI research outcomes since 2020. The study was hosted on the Jisc Online Surveys platform for 3 weeks between November and December 2023.
4.3 Metrics
4.3.1 Content Validity
The Content Validity Index (CVI) assesses item validity based on responses to the relevance property. Lower scores indicate items that may need modification or removal. Given scale with items where indicates an item, denotes the response of participant to item . For analysis, each response () is modified as follows.
We calculate the following two forms of the Content Validity Index (CVI) scores.
- Item-Level CVI:
-
measures the validity of each item independently; the number of responses is and the expected score is .
- Scale-Level CVI:
-
measures the overall scale validity using a) Average method i.e. the mean Item-Level CVI score where the expected score is ; and b) Universal Agreement method i.e. the percentage of items experts always found relevant with the expected value of .
Here, once the average of the I-CVIs is calculated for all items with S-CVI, S-CVI counts the number of items with an I-CVI of 1 (indicating complete agreement among experts that the item is relevant) and divides this by the total number of items.
4.4 Results
We refer to the first two columns of Table 2 for the results of the Content Validity study. We first removed items with low validity () and thereafter S-CVI scores were used to establish the content validity of the resulting scale. Here we marginally divert from the established baseline of for I-CVI to further investigate items with during the pilot study. The Likert responses to the clarity property and free text feedback influenced the re-wording of 7 items to improve clarity (indicated by ). The item selection and rephrasing were done based on the suggestions from the XAI experts and the consensus of the research team. The resulting scale comprised 18 items, which we refer to as the XEQ Scale - pronounced: "Seek". In Table 2, items are ordered by their I-CVI scores.
S-CVI and S-CVI of the scale were 0.8846 and 0.2222. While S-CVI is comparable to the baseline of , S-CVI indicate universal agreement is not achieved. However, existing literature suggests that meeting one of the baseline criteria is sufficient to proceed to pilot studies. Notably, the 14 items with I-CVI also only achieve average agreement (S-CVI) and not universal agreement (S-CVI). Following the item selection and refinement, each item was assigned an evaluation dimension based on the consensus of the research team (see Column “Factor” in Table 2). These will be used in further investigations using factor analysis to establish the construct validity of the scale.
5 XEQ Scale Refinement and Validation
In this section, we present the pilot study conducted to refine the XEQ Scale for internal consistency, construct validity and discriminant validity.
5.1 Study Design and Applications
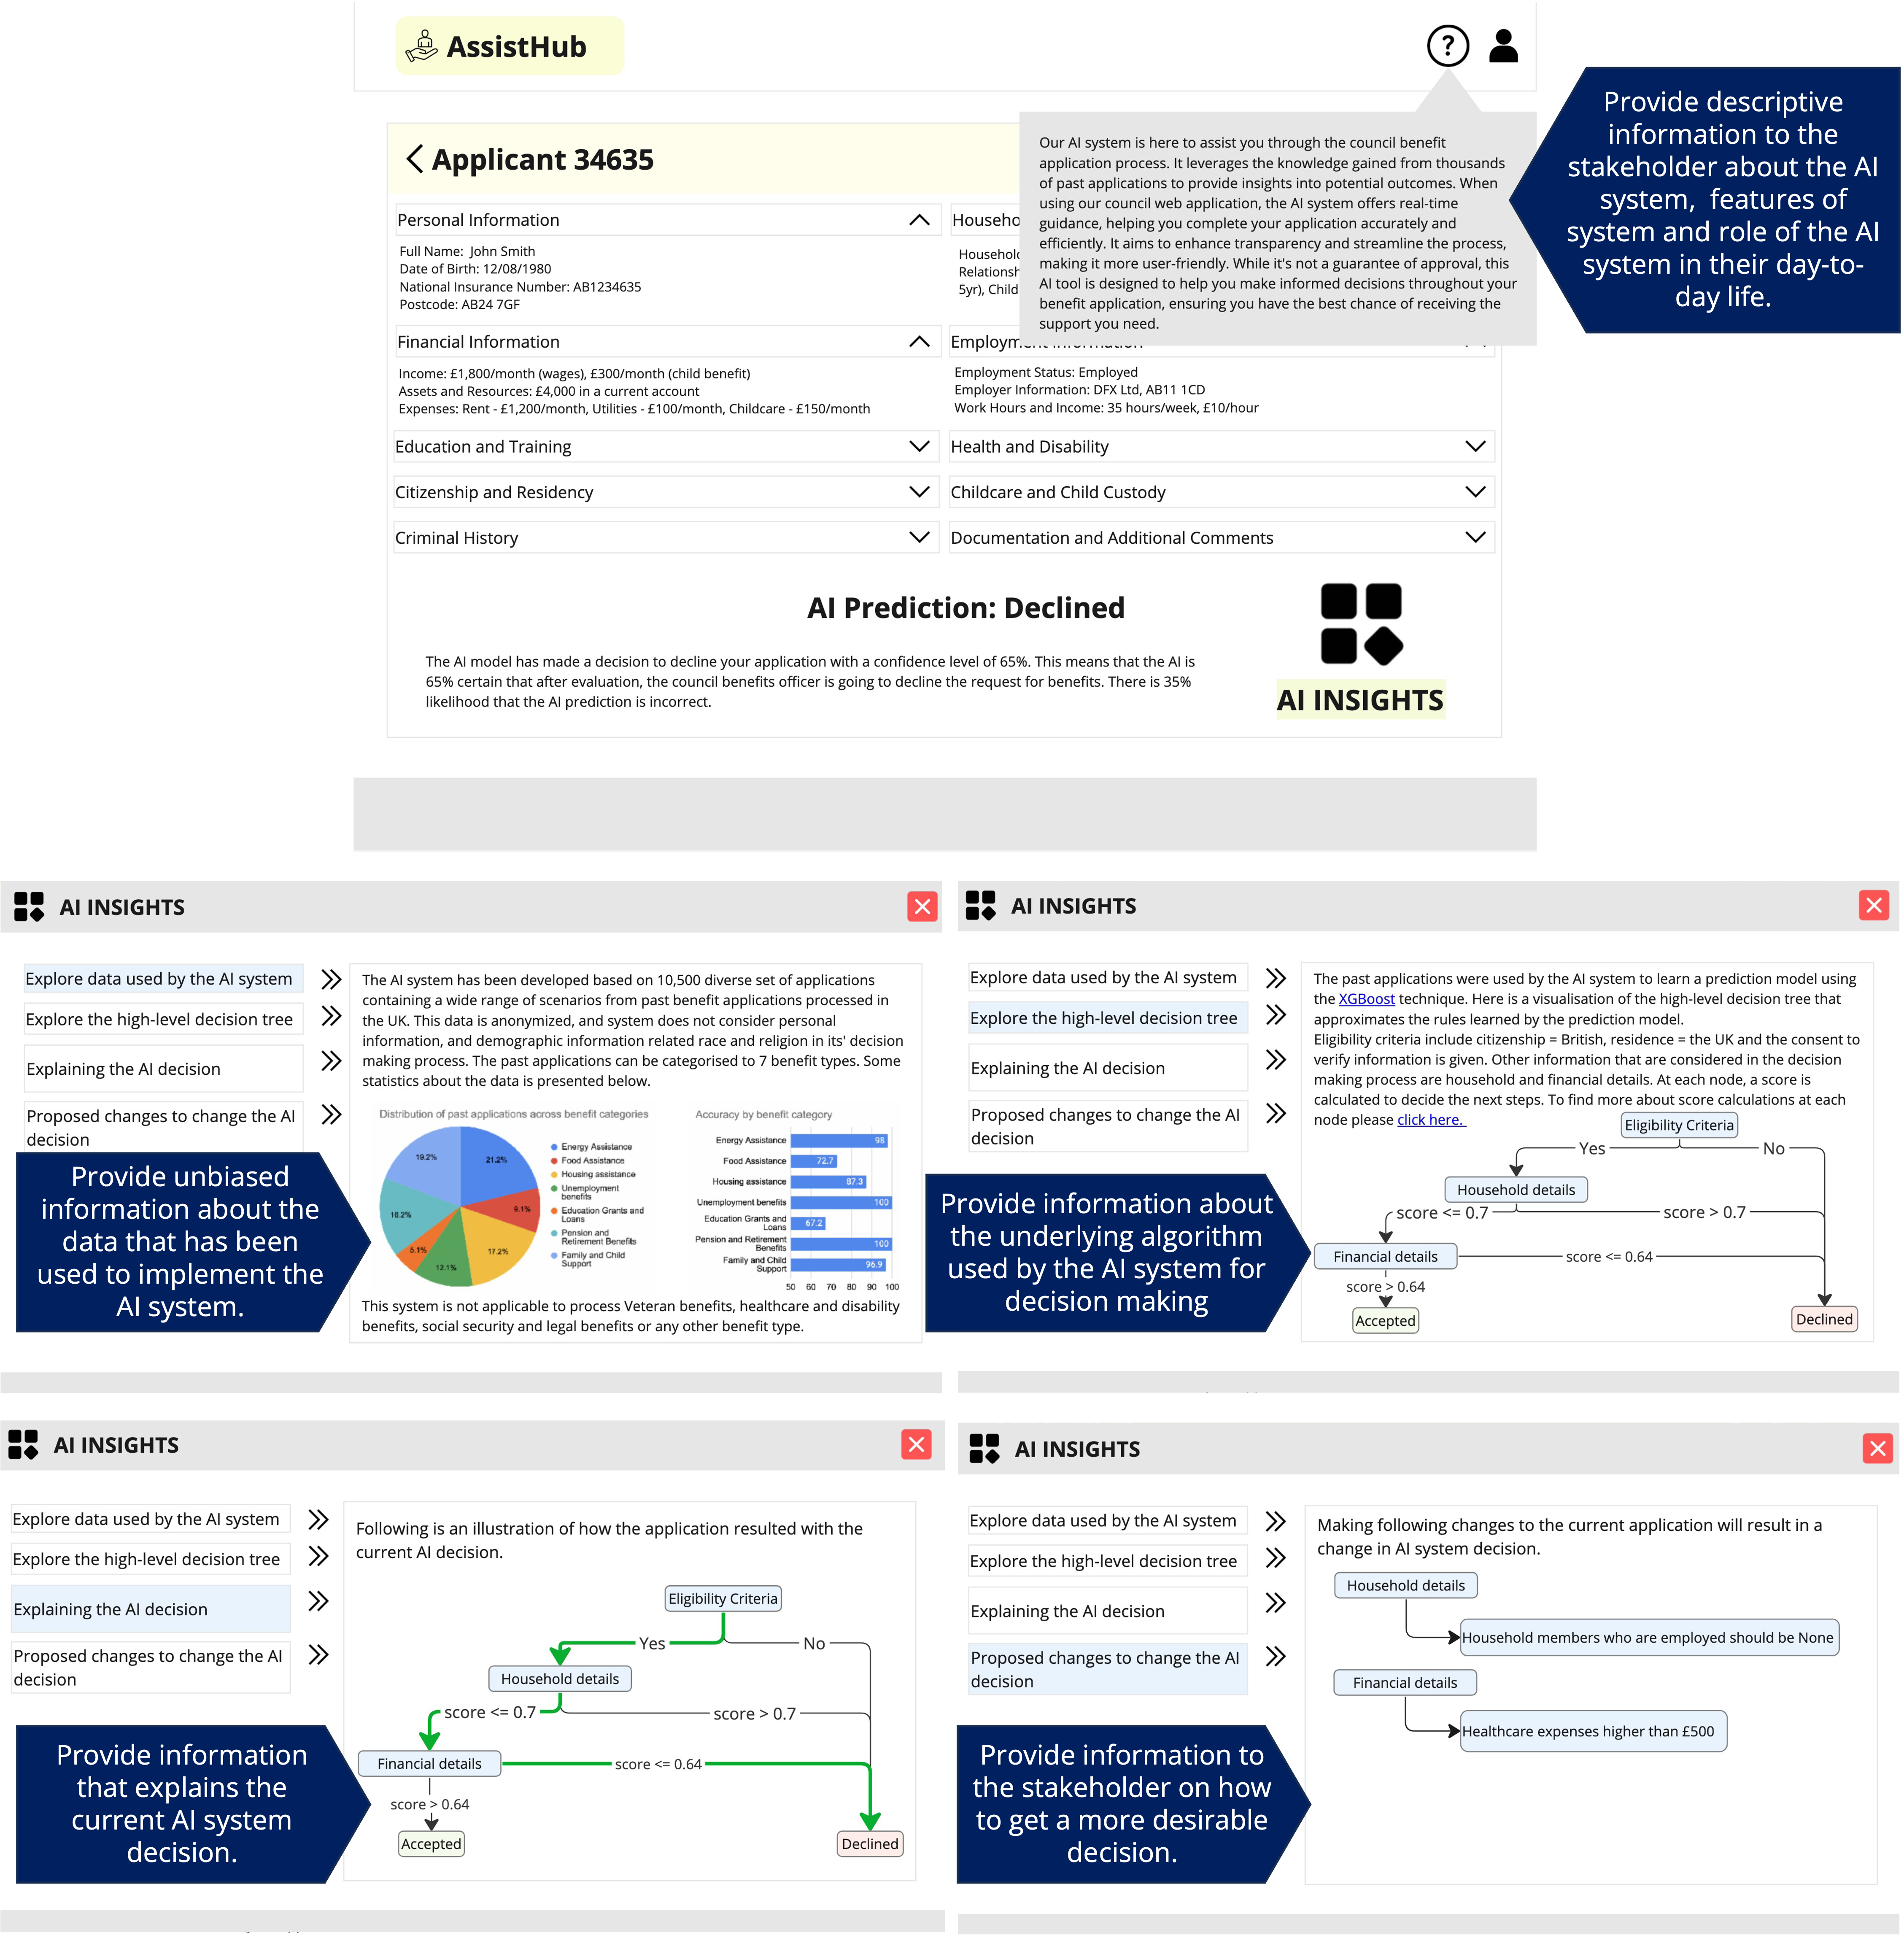
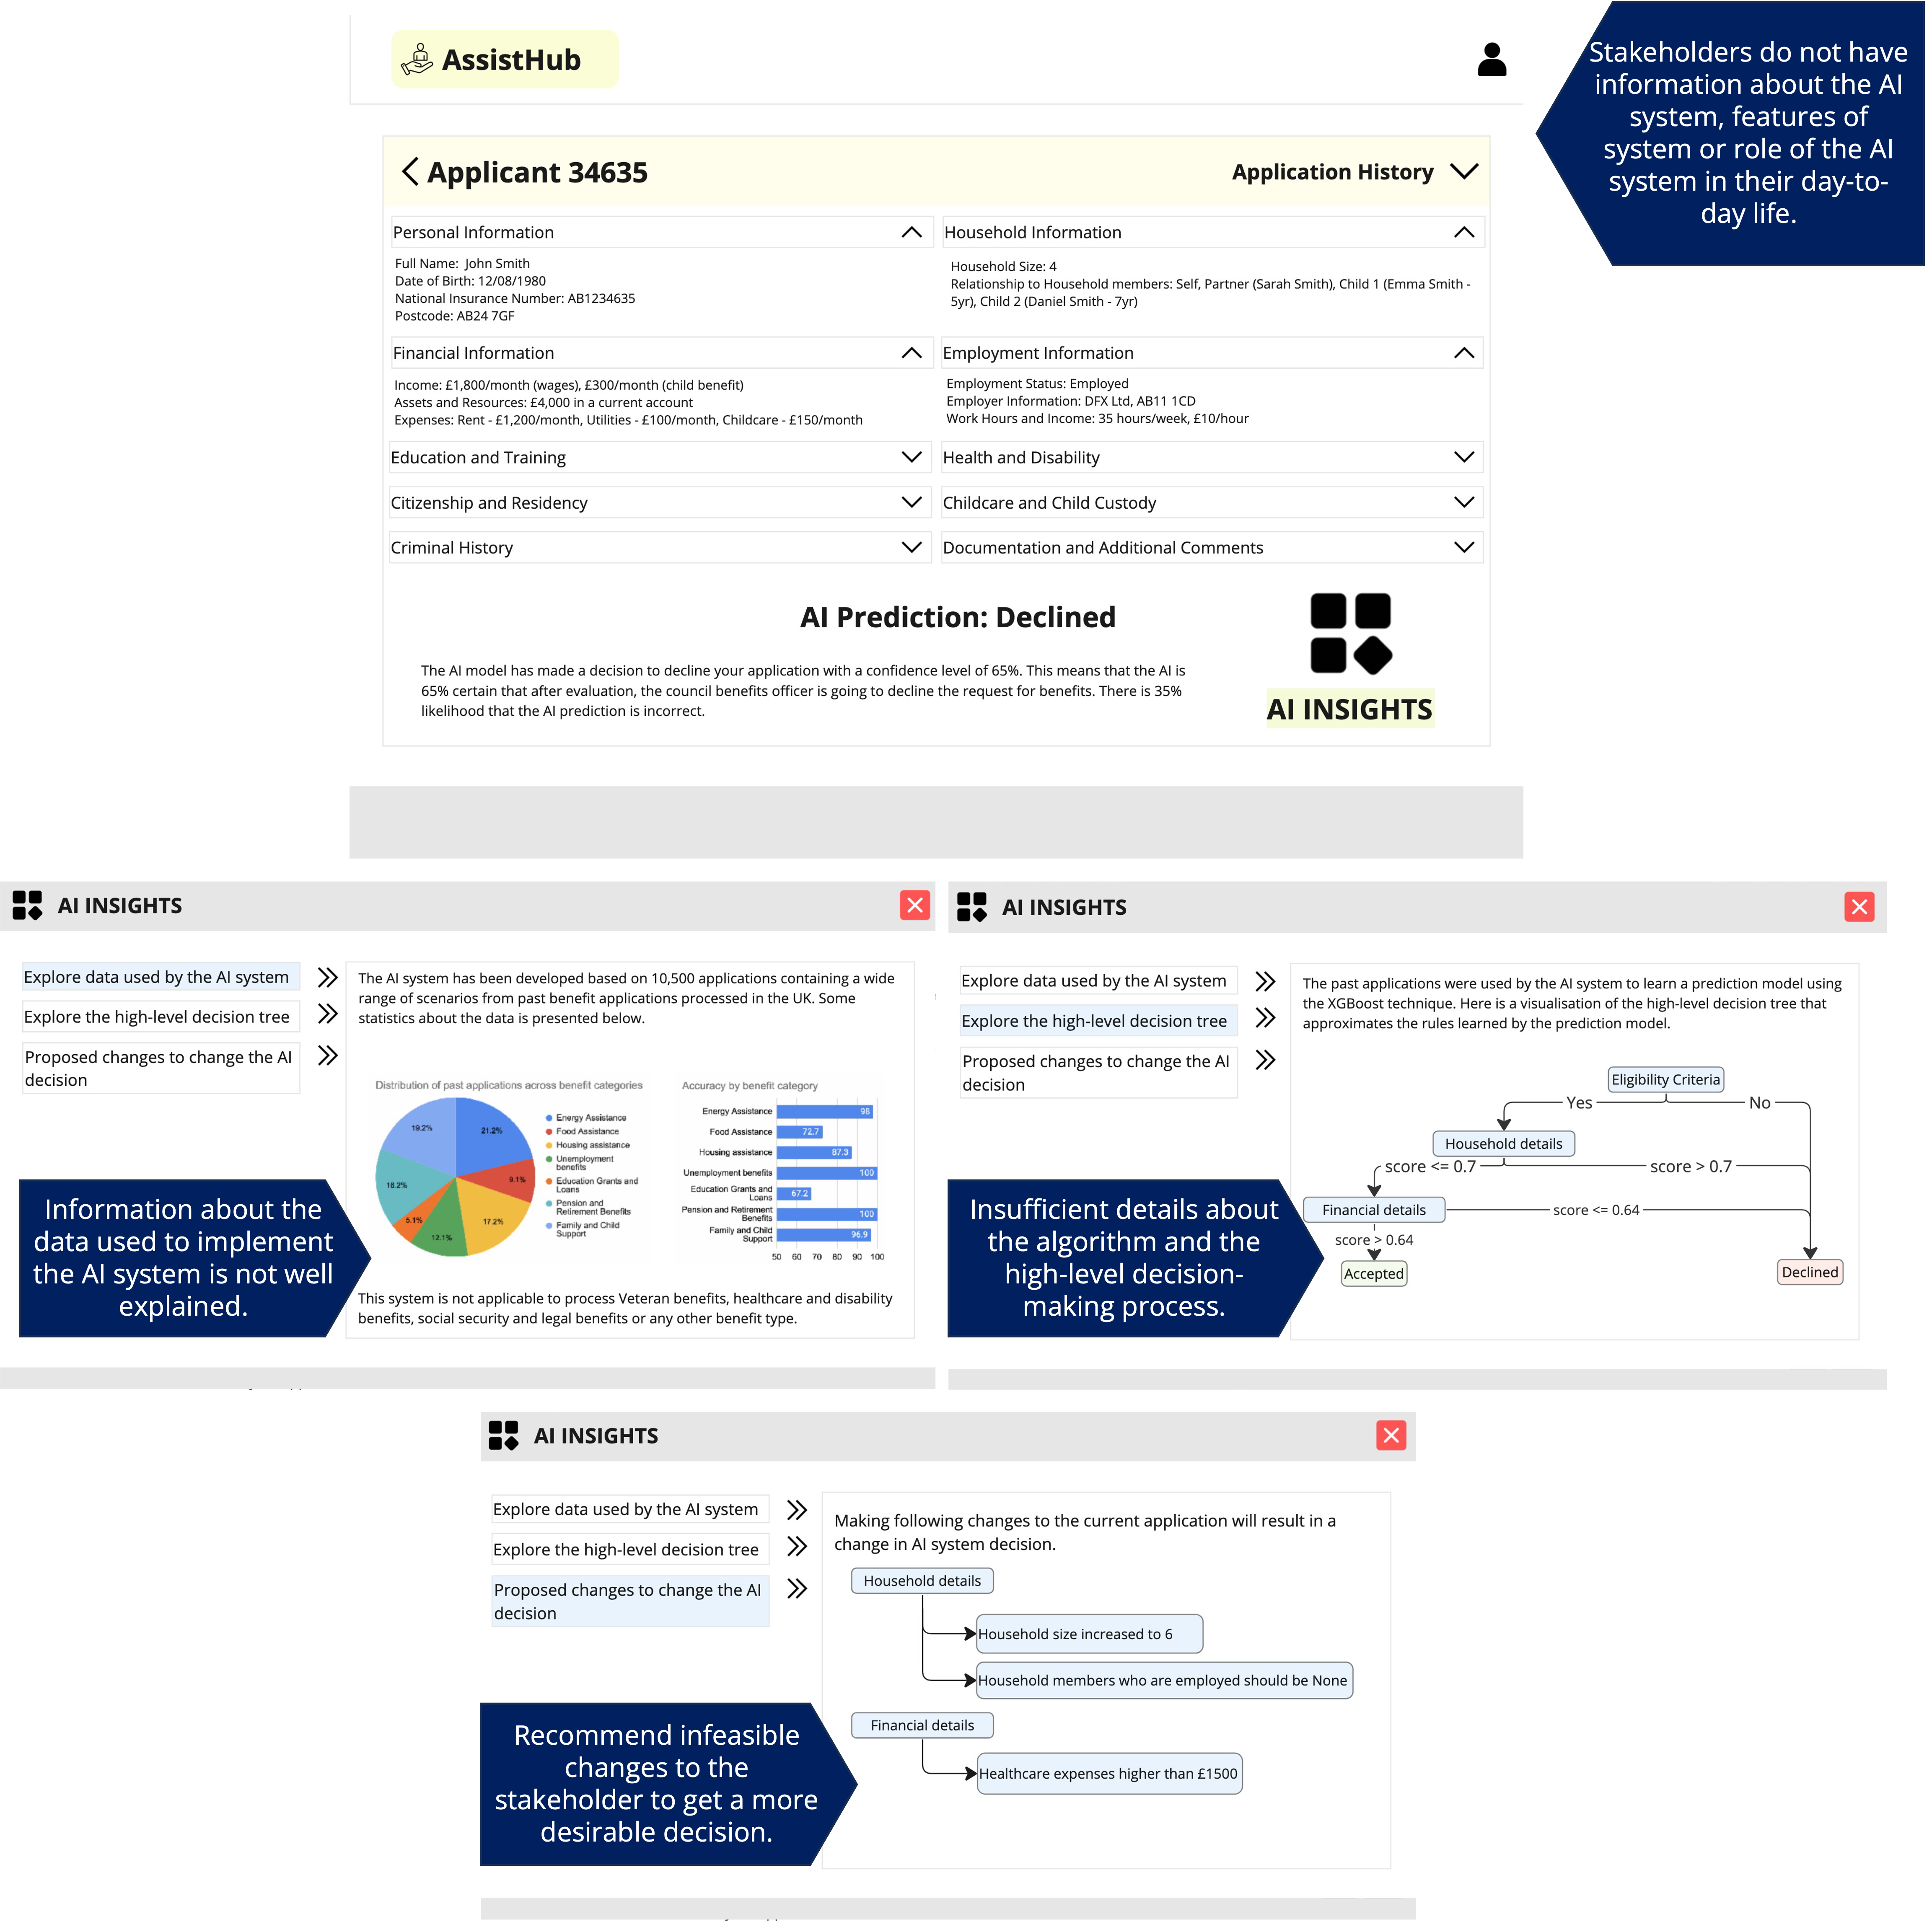
The study involved two application domains: 1) CourseAssist Chatbot for new students to guide their course selection processes and 2) AssistHub website for welfare applicants to assist with application outcomes. For each application, two sample XAI experiences were designed one relatively positive and one relatively negative experience. The two samples differ in the quality of the explanations presented to the participant and the resulting impact on the overall interaction flow. Participants accessed all samples in video format. Figure 1 presents the static views of the two samples of the CourseAssist Chatbot. AssistHub samples are included in Supplementary Material. These sample experiences create a controlled experiment where the discriminant properties of the scale can be validated.
First, the participants explore the XAI experience and they proceed to respond to the XEQ Scale. In addition, they are also queried about the clarity of items within the scope of the sample experience. Lastly, participants can offer free-text feedback about the study.
5.2 Recruitment Details
This study enlisted 203 participants, comprising undergraduate students from the leading research institute and participants recruited from the Prolific.co platform. 33 students from the research institute and 70 Prolific participants were recruited for the CourseAssist application where the inclusion criteria were: Current education level - Undergraduate degree; Degree subjects - Mathematics and statistics, Information and Communication Technologies, Natural sciences; and Year of study - 1st, 2nd, 3rd or 4th. 100 Prolific participants were recruited for the AssistHub application with the following inclusion criteria: Household size is 3 or larger; Property ownership is either social housing or affordable-rented accommodation; Employment status is either part-time, due to start a new job within the next month, unemployed, or not in paid work (e.g. homemaker or retired).
In the rest of this paper, we will refer to all responses to positive experiences as Group A and all responses to negative experiences as Group B. To represent application-specific groups we will use the application name as a prefix; e.g. CourseAssist-A. Each participant was randomly assigned to one of the sample experiences and after review, we excluded 5, 1 and 1 responses from groups CourseAssist-A, AssistHub-A and AssistHub-B who failed the following attention checks: 1) spend less than half of the allocated time; and/or 2) responded to the questionnaire in a pattern. This resulted in 53, 50, 50, and 50 respondents for CourseAssist-A, CourseAssist-B, AssistHub-A and AssistHub-B groups respectively.
5.3 Metrics
For analysis, we introduce the following notations. Given is the participant ’s response to item , the participant’s total is and the item total is . We transform 5-step Likert responses to numbers as follows: Strongly Disagree-1, Somewhat Disagree-2, Neutral-3, Somewhat Agree-4, and Strongly Agree-5. Accordingly, for the 18-item XEQ Scale, (518).
5.3.1 Internal Consistency
Internal consistency refers to the degree of inter-relatedness among items within a scale. We employ the following metrics from psychometric theory to assess the XEQ Scale items.
- Item-Total Correlation
-
calculates the Pearson correlation coefficient between the item score and the total score the expected value per item is . The Item-Total Correlation of item , is calculated as follows.
Here is the average response score for the th item, and is the overall response average.
- Inter-Item Correlation
-
is a measure of the correlation between different items within a scale and values between 0.2 and 0.8 are considered expected since indicate redundancy and indicate poor item homogeneity. The calculation is similar to the previous but is between two items.
- Cronbach’s alpha
-
measures the extent to which all items in a scale are measuring the same underlying construct [7]. High internal consistency is indicated by . If is the standard deviation of responses to item , and is the standard deviation of response totals, is calculated as follows.
As such this helps to quantify how much of the total variance is due to the shared variance among items, which reflects their consistency in measuring the same underlying construct.
5.3.2 Discriminant Validity
Discriminant validity measures the ability of the scale to discern between positive and negative experiences and we used the following two methods.
- Discriminant Analysis
-
treats the pilot study responses as a labelled dataset to train a classification model with a linear decision boundary. The items are considered as features and the group (A or B) is considered as the label. A holdout set then evaluates the model’s ability to distinguish between groups A and B.
- Parametric Statistical Test
-
uses a mixed-model ANOVA test to measure if there is a statistically significant difference between the two groups A and B (agnostic of the domain). Our null hypothesis is “no significant difference is observed in the mean participant total between groups A and B“. Our sample sizes meet the requirements for a parametric test determined by an a priori power analysis using G*Power [8].
5.3.3 Construct Validity
Construct validity evaluates the degree to which the scale assesses the characteristic of interest [14]. We perform two forms of Factor Analysis (FA) to uncover underlying factors (i.e. dimensions) and validate them.
- Exploratory FA
-
finds the number of underlying factors in the scale by assessing the variance explained through the Principal Component Analysis (PCA) coefficients (i.e. eigenvalues).
- Confirmatory FA
-
hypothesise a factor model (e.g. model proposed in the Exploratory FA or a Factor model proposed by XAI experts) and calculate factor loadings where the expected loading for each item is expected to be .
5.4 Results
5.4.1 Internal Consistency
Table 2 column 3 reports the Item-Total Correlation. All items met the baseline criteria of and baseline criteria for Inter-Item correlation. Cronbach’s alpha is which also indicates strong internal consistency.
5.4.2 Discriminant Validity
We performed discriminant analysis over 100 trials where at each trial a different train-test split of the responses was used. Each trial used a stratified split, with 70% of the responses for training and 30% for testing. Over the 100 trials, we observed accuracy of and a macro F1-score of which is significantly over the baseline accuracy of for a binary classification task. Mixed-model ANOVA test showed a statistically significant difference between groups A and B with a p-value of where the mean participant total for groups A and B were and . Also, it revealed a substantial variability within groups indicated by the group variance of 104.86, which we account for including responses from two application domains. Furthermore, Cohen’s d was 1.7639 which indicates a large effect size confirming a significant difference between groups A and B. A standard t-test also obtained close to zero p-value associated with the t-statistic at further verifying statistical difference. Based on this evidence we reject the null hypothesis and confirm the discriminant validity of the scale.
5.4.3 Construct Validity
We first explore the number of factors present in the XEQ Scale using Exploratory FA. Figure 2 plots the eigenvalues for PCA coefficients derived from the scale responses. There is significant one factor that is evident throughout the scale responses which we refer to as “XAI Experience Quality”. This is evidenced by the sharp drop and plateau of eigenvalues for PCA coefficient 2 onwards.
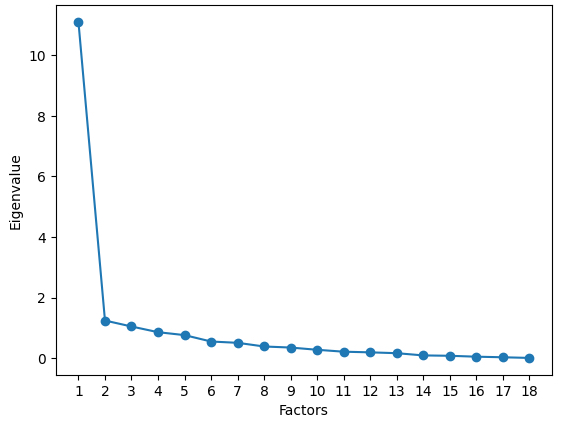
To perform the Confirmatory FA we create a factor model as suggested by exploratory FA. Confirmatory FA shows that all item factor loadings are baseline meaning, all items contribute to the over-arching factor measured by this scale. To validate the evaluation dimensions assigned to items by the research team, we create another factor model with 4 factors each assigned with the subset of the items indicated in Table 2 last column. Again we find that each item meets factor loading for their assigned factor. This confirms that while there is an over-arching factor about “XAI Experience Quality”, it is substantially underpinned by the four factors Learning, Utility, Fulfilment and Engagement. This concludes our multi-faceted refinement of the XEQ Scale based on pilot study results.
| # | Item | I-CVI | Item-Total | One Factor | Factor |
| Correlation | Loading | ||||
| 1 | The explanations received throughout the experience were consistent†. | 1.0000 | 0.6274 | 0.6076 | Engagement |
| 2 | The experience helped me understand the reliability of the AI system. | 1.0000 | 0.6416 | 0.6300 | Learning |
| 3 | I am confident about using the AI system. | 1.0000 | 0.7960 | 0.7790 | Utility |
| 4 | The information presented during the experience was clear. | 1.0000 | 0.7666 | 0.7605 | Learning |
| 5 | The experience was consistent with my expectations†. | 0.9231 | 0.7959 | 0.7831 | Fulfilment |
| 6 | The presentation of the experience was appropriate for my requirements†. | 0.9231 | 0.8192 | 0.8083 | Fulfilment |
| 7 | The experience has improved my understanding of how the AI system works. | 0.9231 | 0.6169 | 0.5859 | Learning |
| 8 | The experience helped me build trust in the AI system. | 0.9231 | 0.7160 | 0.7018 | Learning |
| 9 | The experience helped me make more informed decisions. | 0.9231 | 0.7460 | 0.7279 | Utility |
| 10 | I received the explanations in a timely and efficient manner. | 0.8462 | 0.7015 | 0.6841 | Engagement |
| 11 | The information presented was personalised to the requirements of my role†. | 0.8462 | 0.7057 | 0.6801 | Utility |
| 12 | The information presented was understandable within the req. of my role†. | 0.8462 | 0.7876 | 0.7803 | Utility |
| 13 | The information presented showed me that the AI system performs well†. | 0.8462 | 0.8112 | 0.8016 | Fulfilment |
| 14 | The experience helped to complete the intended task using the AI system. | 0.8462 | 0.8299 | 0.8241 | Utility |
| 15 | The experience progressed sensibly†. | 0.7692 | 0.8004 | 0.7912 | Engagement |
| 16 | The experience was satisfying. | 0.7692 | 0.7673 | 0.7529 | Fulfilment |
| 17 | The information presented during the experience was sufficiently detailed. | 0.7692 | 0.8168 | 0.8035 | Utility |
| 18 | The experience provided answers to all of my explanation needs. | 0.7692 | 0.8472 | 0.8444 | Fulfilment |
6 Discussion
6.1 Implications and Limitations
In psychometric theory, conducting a pilot study involves administering both the scale under development and existing scales to participants. The objective is to assess the correlation between the new scale and those found in existing literature, particularly in shared dimensions. However, our pilot studies did not incorporate this, since to the best of our knowledge there are no previous scales that measured the XAI experience quality or multi-shot XAI experiences. While the System Causability Scale [11] is the closest match in the literature, it was not applicable as it featured in the initial items bank. Also, the current pilot studies had limited variability in application domains. To address this limitation, we are currently planning pilot studies with two medical applications: 1) fracture prediction in Radiographs; and 2) liver disease prediction from CT scans. In the future, we will further validate and refine the scale as necessary.
6.2 XEQ Scale in Practice
Table 3 presents a representative scenario of how the XEQ Scale is used in practice. It presents the XAI Experience Quality analysis of a hypothetical XAI system based on the XEQ scale administered to 5 stakeholders. The items in Table 3 are organised according to their evaluation dimensions and the stakeholder responses are randomly generated and quantified as follows: Strongly Agree-5; Somewhat Agree-4; Neutral-3; Somewhat Disagree-2; Strongly Disagree-1. Based on the responses, we calculate the following scores.
- Stakeholder XEQ Score
-
quantifies individual experiences and is calculated as the mean of stakeholder’s responses to all items.
- Factor Score
-
quantifies the quality along each evaluation dimension and is calculated as the mean of all responses to the respective subset of items. For XAI system designers, Factor Means indicates the dimensions that need improvement. For instance, in the example XAI system, the Learning and Engagement dimensions need improvement whereas stakeholders found the Utility and Fulfilment dimensions to be satisfactory with room for improvement.
- System XEQ Score
-
quantifies the XAI experience quality of the system as a whole and is calculated as the aggregate of Factor Means. The System XEQ Score helps the XAI system designers to iteratively develop a well-rounded system grounded in user experience. The designers can also choose to assign a higher weight to one or a subset of dimensions that they find important at any iteration. System XEQ Score can also be utilised by external parties (e.g. regulators, government), either to evaluate or benchmark XAI systems.
| Factor | Item# | Stakeholder ID | Factor | ||||
| #1 | #2 | #3 | #4 | #5 | Mean | ||
| Learning | 2 | 3 | 2 | 4 | 3 | 3 | |
| 4 | 2 | 1 | 4 | 3 | 4 | ||
| 7 | 4 | 3 | 3 | 4 | 2 | ||
| 8 | 3 | 3 | 2 | 1 | 4 | 2.90 | |
| Utility | 3 | 2 | 4 | 5 | 3 | 4 | |
| 9 | 4 | 2 | 4 | 4 | 5 | ||
| 11 | 4 | 2 | 3 | 5 | 3 | ||
| 12 | 5 | 2 | 5 | 2 | 3 | ||
| 14 | 5 | 3 | 5 | 3 | 4 | ||
| 17 | 4 | 2 | 4 | 4 | 5 | 3.67 | |
| Fulfilment | 5 | 3 | 5 | 4 | 2 | 5 | |
| 6 | 3 | 4 | 5 | 5 | 4 | ||
| 13 | 3 | 3 | 3 | 2 | 3 | ||
| 16 | 4 | 3 | 4 | 5 | 4 | ||
| 18 | 4 | 4 | 3 | 2 | 5 | 3.68 | |
| Engagement | 1 | 1 | 2 | 4 | 2 | 3 | |
| 10 | 4 | 3 | 2 | 4 | 3 | ||
| 15 | 2 | 1 | 3 | 3 | 1 | 2.40 | |
| Stakeholders’s XEQ | 3.22 | 2.72 | 3.72 | 3.17 | 3.61 | ||
| Score | |||||||
| System XEQ Score | 3.16 | ||||||
6.3 XEQ Benchmark Development
The next phase for the XEQ scale entails developing a benchmark for XAI experience quality. This process includes administering the XEQ scale to over 100 real-world AI systems that provide explainability to stakeholders and establishing a classification system. We plan to follow the established benchmark maintenance policy of the User Experience Questionnaire [26] where we develop and release an XEQ Analysis tool with the benchmark updated regularly.
We envision when the scale is administered to stakeholders of a new XAI system, the benchmark will categorise the new system based on the mean participant total in each evaluation dimension as follows - Excellent: Within the top 10% of XAI systems considered in the benchmark; Good: Worse than the top 10% and better than the lower 75%; Above average: Worse than the top 25% and better than the lower 50%; Below average: Worse than the top 50% and better than the lower 25%; and Bad: Within the 25% worst XAI systems. Accordingly, the XEQ benchmark will enable XAI system owners to iteratively enhance the XAI experience offered to their stakeholders.
7 Conclusion
In this paper, we presented the XEQ scale for evaluating XAI experiences. The XEQ scale provides a comprehensive evaluation for user-centred XAI experiences and fills a novel gap in the evaluation of multi-shot explanations which is currently not adequately fulfilled by any other evaluation metric(s). Throughout this paper, we have described the development and validation of the scale following psychometric theory. We make this scale available as a public resource for evaluating the quality of XAI experiences. In future work, we plan to investigate the generalisability of the XEQ scale on additional domains, AI systems and stakeholder groups. Beyond this, we propose to establish a benchmark using the XEQ scale. Our goal is to facilitate the user-centred evaluation of XAI and support the emerging development of best practices in the explainability of autonomous decision-making.
Ethical Statement
Both content validity study and pilot study protocols passed the ethics review of the leading institution (references removed for review). Informed consent was obtained from all XAI experts and pilot study participants.
We thank all XAI experts and pilot study participants for their contributions.
This work is funded by the iSee project. iSee, an EU CHIST-ERA project, received funding for the UK from EPSRC under grant number EP/V061755/1; for Ireland from the Irish Research Council under grant number CHIST-ERA-2019-iSee and for Spain from the MCIN/AEI and European Union “NextGenerationEU/PRTR” under grant number PCI2020-120720-2.
References
- Adams et al. [2003] B. D. Adams, L. E. Bruyn, S. Houde, P. Angelopoulos, K. Iwasa-Madge, and C. McCann. Trust in automated systems. Ministry of National Defence, 2003.
- Arya et al. [2019] V. Arya, R. K. Bellamy, P.-Y. Chen, A. Dhurandhar, M. Hind, S. C. Hoffman, S. Houde, Q. V. Liao, R. Luss, A. Mojsilović, et al. One explanation does not fit all: A toolkit and taxonomy of ai explainability techniques. arXiv preprint arXiv:1909.03012, 2019.
- Boateng et al. [2018] G. O. Boateng, T. B. Neilands, E. A. Frongillo, and S. L. Young. Best practices for developing and validating scales for health, social, and behavioral research: a primer. Frontiers in public health, 6:366616, 2018.
- Brooke et al. [1996] J. Brooke et al. Sus-a quick and dirty usability scale. Usability evaluation in industry, 189(194):4–7, 1996.
- Cahour and Forzy [2009] B. Cahour and J.-F. Forzy. Does projection into use improve trust and exploration? an example with a cruise control system. Safety science, 47(9):1260–1270, 2009.
- Carvalho et al. [2019] D. V. Carvalho, E. M. Pereira, and J. S. Cardoso. Machine learning interpretability: A survey on methods and metrics. Electronics, 8(8):832, 2019.
- Cronbach [1949] L. J. Cronbach. Essentials of psychological testing. 1949.
- Faul et al. [2007] F. Faul, E. Erdfelder, A.-G. Lang, and A. Buchner. G* power 3: A flexible statistical power analysis program for the social, behavioral, and biomedical sciences. Behavior research methods, 39(2):175–191, 2007.
- Hoffman et al. [2018] R. R. Hoffman, S. T. Mueller, G. Klein, and J. Litman. Metrics for explainable ai: Challenges and prospects. arXiv preprint arXiv:1812.04608, 2018.
- Hoffman et al. [2023] R. R. Hoffman, S. T. Mueller, G. Klein, and J. Litman. Measures for explainable ai: Explanation goodness, user satisfaction, mental models, curiosity, trust, and human-ai performance. Frontiers in Computer Science, 5:1096257, 2023.
- Holzinger et al. [2020] A. Holzinger, A. Carrington, and H. Müller. Measuring the quality of explanations: the system causability scale (scs) comparing human and machine explanations. KI-Künstliche Intelligenz, 34(2):193–198, 2020.
- Hu et al. [2021] B. Hu, P. Tunison, B. Vasu, N. Menon, R. Collins, and A. Hoogs. Xaitk: The explainable ai toolkit. Applied AI Letters, 2(4):e40, 2021.
- Jian et al. [2000] J.-Y. Jian, A. M. Bisantz, and C. G. Drury. Foundations for an empirically determined scale of trust in automated systems. International journal of cognitive ergonomics, 4(1):53–71, 2000.
- Kazdin [2021] A. E. Kazdin. Research design in clinical psychology. Cambridge University Press, 2021.
- Lawshe et al. [1975] C. H. Lawshe et al. A quantitative approach to content validity. Personnel psychology, 28(4):563–575, 1975.
- Le et al. [2023] P. Q. Le, M. Nauta, V. B. Nguyen, S. Pathak, J. Schlötterer, and C. Seifert. Benchmarking explainable ai: a survey on available toolkits and open challenges. In International Joint Conference on Artificial Intelligence, 2023.
- Madsen and Gregor [2000] M. Madsen and S. Gregor. Measuring human-computer trust. In 11th australasian conference on information systems, volume 53, pages 6–8. Citeseer, 2000.
- Malandri et al. [2023] L. Malandri, F. Mercorio, M. Mezzanzanica, and N. Nobani. Convxai: a system for multimodal interaction with any black-box explainer. Cognitive Computation, 15(2):613–644, 2023.
- Miller [2019] T. Miller. Explanation in artificial intelligence: Insights from the social sciences. Artificial intelligence, 267:1–38, 2019.
- Mohseni et al. [2021] S. Mohseni, N. Zarei, and E. D. Ragan. A multidisciplinary survey and framework for design and evaluation of explainable ai systems. ACM Transactions on Interactive Intelligent Systems (TiiS), 11(3-4):1–45, 2021.
- Moore and Benbasat [1991] G. C. Moore and I. Benbasat. Development of an instrument to measure the perceptions of adopting an information technology innovation. Information systems research, 2(3):192–222, 1991.
- Nauta and Seifert [2023] M. Nauta and C. Seifert. The co-12 recipe for evaluating interpretable part-prototype image classifiers. In World Conference on Explainable Artificial Intelligence, pages 397–420. Springer, 2023.
- Nunnally and Bernstein [1993] J. C. Nunnally and I. H. Bernstein. Psychometric Theory: Nunnally and Bernstein. McGraw Hill, 3rd edition, 1993.
- Rosenfeld [2021] A. Rosenfeld. Better metrics for evaluating explainable artificial intelligence. In Proceedings of the 20th international conference on autonomous agents and multiagent systems, pages 45–50, 2021.
- Schaefer [2013] K. Schaefer. The perception and measurement of human-robot trust. 2013.
- Schrepp et al. [2017] M. Schrepp, J. Thomaschewski, and A. Hinderks. Construction of a benchmark for the user experience questionnaire (ueq). 2017.
- Wijekoon et al. [2023] A. Wijekoon, N. Wiratunga, K. Martin, D. Corsar, I. Nkisi-Orji, C. Palihawadana, D. Bridge, P. Pradeep, B. D. Agudo, and M. Caro-Martínez. Cbr driven interactive explainable ai. In International Conference on Case-Based Reasoning, pages 169–184. Springer, 2023.
- Yeh et al. [2019] C.-K. Yeh, C.-Y. Hsieh, A. Suggala, D. I. Inouye, and P. K. Ravikumar. On the (in) fidelity and sensitivity of explanations. Advances in Neural Information Processing Systems, 32, 2019.
- Zhou et al. [2021] J. Zhou, A. H. Gandomi, F. Chen, and A. Holzinger. Evaluating the quality of machine learning explanations: A survey on methods and metrics. Electronics, 10(5):593, 2021.
Appendix
7.1 Initial Items Bank
| Item |
|---|
| I like using the system for decision-making. |
| The information presented during the experience was clear. |
| The explanations received throughout the experience did not contain inconsistencies. |
| I could adjust the level of detail on demand. |
| The experience helped me make more informed decisions. |
| The experience helped me establish the reliability of the system. |
| I received the explanations in a timely and efficient manner. |
| The experience was satisfying. |
| The experience was suitable for the intended purpose of the system. |
| I was able to express all my explanation needs. |
| The experience revealed whether the system is fair. |
| The experience helped me complete my task using the system. |
| The experience was consistent with my expectations within the context of my role. |
| The presentation of the experience was appropriate. |
| The experience has improved my understanding of how the system works. |
| The experience helped me understand how to use the system. |
| The experience was understandable in the context of my role. |
| The experience helped me build trust in the system. |
| The experience was personalised to the context of my role. |
| I could request more detail on demand if needed. |
| I did not need external support to understand the explanations. |
| The experience was helpful to achieve my goals. |
| The experience progressed logically. |
| The experience was consistent with my understanding of the system. |
| The duration of the experience was appropriate within the context of my role. |
| The experience improved my engagement with the system. |
| The experience was personalised to my explanation needs. |
| Throughout the experience, all of my explanation needs were resolved. |
| The experience showed me how accurate the system is. |
| All parts of the experience were suitable and necessary. |
| The information presented during the experience was sufficiently detailed for my understanding of the domain. |
| I am confident in the system. |
7.2 Content Validity Study
This study aimed to establish the content validity of the XEQ scale with XAI experts. Being XAI Experiences are a novel concept, we included three example XAI experiences that capture a variety of stakeholder types and application domains. In addition to the CourseAssist chatbot example included in the paper, they were presented with the following experiences in video format.
-
•
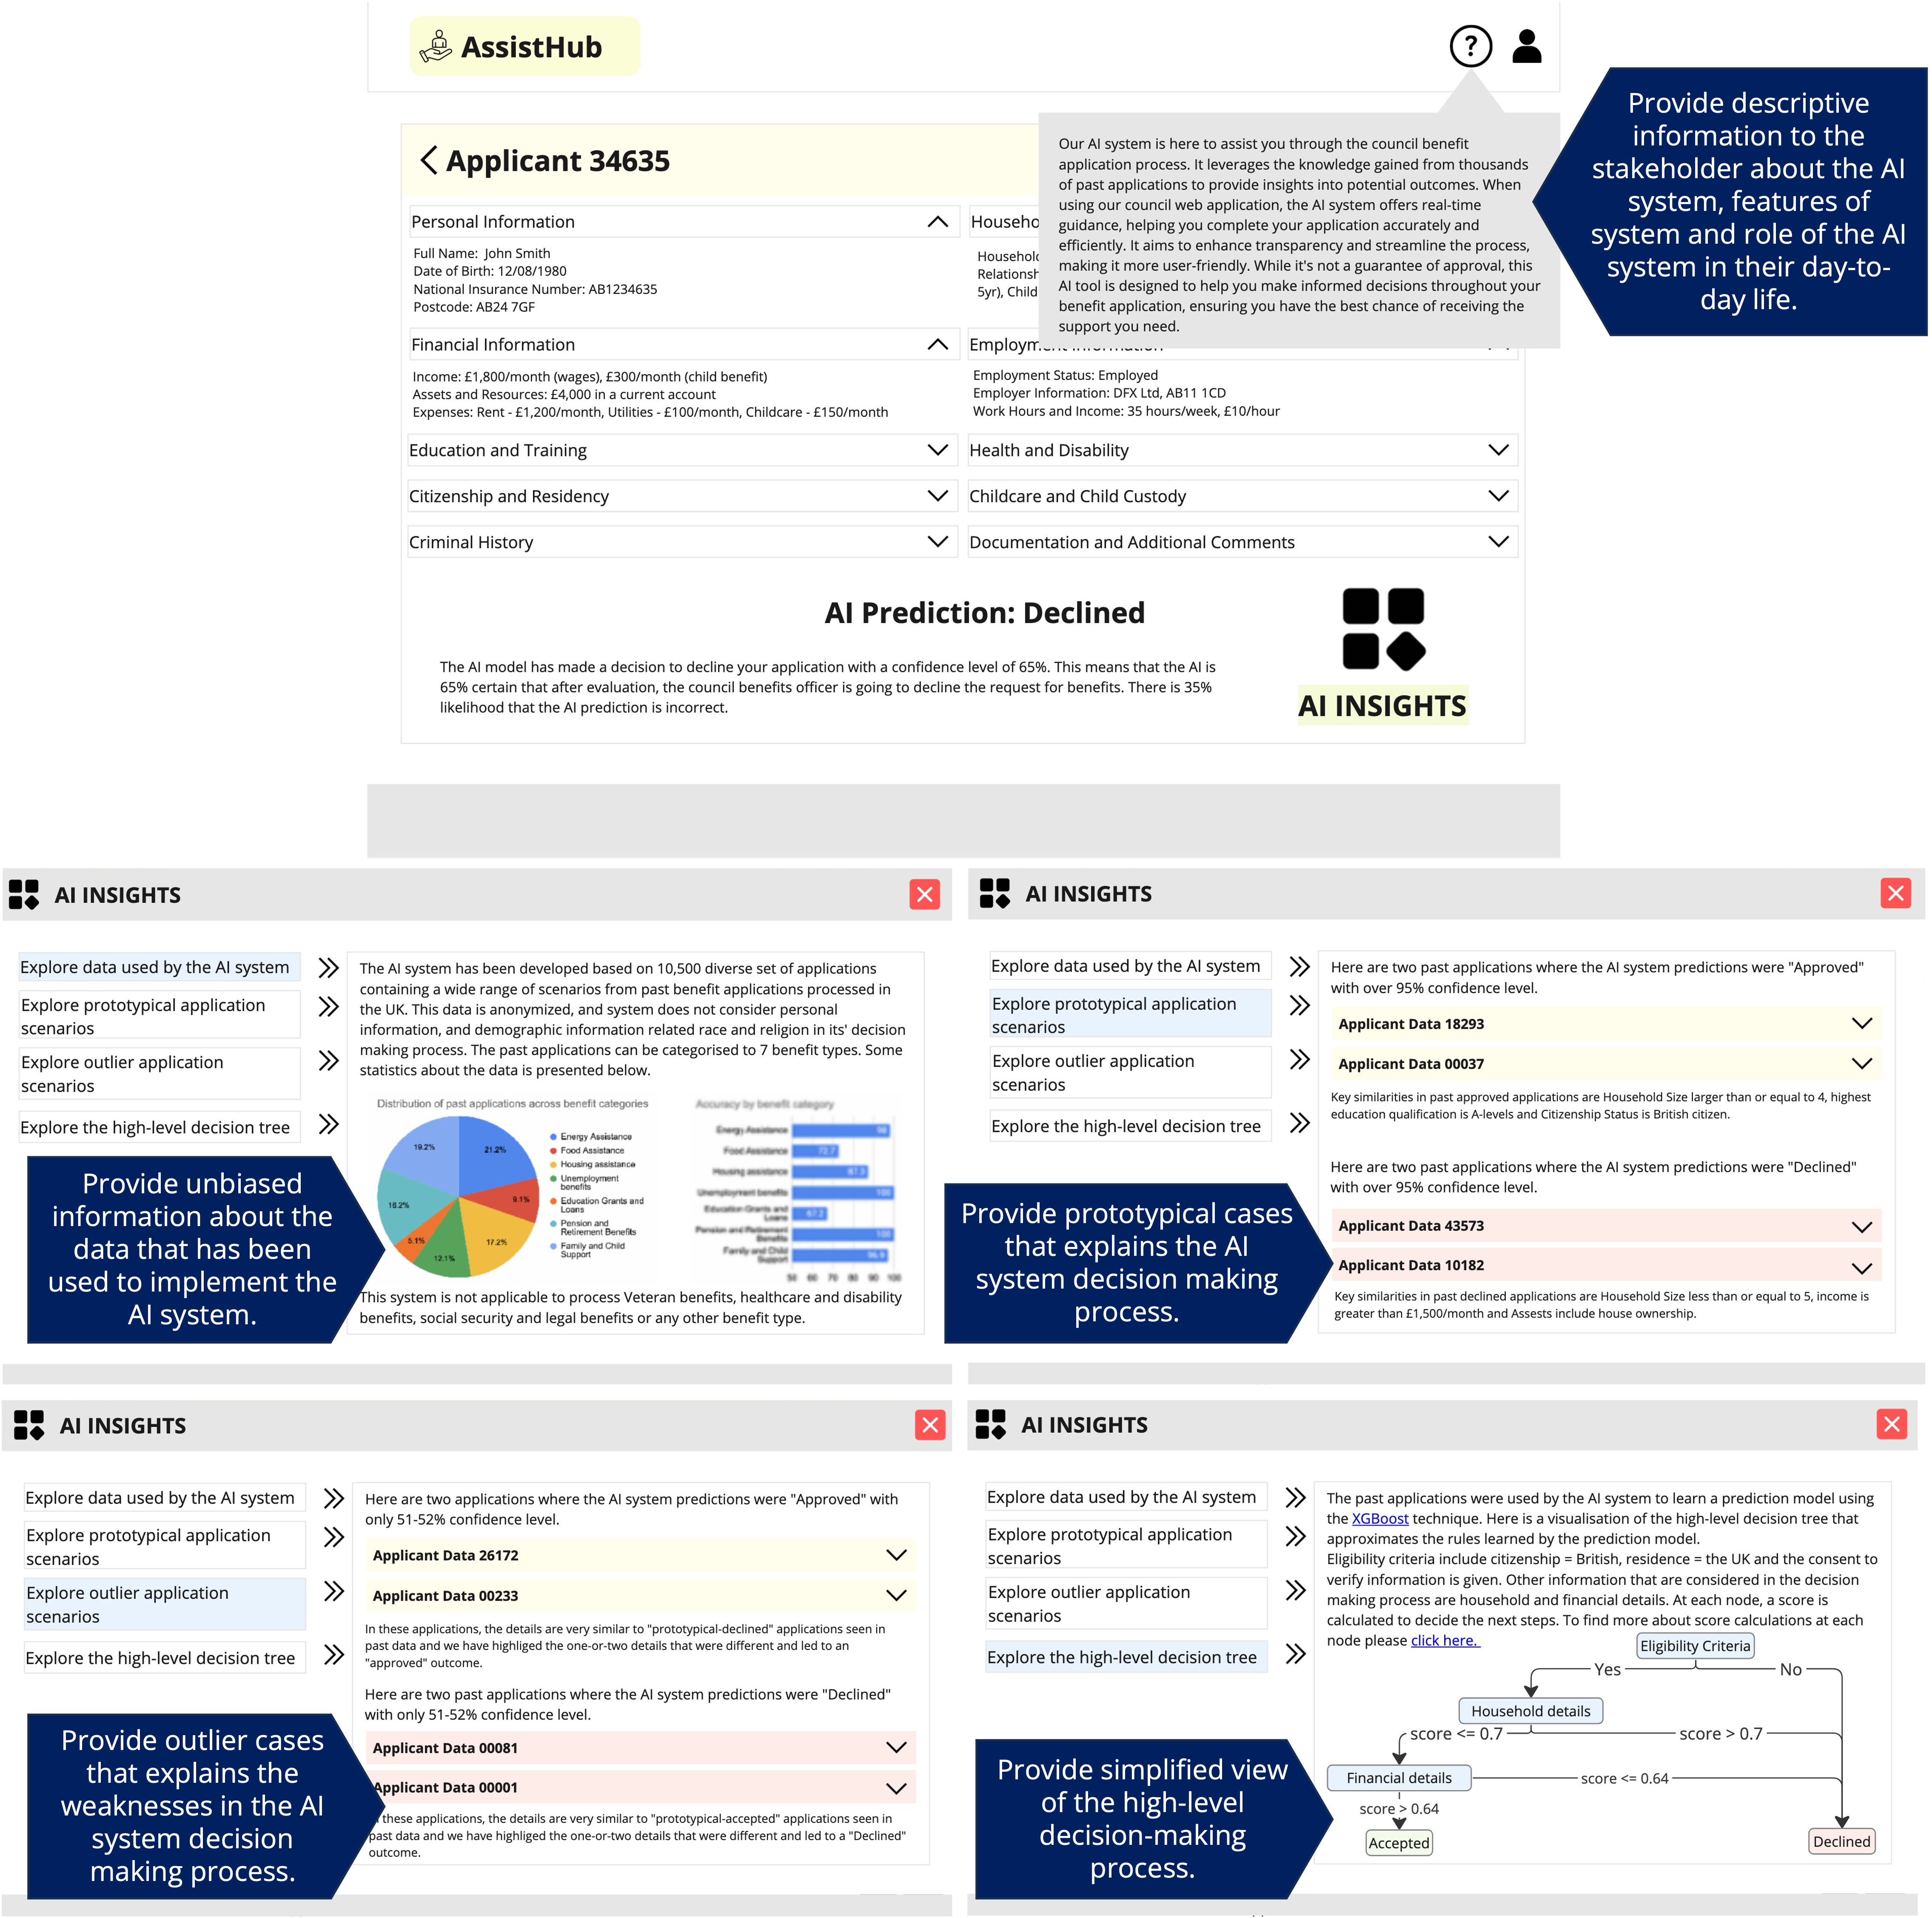
The AssistHub AI platform is a website for processing welfare applications and is used by a local council to accelerate the application process. A regulation officer is exploring the website and its XAI features to understand the fairness and bias of the AI system being used in the decision-making process. A non-interactive preview of the experience is presented in Figure 3.
-
•
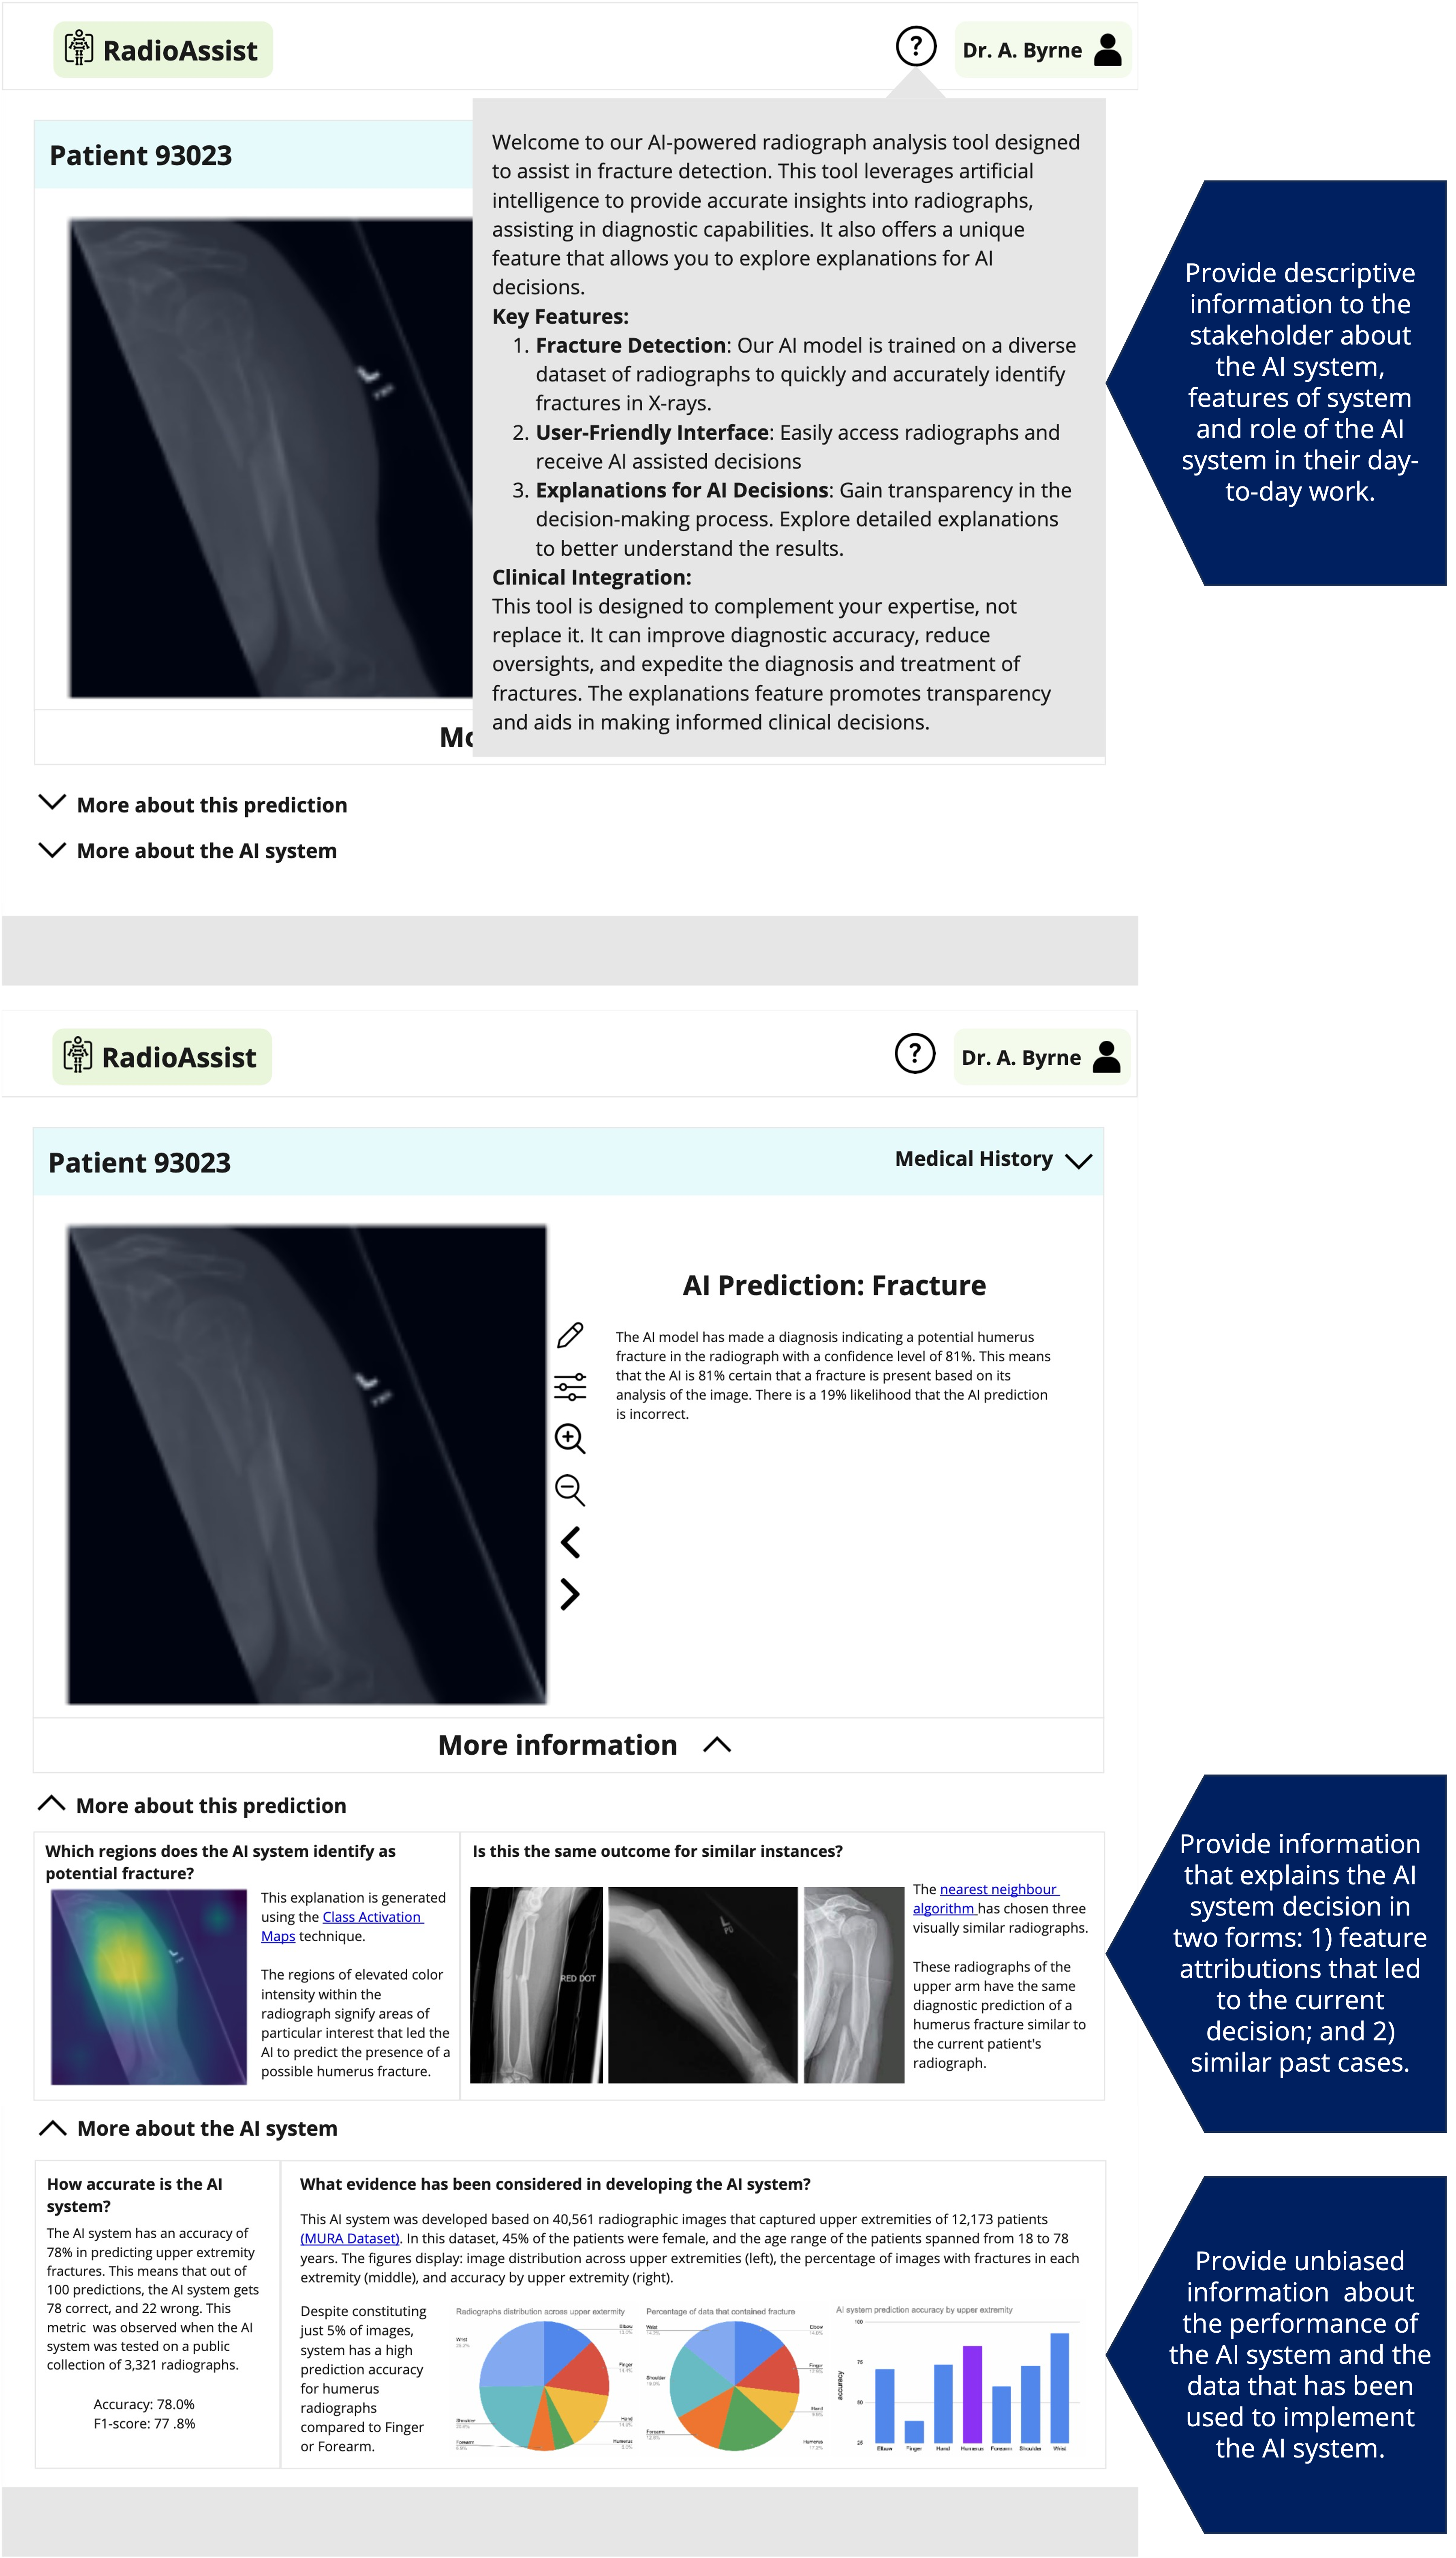
RadioAssist AI platform is a desktop application, used by the local hospital to support clinicians in their clinical decision-making processes. An AI system predicts the presence of fracture in Radiographs and explains its decisions to the clinicians. A non-interactive preview of the experience is presented in Figure 4.
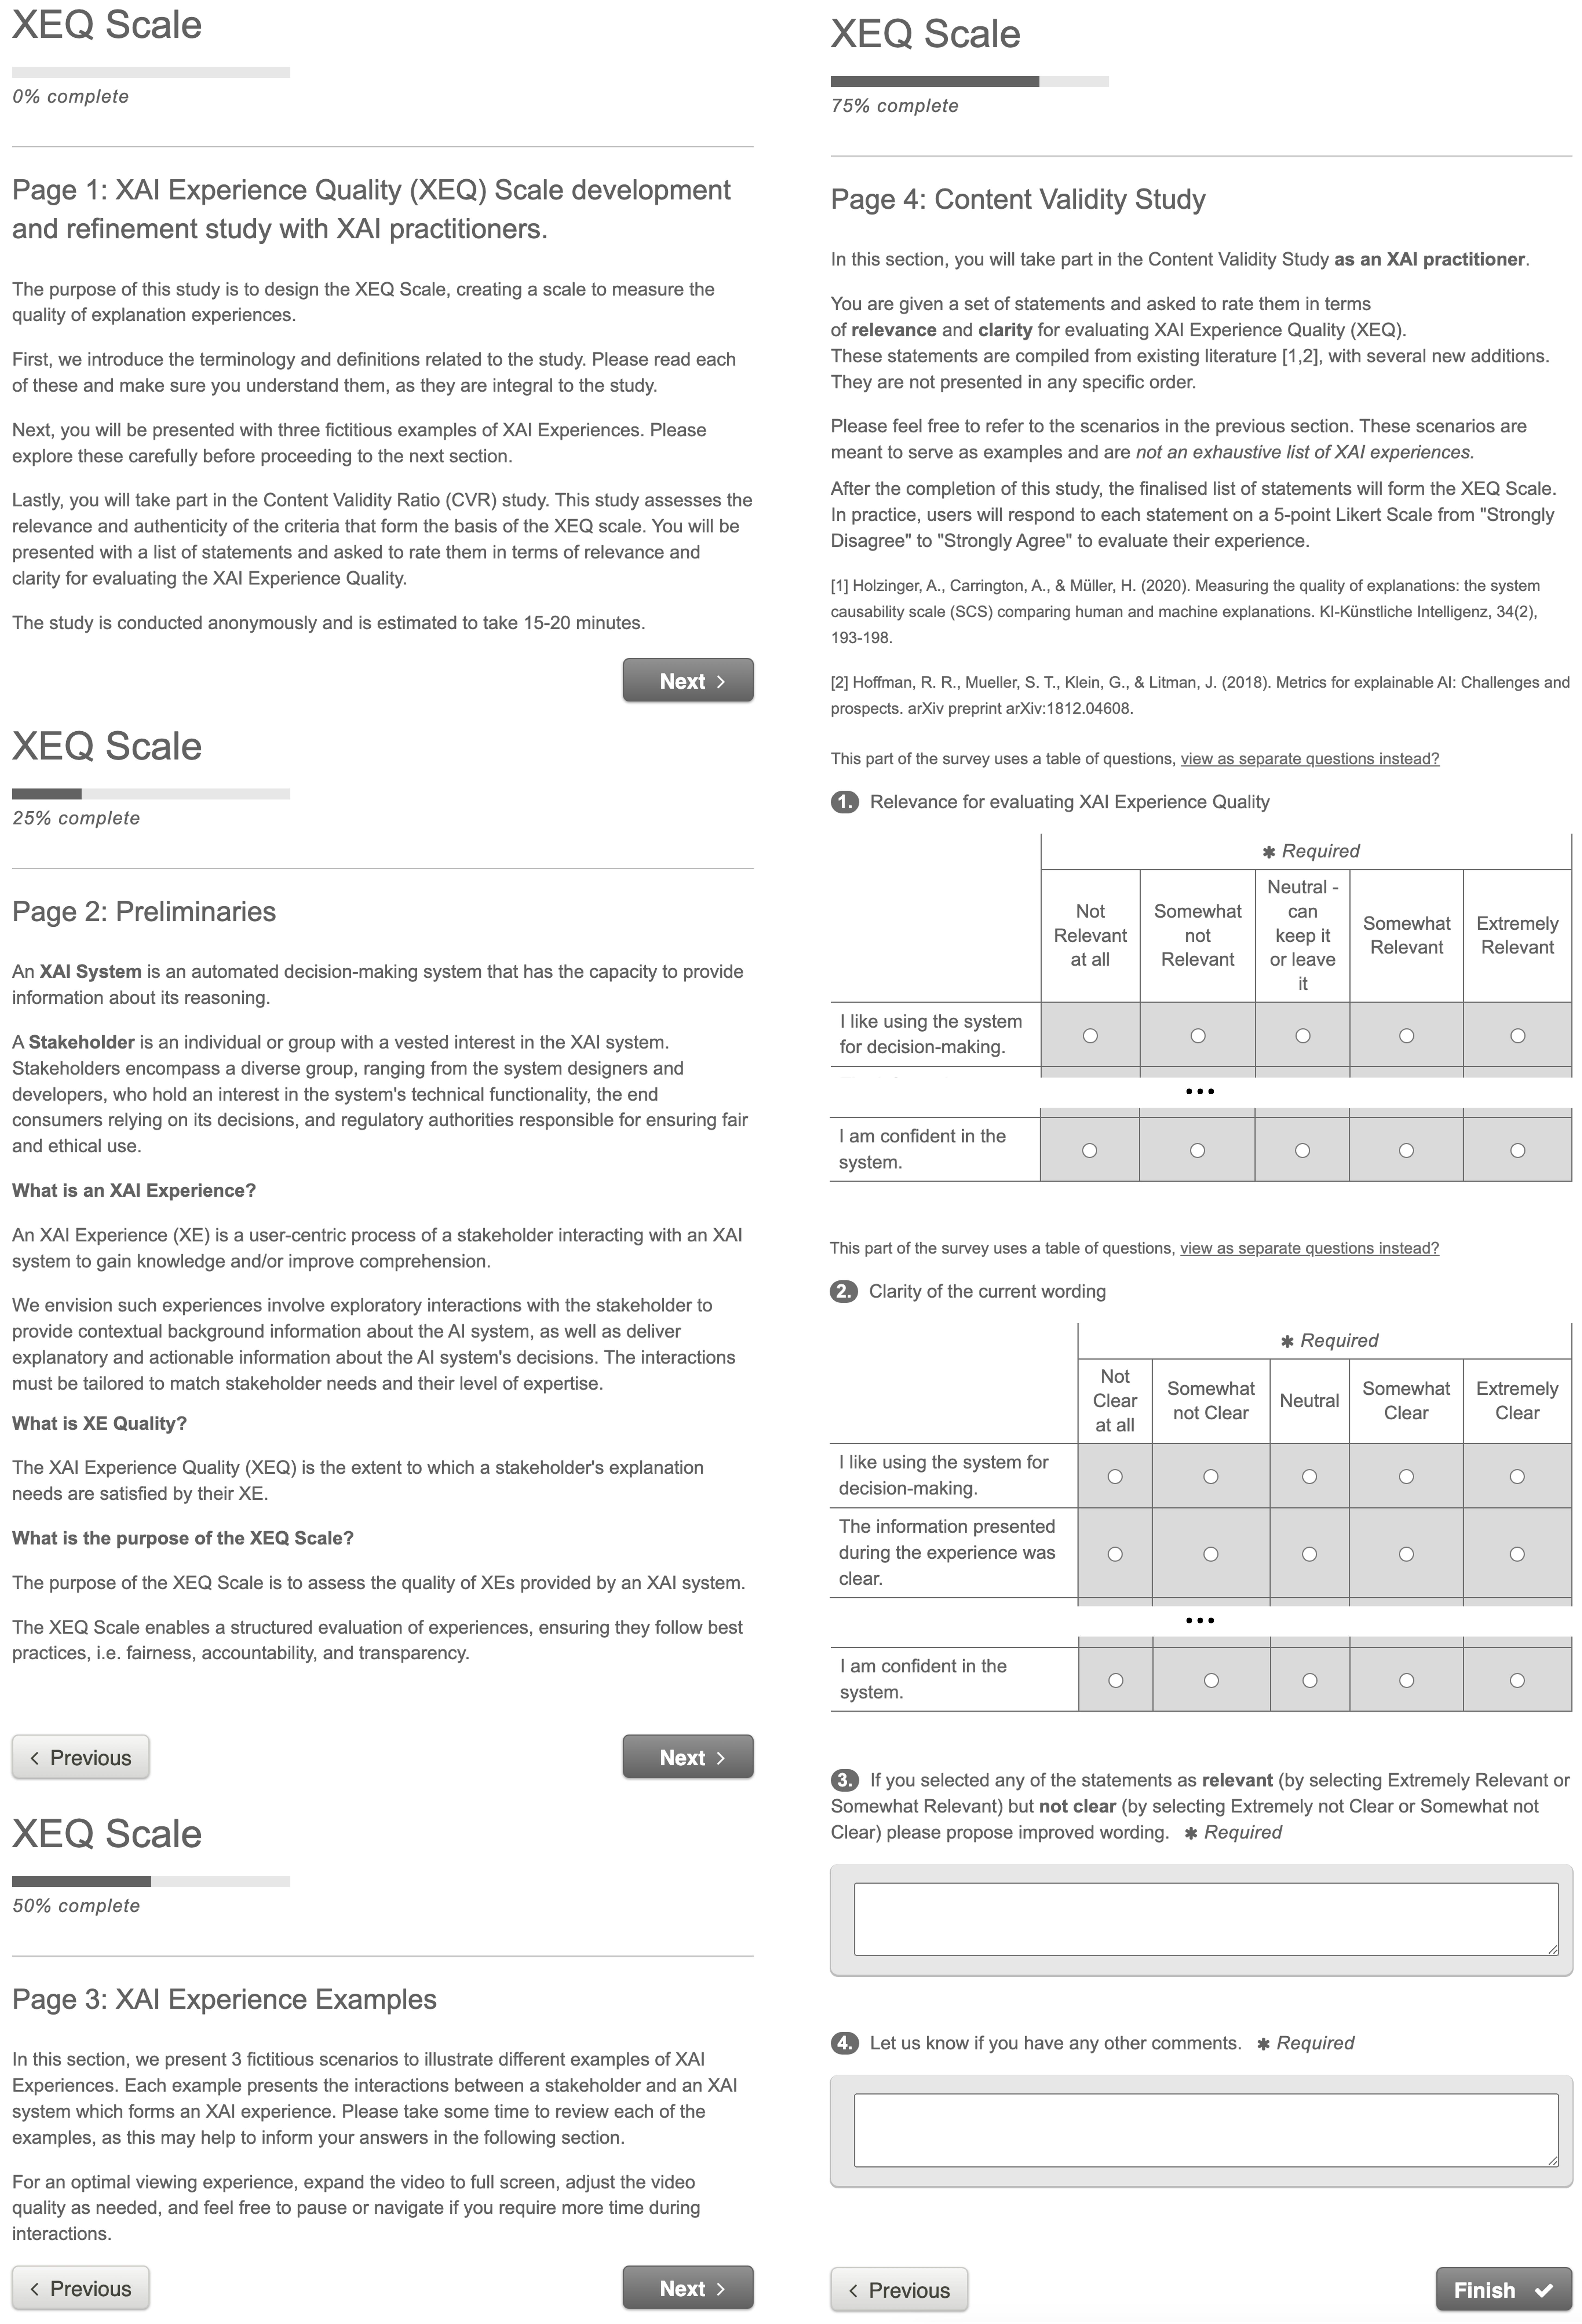
Both Figures 4 and 3 are annotated with notes that describe the XAI features that were available to the stakeholder. Finally, Figure 5 presents a preview of the Study page.
7.3 Pilot Study
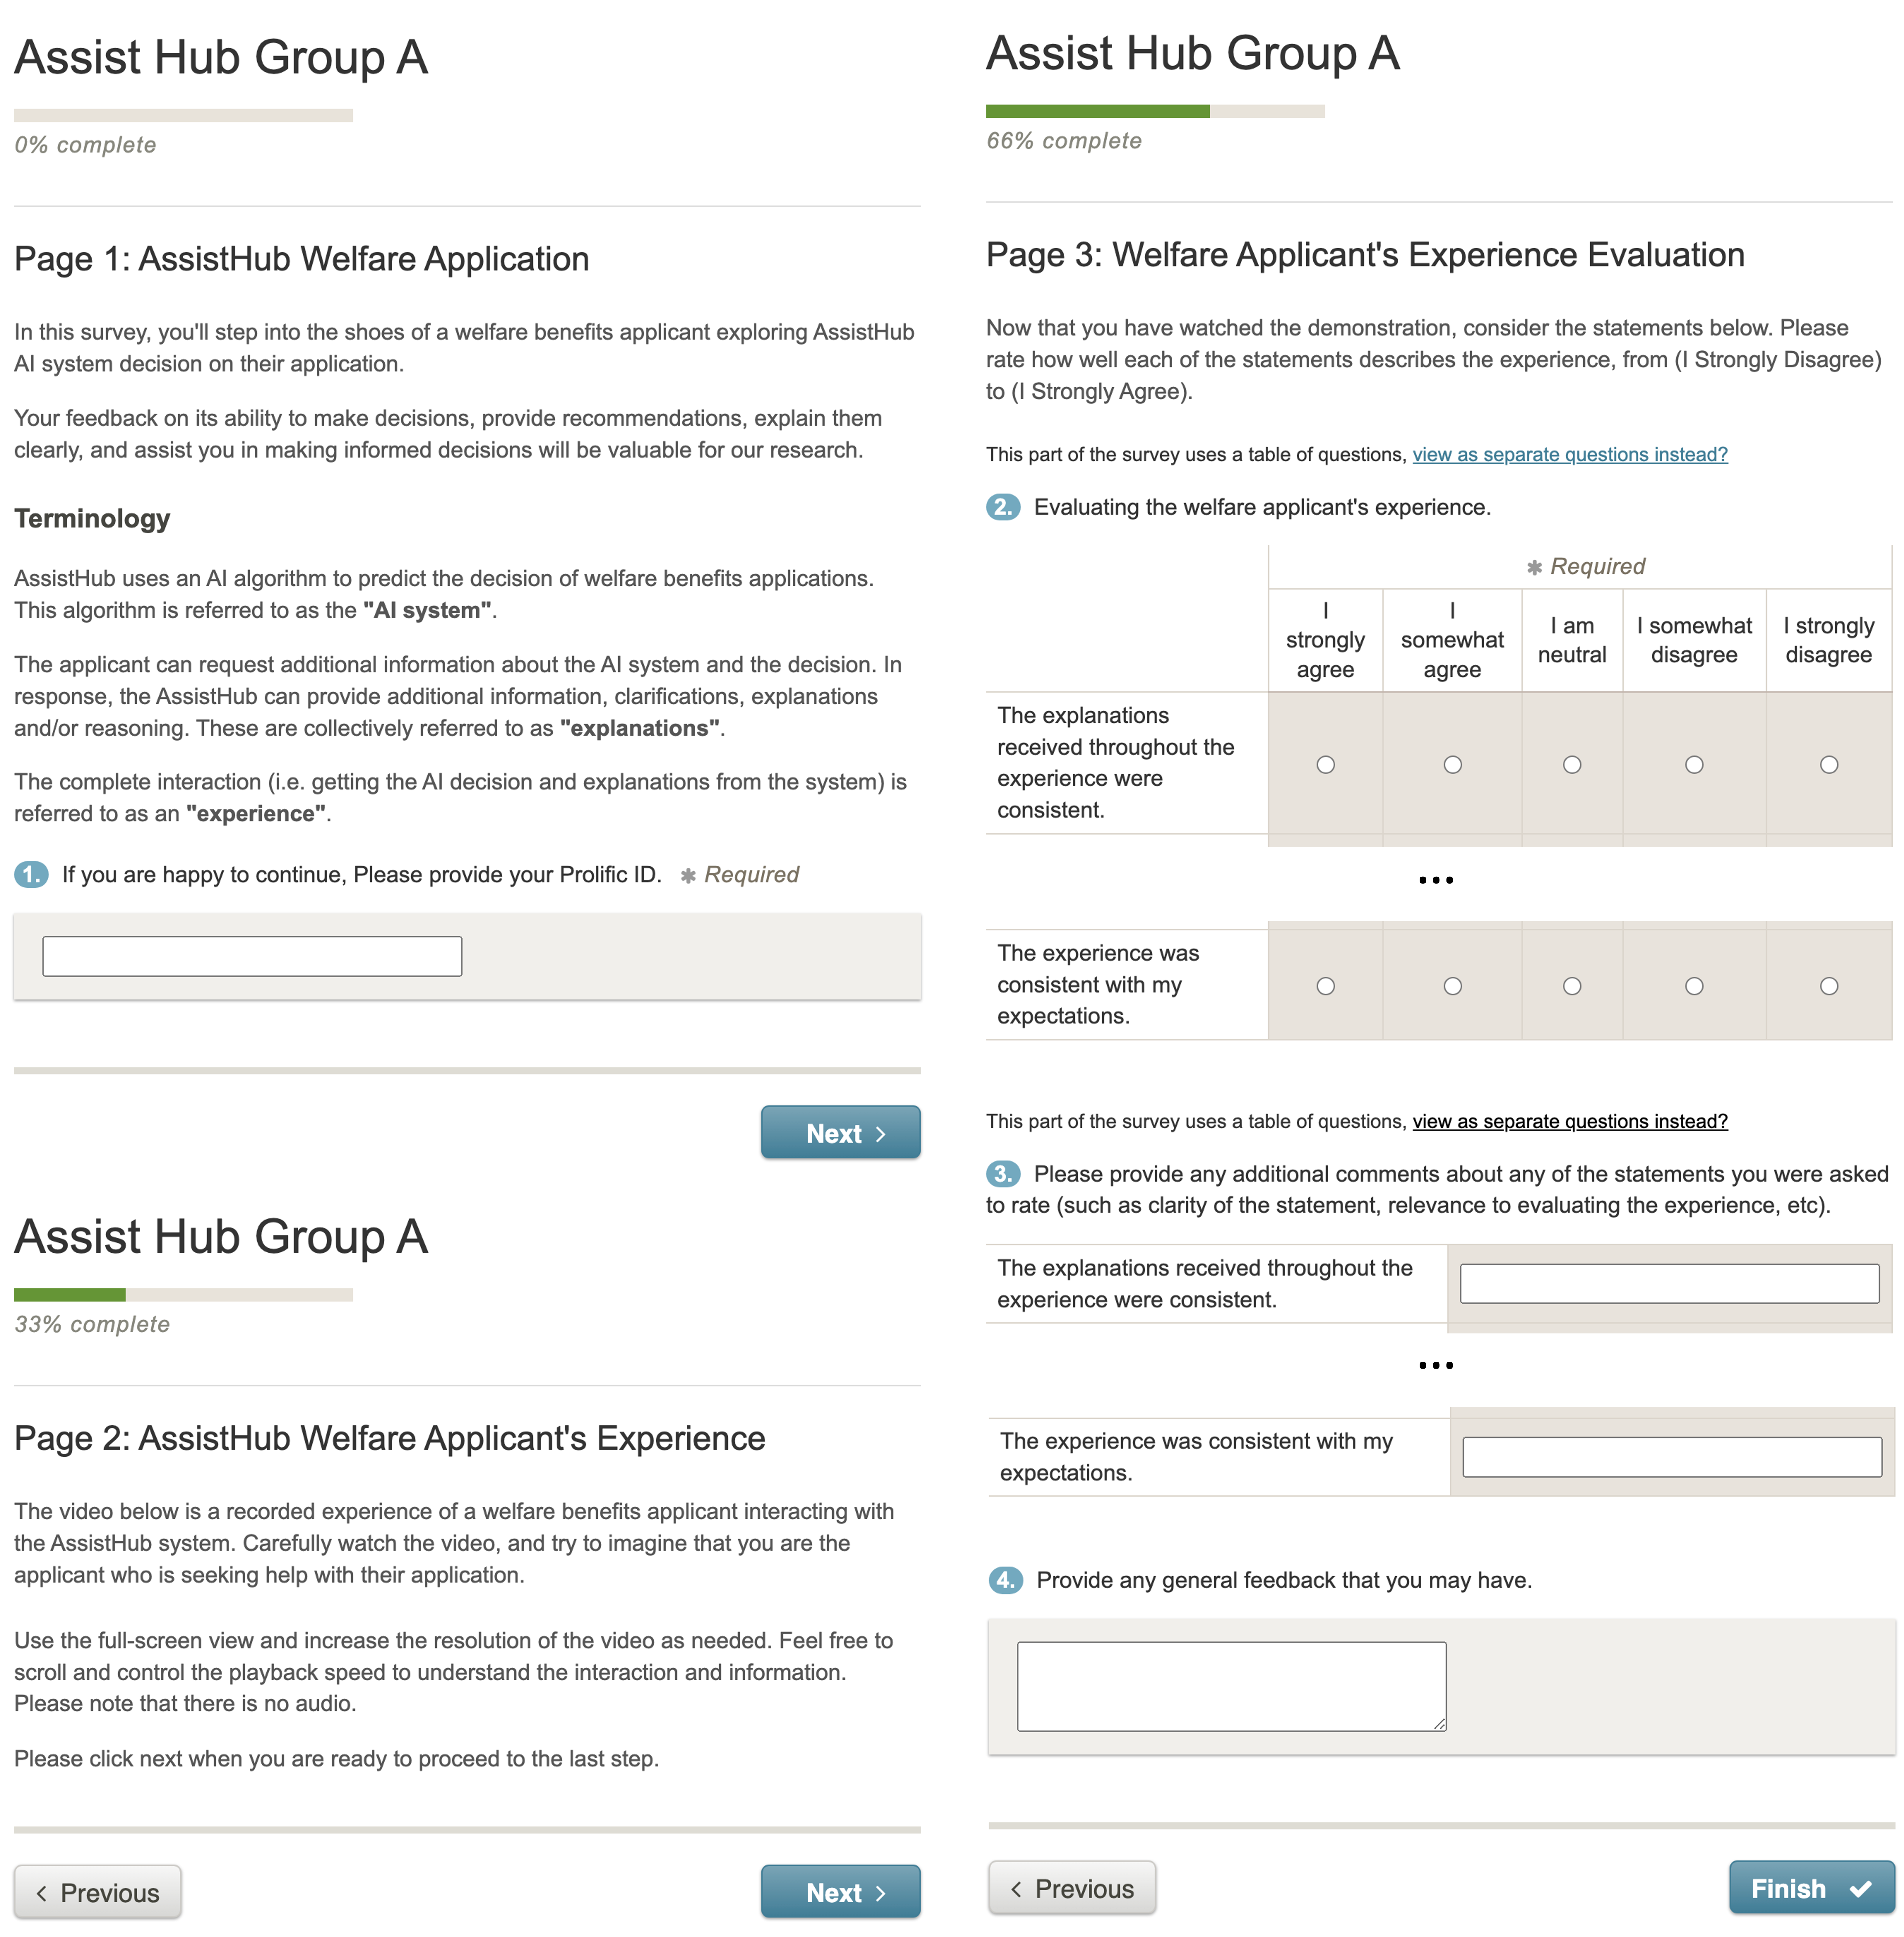
A pilot study was conducted with 203 participants over two application domains where they evaluated either a positive or negative XAI experience. In addition to the CourseAssist chatbot examples provided in the paper, we included two XAI experiences of welfare applicants interacting with the AssistHub AI platform (see Figures 6 and 7). Notes refer to how different aspects of the explanations can lead to a positive or negative XAI experience. Similar to the previous study, all XAI experiences were available to participants in video format. Finally Figure 8 presents a preview of the Pilot study where pages 1 and 2 were customised based on the application participants were assigned to.
