Wearable Healthcare Devices for Monitoring Stress and Attention Level in Workplace Environments
Abstract.
Wearable devices have revolutionized healthcare monitoring, allowing us to track physiological conditions without disrupting daily routines. Whereas monitoring physical health and physical activities have been widely studied, their application and impact on mental health are significantly understudied. This work reviews the state-of-the-art, focusing on stress and concentration levels. These two can play an important role in workplace humanization. For instance, they can guide breaks in high-pressure workplaces, indicating when and how long to take. Those are important to avoid overwork and burn-out, harming employees and employers. To this end, it is necessary to study which sensors can accurately determine stress and attention levels, considering that they should not interfere with their activities and be comfortable to wear. From the software point of view, it is helpful to know the capabilities and performance of various algorithms, especially for uncontrolled workplace environments. This work aims to research, review, and compare commercially available non-intrusive measurement devices, which can be worn during the day and possibly integrated with healthcare systems for stress and concentration assessment. We analyze the performance of various algorithms used for stress and concentration level assessment and discuss future paths for reliable detection of these two parameters.
1. INTRODUCTION
Many breakthroughs in electronics, information, and communication technology, particularly Wearable Health-care Systems (WHS), have provided us with unprecedented access to physiological information. WHSs are used in many applications, such as well-being and sports activities (Perego et al., 2018; Yin et al., 2018; Perego et al., 2021), physical health (Götzinger et al., 2016; Anzanpour et al., 2017; Pollreisz and TaheriNejad, 2020b; TaheriNejad and Rahmati, 2020; Freismuth and TaheriNejad, 2022), and mental health (TaheriNejad and Pollreisz, 2016; TaheriNejad et al., 2016; Pollreisz and TaheriNejad, 2017; Freismuth and TaheriNejad, 2022; Jahanjoo et al., 2024). These systems promise to revolutionize various facets of our society by generating an exceptional understanding of humans and their bodies. There are many different devices for monitoring and collecting our biosignals (Garmin, 2023a; Empatica, 2023a; InteraXon, 2023a). Therefore, it is important to know which one(s) to use for a given task. Many devices that produce the highest data quality are uncomfortable to wear on a daily basis, intervene with daily activities, or severely invade the users’ privacy (TaheriNejad, 2020; Anzanpour et al., 2017; Sadek et al., 2018). Others that may be easy to use do not necessarily provide the information, accuracy, or reliability desired or expected from them.
To understand the potentials of WHSs for a specific purpose or select a WHS for a particular purpose, sensors (hardware) and algorithms (software) of such systems should be studied. The sensors and algorithms, however, can only be studied in their context and intended applications. Given that studying the entire range of various applications, usage context, and monitoring parameters in a single study is not realistic, we narrow down our focus. Here, we consider wearable healthcare in the context of work environments, primarily that of rapidly growing digital work environments. In such an environment, two physiological parameters stand out. One is the concentration that is connected to efficiency and even the quality of the work. Both employers and employees may be interested in monitoring concentration to improve productivity. However, this may lead to excessive stress, negatively affect employees’ health, and consequently degrade productivity, the same factor that was the improvement target. There may be many other factors that can lead to excessive stress in the work environment and lead to unintended consequences for both employees and employers. Therefore, another important parameter that we consider in this paper is stress level assessment.
Choosing and combining the correct physiological variables plays a significant role in measuring mental workload, which often correlates with stress and attention levels. Having the necessary biomedical sensors for respective physiological parameters is not enough, as interactions of subjects with the environment often limit their accuracy. Therefore, additional methods and sensors for countering such negative effects are needed, e.g., acceleration measurements for removing movement artifacts. Implementing complex algorithms countering the loss of precision may seem intuitive at first; however, there is a compromise to consider since they require processing resources (and thus may slow down the system) and decrease battery life (Hogervorst et al., 2014; TaheriNejad, 2019; Shakibhamedan et al., 2024).
Another compromise to consider is that of desired accuracy and the cost of having specialized sensors associated with each of the physiological parameters one desires to monitor. This associated cost is not only monetary but also includes considerations of mechanical aspects such as adding more sensors (space, weight, looks, ease of use) and electrical aspects (additional power consumption). Consequently, using sensors from which multiple vital signs can be (indirectly) extracted is a common technique. This means that using just one sensor, multiple physiological parameters are measured. However, such methods may suffer from lower accuracy or be more prone to interference. Although, sometimes, the extracted signs can be jointly considered to achieve higher accuracy (Götzinger et al., 2019). Most commercial devices already feature a set of sensors, which makes many combinations possible, although finding the best ones is often very difficult (Pollreisz and Nejad, 2020; Hogervorst et al., 2014). Moreover, smart techniques for data collection may be used to decrease the power consumption of data collection from each sensor (TaheriNejad et al., 2017; Hadizadeh et al., 2020; Hafshejani et al., 2021), allowing for more sensors from the power budget (battery capacity) point of view.
Given that in the work environment, wearable devices should be non-intrusive (not to interrupt routine work procedures). As comfortable as possible, we narrowed down the scope of this survey to wrist-worn devices (smartwatches), smart rings, and headbands. We note that there are other devices that could theoretically fit these needs. However, they are either in a maturing phase and not very common (no or too few options available commercially) or not as easy to use, change, or charge in the work environment (e.g., chest straps). Most modern wearable healthcare devices feature a specific set of sensors, explained by the limitations mentioned above. In wrist-worn devices, those are Photoplethysmogram (PPG) sensors and accelerometers. PPG sensors measure reflected light from a light source on the skin. Different wavelengths are often used simultaneously to extract multiple physiological parameters and/or more reliable readings. Only a few commercial wearable health monitoring devices embed additional sensors such as temperature or skin conductance (Dias and Cunha, 2018). For head-worn devices, Electroencephalogram (EEG) is the most prominent sensor used to measure and record brain activity. EEG sensors measure differences (voltage differences) at the scalp produced by electrical currents generated via neural activities in the brain. Newer devices are equipped with accelerometers that enable researchers to calculate movement and balance during health monitoring (Ltd, 2023; InteraXon, 2023a, b). PPG sensors are only implemented in several of them (Dias and Cunha, 2018; TaheriNejad, 2019).
Due to the necessary certifications of devices used outside laboratory environments, only commercially available products can be used for work environments. All modern wearable devices offer wireless data transmission to other devices, such as mobile phones and computers, or can directly upload data onto a server. Extracting raw data from these devices is not always possible, and the manufacturer sometimes limits it. Unofficial extraction tools may be an option in the short term but may be rendered unusable at any time due to a software update on the device. Extensive studies have been done concerning the validity of measured data from those devices. If the desired metrics can be reliably obtained through uncomplicated algorithms, their usability increases (Sawangjai et al., 2020; Pollreisz and Taherinejad, 2019).
The rest of this paper is organized as follows: In Section 2, we present currently available commercial devices, their sensors, and key features. We review various applications in Section 3 with a comprehensive investigation of stress and attention detection, which are the primary subjects of this survey. We discuss our findings in Section 4 before concluding the paper in Section 5.
2. Wearable devices
Even though many different devices are available, most of them focus on just a few wearing positions. Due to physiological constraints, EEG measuring devices are head-worn. PPG sensors are usually wrist-worn due to their almost independent measurement position in combination with the uncomplicated and unobtrusive integration into smartwatches. This has been shown to decrease the quality of data but is by far the most popular choice for commercial manufacturers (Umair et al., 2021; Ghamari, 2018; Sawangjai et al., 2020).
EEG combined with other physiological sensor data has proven to be a good match (89% accuracy) for distinguishing between high and low workloads. The option of combining EEG with eye data would have slightly higher accuracy (91% accuracy) (Hogervorst et al., 2014) but can not be used in a workplace environment due to privacy concerns.
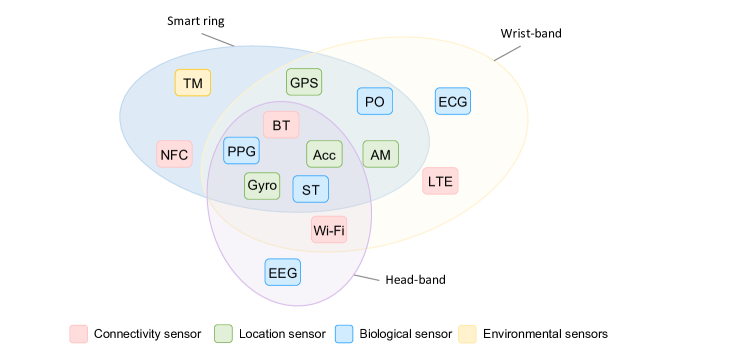
In Figure 1, we present a schematic representation of the sensor distribution across categories of common devices. Each category is denoted by a distinct color, highlighting the specific sensors employed. Notably, there is overlap in sensor usage among several devices, indicating shared functionality and potential synergy in data collection.
In light of these constraints and popular choices, wearable devices hold tremendous promise in healthcare systems. Their capacity for continuous monitoring of vital signs and real-time data collection makes them a focal point of interest for enhancing patient care. By exploring their integration in healthcare, we aim to explore various wearable devices and their potential for enhancing healthcare efficiency by utilizing their data.
2.1. Head-worn devices
Head-worn devices are mainly used for EEG measurements. Modern head-worn devices include acceleration sensors to remove motion artifacts and sometimes additional sensors like PPG or temperature sensor (InteraXon, 2023b; Ltd, 2023; InteraXon, 2023a). For a clean EEG recording, the signals need to be filtered, and manual artifact removal is usually performed. The filtered signal can be transformed from the time domain into the frequency domain via Fast Fourier Transformation (FFT), which is essential for categorization, where certain frequency bands have been traditionally defined and used to classify the signal (Khooyooz and Sardouie, 2022). As shown in Table 1, those spectrums directly correlate to stress and attention levels and are therefore a key indicator (Başar et al., 2001; Nyein Chan et al., 2021; Gaikwad and Paithane, 2017). In the rest of this subsection, we briefly review major (commercially available) devices, their specifications, capabilities, and sensors. Table 2 shows a summary of modern head-worn EEG devices.
| Signal | Frequency [Hz] | Activity |
|---|---|---|
| Delta | <4 | Increases during difficult conditions |
| Theta | 4-8 | Increases during stress |
| Alpha | 8-12 | Decreases during stress |
| Beta | 13-31 | Varies according to task difficulty |
| Gamma | >31 | Increases during meditation |
2.1.1. Neeuro SenzeBand
The SenzeBand 2, released in 2021, offers seven EEG channels. Two out of the seven sensors are located on the forehead, and two are temporal lobe sensors. It can be used on dry skin, providing a battery lifespan of up to 6 hours. Additionally, a PPG and 9-axis motion sensor is built into the unit. There is a dedicated Software Development Kit (SDK) for raw data extraction and analysis provided by the manufacturer (Ltd, 2023; Sawangjai et al., 2020).
2.1.2. Emotiv EPOC X
Due to the popularity of their predecessor product EPOC+, Emotiv offers the EPOC X a 14-channel EEG headset. The devices from Emotiv have the highest proportion of publications and a significant market share. By using wet electrodes, the device offers a better signal quality than dry electrodes; however, this makes the headband more complicated to use in daily and work environments. Users have expressed problems with wearing the headset over a longer period since the device offers no adjustability for different head sizes. The internal 9-axis motion sensor and EEG data can be extracted via a paid toolkit from Emotiv or unofficial extraction tools (Emotiv, 2023; Sawangjai et al., 2020).
2.1.3. OpenBCI Cyton EEG Headband
With each element being individually sold, the OpenBCI headband offers an open-source alternative to other manufacturers. There are four channels of EEG, Electrocardiography (ECG), Electromyography (EMG), which is the recording of electric signals generated during muscle movements (Xiong et al., 2021) and a 3-axis accelerometer on the board, which can be used for movement measurements. Depending on the headset used with it, it can be used with both dry and wet electrodes. Unfortunately, the device has no certifications and is, therefore, unsuitable for out-of-lab applications (OpenBCI, 2023; Sawangjai et al., 2020).
2.1.4. Neurosky MindWave Mobile 2
Neurosky is one of the oldest consumer-grade EEG measurement device manufacturers. The MindWave Mobile 2 features one dry electrode and no additional sensors. Its automatic blink detection and EEG frequency range output offer simple analysis, validated in many studies. There is an SDK for the EEG data to be output in a raw format or processed data as attention and meditation level. Underwent validation studies, particularly study by Maskeliunas et al. (Maskeliunas et al., 2016) the study evaluated attention and meditation calculated by MindWave devices, achieving only 22% accuracy in distinguishing between focusing and relaxing subjects. While the algorithm showed limitations in separating these states, it may still have utility in assessing task difficulty or cognitive demand in specific contexts (Neurosky, 2023; Sawangjai et al., 2020).
2.1.5. InteraXon Muse
Both devices made by Muse feature four EEG channels and can be easily worn thanks to their dry electrodes. The newest model “Muse S (Gen 2)” was released in 2021 and has a longer battery life of 10 hours compared to the 5 hours from the older “Muse 2”. Both models feature identical EEG sensors and positions and also include a PPG sensor, accelerometer, and gyroscope. Access to newer versions of the SDK was restricted by the company since it is not an open-source SDK for everyone. Consequently, the process of considering and approving requests for access to the SDK may take a significant amount of time. (Sawangjai et al., 2020; InteraXon, 2023a, b, c).
2.1.6. Macrotellect BrainLink
Macrotellect Company provides BrainLink headbands in three models. EEG sensors for all three models collect data with the same frequency. BrainLink Light has only one EEG sensor, whereas BrainLink Dual features two EEG sensors. The features that distinguish BrainLink Pro from the other two models are that BrainLink Pro can measure heart parameters with a PPG sensor, and it also has a temperature sensor. Macrotellect also provides an SDK for all three models, and raw data can be easily accessible besides some other parameters such as meditation and attention level, which their library computes (Macrotellect, 2023a, b).
| Device | EEG channel | Other sensors | Battery life[Hour] | Wireless connection | Raw data access |
|---|---|---|---|---|---|
| SenzeBand 2 (Ltd, 2023) | 7 (250Hz) | PPG,9-axis Accelerometer | 6 | Bluetooth 5.0 | Yes |
| Emotiv EPOC X (Emotiv, 2023) | 14 (2048Hz) | 9-axis Accelerometer | 6 | Bluetooth 5.0 | Yes |
| Muse 2 (InteraXon, 2023a) | 4 (256Hz) | PPG,3-axis Accelerometer | 5 | Bluetooth 4.2 | Yes |
| OpenBCI Cyton EEG Headband (OpenBCI, 2023) | Customizable(250Hz) | EMG, ECG, 3-axis Accelerometer | - | WiFi | Yes |
| Neurosky MindWave Mobile 2 (Neurosky, 2023) | 1 (512Hz) | - | 6-8 | BT/BLE | Yes |
| Muse S (InteraXon, 2023b) | 4 (256Hz) | PPG, 3-axis Accelerometer | 10 | Bluetooth 4.2 | Yes |
| BrainLink Pro (Macrotellect, 2023b) | 1 (512Hz) | PPG, Temperature | 3-4 | Bluetooth 4.0 | Yes |
2.2. Wrist-worn devices
As low-cost smartwatches become more accessible, their built-in sensors are being utilized more frequently. PPG and acceleration sensors are built into most of them, which present a variety of physiological vital signs. There are many vital signs which can be derived from those sensors. Most commonly, these are pulse oxymetry readings (Shamir et al., 1999), respiratory rate (Pollreisz and TaheriNejad, 2020a, b), blood pressure (TaheriNejad and Rahmati, 2020) and heart rate, but also arterial stiffness or hypo- and hypervolemia can be deduced (Ghamari, 2018; TaheriNejad, 2019). Emotion recognition can also be done using these sensors (TaheriNejad and Pollreisz, 2016; Pollreisz and TaheriNejad, 2017). There are even reports for emotion recognition solely on accelerometer data with fair accuracy (Zhang et al., 2016; Garcia-Ceja et al., 2015). A combination of head-worn and wrist-worn acceleration data may yield even better results. Furthermore, wrist-bands’ battery lifetime is an essential parameter in especially long-time studies where researchers compared common wrist-band (González-Cañete and Casilari, 2021).
Accelerometer data can be used to reduce movement artifacts, especially when the frequency of interest is close to the error frequency. Additionally, there are statistical algorithms that demonstrate a great improvement in accuracy (Pollreisz and Taherinejad, 2019). In the rest of this subsection, we provide a brief overview of prominent devices that are commercially accessible, along with their specifications, capabilities, and sensors. Table 3 shows a summary of modern wrist-worn devices.
2.2.1. Empatica
Aimed directly at researchers, both Empatica E4 and EmbracePlus are certified vital sign monitoring devices. Therefore, E4, as the old product, does not have a built-in display, which brings its battery life up to over 32 hours of continuous measurements (Empatica, 2023a). Empatica has integrated a display into EmbracePlus by improving battery consumption, making this device more user-friendly. Both devices have a PPG sensor, an Electrodermal Activity (EDA) sensor, a temperature sensor, and an accelerometer. Raw data can be downloaded from the device whose validity has been researched and confirmed (Schuurmans et al., 2020). Empatica offers a commercial version of their watch focusing on remote, medical-grade monitoring of epilepsy patients. Using an Android SDK provided by Empatica, it is possible to receive raw data in real-time from the E4 wrist-band. In order to access data collected by Embrace, Empatica provides them on Amazon S3 servers(Empatica, 2023b).
2.2.2. Apple Watch Series 4
The Apple Watch 4 is the only device to measure electrical heart activities. The sensors include PPG, acceleration, a gyroscope, and a barometer. The device is more accurate than other comparable products in heart rate measurements. Direct data access is impossible; the manufacturer has no official SDK. This makes it difficult to implement custom analysis tools or connect the watch to other devices (Choksatchawathi et al., 2020; Apple, 2023).
2.2.3. Polar OH1
The Polar OH1 can be worn on the lower or upper arm, where its integrated PPG and acceleration sensors can save up to 12 hours of continuous measurements. Raw and processed data can be extracted from the device using an open source SDK provided by Polar (Polar, 2024). This device does not feature a display as its intended use is with a secondary device for interfacing (Umair et al., 2021; Polar, 2023).
2.2.4. Mobovi TicWatch Pro
While also featuring a PPG, acceleration, gyroscope sensor, and a barometer, the TicWatch Pro manufacturer Mobovi offers support for custom data extraction tools. The device has been used in multiple publications and can have 4-8 hours of battery life while doing measurements (Choksatchawathi et al., 2020; Mobvoi, 2023; González-Cañete and Casilari, 2021).
2.2.5. Garmin tactix® Charlie
Garmin produces many smartwatches with different categories as commercial products. One model of these products is tactix Charlie, which has PPG, Global Positioning System (GPS), acceleration, and temperature sensor. Providing Garmin Health Companion SDK by Garmin to access real-time data caused the use of Garmin in research. However, this SDK only provides processed heart rate from PPG sensor that is not suitable for researchers that need raw PPG data in their research (de Vries et al., 2023; Garmin, 2023b).
2.2.6. Fitbit
Fitbit manufactures many smartwatches and trackers since 2009, introducing popular models such as Inspire, Versa, and the Charge series. Their battery lives range from 6 to 10 days. The Fitbit Charge 6 series features sensors for various health metrics, including PPG, ECG, EDA, SpO2 monitoring, as well as acceleration, ambient light, and GPS. Whereas processed data can be extracted using the Application Programming Interface (API), direct access to raw data is not possible (Fitbit, 2024).
| Device | PPG sampling rate [Hz] | Accelerometer | Other sensors | Wireless connection | Raw data access |
|---|---|---|---|---|---|
| Empatica E4 (Empatica, 2023a) | 64 | X | Temperature, Electrodermal Activity | BT | Yes* |
| EmbracePlus (Empatica, 2023b) | 64 | X | Temperature, Electrodermal Activity | BT | Yes** |
| Apple Watch Series 4 (Apple, 2023) | - | X | Barometer, GPS, electrical heart sensor | BT, LTE, Wi-Fi | No |
| Polar OH1 (Polar, 2023) | - | X | - | BT | Yes |
| Mobvoi TicWatch Pro 3 Ultra GPS (Mobovi, 2023) | 100 | X | SpO2, Barometer, GPS | BT, Wi-Fi | Yes |
| Garmin tactix® Charlie (Garmin, 2023a) | - | X | GPS, Temperature | BT, Wi-Fi | No |
| Fitbit (Fitbit, 2024) | - | X | ECG, SpO2, GPS, Ambient Light | BT | No |
-
•
* As of late 2023, Empatica plans to shut down E4 wristband on August 2024.
-
•
** Raw data are not available in real-time, but can be exported from Empatica cloud server.
2.3. Finger-worn devices
With the advancement of science and electronic components, the size of sensors has decreased, and they can be embedded in the smallest wearable devices. In this way, smart rings equipped with various sensors have been produced and are available to everyone to receive vital signs and monitor their health. Smart rings like smartwatches can be employed to perform mid or long-term health monitoring because they are easy to use.
One of the advantages of this wearable device is that it can be easily used everywhere with its beautiful design, long battery life, and waterproofness. However, users can download the processed data from the cloud. For none of the following finger-worn devices is access to raw data possible (oura team, 2023; Motiv, 2023; SkyLabs, 2023a). Table 4 shows a summary of modern finger-worn devices.
2.3.1. Oura ring
One of the smart rings introduced in 2015, now with its third generation available in the market, is called Oura. Having a 3D accelerometer, SPO2, temperature, and PPG sensors has given this smart ring many capabilities. Owing to these capabilities and having a strong battery that, on average, a fully charged ring will last 4-7 days, the researchers were attracted to use this smart ring in their research. One of the applications for which researchers have used the ring is sleep monitoring. It can be used to find total sleep time and sleep efficiency. In addition, with temperature sensors, researchers used the Oura ring for fever monitoring. There is a dedicated SDK for processed data extraction and analysis from the manufacturer (oura team, 2023; Mehrabadi et al., 2020; Smarr et al., 2020).
2.3.2. Motiv
Motiv ring is a ring designed for monitoring daily activities and also monitoring sleep. With this feature, users can look at their sleep duration and metrics like sleep restlessness and resting heart rate through the Motiv app. These features exist because a 3-axis accelerometer and a PPG sensor are embedded in the Motiv ring. Researchers use this ring to process heart rate during trail running by having these abilities (Navalta et al., 2020).
2.3.3. CardioTracker (CART)
CART utilizes PPG sensor data for the purpose of heart rate measurement and to identify Atrial Fibrillation (AF) or its burden, and Electrocardiogram (ECG) signals to offer supplementary information to doctors. The lack of an accelerometer sensor in this ring shows that the manufacturer just focused on detecting heart diseases and no more. Researchers evaluated the diagnostic performance of the CART ring, and it detected AF using deep learning analysis of PPG signals (Kwon et al., 2020).
2.4. Chest-worn devices
Another category of wearable devices capable of assessing heart variability and consequently determining stress levels, along with other potential applications, includes chest-worn gadgets. These devices mostly feature ECG sensors designed for heart rate monitoring. Examples of chest bands incorporating ECG sensor are the Polar OH10 (SkyLabs, 2023c) and Garmin HRM Dual (SkyLabs, 2023b).
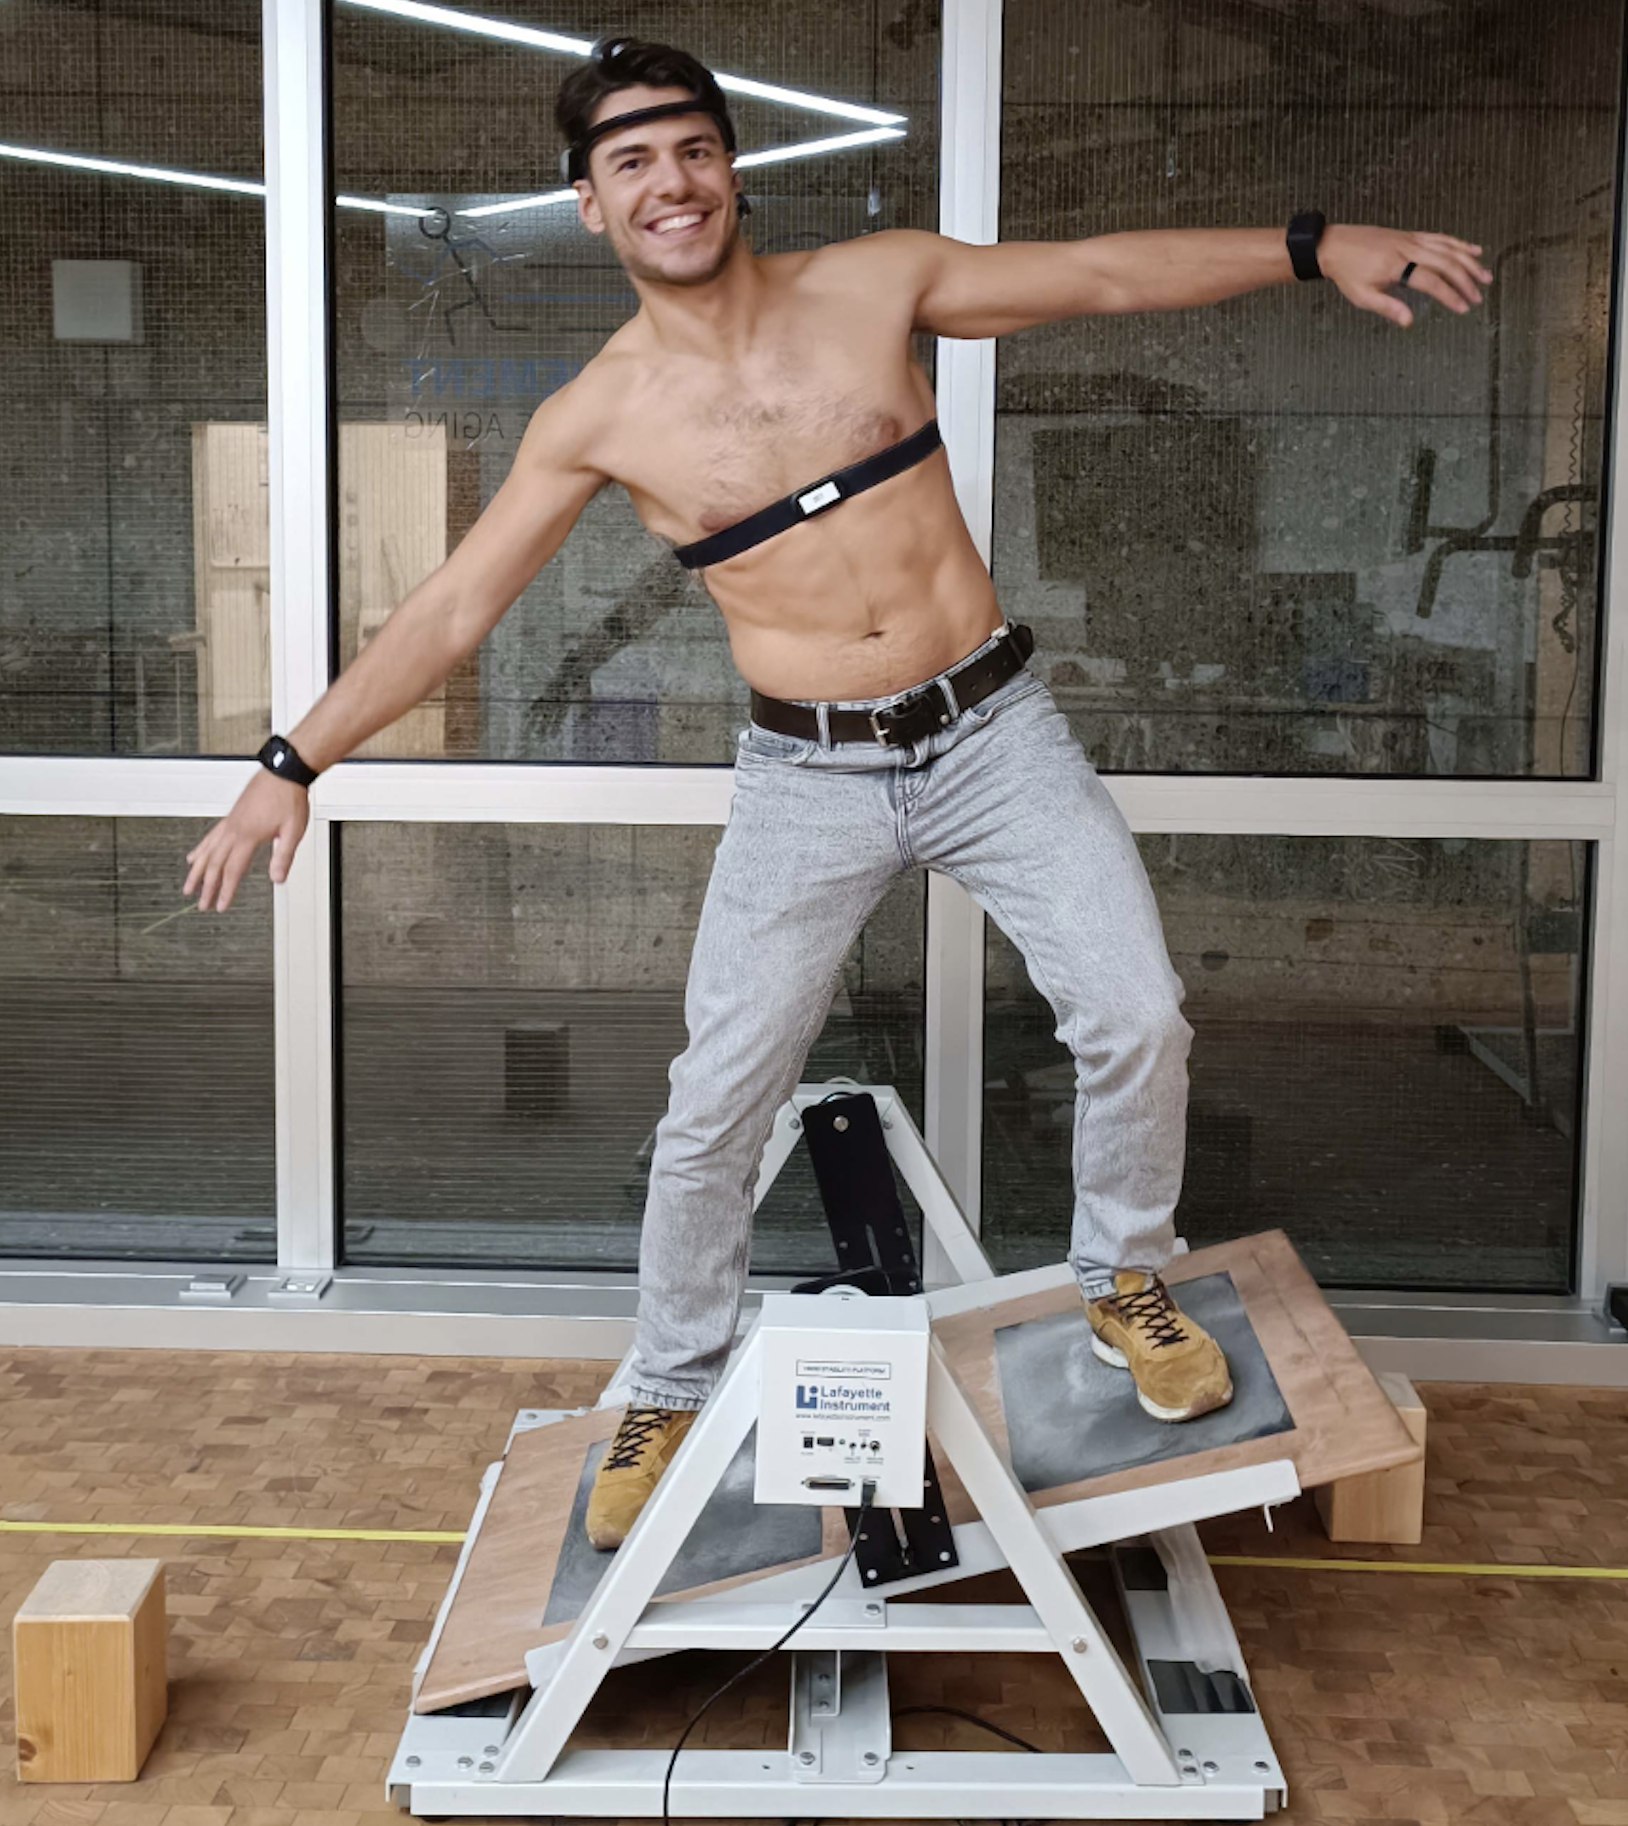
Although some chest-worn devices are used to measure heart rate, extracting data from those has proved very difficult. Additionally, wearing a chest belt can be annoying to the employee and has been reported to be inconvenient to wear and reduce mobility. On the contrary, chest-worn devices do not yield notably improved results compared to wrist-worn devices, such as in stress detection, which is one of the applications of these health monitoring devices(Pinge et al., 2022). Therefore, this type of device is of minor practical relevance (Choksatchawathi et al., 2020; Lin and Van Helleptte, 2021). A photo depicting a subject engaged in stability activities for a stress detection study is depicted in Figure 2, showcasing the subject wearing various wearable healthcare devices.111 This photo was taken with the permission of the subject at the Sport and Sports Sciences Institute (ISSW) of Heidelberg University.
3. Applications
Raw signal data lacks meaning on its own. In order to grasp the significance of sensor data, processing is essential. Initial processing transforms raw data into meaningful, vital signs like heart rate, blood pressure, or generally Early Warning Score (EWS), which is a medical appliance used to evaluate a patient’s well-being.
Employing a suitable combination of vital signs enables us to detect significant occurrences in the human body not only in the medical field, such as detecting heart diseases, but also in activity detection, education, gaming, cognition studies, neuroscience, and others (Jahanjoo et al., 2017; Dell’Agnola et al., 2022; Orlandic et al., 2021; Sopic et al., [n.d.]).
Numerous retrievable vital signs can be obtained from sensors attached to the body. In order to be able to keep the applications concise, this section delves into the diverse applications of biosignals, which can be derived from the sensors mentioned in Section 2. Table 5 shows a summary of vital signs derived by different sensors.
| Sensor | Primary vital sign | Derived vital sign | Application examples |
|---|---|---|---|
| PPG | Heart Rate (HR) | Heart rate variability (HRV) | Physical training intensity and duration, arrhythmia |
| Resting Heart Rate (RHR) | Atherosclerosis, myocardial schemia, increased apotosis | ||
| Blood Pressure (BP) | Systolic Blood Pressure (SBP) | Hypertension, cardiovascular diseases | |
| Diastolic Blood Pressure (DBP) | Hypertension, cardiovascular diseases | ||
| Peripheral systolic blood pressure (SBPp) | Vascular aging | ||
| Respiratory Rate (RR) | Sleep apnea syndrom, cardiac arrest, chronic obstructive pulmonary disease | ||
| SpO2 | Hypoxia, athletic performance, lung gas exchange diagnostics | ||
| EEG | Electrical frequency bands | Delta | Signal detection and decision making, sleep experiments |
| Theta | Selective attention interpretation, cognition experiments | ||
| Alpha | Working memory, long term memory | ||
| Beta | Cognition experiments | ||
| Gamma | Auditory, visual response measurements | ||
| Accelerometer | Acceleration | Distance measurements, fall detection, signal noise reduction | |
3.1. Early Warning Score
EWS are a set of vital signs that are used to assess a patient’s condition. By monitoring a patient’s EWS, healthcare professionals can identify early signs of deterioration and take steps to prevent serious complications (Götzinger et al., 2017).
In this part, we discuss vital signs that play a crucial role in calculating the EWS. These indicators can be derived from the sensors covered earlier in our discussion.
3.1.1. HR
Extracting the heart rate from PPG or ECG can benefit users in multiple ways. RHR can be used in medical applications to anticipate cardiovascular events. An increased RHR can lead to atherosclerosis, myocardial ischemia, increased apoptosis, and many other problems (Malcolm Arnold et al., 2008). HR is also related to physical fitness, and Heart Rate Variability (HRV) can be used to provide athletes with feedback concerning their schedule, duration, and intensity of training (Aubert et al., 2003). Extracting users’ mental states and emotions can be done via HRV, especially for stress. This has proven well-applicable, but also happiness or anger are feasible (Umair et al., 2021; TaheriNejad and Pollreisz, 2016; Pollreisz and TaheriNejad, 2017).
3.1.2. RR
Knowing the RR is often an important sign for knowing someone’s health. It can indicate hypoxia and predicts cardiac arrests (Dias and Cunha, 2018). Moreover, it is an indicator to distinguish respiratory sinus arrhythmia (Aubert et al., 2003). RR depends on many other pathological conditions, such as physical effort, heat/cold, cognitive load, and emotional stress (Nicolò et al., 2020).
3.1.3. Oxygen Saturation (SpO2)
Dual-wavelength PPG is the most popular method for non-invasive SpO2 measurements. It is a vital parameter that is almost always measured in clinical settings. Oxygenation levels of different measurement positions such as limbs and brain are used additionally in space, military applications, and stress detection(Dias and Cunha, 2018; Bhavani et al., 2022). Extracting relative changes in the total hemoglobin and its oxygenated and reduced proportions may help recognize vascular complications like arterial occlusions (Ysehak Abay, 2018). In exercises, aerobic efficiency can be deduced by monitoring SpO2 levels (Dias and Cunha, 2018).
3.1.4. BP
Blood pressure dramatically influences cardiovascular diseases, and hypertension is a risk factor. Single BP measurements done in clinics can be affected by different factors and do not include BP variability. A reliable way to estimate both SBP as well as DBP from signals recorded using a PPG sensor could help in the early detection of issues(Xing et al., 2019). Steepness in the SBP peaks (SSPB) indicates vascular aging due to the higher arterial stiffness (Ghamari, 2018).
3.2. Neurological analysis
EEG measurements have a significant impact on medical brain analysis, and there is a growing availability of devices designed for individual mental assessment (Başar et al., 2001). The measured current waveforms are correlated to neural activity, which is split into frequency ranges shown in Table 1 and explained in Section 2. Research is done on various topics, including neurological disorders, linguistics, and developmental research (Bonhage et al., 2017). Consumer-grade devices are often used to detect mental load and derive parameters like attention, vigilance, fatigue, and stress. Wireless devices are often used in brain-computer interfaces, education, or gaming (Sawangjai et al., 2020).
3.3. Activity recognition
Many modern wearable health devices feature an acceleration measurement as shown in Tables 2 and 3. This feature can be used for many applications like fall detection, distance measurements, and gesture analysis (González-Cañete and Casilari, 2021; Gouthaman et al., 2014; Chandel and Ghose, 2018; Jahanjoo et al., 2020). In the medical field, these sensors have been used to get respiratory waveforms or activity and body posture (Dias and Cunha, 2018), detection of depression (Garcia-Ceja et al., 2018; Aminifar et al., 2021d; Aminifar et al., 2022; Jakobsen et al., 2020) and schizophrenia [s1, s2] from mental health domain. In combination with other sensors, acceleration data is also often used for noise detection and removal (Pollreisz and Taherinejad, 2019).
3.4. Mental Health
The relation between motor activity data and mental health conditions such as schizophrenia and major depression is studied (Berle et al., 2010; Faedda et al., 2016). In (Garcia-Ceja et al., 2018), the authors collect motor activity data from 23 unipolar and bipolar depressed patients and 32 non-depressed contributors using actigraph wristbands (Actiwatch, Cambridge Neurotechnology Ltd). In (Garcia-Ceja et al., 2018; Aminifar et al., 2021d), it has been shown that depression can be detected based on such data using Machine Learning (ML). In (Jakobsen et al., 2020), motor activity data from 22 patients with schizophrenia and 32 healthy control persons was collected using actigraph wristbands. In (Jakobsen et al., 2020; Aminifar et al., 2022), the authors show that ML algorithms can detect such mental conditions based on motor activity data.
3.5. Sleep Apnea
Single-channel ECG signals collected by medical wearable sensors can be utilized for detecting sleep disorders. In (Surrel et al., 2018), the authors propose a wearable, accurate, and energy-efficient system for monitoring Obstructive Sleep Apnea (OSA), which is an important underdiagnosed sleep disorder. They develop an efficient time-domain analysis to compute the score for OSA that considers wearable systems’ energy constraints. According to their evaluation results based on the PhysioNet Apnea-ECG database (Goldberger et al., 2000), their proposed system achieves up to 88.2% classification accuracy and a battery lifetime of 46 days for continuous screening of OSA.
3.6. Seizure Detection
EEG and ECG signals collected by wearable devices can be used for the detection of epileptic seizures (Sopic et al., 2018; Forooghifar et al., 2019, 2021). An early warning from medical wearable devices can notify caregivers to rescue the patient. In (Sopic et al., 2018), the authors propose e-Glass, which is a system incorporating four EEG electrodes to detect epileptic seizures. Their system achieves a sensitivity of 93.80% and a specificity of 93.37%, and a battery lifetime of 2.71 days for continuous operation. In (Forooghifar et al., 2019), the authors propose a self-aware wearable system for real-time seizure detection based on ECG signals. They employ ML to detect seizures by analyzing cardiac and respiratory responses to seizures obtained from ECG signals and introduce the notion of self-awareness in their system to ensure energy efficiency. Their system achieves from 85.54% to 79.33% geometric mean of specificity and sensitivity and a battery lifetime between 67.55 and 136.91 days.
3.7. Stress detection
The term stress is nowadays widely understood in its meaning, defined by Hans Selye in 1936 as “the non-specific response of the body to any demand” (Rochette and Vergely, 2017). Short-term stress can be helpful for athletes and physically demanding tasks, but also enhance cognitive capabilities (Samson and Koh, 2020; Sawangjai et al., 2020). Long-term stress is detrimental to health and can lead to disorders and health problems (Samson and Koh, 2020).
Many different sensors and algorithms can be used for stress detection with heavily varying accuracy, wearability, and use cases. The most promising approaches for workplace environments with the devices mentioned in Section 2 and extractable vital signs mentioned in Section 3 are discussed in this section. Enhancing classification accuracy can be achieved by combining the measured parameters from diverse devices. This can also be advantageous for increasing single parameter accuracies by using a secondary measurement during their calculation, e.g., acceleration for PPG signals (Hogervorst et al., 2014).
Due to the complexity and high volume of available data, various ML techniques are employed for this purpose, and comparisons are often made based on their outcomes. (Arsalan et al., 2019; Das et al., 2018; Gedam and Paul, 2021).
3.7.1. Personalized Stress Monitoring Using Wearable Sensors in Everyday Settings
The work of Tazarv et al. concludes that by only using data extracted from a PPG sensor, binary stress detection can be done with an accuracy of up to 76%. With a sampling rate of , the deduced HR and HRV are used as input for different ML methods. Fourteen subjects were recorded during their daily activities in an uncontrolled environment, and the measured data were labeled using self-reports (Tazarv et al., 2023).
3.7.2. Personal Stress-level Clustering and Decision-level Smoothing to Enhance the Performance of Ambulatory Stress Detection with Smartwatches
Three different stress levels were done by Can et al. with the use of two different wrist-worn devices, EDA, HR, HRV, skin temperature, and acceleration were extracted from 32 participants. The data was validated with questionnaires and, again, different ML algorithms compared to each other. By shifting the results into binary classes, an accuracy of up to 92% was achieved (Can et al., 2020).
3.7.3. Stress: Towards a Gold Standard for Continuous Stress Assessment in the Mobile Environment
Up to 72% accuracy was achieved with data collected in a natural environment done by Hovsepian et al. 21 participants were using devices for one week, and ECG, acceleration, and plethysmography data was collected. The collected data was joined with measurements from a lab-controlled study. Self-reported stress levels were collected with which an ML algorithm was trained (Hovsepian et al., 2015).
3.7.4. Classification of Perceived Human Stress using Physiological Signals
By using both a head-worn and wrist-worn device, Arsalan et al. were able to implement EEG as well as PPG and EDA measurements. Four statistical features were extracted from the recorded data, and stress was classified in binary with three ML classifiers. The highest classification accuracy achieved with data from 28 subjects was 75%. The subjective data was gathered via a perceived stress scale from questionnaires before the in-lab measurements were taken (Arsalan et al., 2019).
3.7.5. Eliminating Individual Bias to Improve Stress Detection from Multimodal Physiological Data
A comparison of sensors and sensor groups done by Das et al. concludes that only using EEG (64%) performs worse than EEG, EDA and PPG combined (69%). Also, different techniques were used and compared before the classification via an ML algorithm. The dataset was taken from 10 subjects during trials in a laboratory, and self-reported data were used in the classification. The authors split up different accompanying effects of stress into separated scales for finer incrementation and analysis (Das et al., 2018).
3.7.6. Multi-Modal Acute Stress Recognition Using Off-The-Shelf Wearable Devices
In (Montesinos et al., 2019), the authors investigate the possibility of detecting stress based on off-the-shelf wearable devices, i.e., Shimmer3 ECG Unit and Empatica E4 wristband. First, they collect physiological signals, including ECG, EDA, Skin Temperature (ST), and Respiration (RSP), from 30 subjects (between 25-35 years old) in three stages/states. In the first and second stages, scenery clips and horror clips, respectively, are shown to the subject, while in the third stage, an arithmetic task is given to the subject. After data collection, the signals are processed, and features are extracted. Then, the extracted features are used to train several ML models, based on Decision Tree (DT) (Quinlan, 1986), k-nearest neighbour (KNN) (Guo et al., 2003), and Random Forest (RF) (Ho, 1995) algorithms, for classifying the signals and detecting the states. They achieved up to 84.13% accuracy in detecting acute stress episodes.
3.7.7. CAFS: Cost-Aware Features Selection Method for Multimodal Stress Monitoring on Wearable Devices
In (Momeni et al., 2021), the authors focus on the trade-off between prediction performance and energy consumption in the context of stress detection using wearable devices. They propose Cost-Aware Features Selection (CAFS) to find a balance between prediction-power and energy-cost for multimodal stress monitoring. CAFS selects the most important features considering constraints for energy consumption. Subsequently, they present a self-aware stress monitoring framework that intelligently transitions between the energy models to reduce energy consumption. Their framework saves energy by a factor of 10 and achieves an accuracy of 88.72% on unseen data.
3.7.8. ReLearn: A Robust Machine Learning Framework in Presence of Missing Data for Multimodal Stress Detection from Physiological Signals
One of the significant challenges in using physiological signals recorded by conventional monitoring devices is dealing with missing data. This can happen when the contact of sensors is insufficient or when other equipment interferes in the process of collecting data. In particular, if the subject is more active or is stressed, he/she makes more conscious or subconscious movements, which can lead to missing more values. In (Iranfar et al., 2021), the authors address this problem and propose ReLearn, which is a robust machine learning framework for detecting stress based on biomarkers extracted from multimodal physiological signals. ReLearn handles missing data and outliers for both the training and inference phases. Their framework achieves 78% accuracy in the presence of missing values.
3.7.9. Comparison of Stress Detection through ECG and PPG signals using a Random Forest-based Algorithm
In order to enhance the accuracy of stress detection, it is prudent to leverage all available resources. There is potential value in utilizing a model trained on PPG data to detect stress from ECG data or vice-versa. In line with this, Benchekroun et al. (Benchekroun et al., 2022) not only conducted a comparison of stress detection outcomes using ECG and PPG sensor data, but they also experimented with an RF model trained on PPG data and tested on ECG sensor data. Their model predicts stress with 82% and 83% accuracy when they train and test it with PPG and ECG sensor data, respectively. They also attained a 73% accuracy rate when testing ECG sensor data using a model trained with PPG sensor data. This method acknowledges the possibility of effectively applying models and data sources across different applications for accurate stress detection.
3.7.10. Stress Detection With Single PPG Sensor by Orchestrating Multiple Denoising and Peak-Detecting Methods
Finding peaks is one of the most important phases during processing PPG sensor data because PPG features for general stress detection are based on HRV, which is quantified as the changes in the interval between successive peaks (Shaffer and Ginsberg, 2017). Indeed, precisely detecting peaks plays a crucial role in accurately detecting stress.
Heo et al. (Heo et al., 2021) present an ensemble-based peak-detecting method that consists of combining five peak-detection methods. They apply the local maxima method, block generation with the mean of the signal threshold method, first derivative with an adaptive threshold method, slope sum function with an adaptive threshold method, and moving averages with the dynamic threshold method. Ultimately, they determine the final peak point through a majority voting process among the five points. Ultimately, they achieved a classification accuracy of 95.07%.
3.7.11. High-Accuracy Stress Detection Based on PPG Sensor Embedded in Smartwatches
In (Jahanjoo et al., 2024), the authors propose a stress detection method with a single PPG sensor integrated into smartwatches. They employ different time-domain, frequency-domain, and nonlinear-domain HRV features to train several ML models. To find the best signal window sizes for detecting stress, they calculate the results for different window sizes, determining that a size of 360s yields the best outcomes. Additionally, they explore different denoising techniques including bandpass, Kalman, and moving average filtering to enhance the signal’s quality. They achieve 95.55% accuracy and 91.42% F1-score using the Support Vector Machine (SVM) (Cortes and Vapnik, 1995a) algorithm.
A summary of the various approaches employed for stress detection is presented in Table 6. It includes information on the signals utilized for stress detection, the different machine learning algorithms applied, the highest achieved accuracies, and their primary contributions or novelties.
| Paper | Biosignal | Classifier | Acc. | Subjects # | Major contribution/Novelty |
|---|---|---|---|---|---|
| (Jahanjoo et al., 2024) | PPG | Ada-Boosting (Freund and Schapire, 1997), KNN, Linear Discriminant Analysis (LDA) (Balakrishnama and Ganapathiraju, 1998), RF, SVM, Decision Tree (DT) (Quinlan, 1986) | 95% | 15 (Schmidt et al., 2018) | Extracting time-domain, frequency-domain, and nonlinear-domain HRV features withing PPG signals for detecting stress |
| (Heo et al., 2021) | PPG | DT, RF, Ada-boosting, KNN, LDA, SVM, and Gradient-boosting (Friedman, 2001) | 95% | 15 (Schmidt et al., 2018) | Using two-step denoising and an ensemble-based multiple peak-detection method for improving stress detection performance |
| (Can et al., 2020) | PPG, Electronic Design Automation (EDA), ST, and Acceleration | Multilayer Perceptron (MLP) (Popescu et al., 2009), SVM, KNN, RF, and LDA | 92% | 32 | Developing a hybrid person-independent stress detection model without requiring an extensive personal data collection period |
| (Momeni et al., 2021) | ECG, RSP, PPG, EDA, and ST | Extreme Gradient Boosting (XGBoost) (Chen and Guestrin, 2016) | 91% | 60 | Using a cost-aware feature selection approach to trade off between prediction-power and energy-cost |
| (Montesinos et al., 2019) | ECG, EDA, ST, and Respiration | DT, KNN, and RF | 84% | 30 | Demonstrating the feasibility of recognizing acute stress using off-the-shelf wearable devices and multi-modal machine learning technique |
| (Benchekroun et al., 2022) | ECG, and PPG | RF | 83% | 46 | Demonstrating that HRV features extracted from PPG signal serve as reliable alternatives to those extracted from ECG signal |
| (Iranfar et al., 2021) | ECG, RSP, PPG, and EDA | XGBoost | 78% | 95 (Rodrigues et al., 2020) | Overcoming challenges of missing data and outliers using multi-modal physiological signals |
| (Tazarv et al., 2023) | PPG | MLP, SVM, KNN, RF, and XGBoost | 76% | 14 | Exploring the objective prediction of stress levels in everyday settings through a layered system architecture for personalized stress monitoring, using low-cost PPG sensors available on common wearable devices |
| (Arsalan et al., 2019) | EEG, PPG, and EDA | SVM, MLP, and Naive Bayesian (NB) | 75% | 28 | Introducing a novel approach to classifying perceived human stress using non-invasive physiological signals (EEG, EDA, PPG) |
| (Hovsepian et al., 2015) | ECG, PPG, and Acceleration | SVM | 72% | 21 | Addressing the lack of a gold standard by undergoing comprehensive computational modeling steps, including data collection, screening, cleaning, filtering, feature computation, normalization, and model training |
| (Das et al., 2018) | ECG, PPG, and EDA | RF | 69% | 10 (146 instances) (Reuderink et al., 2009) | Eliminating the subject-specific bias for classification accuracy improvement |
3.8. Attention detection
In a lot of workplace environments, the level of attention of a single person is crucial, especially where single errors e.g. those made by pilots or police officers, can lead to fatal accidents (Peláez et al., 2019). The attention level varies during the day and is influenced by many factors such as sleep quality, food intake, or exercise. Monitoring this and indicating when certain thresholds have been crossed allows employees to take breaks when needed. This in turn makes the employee more productive and ensures a good work-life balance (Dey et al., 2017).
During an academic course, the process of assessing material can be expedited when the level of attention among the students is high. If breaks are timed accordingly, both the perceived as well as the actual speed of learning is higher (Wan and Guo, 2020).
Most techniques use the data from head-worn EEG or eye-tracking devices. PPG and other vital sign measurements are often added, but only a few methods solely rely on wrist-worn devices (Dey et al., 2017).
3.8.1. Human Attention Recognition with Machine Learning From Brain-EEG Signals
Hassan et al. conducted a study involving 30 participants and categorized the attention level into three distinct groups using EEG data. Each phase of attention was normally between 1-2 seconds, followed by one of the three other neutral, happy, or boring states. The data was collected in a controlled environment. After training an ML algorithm and subsequently solving mathematical problems, accuracy of almost 89% was achieved (Hassan et al., 2020).
3.8.2. Classification of Human Attention to Multimedia Lecture
To precisely classify states of attention, Lee et al. recorded EEG data from eight participants during the process of learning. With this data, a binary classification accuracy of 72% was reached. The used EEG electrode positions are compatible with mobile head-worn devices (Lee et al., 2018).
3.8.3. Wearable PPG Sensor-Based Alertness Scoring System
Due to the rich source of data available for ECG and the high correlation between RR series extracted from both PPG and ECG signals, Dey et al. opted to initially train an SVM (Cortes and Vapnik, 1995b) model using features extracted from ECG RR series, despite relying solely on data recorded from a PPG sensor in the application. The data was sampled continuously in an uncontrolled environment. The achieved accuracy for awake or sleep classification was over 80%, based on the participant profile (Dey et al., 2017).
3.8.4. Photoplethysmographic Waveform Versus Heart Rate Variability to Identify Low-Stress States: Attention Test
ECG and PPG data recorded from 50 participants were used to determine attention levels. The states were defined as resting and attention and tested in laboratory conditions. By using parameters extracted from PPG only, an accuracy of 89% for binary classification was achieved, while using ECG yielded worse results (Peláez et al., 2019).
3.8.5. Evaluation of Learning Performance by Quantifying User’s Engagement
By measuring EEG, eye movement, PPG, and EDA during sessions, Sandhu et al. were able to reach an accuracy of 90%. The attention level was split into three classification levels, and ten participants were tested in controlled environments. The data analysis was done on single sensor data only, and no combined data was used. The best results were reached with the EEG data (Sandhu et al., 2017).
3.8.6. Attention Detection using Electro-oculography Signals in E-learning Environment.
This research paper addresses the challenge of maintaining student focus during online lectures or videos. Abdo et al. in (Abdo et al., 2021) propose an attention detection system utilizing Electrooculogram (EOG) signals generated by eye movements. They classify six types of eye movements and collect a substantial dataset from 50 subjects. Signal noise is filtered using a band-pass filter, and deep learning models, including Convolutional Neural Network (CNN) (Albawi et al., 2017) and Inception network, are employed for classification. Notably, the inception model achieved an impressive average accuracy of 93.63% for attention detection.
3.8.7. Frequency-based EEG Human Concentration Detection System Methods with SVM Classification
In (Purnamasari and Junika, 2019), authors focus on recognizing human concentration, particularly crucial in activities like driving to prevent accidents. EEG signals from a Neurosky Mindwave headband are employed for this purpose. The study compares two frequency-based feature extraction methods: Power Spectral Density (PSD) from FFT and energy from Discrete Wavelet Transform (DWT). DWT outperforms FFT, improving accuracy by 18%. Using a SVM classifier the system achieves a 91% accuracy in detecting human attention.
3.8.8. Classification of Relaxation and Concentration Mental States with EEG
Scientists have demonstrated the feasibility of detecting concentration using a single EEG sensor device. In (You, 2021), similar to previous work, the author investigates detecting concentration using a cost-effective Neurosky Mindwave device with a single EEG channel. Subjects are asked to recite numbers backward while their EEG signals are converted into time-frequency representations. SVM and multi-layer feed-forward networks are employed as classifiers, individually trained for each subject. Results demonstrate that, with features from alpha, beta, and gamma bands with a 4 Hz bandwidth, the average accuracy of detecting concentration level exceeds 80% across subjects.
3.8.9. Classification of Human Concentration in EEG Signals Using Hilbert Huang Transform
One of the most important steps in concentration detection using EEG sensor data is feature extraction techniques. In (Aziz et al., 2017), the authors explore the use of Hilbert Huang Transform (HHT) to classify concentration states based on EEG signals. HHT involves two steps: Empirical Mode Decomposition (EMD) and Hilbert Transform. EMD decomposes the EEG signal into Intrinsic Mode Function (IMF), while Hilbert Transform is used to calculate the power spectrum for feature extraction in different EEG signal bands. They employ the Extreme Learning Machine (ELM) as the classifier. Comparing HHT with single IMF to the FFT method, results indicate an improvement and they detect concentration with 72% accuracy.
3.8.10. Driver Vigilance Estimation with Bayesian LSTM Auto-encoder and XGBoost Using EEG/EOG Data
Detecting attention, especially in applications like monitoring a driver’s attention to prevent distractions, has major importance. Such detection can potentially save lives by triggering timely alarm systems, ensuring the safety of the driver and others on the road. In (Zeghlache et al., 2022), the authors address driver drowsiness detection using machine learning applied to EEG and EOG data. They present two Variational Autoencoder (VAE) models to estimate driver alertness by reducing EEG features while maintaining classifier accuracy. Using a multimodal dataset, EEG and EOG features and applied to an XGBoost classifier, with the VAE LSTM encoder offering improved feature extraction. This approach achieved 76% for precision.
A summary of the various approaches employed for attention detection is presented in Table 7. It includes information on the signals utilized for attention detection, the different machine learning algorithms applied, the highest achieved accuracies, and their primary contributions or novelties.
| Paper | Biosignal | Classifier | Acc. | Subjects # | Major contribution/Novelty |
|---|---|---|---|---|---|
| (Abdo et al., 2021) | EOG | CNN, Visual Geometry Group (VGG), and Inception | 94% | 50 | Introducing an attention detection system using EOG signals to identify non-attention periods and recognize Attention Deficit Hyperactivity Disorder (ADHD) patterns in students during learning |
| (Purnamasari and Junika, 2019) | EEG | SVM | 91% | 10 | Introducing a method for recognizing human concentration using a Brain-Computer Interface (BCI) system employing frequency-based feature extraction |
| (Sandhu et al., 2017) | EEG, PPG, EDA, and Eye Tracker | SVM | 90% | 10 | Employing multi-modal sensors to objectively quantify engagement levels in real-time learning activities |
| (Hassan et al., 2020) | EEG | CNN-LSTM | 89% | 30 | Introducing a cost-effective single-channel EEG-based attention level recognition system, using diverse datasets and a hybrid CNN-LSTM model |
| (Peláez et al., 2019) | PPG, and ECG | Bagging using DT | 89% | 50 | Developing an automatic identifier for attentional states, by extracting the most appropriate features for detecting a subject’s high performance state |
| (You, 2021) | EEG | SVM, and MLP | 84% | 1st run: 7, 2nd run: 10 | Presenting a study based on one-channel toy-grade EEG device to classify concentrated and relaxed mental states |
| (Dey et al., 2017) | PPG, and ECG | SVM | 80% | - | Proposing a smartwatch-based system using PPG and ML to continuously estimate alertness levels |
| (Zeghlache et al., 2022) | EEG, and EOG | XGBoost | 76% | 23 trials (each trial 2 hours) (Zheng and Lu, 2017) | Presenting an approach for driver drowsiness detection using two VAE models, aimed at reducing the dimensionality of EEG features while maintaining a high level of accuracy |
| (Lee et al., 2018) | EEG | KNN, SVM, CNN, and Ensemble | 72% | 8 | Classification of attention and non-attention to online lecture videos by extracting PSD features from EEG signals |
| (Aziz et al., 2017) | EEG | Extreme Learning Machine (ELM) (Huang et al., 2006) | 72% | 5 | Introducing an approach for classifying concentration states using HHT |
4. Discussion

| Machine learning | Top stress detection accuracy | Top attention detection accuracy | ||||||||
|---|---|---|---|---|---|---|---|---|---|---|
| classification algorithm | (Tazarv et al., 2023) | (Can et al., 2020) | (Arsalan et al., 2019) | (Momeni et al., 2021) | (Heo et al., 2021) | (Lee et al., 2018) | (Dey et al., 2017) | (Hassan et al., 2020) | (Sandhu et al., 2017) | (You, 2021) |
| SVM | 69% | 70% | 50% | 94% | 76% | 80% | 90% | 84% | ||
| CNN-LSTM | 89% | |||||||||
| MLP | 73% | 70% | 75% | 82% | ||||||
| kNN | 72% | 86% | 92% | 77% | ||||||
| LDA | 62% | 95% | ||||||||
| Ensemble | 76% | 92% | 91% | 91% | 72% | |||||
In this research, our primary emphasis was dedicated to the exploration and explanation of healthcare-oriented wearable devices, containing a collection of headbands, wristbands, smart rings, and chestbands that have been equipped with specialized sensors to cover extensive healthcare monitoring applications. Since how (i.e., where) such devices are worn plays an important role in their utility, we presented a first categorization approach based on different device positions, i.e., wrist, head, and finger. We explained the details of these devices and the specifications related to sensor settings, connection protocols, and raw data access. The second categorization takes a different approach by focusing on end applications. We studied several applications where wearable devices were used and discussed what they achieved and how.
Table 2 shows that almost all head-worn devices feature accelerometers, and half have integrated PPG sensors. This table presents that sampling rate as one of the specifications of EEG sensor, can vary from 250 to 2048 Hz. The range of different frequency bands of interest in the EEG signal is from delta to gamma, i.e., between 0.5 and 80 Hz (Jadeja, 2021), and according to the Nyquest-Shanon sampling theorem (Landau, 1967), any signal with limited energy and Hz bandwidth may be reconstructed via samples taken with a bandwidth of Hz or higher. Consequently, the sampling rate in the range of few hundreds is sufficient for applications that use the gamma as the maximum frequency range of interest. Higher sampling frequency rates require more storage space and processing power to handle the increased volume of the generated data. Considering that the main sensor of head-worn devices is EEG, these devices are mostly used to monitor brain-related activities such as epileptic seizure or cognitive processes. In this article, we investigated the applications of this sensor in the detection of attention as a cognitive process, which can have various applications, such as detecting attention while working or participating in an online course.
Chest-worn devices can provide accurate and reliable heart rate data, which can be helpful for monitoring cardiac health, fitness, and performance. However, they are often inconvenient, may reduce mobility, and are not ideally suited for a long time wearing (Choksatchawathi et al., 2020). Therefore, they are usually used for relatively shorter term monitoring, especially when higher precision is required.
Table 3 presents wrist-worn devices, often smartwatches, usually equipped with PPG and accelerometer sensors to monitor vital signs and physical activities. Acceleration data are useful for detecting noise in PPG signal too. Other sensors like EDA and temperature are mostly embedded in the devices that are produced for research purposes. In this table, we present a simple device called the Polar OH1, which solely incorporates a PPG sensor, as well as more complex devices like the EmbracePlus, which includes additional sensors such as EDA and accelerometer alongside the PPG. By having these sensors, wristbands can provide data to measure various health parameters such as heart rate, blood pressure, and oxygen saturation. Additionally, we can track physical activity, monitor sleep quality, and detect stress levels by processing the sensors data. However, it is important to note that the data they provide are not as accurate and reliable as clinical data due to different sources of noise during data collection (Pollreisz and Taherinejad, 2019; Aminifar et al., 2024). However, they are easy to use and convenient to wear, hence very suitable for longer period monitoring, where clinical-level precision is not necessary.
In Figure 1, we demonstrated the sensors that are integrated within each distinct category of devices, such as headbands, wristbands, and smart rings based on devices available in the market. This overview serves to equip other researchers with an insightful perspective, enabling them to distinguish and select the most suitable device category based on their specific sensor requirements and operational needs and preferences. More importantly, it provides a clear overview of their overlap, where any of those wearable devices could be used (almost) interchangeably or serve as redundancy one for the other.
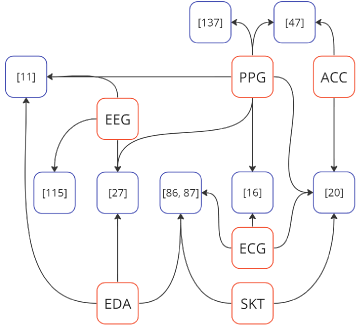
Given the limited range of feasible wearing positions, such as the head and wrist, numerous devices feature similar sensors (Umair et al., 2021; Ghamari, 2018; Sawangjai et al., 2020). PPG being the most common one, whereas ECG and EDA were quite common too. EEG has been used in many attention and stress detection works. In Figure 3 (a), we showcase the studies and the sensors they utilized in various works to detect attention. Since attention is commonly derived from processing data channels of EEG sensor, we observe that most of the research applied this sensor to detect attention. However, in (Peláez et al., 2019), researchers demonstrate that it is possible to detect attention using PPG sensor data instead of relying on EEG. This can open a new field of research and potentially many new use cases where headworn devices are not practical.
Figure 3 (b) illustrates the set of sensors used in each research for detecting stress. Unlike attention detection, which is mainly computed by EEG sensors, typically headworn devices with minimal movement, most devices used for stress detection are worn on body parts that are subject to significant movement, such as the wrist. This movement often introduces significant noise. Certain studies depicted in this figure utilize accelerometers to monitor and remove the noise resulting from this movement in the physiological signals.
The measured physiological parameters can be combined to achieve higher overall accuracy. However selecting the appropriate ones and determining the optimal combination, is often a challenging task, as Table 6 shows many research utilized different sensors to achieve a high accuracy but the study that achieved the highest accuracy only employed PPG signal. Consequently, besides the physiological data, other parameters directly affect accuracy, such as preprocessing methods and classification algorithms. Table 8 shows the wide range of accuracy, between 72% (Lee et al., 2018) and 90% (Sandhu et al., 2017), for attention detection. Stress can be detected more precisely with accuracy ranging between 62% (Can et al., 2020) and 95% (Heo et al., 2021). However, the used measurement devices for detecting attention, which often feature EEG sensors, can be uncomfortable or intrusive for the users (Sadek et al., 2018). All of the researched studies use an ML algorithm for classification, and many compare different ones against each other. For filtering the raw data, on the other hand, a mixture of manual noise extraction, post-processing, and automated algorithms using accelerometers have been used (Sandhu et al., 2017; Pollreisz and Taherinejad, 2019).
The practical use cases of the stress and attention detection methods mentioned before span from specialized workplaces like airplanes and law enforcement over athletes, or search and rescue missions to schools, where the attention level of students is often crucial (Peláez et al., 2019; Dell’Agnola et al., 2022; Wan and Guo, 2020). Stress detection on consumer devices can be used to avoid side effects of stress that can be detrimental to health, such as poor sleep (Tazarv et al., 2023).
Determining with certainty which sensors or algorithms achieve the best results is challenging, as factors such as the noise level of the data, preprocessing methods, and algorithm parameters influence the outcomes. However, on average, ensemble algorithms, particularly XGBoost, consistently outperform other methods in stress detection. Their strength lies in combining multiple weak learners into a robust model. This also leads to reduced overfitting and enhanced generalization. In addition, XGBoost is less sensitive to noise compared to SVM, because SVM tries to find the optimal hyperplane that separates the data into different classes, but noise affects the position and the margin of the hyperplane.
As a result, since PPG data generally includes more motion artifacts compared to EEG signals, SVM demonstrates more promising results for attention detection than stress detection.
Many new studies offer different options, with up and downsides to each of them, and although ML is always used, no single ML algorithm has been dominant in the literature.
The experiment methodology varies in their setups, with participants’ pool sizes ranging from 5 to 95. Especially, uncontrolled data measured in out-of-lab environments have high uncertainty and variation in quality as seen in Chapters 3.7 and 3.8.
It is worth mentioning that certain studies employ Deep Neural Networks (DNN) s as their predictive models (Abdo et al., 2021; Hassan et al., 2020; Lee et al., 2018). However, due to the requirement for substantial amounts of labeled data for training and longer training times in comparison with classical ML models, DNN s are harder to employ in wearable healthcare domain (Choi et al., 2020; Mukhamediev et al., 2021). Data privacy concerns and high costs of data collection and storage are the reasons that make accessing large datasets more difficult (Slobogean et al., 2015; Aminifar
et al., 2021b, c, a).
In conclusion, the choice of suitable wearables highly relies on the specific application. For analyzing brain-related activities like attention level detection or cognitive load assessment, head-worn devices with various sensors (especially EEG) are preferable. On the other hand, for stress detection, wrist-worn and finger-worn devices with diverse sensors (especially PPG) are preferable. It’s important to note that combining different physiological parameters is often helpful for more accurate attention and stress detection. Finally, there is not a specific prediction model which can consistently yield the best results.
5. Conclusion
In this paper we studied various biomedical devices, including headbands, wristbands, smart rings, and chest bands, equipped with diverse biosensors such as PPG, EEG, EDA, and skin temperature sensors. In our investigation, we delved into the detailed analysis of each device, clarifying their respective capabilities and limitations. We presented the applications of these devices and sensors, particularly emphasizing their roles in physical and psychological assessments. That is, in early warning score systems (heart rate, blood pressure and respiratory rate monitoring) and the crucial domains of stress and attention detection, wherein we meticulously outlined the prevalent sensors frequently employed in the existing literature for these purposes. Stress and attention detection hold critical significance in various high-risk workplaces. Complex systems are necessary for accurate measurements, however, for enhanced comfort, despite potential limitations in data quality, head and wrist-worn devices present them as prime candidates.
Furthermore, we studied machine learning algorithms commonly utilized for stress and attention detection, presenting their respective performance and limitations. Despite the strides made in this area, our research highlighted the persistent challenges in obtaining reliable results, especially when implementing stress and attention detection systems within an organizational setting. For example, environmental dynamics of a workplace introduce complexities not encountered within controlled laboratory settings. Factors such as employee movement, talking, and other occupational activities can introduce significant noise and hinder the accuracy of detection systems.
We content that a portion of future efforts should concentrate on refining denoising methodologies to clean datasets efficiently, thereby mitigating the impact of environmental noise. Moreover, exploring robust machine learning algorithms that can operate effectively despite varying noise levels will be a critical avenue for further research, especially with the growing accessibility of new consumer-oriented devices that facilitate more extensive and inclusive studies. By addressing these challenges, we can pave the way for more robust and reliable stress and attention detection systems tailored for practical implementation within organizational contexts. A reliable and robust detection system is only the first step in improving the health of employees in the workplace. Without such reliable systems, it would be rather impractical for psychologist and sociologist to conduct (more) objective studies about parameters such as stress and devise solution that can use biological data to improve the health of workers and the working environment.
Acknowledgement
This work has been partially funded by the Vienna Science and Technology Fund (WWTF) [10.47379/ICT20034].
References
- (1)
- Abdo et al. (2021) Yassmina Abdo, Ehab Yahya, Hussein Ismail, Mostafa Saleh, Radwa Reda, and Howida A. Shedeed. 2021. Attention Detection using Electro-oculography Signals in E-learning Environment. In 2021 Tenth International Conference on Intelligent Computing and Information Systems (ICICIS). 213–218. https://doi.org/10.1109/ICICIS52592.2021.9694237
- Albawi et al. (2017) Saad Albawi, Tareq Abed Mohammed, and Saad Al-Zawi. 2017. Understanding of a convolutional neural network. In 2017 international conference on engineering and technology (ICET). Ieee, 1–6.
- Aminifar et al. (2024) Amin Aminifar, Soheil Khooyooz, Anice Jahanjoo, Salar Shakibhamedan, and Nima TaheriNejad. 2024. RecogNoise: Machine-Learning-Based Recognition of Noisy Segments in Electrocardiogram Signals. In 2024 IEEE International Symposium on Circuits and Systems (ISCAS). IEEE.
- Aminifar et al. (2021a) Amin Aminifar, Fazle Rabbi, and Yngve Lamo. 2021a. Scalable privacy-preserving distributed extremely randomized trees for structured data with multiple colluding parties. In ICASSP 2021-2021 IEEE International Conference on Acoustics, Speech and Signal Processing (ICASSP). IEEE, 2655–2659.
- Aminifar et al. (2021b) Amin Aminifar, Fazle Rabbi, Ka I Pun, and Yngve Lamo. 2021b. Privacy preserving distributed extremely randomized trees. In Proceedings of the 36th Annual ACM Symposium on Applied Computing. 1102–1105.
- Aminifar et al. (2021c) Amin Aminifar, Fazle Rabbi, Violet Ka I Pun, and Yngve Lamo. 2021c. Diversity-aware anonymization for structured health data. In 2021 43rd Annual International Conference of the IEEE Engineering in Medicine and Biology Society (EMBC). IEEE, 2148–2154.
- Aminifar et al. (2021d) Amin Aminifar, Fazle Rabbi, Violet Ka I Pun, and Yngve Lamo. 2021d. Monitoring motor activity data for detecting patients’ depression using data augmentation and privacy-preserving distributed learning. In 2021 43rd Annual International Conference of the IEEE Engineering in Medicine and Biology Society (EMBC). IEEE, 2163–2169.
- Aminifar et al. (2022) Amin Aminifar, Matin Shokri, Fazle Rabbi, Violet Ka I Pun, and Yngve Lamo. 2022. Extremely randomized trees with privacy preservation for distributed structured health data. IEEE Access 10 (2022), 6010–6027.
- Anzanpour et al. (2017) Arman Anzanpour, Iman Azimi, Maximilian Götzinger, Amir M. Rahmani, Nima TaheriNejad, Pasi Liljeberg, Axel Jantsch, and Nikil Dutt. 2017. Self-Awareness in Remote Health Monitoring Systems using Wearable Electronics. In Proceedings of Design and Test Europe Conference (DATE). Lausanne, Switzerland. http://jantsch.se/AxelJantsch/papers/2017/ArmanAnzanpour-DATE.pdf
- Apple (2023) Apple. 2023. Apple Watch Series 4 Specifications. https://support.apple.com/kb/SP778 Accessed on 03.04.2023.
- Arsalan et al. (2019) Aamir Arsalan, Muhammad Majid, Syed Muhammad Anwar, and Ulas Bagci. 2019. Classification of Perceived Human Stress using Physiological Signals. In 2019 41st Annual International Conference of the IEEE Engineering in Medicine and Biology Society (EMBC). 1247–1250. https://doi.org/10.1109/EMBC.2019.8856377
- Aubert et al. (2003) André E. Aubert, Bert Seps, and Frank Beckers. 2003. Heart Rate Variability in Athletes. Sports Medicine 33 (2003), 889–919.
- Aziz et al. (2017) Fathrul Azarshah Abdul Aziz, Mohd Ibrahim Shapiai, Noor Akhmad Setiawan, and Yasue Mitsukura. 2017. Classification of Human Concentration in EEG Signals using Hilbert Huang Transform. International Journal of Simulation–Systems, Science & Technology 18, 1 (2017).
- Balakrishnama and Ganapathiraju (1998) Suresh Balakrishnama and Aravind Ganapathiraju. 1998. Linear discriminant analysis-a brief tutorial. Institute for Signal and information Processing 18, 1998 (1998), 1–8.
- Başar et al. (2001) Erol Başar, Canan Başar-Eroglu, Sirel Karakaş, and Martin Schürmann. 2001. Gamma, alpha, delta, and theta oscillations govern cognitive processes. International Journal of Psychophysiology 39, 2 (2001), 241–248. https://doi.org/10.1016/S0167-8760(00)00145-8
- Benchekroun et al. (2022) Mouna Benchekroun, Baptiste Chevallier, Hamza Beaouiss, Dan Istrate, Vincent Zalc, Mohamad Khalil, and Dominique Lenne. 2022. Comparison of Stress Detection through ECG and PPG signals using a Random Forest-based Algorithm. In 2022 44th Annual International Conference of the IEEE Engineering in Medicine and Biology Society (EMBC). 3150–3153. https://doi.org/10.1109/EMBC48229.2022.9870984
- Berle et al. (2010) Jan O Berle, Erik R Hauge, Ketil J Oedegaard, Fred Holsten, and Ole B Fasmer. 2010. Actigraphic registration of motor activity reveals a more structured behavioural pattern in schizophrenia than in major depression. BMC research notes 3, 1 (2010), 1–7.
- Bhavani et al. (2022) T. Bhavani, P. VamseeKrishna, Chinmay Chakraborty, and Priyanka Dwivedi. 2022. Stress Classification and Vital Signs Forecasting for IoT-Health Monitoring. IEEE/ACM Transactions on Computational Biology and Bioinformatics (2022), 1–8. https://doi.org/10.1109/TCBB.2022.3196151
- Bonhage et al. (2017) Corinna E. Bonhage, Lars Meyer, Thomas Gruber, Angela D. Friederici, and Jutta L. Mueller. 2017. Oscillatory EEG dynamics underlying automatic chunking during sentence processing. NeuroImage 152 (2017), 647–657. https://doi.org/10.1016/j.neuroimage.2017.03.018
- Can et al. (2020) Yekta Said Can, Niaz Chalabianloo, Deniz Ekiz, Javier Fernandez-Alvarez, Giuseppe Riva, and Cem Ersoy. 2020. Personal Stress-Level Clustering and Decision-Level Smoothing to Enhance the Performance of Ambulatory Stress Detection With Smartwatches. IEEE Access 8 (2020), 38146–38163. https://doi.org/10.1109/ACCESS.2020.2975351
- Chandel and Ghose (2018) Vivek Chandel and Avik Ghose. 2018. Demo Abstract: EMeasure: Using a Smart Device with Consumer-Grade Accelerometer as an Accurate Measuring Scale. In 2018 17th ACM/IEEE International Conference on Information Processing in Sensor Networks (IPSN). 114–115. https://doi.org/10.1109/IPSN.2018.00020
- Chen and Guestrin (2016) T Chen and C Guestrin. 2016. XGBoost: A scalable tree boosting system. In Proceedings of the 22nd acm sigkdd international conference on knowledge discovery and data mining.
- Choi et al. (2020) Rene Y Choi, Aaron S Coyner, Jayashree Kalpathy-Cramer, Michael F Chiang, and J Peter Campbell. 2020. Introduction to machine learning, neural networks, and deep learning. Translational vision science & technology 9, 2 (2020), 14–14.
- Choksatchawathi et al. (2020) Tanut Choksatchawathi, Puntawat Ponglertnapakorn, Apiwat Ditthapron, Pitshaporn Leelaarporn, Thayakorn Wisutthisen, Maytus Piriyajitakonkij, and Theerawit Wilaiprasitporn. 2020. Improving Heart Rate Estimation on Consumer Grade Wrist-Worn Device Using Post-Calibration Approach. IEEE Sensors Journal 20, 13 (2020), 7433–7446. https://doi.org/10.1109/JSEN.2020.2979191
- Cortes and Vapnik (1995a) Corinna Cortes and Vladimir Vapnik. 1995a. Support-vector networks. Machine learning 20, 3 (1995), 273–297.
- Cortes and Vapnik (1995b) C Cortes and V Vapnik. 1995b. Support-vector networks. Machine learning (1995).
- Das et al. (2018) Deepan Das, Shreyasi Datta, Tanuka Bhattacharjee, Anirban Dutta Choudhury, and Arpan Pal. 2018. Eliminating Individual Bias to Improve Stress Detection from Multimodal Physiological Data. In 2018 40th Annual International Conference of the IEEE Engineering in Medicine and Biology Society (EMBC). 5753–5758. https://doi.org/10.1109/EMBC.2018.8513680
- de Vries et al. (2023) Herman de Vries, Hilbrand Oldenhuis, Cees van der Schans, Robbert Sanderman, and Wim Kamphuis. 2023. Does Wearable-Measured Heart Rate Variability During Sleep Predict Perceived Morning Mental and Physical Fitness? Applied Psychophysiology and Biofeedback (2023), 1–11.
- Dell’Agnola et al. (2022) Fabio Dell’Agnola, Ping-Keng Jao, Adriana Arza, Ricardo Chavarriaga, José del R Millán, Dario Floreano, and David Atienza. 2022. Machine-Learning Based Monitoring of Cognitive Workload in Rescue Missions With Drones. IEEE Journal of Biomedical and Health Informatics 26, 9 (2022), 4751–4762.
- Dey et al. (2017) Jishnu Dey, Tanmoy Bhowmik, Saswata Sahoo, and Vijay Narayan Tiwari. 2017. Wearable PPG sensor based alertness scoring system. In 2017 39th Annual International Conference of the IEEE Engineering in Medicine and Biology Society (EMBC). 2422–2425. https://doi.org/10.1109/EMBC.2017.8037345
- Dias and Cunha (2018) Duarte Dias and João Paulo Silva Cunha. 2018. Wearable Health Devices—Vital Sign Monitoring, Systems and Technologies. Sensors (Basel, Switzerland) 18 (2018).
- Emotiv (2023) Emotiv. 2023. Emotiv EPOC+ Specifications. https://www.emotiv.com/epoc/ Accessed on 03.04.2023.
- Empatica (2023a) Empatica. 2023a. Empatica E4 Specifications. https://www.empatica.com/research/e4/ Accessed on 03.04.2023.
- Empatica (2023b) Empatica. 2023b. Empatica EmbracePlus. https://www.empatica.com/en-eu/platform/research-studies Accessed on 03.04.2023.
- Faedda et al. (2016) Gianni L Faedda, Kyoko Ohashi, Mariely Hernandez, Cynthia E McGreenery, Marie C Grant, Argelinda Baroni, Ann Polcari, and Martin H Teicher. 2016. Actigraph measures discriminate pediatric bipolar disorder from attention-deficit/hyperactivity disorder and typically developing controls. Journal of Child Psychology and Psychiatry 57, 6 (2016), 706–716.
- Fitbit (2024) Fitbit. 2024. Fitbit. https://myhelp.fitbit.com/s/home?language=en_US Accessed on 05.02.2024.
- Forooghifar et al. (2019) Farnaz Forooghifar, Amir Aminifar, Leila Cammoun, Ilona Wisniewski, Carolina Ciumas, Philippe Ryvlin, and David Atienza. 2019. A self-aware epilepsy monitoring system for real-time epileptic seizure detection. Mobile Networks and Applications (2019), 1–14.
- Forooghifar et al. (2021) Farnaz Forooghifar, Amin Aminifar, Tomas Teijeiro, Amir Aminifar, Jesper Jeppesen, Sandor Beniczky, and David Atienza. 2021. Self-aware anomaly-detection for epilepsy monitoring on low-power wearable electrocardiographic devices. In 2021 IEEE 3rd International Conference on Artificial Intelligence Circuits and Systems (AICAS). IEEE, 1–4.
- Freismuth and TaheriNejad (2022) D. Freismuth and N. TaheriNejad. 2022. On the Treatment and Diagnosis of Attention Deficit Hyperactivity Disorder with EEG Assistance. Electronics Journal (2022), 1–18.
- Freund and Schapire (1997) Yoav Freund and Robert E. Schapire. 1997. A decision-theoretic generalization of on-line learning and an application to boosting. Journal of computer and system sciences 55, 1 (1997), 119–139.
- Friedman (2001) Jerome H Friedman. 2001. Greedy function approximation: a gradient boosting machine. Annals of statistics (2001), 1189–1232.
- Gaikwad and Paithane (2017) Pallavi Gaikwad and A. N. Paithane. 2017. Novel approach for stress recognition using EEG signal by SVM classifier. In 2017 International Conference on Computing Methodologies and Communication (ICCMC). 967–971. https://doi.org/10.1109/ICCMC.2017.8282611
- Garcia-Ceja et al. (2015) Enrique Garcia-Ceja, Venet Osmani, and Oscar Mayora. 2015. Automatic stress detection in working environments from smartphones’ accelerometer data: a first step. IEEE journal of biomedical and health informatics 20, 4 (2015), 1053–1060.
- Garcia-Ceja et al. (2018) Enrique Garcia-Ceja, Michael Riegler, Petter Jakobsen, Jim Tørresen, Tine Nordgreen, Ketil J Oedegaard, and Ole Bernt Fasmer. 2018. Depresjon: a motor activity database of depression episodes in unipolar and bipolar patients. In Proceedings of the 9th ACM multimedia systems conference. 472–477.
- Garmin (2023a) Garmin. 2023a. Garmin tactix® Charlie. https://www.garmin.com/en-US/p/623921#specs Accessed on 03.04.2023.
- Garmin (2023b) Garmin. 2023b. Garmin tactix® Charlie. https://developer.garmin.com/connect-iq/api-docs/Toybox/Sensor/SensorData.html Accessed on 03.04.2023.
- Gedam and Paul (2021) Shruti Gedam and Sanchita Paul. 2021. A Review on Mental Stress Detection Using Wearable Sensors and Machine Learning Techniques. IEEE Access 9 (2021), 84045–84066. https://doi.org/10.1109/ACCESS.2021.3085502
- Ghamari (2018) Mohammad Ghamari. 2018. A review on wearable photoplethysmography sensors and their potential future applications in health care. International Journal of Biosensors & Bioelectronics 4, 4 (2018). https://doi.org/10.15406/ijbsbe.2018.04.00125
- Goldberger et al. (2000) A L Goldberger, L A Amaral, L Glass, J M Hausdorff, P C Ivanov, R G Mark, J E Mietus, G B Moody, C K Peng, and H E Stanley. 2000. PhysioBank, PhysioToolkit, and PhysioNet: components of a new research resource for complex physiologic signals. Circulation 101, 23 (June 2000), E215–20.
- González-Cañete and Casilari (2021) Francisco Javier González-Cañete and Eduardo Casilari. 2021. A Feasibility Study of the Use of Smartwatches in Wearable Fall Detection Systems. Sensors 21, 6 (2021). https://doi.org/10.3390/s21062254
- Götzinger et al. (2019) M. Götzinger, A. Anzanpour, I. Azimi, N. TaheriNejad, A. Jantsch, A. Rahmani, and P. Liljeberg. 2019. Confidence-Enhanced Early Warning Score Based on Fuzzy Logic. ACM/Springer Mobile Networks and Applications (August 2019), 1–18. https://doi.org/10.1007/s11036-019-01324-5
- Götzinger et al. (2017) Maximilian Götzinger, Arman Azanpour, Iman Azimi, Nima Taherinejad, and Amir M Rahmani. 2017. Enhancing the Self-Aware Early Warning Score System through Fuzzified Data Reliability Assessment. In International Conference on Wireless Mobile Communication and Healthcare. Springer.
- Götzinger et al. (2016) Maximilian Götzinger, Nima Taherinejad, Amir M Rahmani, Pasi Liljeberg, Axel Jantsch, and Hannu Tenhunen. 2016. Enhancing the early warning score system using data confidence. In International Conference on Wireless Mobile Communication and Healthcare. Springer, 91–99.
- Gouthaman et al. (2014) Sumit Gouthaman, Atman Pandya, Omkar Karande, and D. R. Kalbande. 2014. Gesture detection system using smart watch based motion sensors. In 2014 International Conference on Circuits, Systems, Communication and Information Technology Applications (CSCITA). 311–316. https://doi.org/10.1109/CSCITA.2014.6839278
- Guo et al. (2003) Gongde Guo, Hui Wang, David Bell, Yaxin Bi, and Kieran Greer. 2003. KNN model-based approach in classification. In On The Move to Meaningful Internet Systems 2003: CoopIS, DOA, and ODBASE: OTM Confederated International Conferences, CoopIS, DOA, and ODBASE 2003, Catania, Sicily, Italy, November 3-7, 2003. Proceedings. Springer, 986–996.
- Hadizadeh et al. (2020) E. Hadizadeh, M. Elmi, N. TaheriNejad, A. Fotowat, and S. Mirabbasi. 2020. A Low-Power Signal-Dependent Sampling Technique: Analysis, Implementation, and Application. IEEE Transactions on Circuits and Systems I: Regular Papers (2020), 1–14.
- Hafshejani et al. (2021) Ehsan Hadizadeh Hafshejani, Nima TaheriNejad, Rozhan Rabbani, Zohreh Azizi, Shahabeddin Mohin, Ali Fotowat-Ahmady, and Shahriar Mirabbasi. 2021. Self-aware Data Processing for Power Saving in Resource-Constrained IoT Cyber-Physical Systems. IEEE Sensors Journal (2021), 1–12. https://doi.org/10.1109/JSEN.2021.3133405
- Hassan et al. (2020) Reshad Hassan, Sakib Hasan, Md. Jubaer Hasan, Md. Rafat Jamader, David Eisenberg, and Tanmoy Pias. 2020. Human Attention Recognition with Machine Learning from Brain-EEG Signals. In 2020 IEEE 2nd Eurasia Conference on Biomedical Engineering, Healthcare and Sustainability (ECBIOS). 16–19. https://doi.org/10.1109/ECBIOS50299.2020.9203672
- Heo et al. (2021) Seongsil Heo, Sunyoung Kwon, and Jaekoo Lee. 2021. Stress Detection With Single PPG Sensor by Orchestrating Multiple Denoising and Peak-Detecting Methods. IEEE Access 9 (2021), 47777–47785. https://doi.org/10.1109/ACCESS.2021.3060441
- Ho (1995) TK Ho. 1995. Random decision forests. In Proceedings of 3rd international conference on document analysis and recognition. IEEE.
- Hogervorst et al. (2014) Maarten A. Hogervorst, Anne-Marie Brouwer, and Jan B. F. van Erp. 2014. Combining and comparing EEG, peripheral physiology and eye-related measures for the assessment of mental workload. Frontiers in Neuroscience 8 (2014), 322. https://doi.org/10.3389/fnins.2014.00322
- Hovsepian et al. (2015) Karen Hovsepian, Mustafa al’Absi, Emre Ertin, Thomas Kamarck, Motohiro Nakajima, and Santosh Kumar. 2015. CStress: Towards a Gold Standard for Continuous Stress Assessment in the Mobile Environment. In Proceedings of the 2015 ACM International Joint Conference on Pervasive and Ubiquitous Computing (Osaka, Japan) (UbiComp ’15). Association for Computing Machinery, New York, NY, USA, 493–504. https://doi.org/10.1145/2750858.2807526
- Huang et al. (2006) Guang-Bin Huang, Qin-Yu Zhu, and Chee-Kheong Siew. 2006. Extreme learning machine: Theory and applications. Neurocomputing 70, 1 (2006), 489–501. https://doi.org/10.1016/j.neucom.2005.12.126 Neural Networks.
- InteraXon (2023a) InteraXon. 2023a. InteraXon Muse 2 Specifications. https://choosemuse.com/muse-2/ Accessed on 03.04.2023.
- InteraXon (2023b) InteraXon. 2023b. InteraXon Muse S Specifications. https://choosemuse.com/muse-s/ Accessed on 03.04.2023.
- InteraXon (2023c) InteraXon. 2023c. Muse Direct Update. https://choosemuse.force.com/s/article/Muse-Direct-Subscription-Update Accessed on 03.04.2023.
- Iranfar et al. (2021) Arman Iranfar, Adriana Arza, and David Atienza. 2021. Relearn: A robust machine learning framework in presence of missing data for multimodal stress detection from physiological signals. In 2021 43rd Annual International Conference of the IEEE Engineering in Medicine and Biology Society (EMBC). IEEE, 535–541.
- Jadeja (2021) Neville M. Jadeja. 2021. Frequencies and Rhythms. Cambridge University Press, 32–39. https://doi.org/10.1017/9781108918923.008
- Jahanjoo et al. (2020) Anice Jahanjoo, Marjan Naderan, and Mohammad Javad Rashti. 2020. Detection and multi-class classification of falling in elderly people by deep belief network algorithms. Journal of Ambient Intelligence and Humanized Computing 11 (2020), 4145–4165.
- Jahanjoo et al. (2017) Anice Jahanjoo, Marjan Naderan Tahan, and Mohammad Javad Rashti. 2017. Accurate fall detection using 3-axis accelerometer sensor and MLF algorithm. In 2017 3rd International Conference on Pattern Recognition and Image Analysis (IPRIA). 90–95. https://doi.org/10.1109/PRIA.2017.7983024
- Jahanjoo et al. (2024) Anice Jahanjoo, Nima TaheriNejad, and Amin Aminifar. 2024. High-Accuracy Stress Detection Using Wrist-Worn PPG Sensors. In 2024 IEEE International Symposium on Circuits and Systems (ISCAS). IEEE.
- Jakobsen et al. (2020) Petter Jakobsen, Enrique Garcia-Ceja, Lena Antonsen Stabell, Ketil Joachim Oedegaard, Jan Oystein Berle, Vajira Thambawita, Steven Alexander Hicks, Pål Halvorsen, Ole Bernt Fasmer, and Michael Alexander Riegler. 2020. Psykose: A motor activity database of patients with schizophrenia. In 2020 IEEE 33rd International Symposium on Computer-Based Medical Systems (CBMS). IEEE, 303–308.
- Khooyooz and Sardouie (2022) Soheil Khooyooz and Sepideh Hajipour Sardouie. 2022. Classification of Motor and Mental Imagery EEG Signals in BCI Systems Based on Signal-to-Image Conversion. In 2022 29th National and 7th International Iranian Conference on Biomedical Engineering (ICBME). 124–128. https://doi.org/10.1109/ICBME57741.2022.10052897
- Kwon et al. (2020) Soonil Kwon, Joonki Hong, Eue-Keun Choi, Byunghwan Lee, Changhyun Baik, Euijae Lee, Eui-Rim Jeong, Bon-Kwon Koo, Seil Oh, Yung Yi, et al. 2020. Detection of atrial fibrillation using a ring-type wearable device (CardioTracker) and deep learning analysis of photoplethysmography signals: prospective observational proof-of-concept study. Journal of Medical Internet Research 22, 5 (2020), e16443.
- Landau (1967) H.J. Landau. 1967. Sampling, data transmission, and the Nyquist rate. Proc. IEEE 55, 10 (1967), 1701–1706. https://doi.org/10.1109/PROC.1967.5962
- Lee et al. (2018) H. Lee, Y. Kim, and C. Park. 2018. Classification of human attention to multimedia lecture. In 2018 International Conference on Information Networking (ICOIN). 914–916. https://doi.org/10.1109/ICOIN.2018.8343256
- Lin and Van Helleptte (2021) Qiuyang Lin and Nick Van Helleptte. 2021. PPG Sensors for The New Normal: A Review. In 2021 18th International SoC Design Conference (ISOCC). 276–277. https://doi.org/10.1109/ISOCC53507.2021.9613962
- Ltd (2023) Neeuro Pte Ltd. 2023. Senzeband - Specifications. https://www.neeuro.com/senzeband/product-features Accessed on 03.04.2023.
- Macrotellect (2023a) Macrotellect. 2023a. BrainLink Developers SDK. https://o.macrotellect.com/2020/Developers.html Accessed on 03.04.2023.
- Macrotellect (2023b) Macrotellect. 2023b. BrainLink Pro Specifications. https://o.macrotellect.com/#v1 Accessed on 03.04.2023.
- Malcolm Arnold et al. (2008) J. Malcolm Arnold, David H. Fitchett, Jonathan G. Howlett, Eva M. Lonn, and Jean-Claude Tardif. 2008. Resting heart rate: A modifiable prognostic indicator of cardiovascular risk and outcomes? Canadian Journal of Cardiology 24 (2008). https://doi.org/10.1016/s0828-282x(08)71019-5
- Maskeliunas et al. (2016) Rytis Maskeliunas, Robertas Damasevicius, Ignas Martisius, and Mindaugas Vasiljevas. 2016. Consumer-grade EEG devices: are they usable for control tasks? PeerJ 4 (2016), e1746.
- Mehrabadi et al. (2020) Milad Asgari Mehrabadi, Iman Azimi, Fatemeh Sarhaddi, Anna Axelin, Hannakaisa Niela-Vilén, Saana Myllyntausta, Sari Stenholm, Nikil Dutt, Pasi Liljeberg, Amir M Rahmani, et al. 2020. Sleep tracking of a commercially available smart ring and smartwatch against medical-grade actigraphy in everyday settings: instrument validation study. JMIR mHealth and uHealth 8, 11 (2020), e20465.
- Mobovi (2023) Mobovi. 2023. MoboviTic Watch Pro 3 Ultra GPS. https://www.mobvoi.com/us/pages/ticwatchpro3ultra
- Mobvoi (2023) Mobvoi. 2023. Ticwatch Pro Specifications. https://www.mobvoi.com/us/pages/ticwatchpro3ultra
- Momeni et al. (2021) Niloofar Momeni, Adriana Arza Valdés, João Rodrigues, Carmen Sandi, and David Atienza. 2021. CAFS: cost-aware features selection method for multimodal stress monitoring on wearable devices. IEEE Transactions on Biomedical Engineering 69, 3 (2021), 1072–1084.
- Montesinos et al. (2019) Victoriano Montesinos, Fabio Dell’Agnola, Adriana Arza, Amir Aminifar, and David Atienza. 2019. Multi-modal acute stress recognition using off-the-shelf wearable devices. In 2019 41st Annual International Conference of the IEEE Engineering in Medicine and Biology Society (EMBC). IEEE, 2196–2201.
- Motiv (2023) Motiv. 2023. Moriv ring Specifications. https://www.mymotiv.com/ Accessed on 28.08.2023.
- Mukhamediev et al. (2021) Ravil I Mukhamediev, Adilkhan Symagulov, Yan Kuchin, Kirill Yakunin, and Marina Yelis. 2021. From classical machine learning to deep neural networks: a simplified scientometric review. Applied Sciences 11, 12 (2021), 5541.
- Navalta et al. (2020) James W Navalta, Jeffrey Montes, Nathaniel G Bodell, Robert W Salatto, Jacob W Manning, and Mark DeBeliso. 2020. Concurrent heart rate validity of wearable technology devices during trail running. Plos one 15, 8 (2020), e0238569.
- Neurosky (2023) Neurosky. 2023. Neurosky MindWave Mobile Specifications. https://store.neurosky.com/pages/mindwave Accessed on 03.04.2023.
- Nicolò et al. (2020) Andrea Nicolò, Carlo Massaroni, Emiliano Schena, and Massimo Sacchetti. 2020. The Importance of Respiratory Rate Monitoring: From Healthcare to Sport and Exercise. Sensors 20, 21 (2020). https://doi.org/10.3390/s20216396
- Nyein Chan et al. (2021) Khune Satt Nyein Chan, Chadchai Srisurangkul, Nattawoot Depaiwa, and Setthaluth Pangkreung. 2021. DETECTION OF DRIVER DROWSINESS FROM EEG SIGNALS USING WEARABLE BRAIN SENSING HEADBAND. TSME Journal (01 2021). https://doi.org/10.14456/jrame.2021.14]
- OpenBCI (2023) OpenBCI. 2023. Openbci Specifications. https://docs.openbci.com/ Accessed on 03.04.2023.
- Orlandic et al. (2021) Lara Orlandic, Adriana Arza Valdes, and David Atienza. 2021. Wearable and Continuous Prediction of Passage of Time Perception for Monitoring Mental Health. In 2021 IEEE 34th International Symposium on Computer-Based Medical Systems (CBMS). IEEE, 444–449.
- oura team (2023) oura team. 2023. Technology in the Oura Ring. https://ouraring.com/blog/ring-technology/
- Peláez et al. (2019) María Dolores Coca Peláez, María Teresa Lozano Albalate, Alberto Hernando Sanz, Montserrat Aiger Vallés, and Eduardo Gil. 2019. Photoplethysmographic Waveform Versus Heart Rate Variability to Identify Low-Stress States: Attention Test. IEEE Journal of Biomedical and Health Informatics 23, 5 (2019), 1940–1951. https://doi.org/10.1109/JBHI.2018.2882142
- Perego et al. (2018) P. Perego, A. M. Rahmani, and N. Taherinejad. 2018. Wireless Mobile Communication and Healthcare. Springer International Publishing.
- Perego et al. (2021) P. Perego, N. Taherinejad, and Maurizio Caon. 2021. Wearables in Healthcare. Springer International Publishing.
- Pinge et al. (2022) Anuja Pinge, Soumyadip Bandyopadhyay, Surjya Ghosh, and Sougata Sen. 2022. A Comparative Study between ECG-based and PPG-based Heart Rate Monitors for Stress Detection. In 2022 14th International Conference on COMmunication Systems & NETworkS (COMSNETS). 84–89. https://doi.org/10.1109/COMSNETS53615.2022.9668342
- Polar (2023) Polar. 2023. Polar OH1 Specifications. https://www.polar.com/us-en/products/accessories/oh1-optical-heart-rate-sensor Accessed on 03.04.2023.
- Polar (2024) Polar. 2024. Polar BLE SDK. GitHub. https://github.com/polarofficial/polar-ble-sdk
- Pollreisz and Nejad (2020) David Pollreisz and Nima Taheri Nejad. 2020. Reliable Respiratory Rate Extraction using PPG. In 2020 IEEE 11th Latin American Symposium on Circuits Systems (LASCAS). 1–4. https://doi.org/10.1109/LASCAS45839.2020.9068993
- Pollreisz and TaheriNejad (2017) D. Pollreisz and N. TaheriNejad. 2017. A simple algorithm for emotion recognition, using physiological signals of a smart watch. In 2017 39th Annual International Conference of the IEEE Engineering in Medicine and Biology Society (EMBC). 2353–2356. https://doi.org/10.1109/EMBC.2017.8037328
- Pollreisz and Taherinejad (2019) David Pollreisz and Nima Taherinejad. 2019. Detection and Removal of Motion Artifacts in PPG Signals. Mobile Networks and Applications (08 2019). https://doi.org/10.1007/s11036-019-01323-6
- Pollreisz and TaheriNejad (2020a) David Pollreisz and Nima TaheriNejad. 2020a. Efficient Respiratory Rate Extraction on a Smartwatch. In 2020 42nd Annual International Conference of the IEEE Engineering in Medicine and Biology Society (EMBC). 5988–5991. https://doi.org/10.1109/EMBC44109.2020.9175470
- Pollreisz and TaheriNejad (2020b) Davd Pollreisz and Nima TaheriNejad. 2020b. Reliable Respiratory Rate Extraction using PPG. In 11th IEEE Latin American Symposium on Circuits and Systems – LASCAS. San José, Costa Rica, 1–4.
- Popescu et al. (2009) Marius-Constantin Popescu, Valentina E Balas, Liliana Perescu-Popescu, and Nikos Mastorakis. 2009. Multilayer perceptron and neural networks. WSEAS Transactions on Circuits and Systems 8, 7 (2009), 579–588.
- Purnamasari and Junika (2019) Prima Dewi Purnamasari and Tsalsabilla Winny Junika. 2019. Frequency-based EEG Human Concentration Detection System Methods with SVM Classification. In 2019 IEEE International Conference on Cybernetics and Computational Intelligence (CyberneticsCom). 29–34. https://doi.org/10.1109/CYBERNETICSCOM.2019.8875677
- Quinlan (1986) JR Quinlan. 1986. Induction of decision trees. Machine learning (1986).
- Reuderink et al. (2009) Boris Reuderink, Anton Nijholt, and Mannes Poel. 2009. Affective Pacman: A frustrating game for brain-computer interface experiments. In Intelligent Technologies for Interactive Entertainment: Third International Conference, INTETAIN 2009, Amsterdam, The Netherlands, June 22-24, 2009. Proceedings 3. Springer, 221–227.
- Rochette and Vergely (2017) Luc Rochette and Catherine Vergely. 2017. Hans Selye and the stress response: 80 years after his “letter” to the Editor of Nature. Annales de Cardiologie et d’Angéiologie 66 (07 2017). https://doi.org/10.1016/j.ancard.2017.04.017
- Rodrigues et al. (2020) João Rodrigues, Erik Studer, Stephan Streuber, Nathalie Meyer, and Carmen Sandi. 2020. Locomotion in virtual environments predicts cardiovascular responsiveness to subsequent stressful challenges. Nature communications 11, 1 (2020), 5904.
- Sadek et al. (2018) Ibrahim Sadek, Edwin Seet, Jit Biswas, Bessam Abdulrazak, and Mounir Mokhtari. 2018. Nonintrusive Vital Signs Monitoring for Sleep Apnea Patients: A Preliminary Study. IEEE Access 6 (2018), 2506–2514. https://doi.org/10.1109/ACCESS.2017.2783939
- Samson and Koh (2020) Cheyenne Samson and Ahyeon Koh. 2020. Stress Monitoring and Recent Advancements in Wearable Biosensors. Frontiers in Bioengineering and Biotechnology 8 (2020), 1037. https://doi.org/10.3389/fbioe.2020.01037
- Sandhu et al. (2017) Vedant Sandhu, Aung Aung Phyo Wai, and Chih Ying Ho. 2017. Evaluation of learning performance by quantifying user’s engagement investigation through low-cost multi-modal sensors. In 2017 International Conference on Orange Technologies (ICOT). 180–183. https://doi.org/10.1109/ICOT.2017.8336117
- Sawangjai et al. (2020) Phattarapong Sawangjai, Supanida Hompoonsup, Pitshaporn Leelaarporn, Supavit Kongwudhikunakorn, and Theerawit Wilaiprasitporn. 2020. Consumer Grade EEG Measuring Sensors as Research Tools: A Review. IEEE Sensors Journal 20, 8 (2020), 3996–4024. https://doi.org/10.1109/JSEN.2019.2962874
- Schmidt et al. (2018) Philip Schmidt, Attila Reiss, Robert Duerichen, Claus Marberger, and Kristof Van Laerhoven. 2018. Introducing wesad, a multimodal dataset for wearable stress and affect detection. In Proceedings of the 20th ACM international conference on multimodal interaction. 400–408.
- Schuurmans et al. (2020) Angela Schuurmans, Peter de Looff, Karin Nijhof, Catarina Rosada, Ron Scholte, Arne Popma, and Roy Otten. 2020. Validity of the Empatica E4 Wristband to Measure Heart Rate Variability (HRV) Parameters: a Comparison to Electrocardiography (ECG). Journal of medical systems 44 (09 2020), 190. https://doi.org/10.1007/s10916-020-01648-w
- Shaffer and Ginsberg (2017) Fred Shaffer and Jay P Ginsberg. 2017. An overview of heart rate variability metrics and norms. Frontiers in public health (2017), 258.
- Shakibhamedan et al. (2024) Salar Shakibhamedan, Amin Aminifar, Nima Taherinejad, and Axel Jantsch. 2024. EASE: Energy Optimization through Adaptation – A Review of Runtime Energy-Aware Approximate Deep Learning Algorithms. TechRxiv (2024). https://doi.org/10.36227/techrxiv.170723230.09169589/v1
- Shamir et al. (1999) Merav Shamir, Leonid Eidelman, Yizhar Floman, Leon Kaplan, and Reuven Pizov. 1999. Pulse oximetry plethysmographic waveform during changes in blood volume. British journal of anaesthesia 82 (03 1999), 178–81. https://doi.org/10.1093/bja/82.2.178
- SkyLabs (2023a) SkyLabs. 2023a. CART ring Specifications. https://skylabs.io/cart/ Accessed on 28.08.2023.
- SkyLabs (2023b) SkyLabs. 2023b. Garmin HRM Dual Specifications. https://www.garmin.com/de-AT/p/649059#undefined Accessed on 28.08.2023.
- SkyLabs (2023c) SkyLabs. 2023c. Polar H10 Specifications. https://www.polar.com/at-de/sensors/h10-heart-rate-sensor Accessed on 28.08.2023.
- Slobogean et al. (2015) Gerard P Slobogean, Peter V Giannoudis, Frede Frihagen, Mary L Forte, Saam Morshed, and Mohit Bhandari. 2015. Bigger data, bigger problems. Journal of orthopaedic trauma 29 (2015), S43–S46.
- Smarr et al. (2020) Benjamin L Smarr, Kirstin Aschbacher, Sarah M Fisher, Anoushka Chowdhary, Stephan Dilchert, Karena Puldon, Adam Rao, Frederick M Hecht, and Ashley E Mason. 2020. Feasibility of continuous fever monitoring using wearable devices. Scientific reports 10, 1 (2020), 1–11.
- Sopic et al. (2018) Dionisije Sopic, Amir Aminifar, and David Atienza. 2018. e-glass: A wearable system for real-time detection of epileptic seizures. In 2018 IEEE International Symposium on Circuits and Systems (ISCAS). IEEE, 1–5.
- Sopic et al. ([n.d.]) Dionisije Sopic, Tomas Teijeiro, David Atienza, Amir Aminifar, and Philippe Ryvlin. [n.d.]. Personalized seizure signature: An interpretable approach to false alarm reduction for long-term epileptic seizure detection. Epilepsia ([n. d.]).
- Surrel et al. (2018) Grégoire Surrel, Amir Aminifar, Francisco Rincón, Srinivasan Murali, and David Atienza. 2018. Online obstructive sleep apnea detection on medical wearable sensors. IEEE transactions on biomedical circuits and systems 12, 4 (2018), 762–773.
- TaheriNejad (2019) N TaheriNejad. 2019. Wearable medical devices: challenges and self-aware solutions. IEEE life sciences newsletter (2019), 5–6.
- TaheriNejad (2020) N. TaheriNejad. 2020. Functional or Fictional. IEEE Life Sciences Special Issue on: Consumer Technology meets Health Care (February 2020), 13–15.
- TaheriNejad et al. (2016) N. TaheriNejad, A. Jantsch, and D. Pollreisz. 2016. Comprehensive Observation and its Role in Self-Awareness; An Emotion Recognition System Example. In the Federated Conference on Computer Science and Information Systems (FedCSIS).
- TaheriNejad and Pollreisz (2016) Nima TaheriNejad and David Pollreisz. 2016. Assessment of Physiological Signals during Happiness, Sadness, Pain or Anger. In 6th MobiHealth.
- TaheriNejad and Rahmati (2020) N. TaheriNejad and Y. Rahmati. 2020. Blood Pressure Estimation using a Single PPG Signal. In 2nd EAI International Conference on Wearables in Healthcare (Healthwear 2020). 1–9.
- TaheriNejad et al. (2017) N. TaheriNejad, M. A. Shami, and S. M. P. D. 2017. Self-aware sensing and attention-based data collection in Multi-Processor System-on-Chips. In 2017 15th IEEE International New Circuits and Systems Conference (NEWCAS). 81–84. https://doi.org/10.1109/NEWCAS.2017.8010110
- Tazarv et al. (2023) Ali Tazarv, Sina Labbaf, Stephanie M. Reich, Nikil Dutt, Amir M. Rahmani, and Marco Levorato. 2023. Personalized Stress Monitoring using Wearable Sensors in Everyday Settings. arXiv:2108.00144 [cs.LG]
- Umair et al. (2021) Muhammad Umair, Niaz Chalabianloo, Corina Sas, and Cem Ersoy. 2021. HRV and Stress: A Mixed-Methods Approach for Comparison of Wearable Heart Rate Sensors for Biofeedback. IEEE Access 9 (2021), 14005–14024. https://doi.org/10.1109/ACCESS.2021.3052131
- Wan and Guo (2020) Boxin Wan and Junqi Guo. 2020. Learning Immersion Assessment Model Based on Multi-dimensional Physiological Characteristics. In 2020 IEEE International Conference on Power, Intelligent Computing and Systems (ICPICS). 87–90. https://doi.org/10.1109/ICPICS50287.2020.9202208
- Watch (2024) Polar Watch. 2024. Polar Watch M430 specifications. https://www.polar.com/en/products/sport/m430-gps-running-watch Accessed on 18.02.2024.
- Xing et al. (2019) Xiaoman Xing, Zhimin Ma, Mingyou Zhang, Ying Zhou, Wenfei Dong, and Mingxuan Song. 2019. An Unobtrusive and Calibration-free Blood Pressure Estimation Method using Photoplethysmography and Biometrics. Scientific Reports 9, 1 (June 2019), 8611. https://doi.org/10.1038/s41598-019-45175-2
- Xiong et al. (2021) Dezhen Xiong, Daohui Zhang, Xingang Zhao, and Yiwen Zhao. 2021. Deep learning for EMG-based human-machine interaction: A review. IEEE/CAA Journal of Automatica Sinica 8, 3 (2021), 512–533.
- Yin et al. (2018) Hongxu Yin, Ayten Ozge Akmandor, Arsalan Mosenia, and Niraj K. Jha. 2018. Smart Healthcare. Foundations and Trends® in Electronic Design Automation 12, 4 (2018), 401–466. https://doi.org/10.1561/1000000054
- You (2021) Shingchern D You. 2021. Classification of Relaxation and Concentration Mental States with EEG. Information 12, 5 (2021), 187.
- Ysehak Abay (2018) Tomas Ysehak Abay. 2018. Photoplethysmography for blood volumes and oxygenation changes during intermittent vascular occlusions. Journal of clinical monitoring and computing 32 (06 2018). https://doi.org/10.1007/s10877-017-0030-2
- Zeghlache et al. (2022) Rachid Zeghlache, Mohamed Aymen Labiod, and Abdelhamid Mellouk. 2022. Driver vigilance estimation with Bayesian LSTM Auto-encoder and XGBoost using EEG/EOG data. IFAC-PapersOnLine 55, 8 (2022), 89–94.
- Zhang et al. (2016) Zhan Zhang, Yufei Song, Liqing Cui, Xiaoqian Liu, and Tingshao Zhu. 2016. Emotion recognition based on customized smart bracelet with built-in accelerometer. PeerJ 4 (07 2016), e2258. https://doi.org/10.7717/peerj.2258
- Zheng and Lu (2017) Wei-Long Zheng and Bao-Liang Lu. 2017. A multimodal approach to estimating vigilance using EEG and forehead EOG. Journal of neural engineering 14, 2 (2017), 026017.