Dynamical Geometry of the Haldane Model under a Quantum Quench
Abstract
We explore the time evolution of a topological system when the system undergoes a sudden quantum quench within the same nontrivial phase. Using Haldane’s honeycomb model as an example, we show that equilibrium states in a topological phase can be distinguished by geometrical features, such as the characteristic momentum at which the half-occupied edge modes cross, the associated edge-mode velocity, and the winding vector about which the normalized pseudospin magnetic field winds along a great circle on the Bloch sphere. We generalize these geometrical quantities for non-equilibrium states and use them to visualize the quench dynamics of the topological system. In general, we find the pre-quench equilibrium state relaxes to the post-quench equilibrium state in an oscillatory fashion, whose amplitude decay as . In the process, however, the characteristic winding vector of the non-equilibrium system can evolve to regimes that are not reachable with equilibrium states.
I Introduction
Quantum entanglement measures nonclassical correlation among different parts of a quantum system and is an essential resource for quantum information and quantum computation [1]. Of different entanglement properties, entanglement spectrum is particularly insightful as a diagnostic of topological order, as first emphasized by Li and Haldane [2]. Beyond fractional quantum Hall states [3, 4, 5, 6], it has been subsequently applied to a variety of topological systems, among which are topological band insulators [7, 8], spin chains [9, 10], Chern insulators [11, 12, 13, 14], and Kitaev’s honeycomb model [15]. Rapid development of quantum computers also makes it a reality to experimentally measure the entanglement spectrum of topological phases of matter [16, 17].
For topological quantum states, general correspondence exists between entanglement spectrum and the edge state spectrum [18, 19, 20, 21, 12]. In noninteracting fermion systems, the entanglement spectrum can be calculated efficiently through the spectrum of the correlation matrix in a subsystem [22]. In an explicit calculation of Haldane’s honeycomb lattice model, Huang and Arovas [12, 13] identified the momentum of the half entanglement occupation where the zigzag edge state crossing and the half-odd-integer Wannier centers occur. The dynamics of entanglement spectrum after a quench has also been studied to detect the dynamical topology [23, 24, 25]. In particular, the spectral crossings at half entanglement occupation has been proposed to be a robust topological signature [23]. The crossings in the entanglement spectrum evolution can also reveal non-Hermitian dynamical topology of open and driven quantum systems [26, 27].
Due to the immense interest in topology in condensed matter physics, the studies of quench dynamics have focused on identifying the topological signatures in the time evolution of quantum many-body systems [28, 30, 29]. The information beyond the topological characterization can also be of interest, not just for qualitative studies. In the fractional quantum Hall effect, Haldane [31] proposed that the Laughlin state should be understood as a family of wave functions [32], all with the same topology, but different geometry. Geometrical parameter can thus be introduced for anisotropic quantum Hall systems to characterize the shape of correlation holes. Quantum quenches under a sudden tilt of magnetic field, which changes the geometrical parameter, reveals the oscillatory response of the long-wavelength limit of the Girvin-MacDonald-Platzman magnetoroton [33]. Geometrical quenches in bilayer fractional quantum Hall states can also induce nonequilibrium dynamics related to the collective dipole mode [34].
It is, then, an interesting question to ask whether the indicator of topology in the entanglement spectrum can exhibit dynamical geometrical features that are related to a sudden quench within the same topological phase. In fact, the dynamical properties, such as the crossing momentum , are quantitatively well-defined (in an initial time window) [35], just as dynamical topology [23, 24, 25, 26, 27], even though the time-evolving wave function does not match any of the equilibrium ground states [35] with the same topological index. In this sense, they are driven purely by mismatches in geometric characterization of the system.
In this paper, we use Haldane’s honeycomb lattice model as a concrete example to systematically study the time evolution of systems with nontrivial topology under sudden quantum quench that preserves the topology. We first focus on the condition for the momentum of the half entanglement occupation, whose existence signals the presence of nontrivial topology. We show that, using the pseudospin magnetic field formalism, we can map the dynamical problem into an equilibrium one, leading to a generalized equation for with a geometrical interpretation. On the one hand, a general geometrical quench leads to oscillation of with amplitude decreases as . In the stationary-phase approximation, the dominant frequencies and the amplitude decrease can be attributed to the coherent superposition of interband excitations. On the other hand, for pre- and post-quench equilibrium states with the same , time evolution of the geometrical information is encoded in the oscillating slope of the edge mode, or edge-mode velocity, in the entanglement spectrum, whose amplitude increases as . We unify the two apparently different quench processes with a unit-vector representation of the non-equilibrium system, by the so-called winding vector [36, 37], and show that the time evolution of the topological system upon quench can be visualized by the winding vector trajectory on the Bloch sphere. As a result, we find that even quench within the same topological phase leads to states whose winding vector cannot be mapped to the equilibrium states.
The paper is organized as follows. In Sec. II we review Haldane’s model and the solution for in the pseudospin magnetic field formalism that can be straightforwardly generalized to the non-equilibrium case. We derive the dynamical condition for the half-entanglement-occupation mode in Sec. III and analyze the time evolution of in the stationary-phase approximation. In Sec. IV we discuss the additional information on the time evolution of the non-equilibrium system in the entanglement velocity. We define the dynamical winding vector in Sec. V and show that its evolution can be used in generic cases to visualize the geometrical information in the non-equilibrium states. We summarize and discuss its potential generalizations in Sec. VI.
II Model and Equilibrium Properties
II.1 Haldane’s honeycomb model
To model a quantum Hall system without Landau levels, Haldane introduced a 2D honeycomb model for spinless lattice fermions with zero total flux [38]:
| (1) |
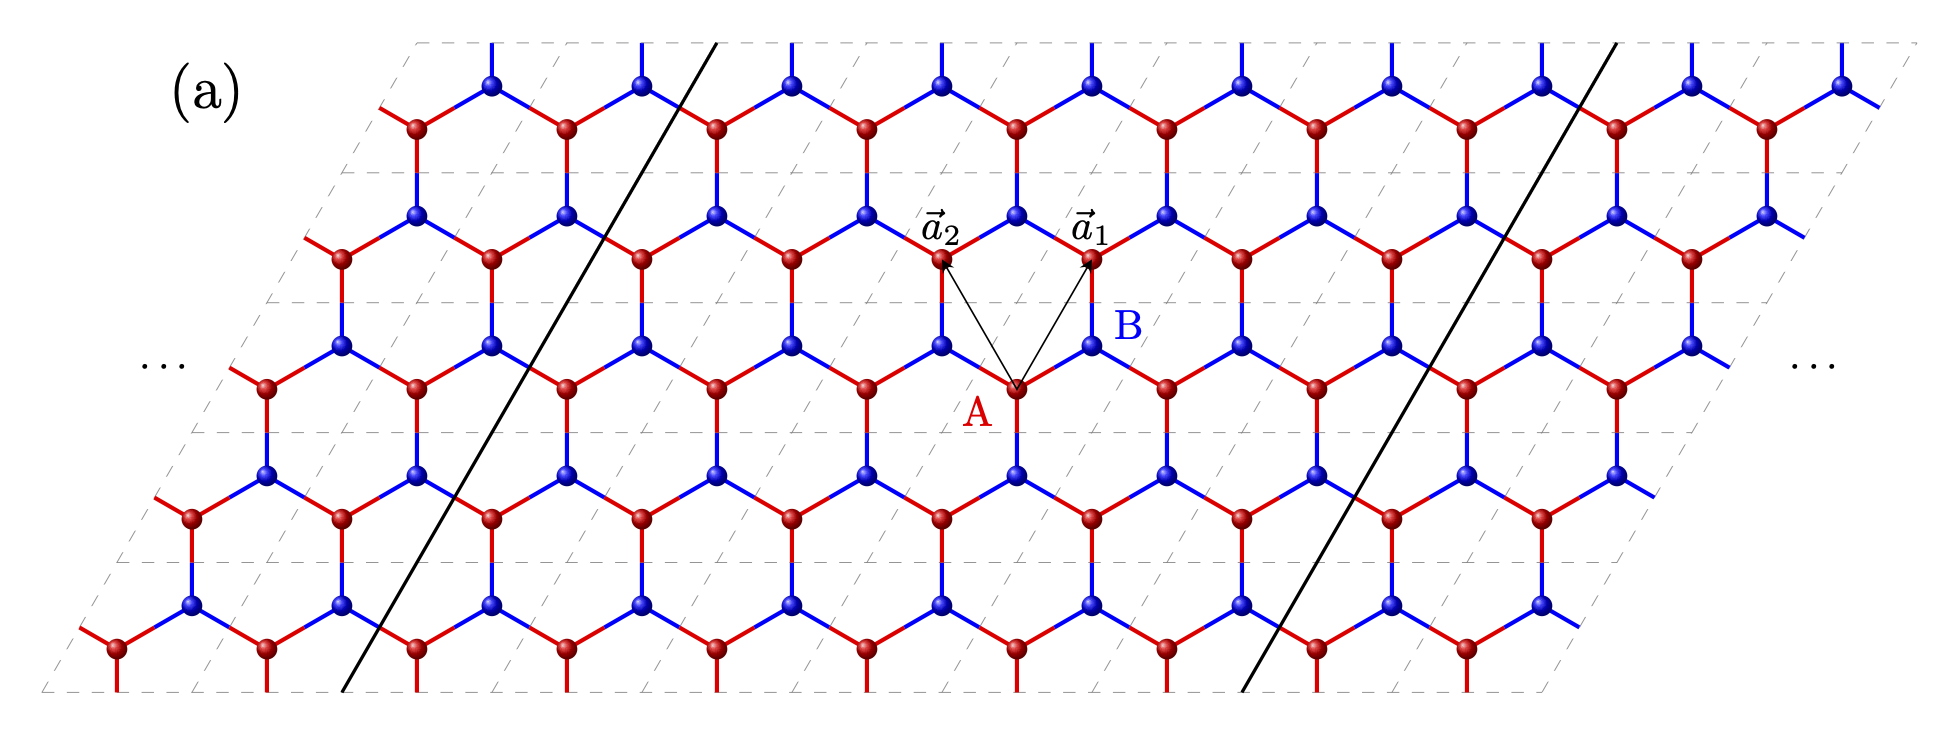
where () annihilates (creates) a fermion at site , see Fig. 1(a). The nearest neighbor hopping strength is set to , while the next-nearest neighbor hopping strength with time-reversal symmetry breaking phase , whose sign depends on its direction. The inversion symmetry breaking on-site energy and are introduced on and sites, respectively.
Using periodic boundary conditions for the 2D lattice with unit cells, the operator acting on position , are integers, of the sublattice in the momentum space is
| (2) |
with the primitive vectors , the reciprocal vectors , and the crystal momenta along directions. The Bloch Hamiltonian can be written in a pseudospin form as
| (3) |
with and Pauli matrices . The pseudospin magnetic field and the energy shift are
| (4) |
The energies of the two bands are , and we consider a system with a fully filled lower band (annihilated by with ) and an empty upper band (annihilated by with ) with
| (5) |
where are the polar and azimuthal angles parameterizing . The ground state wavefunction is
| (6) |
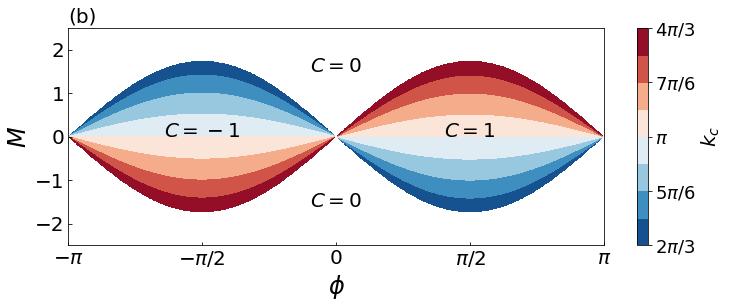
The Chern index of the ground state is . The phase diagram contains two topological phases () and a trivial phase (), as illustrated in Fig. 1(b). The phase boundary can be obtained by the gap vanishing equation .
II.2 Entanglement spectrum
The system is set up on a torus periodic in both directions, and we choose the subsystem with two edges running in parallel to the direction separated by distance , as shown in Fig. 1(a). The entanglement spectrum in such a free-fermion system can be obtained from the correlation matrix restricted in the subsystem with matrix element [39, 22]
| (7) |
where label two sites in the subsystem. With a half-filling ground state, we have
| (8) |
where , and
| (9) | |||||
where is the identity matrix. Because of translation invariance of the groundstate, and has a block-Toeplitz matrix structure.
Because the partition maintains the translation invariance along direction, the full entanglement spectrum is organized into distinct sectors for the correlation matrix with elements
| (10) |
where labels the unit cell along the direction of the subsystem ( is the total system length in that direction). The eigenvalues of the correlation matrix , known as the one-particle entanglement spectrum (OPES), are distributed between 0 and 1. Note that in the literature, e.g., Refs. [39, 22], the correlation matrix is conventionally defined as , where it shares the same eigenspectrum with of Eq. (7).
An alternative way to understand is to define a quadratic entanglement Hamiltonian
| (11) |
through , where diagonalizes the correlation matrix defined in Eq. (10). The set of are commonly referred to as the entanglement spectrum, while the OPES can be thought of as its Fermi-Dirac distribution function at temperature , or the entanglement occupation.
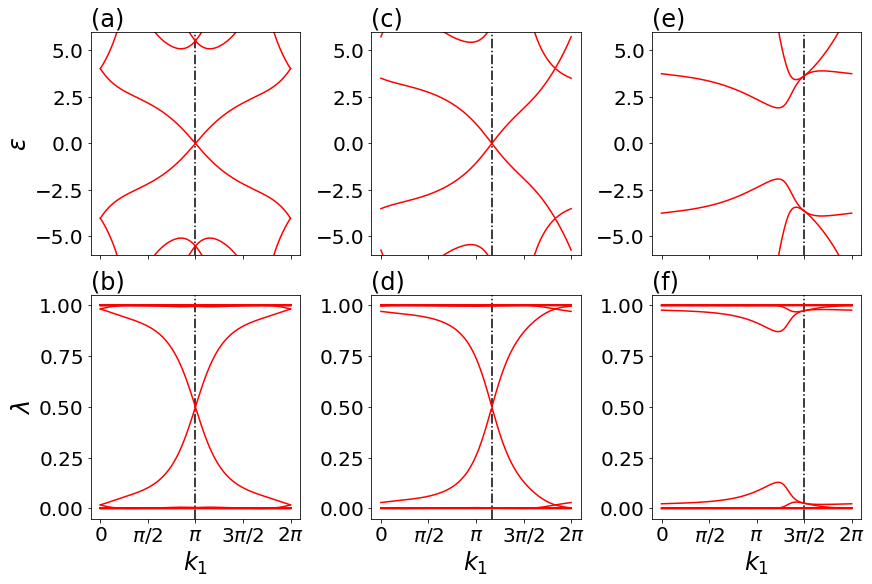
Examples of the entanglement spectra and OPES are shown in Fig. 2 for the three sets of , , and for (without loss of generality, we fix the ratio value in the rest of the work). In the topologically nontrivial phase, the spectra feature counter-propagating edge modes that meet at a characteristic momentum , at which or . We, thus, refer to the two degenerate modes at as entanglement zero modes, which do not exist in topologically trivial phase, e.g., at and , as illustrated in Fig. 2(e).
As the existence of degenerate or quasi-degenerate in-gap edge modes in 1D systems, the existence of such entanglement zero modes are hallmark of the corresponding topological phase. But unlike in the 1D case, the degrees freedom in the extra dimension carries additional geometrical information that allows us to refine our characterization of the topological states.
II.3 Equilibrium entanglement crossing
We now focus on the crossing in the OPES at or, equivalently, at in the ES. For this purpose, we can restrict our discussion to the OPES, which can be simply obtained by diagonalizing the correlation matrix. When external parameters, such as and , change within the same topological phase, the crossing or the pair of zero modes in the ES cannot be removed. However, the characteristic edge momentum , at which the zero modes appear, depends on the external parameters, as reflected in Figs. 2(a) and (c). They correspond to a left-going and a right-going mode on opposite sides of the subsystem.
For the convenience of the later discussion, we highlight now the key steps in determining the location of in the context of OPES. We define a scaled-and-shifted correlation matrix . We note that in -space
| (12) |
which can be recognized as the operator that measures the pseudospin along the direction and whose eigenvalues vary between -1 and 1. Obviously, the operator shares the same eigenstates as the original Hamiltonian and can be used to identify phases.
Similarly, for each sector, we have
| (13) |
where is a block-Toeplitz matrix, in which all 22 blocks in any diagonal are the same partial Fourier transform of , such that
| (14) |
where
| (15) |
for . Here we take for large . Notice that the eigenvalues of fall into the range of and the spectral crossing corresponds to vanishing eigenvalues.
Huang and Arovas [13] showed that in the equilibrium case the entanglement spectrum crossing, the edge spectrum crossing, and the half-odd-integer Wannier center coincide at the same and calculated explicitly with the following wave-function ansatz for edge modes:
| (16) |
where is the wave function on sublattice describing its decay into the bulk, and
| (17) |
where is a complex number, describes the relative wave function in the unit cell. At the crossing where , we have
| (18) |
We note that a sufficient condition to solve the matrix equation is to ignore the structure of and demand
| (19) |
for all 22 blocks of . We can further require
| (20) |
for all . We note that the operator
| (21) |
is a unitary operator that rotates the state by an angle about the axis, and Eq. (20) states that its expectation value vanishes, i.e.,
| (22) |
Geometrically, this means that are coplanar and lie on a great circle of the Bloch sphere. If we define the normal direction of the circle as , the two eigenstates of are and for any . Alternatively, we can write the coplanarity condition of the pseudospin magnetic field as
| (23) |
for arbitrary , , .
For the Haldane model, the pseudospin magnetic field can be alternatively written as
| (24) |
whose tip yields an ellipse for a given . The center of the ellipse is , while the two axes are and . They are explicitly given by
| (25) | ||||
One can, equivalently, state the coplanarity condition as the coplanarity of , , and , i.e.,
| (26) |
and we can identify as the unit vector along . Therefore, we obtain the equation of as
| (27) |
This, however, is not a sufficient condition, as can be either positive or negative. For nontrivial topology to exist, the origin must be enclosed by the ellipse; in other words, we must have
| (28) |
which rules out the solution for and . In other words, is restricted between and , specifically, between and for and between and for . The contour plot of for various and is shown in Fig. 1(b) for the two nontrivial phases.
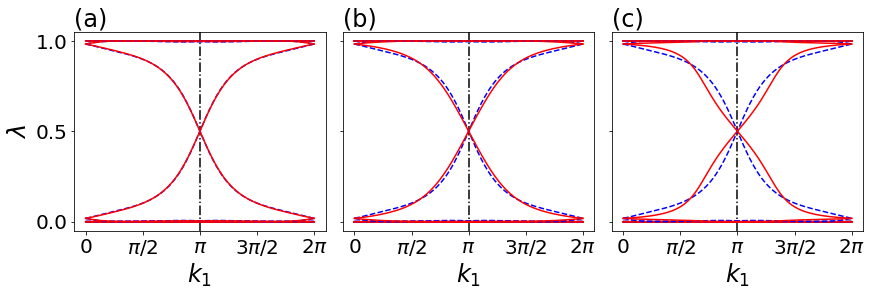

We note that even though can be used to characterize topological states with various combinations of , the single number alone is not complete in distinguishing all possible state. For example, all states along share the same , as illustrated in Fig. 3. The difference in the OPES lies at the slopes of the edge modes. An alternative way to visualize the difference is to plot the unit vector
| (29) |
where the derivation and integral are carried out with respect to at fixed . Geometrically, is normal to the pseudospin magnetic field , i.e., along
| (30) |
as shown in Fig. 3(d)-(f). Its dependence on is encoded in the expression of in Eq. (27). It is worthy pointing out that when the chiral symmetry is preserved, i.e., or , the vector is restricted in the - plane. In particular, the point with and at the center of the phase has
| (31) |
While the change of leads to a rotation of in the - plane, a small change of by leads to a linear change in , hence we find
| (32) |
i.e., a rotation of away from the - plane. Therefore, we find that is a more complete description of the topology of the corresponding system than the identification of the zero modes at .
The study of winding characteristics of appears in graphene ribbons relating to the presence/absence of edge modes [40]. There, the quasi-one-dimensional problem is a graphene of finite extent along one direction. The presence of edge states (or zero modes) in the energy spectrum, depending on the types of termination, is equivalent to a non-trivial Zak phase for for running from to . More recently, the concept of supplementing the topological index by a unit vector with geometrical information also occurs in the context of merging and emergence of a pair of Dirac points [36, 37]. One defines the winding vector with
| (33) |
where is the normalized psudospin magnetic field for a Bloch Hamiltonian . As in the present case, the inclusion of the geometry of winding axes is crucial in revealing the evolution of the pair of Dirac points. For the same reason, we refer to the unit vector as the winding vector, which provides further information than the momentum crossing .
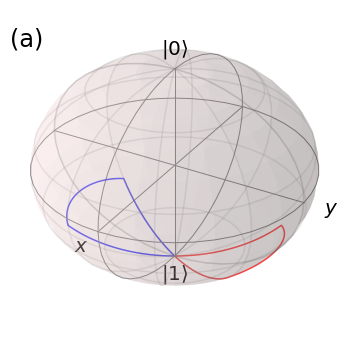
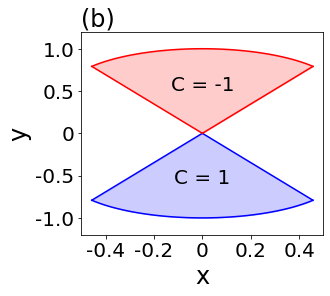
Fig. 4(a) illustrates the regions on the Bloch sphere that are covered by the head of the winding vector for the two topological phases with (enclosed by blue curves) and (enclosed by red curves). The two regions head-to-head touch at state , which corresponds to the critical state with and where a topological phase transition from to occurs. We plot the stereographic projection of the two regions to the plane tangent to state in Fig. 4(b). In this plot the two regions map to two fans connected at their vertices head-to-head. The straight lines map to the boundaries of the topological phases, i.e., and , or . Interestingly, the two arcs map to the , which is inside the corresponding topological phases. As and represent the same state, the pair form a two-to-one mapping to . Therefore, we conclude that only a small portion of the Bloch sphere represents the equilibrium topological phases in the Haldane model.
III Non-equilibrium entanglement crossing
We now consider the dynamical case under a sudden change of the Hamiltonian from to at . The state of the system after the quantum quench evolves unitarily as , where we set . The time-dependent correlation matrix in -space, again, has a form as
| (34) |
where is the dynamical pseudospin magnetic field, which can be regarded as the pre-quench precessing about the post-quench with a Larmor frequency . Explicitly, we can express as the sum of three mutually orthogonal vectors:
| (35) |
where
| (36) | ||||
| (37) | ||||
| (38) |
Note that . Therefore, the calculation of the dynamical OPES is technically identical to that in the equilibrium case. While the long-time quench behavior is determined by the time-independent , we are interested here in the short-time dynamics determined by the oscillatory terms in the plane perpendicular to .
As in the equilibrium case, we can define , so the time-dependent correlation matrix in the subsystem is
| (39) |
where has the identical form as in Eq. (14). In each block, we have
| (40) |
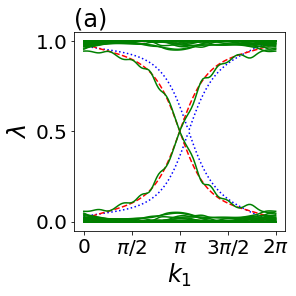
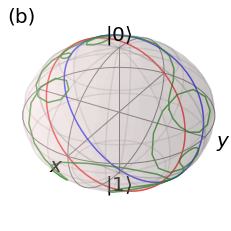
As we have discussed, we restrict ourselves to the quantum quench within the same topological phase (), such that the topology of the system remains unchanged upon the quench. As an example, we consider a quench from to at with fixed . In Figure 5(a) show the OPES for the dynamical system with at . Close to the equilibrium of the post-quench Hamiltonian, the spectrum has a well-defined zero-mode crossing, but the edge modes show wiggles away from the crossing. As demonstrated in Fig. 5(b), the coplanarity condition for is not valid in the dynamical case. In this section, we answer the following questions, which naturally arise from the observation above. How can one calculate the value of in the non-equilibrium case? What is the geometrical interpretation of the condition of the crossing? What can we learn from the evolution of ?
Before we proceed to answer these questions, we emphasize the time scale of our interest. According to the Calabrese-Cardy picture [41, 42], quasiparticles travel along with a maximum velocity after the quench, which defines a characteristic time in our system. For , quasiparticles excited from the zero mode at one edge of the subsystem (which is assumed to be no larger than the other subsystem ) do not have enough time to travel to the other edge, the degenerate zero modes do not have significant overlap, so they do not split. During this time interval, the instantaneous entanglement crossing momentum is, thus, well defined. As we restrict ourselves to , we effectively take the thermodynamic limit (hence ) before we take the long-time limit .
III.1 Conditions for the non-equilibrium entanglement crossing
In the non-equilibrium case, to follow the evolution of the geometric winding vector, we need to extract the evolution of an effective great circle traced by for running from to , from the pre-quench great circle at time to the post-quench ones at with a generalized coplanarity condition. The lowest-order nontrivial approximation is equivalent to truncating , the time-dependent version of Eq. (14), into a tridiagonal one:
| (41) |
In other words, can be solved by retaining in the inverse Fourier transform from Eq. (40) its first harmonics
| (42) |
with which we can extract an effective pseudo-magnetic field , such that . If we recast
| (43) |
we immediately find
| (44) |
Therefore, to solve for , we only need to study , whose tip traces an ellipse as varies. Compared to the complex trace of in Eq. (35), we have effectively filtered out the fast-varying components. We can follow the reasoning in the equilibrium case and assert that at we have similarly
| (45) |
We can identify the coplanarity condition of the pseudospin magnetic field as the coplanarity of , , and , i.e.,
| (46) |
After straightforward algebras, we arrive at the following triple-integral condition
| (47) |
where and is defined in Eq. (35) for the dynamical case. The result can be regarded as the relaxation of the equilibrium coplanarity condition at to the non-equilibrium case. The stronger coplanarity condition in Eq. (23) reincarnates now as a time-dependent factor in the integrand, which is modulated by a static geometrical factor that depends only on momenta, but not on the band structure.
III.2 Dynamics of the entanglement crossing momentum
Let us come back to the example in Fig. 5 and explore in detail the dynamics after the system quenches from to at with fixed . We determine by Eq. (III.1) and plot its evolution in Fig. 6(a) for . The entanglement spectrum crossing shows decaying oscillations around the post-quench , starting from the pre-quench at . The Fourier transformation of exhibits two sharp peaks in the frequency space, as shown in Fig. 6(b). The values of the peaks coincide with the extrema of the post-quench interband excitation energy at , as illustrated in Fig. 6(c). For comparison, we also plot the pre-quench interband excitation energy, whose extrema match three different frequencies. The observation implies that the interband excitations play an important role in the quench dynamics, especially near the extrema where the density of states is singular.
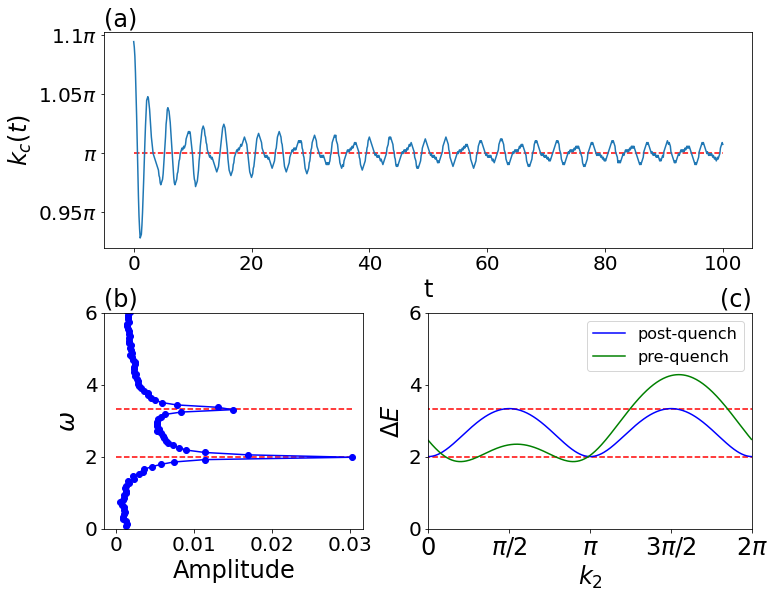
To understand the dependence of on , we need to evaluate and , which are defined in Eq. (40). The results from solving Eq. (41) agree very well with those directly obtained from the numerical calculation of the OPES without approximations, which implies that the edge-state ansatz wave function and the tridiagonal approximation of the correlation matrix are well justified. As varies, the post-quench pseudospin magnetic field oscillates, whose magnitude enters the frequency of the dynamical pseudospin magnetic field . For sufficiently large , the phase of this oscillating factor varies rapidly except in the neighborhood of the stationary points of , at which . There are four stationary points for a given in the Haldane model [Eq. (4)], two with positive curvatures, which we label as and , the other two with negative ones, which we label as and . They correspond to the locations of the van Hove singularities in the density of states, and the corresponding frequency is the interband excitation energy for the post-quench Hamiltonian. In the following, we use the stationary phase approximation to analyze the dominant contributions near with and .
Starting from Eq. (40), we can first separate the correlation matrix into a steady-state contribution and a time-dependent one:
| (48) | |||||
where we have
| (49) |
and
| (50) |
Alternatively, we expect that, according to definitions in Eq. (43), can also be separated into steady-state and time-dependent contributions
| (51) |
In particular, we have at , so is simply the momentum of the entanglement zero modes of the pre-quench Hamiltonian. In the long time limit (), however, the time-dependent terms in oscillate so rapidly that s vanish. Effectively, we have , whose unit vector for each pair is identical to , so approaches , the momentum of the entanglement zero modes of the post-quench Hamiltonian. In other words, we expect
| (52) |
In practice, the time-dependent terms are small compared with the steady-state contributions for not too small , so the time-dependent zero-mode momentum varies in the vicinity of , where we can linearize the triple product,
| (53) |
In general, can be calculated from Eq. (46) in which we can expand and neglect the high-order terms in and arrive at
| (54) | |||||
where all and are evaluated at .
We can proceed by expanding around the saddle points for given , such that
| (55) |
where . Both the real and imaginary parts of can then be calculated by performing Gaussian integrals by noticing
| (56) |
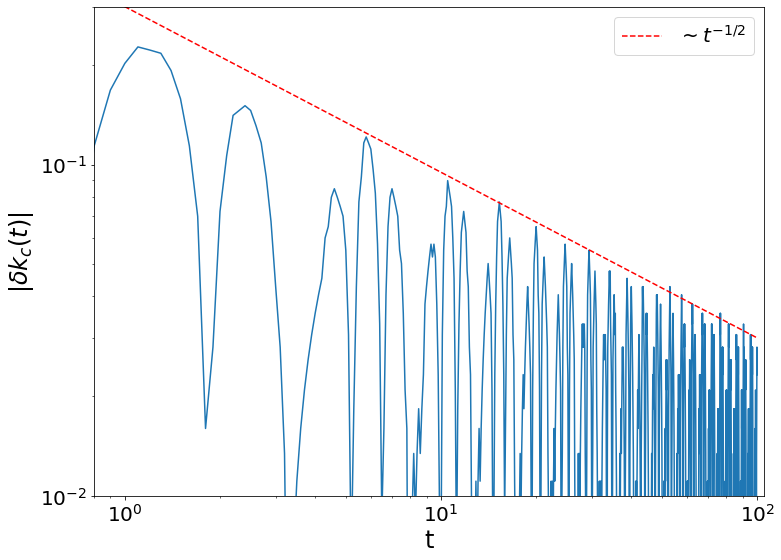
where . In the stationary phase approximation, the leading contributions to the integral of thus come from the stationary points with and . They oscillate with frequency being the corresponding energy gap at different with a common decay of , resulting from the Gaussian integrals. Accidentally, the corresponding integrands in may vanish as near the saddle points, in which case . This, however, does not happen for all , so the leading correction in is still dominated by . Therefore, the zero-mode momentum starts from at and oscillates around with the amplitude decreasing as , and the dominant frequencies of the oscillations correspond to the interband excitation energies at the stationary points. Figure 7 plots on a double-logarithmic scale. The peaks of the curve are roughly bound by the red dashed line, which goes as and is a guide to the eye. This demonstrates that the oscillations are dominated by the excitations around stationary points.
IV Dynamics of the entanglement velocity
So far, we have discussed the quantum quench within the same topological phase, and the pre- and post-quench equilibrium states are characterized by different entanglement crossing momentum . As a result, the dynamical crossing starts from the pre-quench and oscillates around the post-quench . This seems to suggest that the dynamics not associated with the decaying oscillatory behavior of is trivial, e.g., when the pre- and post-quench equilibrium states share the same . This happens, in particular, when we fix before and after the quench, such that .
This cannot be correct because if we increase the distance between the post- and pre-quench states in the phase diagram, we eventually arrive at a sudden quench from one topological phase (say, ) to another () with fixed . Even though is not changed in this case, the sign change of the topological index indicates that the equilibrium edge modes on the same open boundaries change their directions accordingly. It is then an intriguing question to ask what dynamical behavior is the precursor of edge-mode direction change in the same-phase ( to 1) quenches along . Such a connection to the corresponding topological quench is natural as the dynamics of discussed so far can be thought of as the precursor of the topological transition from the phase to the phase. In the latter, the solution of Eq. (26) yields a that violates Eq. (28) for nontrivial topology to exist. This points us to the change of slope or velocity of the edge mode in the entanglement spectrum.
As we mentioned in the equilibrium case at the end of Sec. II.3, the entanglement crossing momentum is not complete in describing the edge modes in the vicinity of the crossing, hence distinguishing the topological states. It can be complemented, e.g., by the entanglement velocity, i.e., the slope of the edge modes at the crossing,
| (57) |
For simplicity, we consider quench far from the phase boundary such that the edge modes decay sufficiently fast. In the tridiagonal approximation in Eq. (41), we can make a first-order perturbation in the vicinity of to calculate the edge-mode entanglement energy by
| (58) |
where
| (59) |
with s defined in Eqs. (36)-(38). The dependence of on is encoded explicitly in the effective pseudospin magnetic field. As discussed in Sec. III.2, can be split into two terms, corresponding to the steady-state and time-dependent contributions. Accordingly, we can write
| (60) |
where
| (61) | |||||
| (62) |
For sufficiently large , we notice the leading contribution in comes from the derivatives of the fast oscillating and with respect to , which yield an explicit factor of . Combined with the additional factor of from the stationary-phase approximation, we expect that the envelope of the oscillation of goes as as increases. The prefactor increases with the difference between the post- and pre-quench states.
For a concrete example, we consider an system quenching from to with fixed , in which case a pair of zero modes persists at where we can numerically calculate the entanglement velocity from the entanglement spectrum in the absence of the tridiagonal approximation. As shown in Fig. 8(a), the velocity develops rapid oscillations whose amplitude increases with . The red dashed line indicates the corresponding velocity if we set in Eq. (35), which can be regarded as the long-time limit after the oscillations die out in the presence of dissipations. As we have analyzed for , we calculate the frequency spectrum of and find that it is dominated by the modes near the maximum of the excitation gap for the post-quench Hamiltonian, as shown in Fig. 8(b) and (c). At the minimum of the gap, however, we only find a shoulder in the spectrum. Following the same arguments for in Sec. III.2, we can understand that the velocity oscillations reflect, again, the interband excitations, because the prefactor of the time dependence is dominated by the energy gap at the four stationary points.
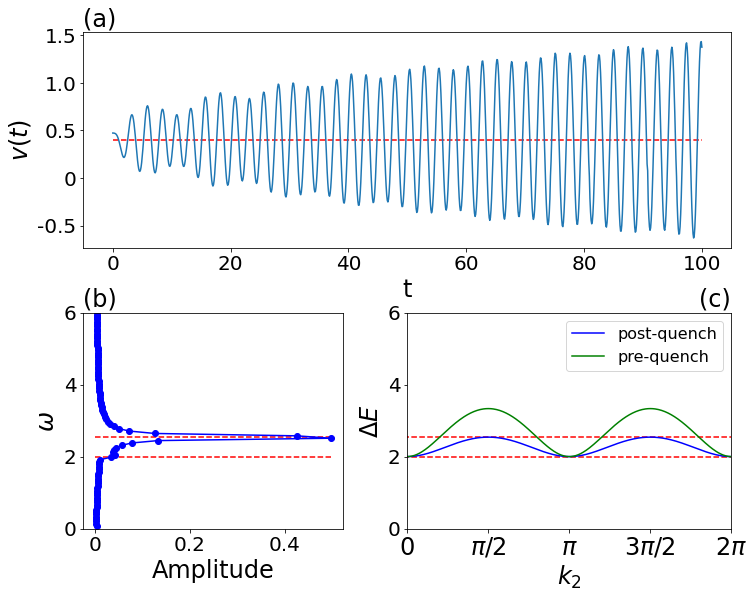
The sign of the velocity is important. The bipartition in this study creates two artificial edges, along each of which lives a branch of edge modes. Together, they manifest a zero-mode crossing in the entanglement spectrum and correspond to two velocities of opposite signs. To study the evolution of the velocity, we must fix our focus on a single edge and monitor the change of the slope near the corresponding zero mode.
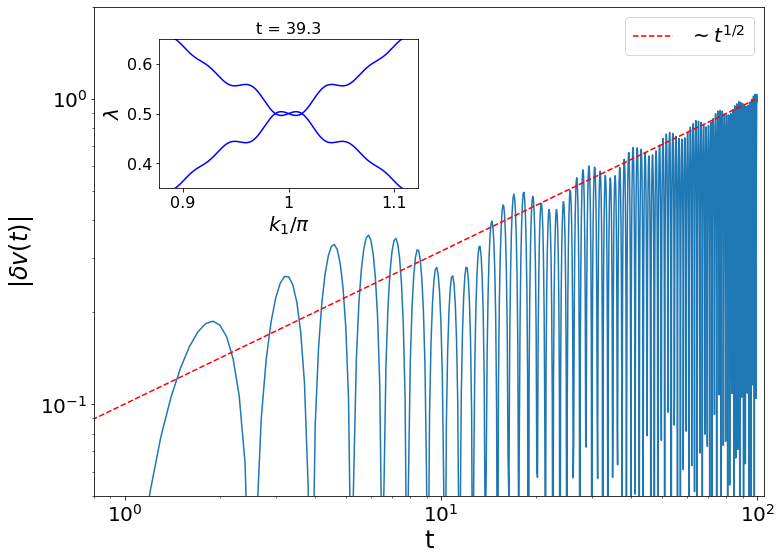
Fig. 9 plots the velocity oscillations on a double-logarithmic scale. As we discussed above, the curve is roughly bound by a trend that goes as . In addition, the oscillations show a beating pattern, which is consistent with the energy difference of the two extremal excitation gaps. The increasing amplitude in the velocity oscillations guarantees its sign change after sufficiently long time in a large enough sample, which indicates a reconstruction of the edge mode and the appearance of counterpropagating edge states. As a result, additional entanglement crossings appear, as shown in the OPES at , at which the sign change can be observed in Fig. 8(a). The additional crossings appear in pairs around , hence preserve the nontrivial topology of the system.
V Evolution of Dynamical Winding Vector
In Fig. 3 we showed that the entanglement velocity complements the zero-mode momentum in describing different topological states with the same Chern index. While it is tempting to use the combination of and to describe the dynamical evolution of the topological state, the distinct time dependence of the two variables hints that they cannot be put on equal footing in the non-equilibrium case. In particular, the amplitude of the oscillations in increases without bound in the long-time limit. Such oscillations are associated with particles exciting between the two bands and are dominated by the stationary points of the excitation gap. Thus, the geometrical information encoded in the velocity is expected to be washed out gradually by the ever increasing oscillations. Besides, we can obtain only after we calculate at a give time; this also makes the two variables not compatible. We, therefore, turn our attention to the winding vector in the equilibrium case and study its counterpart in the non-equilibrium case.
In the equilibrium case, represents the plane on which the pseudospin magnetic field vector winds. In particular, is perpendicular to both and that span the plane. In the non-equilibrium case, however, does not wind on a plane. But, as we have shown in Sec. III.1, after filtering away high-frequency components, we recover the equilibrium decomposition of into time-dependent , , and , which allow us to define the non-equilibrium , again, as
| (63) |
Let us return to the example in Sec. IV, in which the system quenches from to with fixed . In this case, a pair of zero modes persists at and is confined within the - plane. We define and plot it as a function of time in Fig. 10(a). We find that oscillates with a decreasing amplitude, whose spectral analysis in Figure 10(b) shows a similar peak and shoulder as in Fig. 8(b) for the entanglement velocity. The amplitude decays in a power law with exponent , the same as that of . In Fig. 10(c) we illustrate the oscillation of in the - plane by plot it with the Bloch sphere at several time, including [the initial with ] and [the final with ].


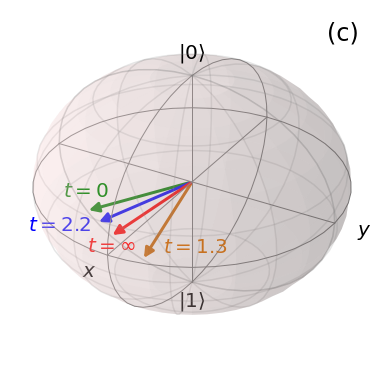
Generally, a complete description of the dynamical evolution of the system requires the specification of all . However, in this example we have shown that it is adequate to describe the non-equilibrium topological system by specifying a winding vector that defines a great circle on the Bloch sphere, around which winds, where is the generic zero-mode momentum associated with the nontrivial topology of the dynamical system. In this case, starts from the equilibrium value of the pre-quench Hamiltonian and approaches that of the post-quench Hamiltonian in an oscillatory fashion. The amplitude of the oscillations follows a power law with exponent , indicating that the range of constructive interference shrinks with time linearly. In this example we fix for both pre- and post-quench Hamiltonians so the chiral symmetry persists in the evolution. As a result, a single parameter, e.g. , is sufficient to describe the dynamics. The spectral analysis of the parameter allows us to find out the interband excitation gap edges and their corresponding weights.
More complex examples arise as the chiral symmetry is broken in either pre- or post-quench Hamiltonian, or both. For example, let us revisit the example in Sec. III.2, where the quench is from to with . In this case, we need to first calculate and then define through the Fourier transform of . Fig. 11(a) illustrates the evolution of the head of on the Bloch sphere. The arrow head appears to trace smaller and smaller figure-eight–like knots, indicating that converges again to that of the post-quench Hamiltonian in the long-time limit. The complex trace can again be illustrated by the stereographic projection to the plane tangent at the south pole (i.e., state ) of the Bloch sphere, as shown in Fig. 11(b) where time is indicated by the color map. For clarity, we only showed the portion for . The projected equilibrium for the pre- and post-quench Hamiltonians are represented by the blue and red dots, respectively. They are located on boundary of the blue-shadowed region, which corresponds to the set of equilibrium topological states with , as illustrated in Fig. 4, even though they are not on the phase boundary in the phase diagram of in Fig. 1.
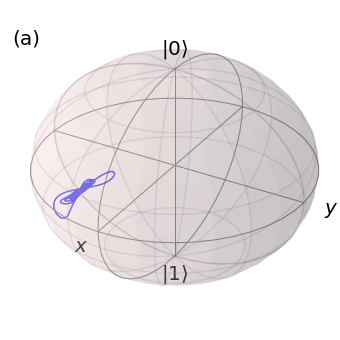
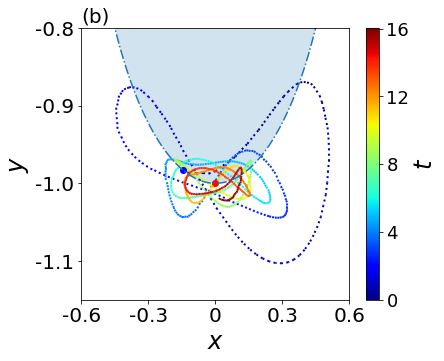
Surprisingly, the size of the trace is much larger than the distance between the pre- and post-quench points, even if we take into account the distortion by the stereographic projection. Furthermore, a significant portion of the trace features a winding vector that points to the direction not matched by its equilibrium counterpart, unlike in the previous example illustrated in Fig. 10. In other words, the restriction on the winding of the pseudospin magnetic field related to the equilibrium band structure is relaxed in the non-equilibrium case due to the nontrivial time-dependent geometry of the effective pseudospin magnetic field. This is quite unexpected especially when the pre- and post-quench Hamiltonians are located deep in the topological phase.
VI Summary and Discussion
The non-equilibrium quench dynamics of isolated quantum systems has generated tremendous amount of theoretical interest on phenomena such as the linear increase of entanglement entropy and light-cone spreading of quasiparticles and their correlations. In topological systems additional interest has been given to the edge modes that correspond to the nontrivial topology of the bulk. In this study we focus on describing non-equilibrium topological states by additional geometrical degrees of freedom that are associated with the edge modes in the entanglement spectrum, with examples in Haldane’s honeycomb model.
In the equilibrium case we confirm the criterion for nontrivial topology in the entanglement spectrum is the existence of zero modes propagating along the edges, or a crossing of the edge modes at half entanglement occupation. At the characteristic momentum , the normalized pseudospin magnetic field sweeps a great circle on the Bloch sphere. The normal direction of the circle can be related to the wave function of the zero modes. The unit vector, fixed by two parameters, encodes the geometrical information beyond the topological Chern index of the nontrivial state. So the family of topological states sharing the same Chern index can be distinguished by their vectors, just as the family of Laughlin states can be identified by the shape (and orientation) of their correlation holes, or the metric of their wave functions.
After a sudden quantum quench within the same topological phase, the topology of the system is not expected to change. However, the dynamical evolution of the system, encoded in the normalized effective pseudo magnetic field , exhibits complex patterns. In general, the evolution of the momentum of the persisting zero modes allows us to peek into the dynamical geometry of the topological state, which reveals the interband excitations whose weights are dominated by the extrema of the excitation gap. Nevertheless, the underlying no longer sweep a great circle on the Bloch sphere. Indeed, we can filter away the high-frequency components in for the edge modes and obtain a good approximation to . This approximation effectively defines a plane that intersects the Bloch sphere by a great circle, which can be regarded as the counterpart of the pseudo magnetic field in the equilibrium case. The coplanarity condition for in the equilibrium case is, thus, relaxed to a triple-integral condition for , which encrypts the dynamical geometry through a time-independent metric.
This naturally allows us to extend the definition of the winding vector to the dynamically case and use it to visualize the non-equilibrium topological states. Such a definition of a unit vector on the Bloch sphere bears similarities to the winding vector in the context of a pair of Dirac points [36, 37] around which the winding number is defined and which rotates during the motion of the Dirac points. With the dynamical winding vector represented by points on the Bloch sphere, we show that the generic quench dynamics can be quite complex. Though the winding vector evolves from that of the pre-quench system to that of the post-quench system as expected, the time evolution occurs along a trace that can be significantly larger than the distance between the pre- and post-quench equilibrium systems. More surprisingly, the dynamical winding vector along the trace may not have an equilibrium counterpart even though the pre- and post-quench states lie well inside the topological phase. This means that the swirling of the pseudospin magnetic field (see Fig. 5) allows the winding vector, or the perpendicular plane, to tilt to directions not possible to reach in the equilibrium case. Thus, the quantum quench within the same topological phase enlarges the topological phase space, even if we are only concerned about the winding vector at the characteristic momentum of the zero modes.
Strictly speaking, the winding vector trace in the dynamical case is not a faithful representation of the non-equilibrium topological states. Obviously, different states (even with different pre- and post-quench Hamiltonian) can have the same winding vector. The bulk state is also not identical to the corresponding equilibrium state. Nevertheless, it allows us to visualize the evolution of the topological states and address questions like how close or how fast the system is approaching the post-quench equilibrium state. In the case when the chiral symmetry is preserved in both pre- and post-quench Hamiltonian, the winding vector is confined to the - plane by symmetry and exhibits oscillations with amplitude decaying in a power law with exponent . The oscillation spectrum and the exponent are clear signatures that the dynamical winding vector correctly reveal the physics associated with the stationary points of the interband excitation gap.
The same physics behind the power-law evolution of the winding vector is also reflected in the evolution of other quantities that can be used to describe the non-equilibrium system, although to a less extent. For example, when the entanglement crossing momentum is not the same for the pre- and post-quench Hamiltonian, its time evolution exhibit a similar oscillations with amplitude decaying in a power law with exponent . Even though the oscillation spectrum is different in general, the characteristic frequencies, which originate from the same stationary points, are the same. For the same physics, the entanglement velocity evolves with similar oscillations whose amplitude increases in a power law with exponent . This necessarily causes the velocity to change sign, which leads to the emergence or annihilation of pairs of entanglement crossings.
Therefore, we believe that our formulation and application of the dynamical winding vector facilitate the study of non-equilibrium properties of topological systems. For example, the method can be generalized to systems with higher Chern indices or to more complex quench protocols. Another interesting direction is to study topological systems with decoherence to explore how the geometrical information encoded in the systems is lost to the environment.
Acknowledgements.
This work was supported by the National Key Research and Development Program of China (2021YFA1401902), the Strategic Priority Research Program of Chinese Academy of Sciences through Grant No. XDB28000000, and NSFC project No. 11974308.References
- [1] M. A. Nielsen and I. L. Chuang, Quantum Computation and Quantum Information, 1st ed. (Cambridge University Press, Cambridge, England, 2004).
- [2] H. Li and F. D. M. Haldane, Phys. Rev. Lett. 101, 010504 (2008).
- [3] A. Sterdyniak, A. Chandran, N. Regnault, B. A. Bernevig, and P. Bonderson, Phys. Rev. B 85, 125308 (2012).
- [4] J. Dubail, N. Read, and E. H. Rezayi, Phys. Rev. B 85, 115321 (2012).
- [5] Z. Liu and E. J. Bergholtz, Phys. Rev. B 87, 035306 (2013).
- [6] I. D. Rodriguez, S. C. Davenport, S. H. Simon, and J. K. Slingerland, Phys. Rev. B 88, 155307 (2013).
- [7] L. Fidkowski, Phys. Rev. Lett. 104, 130502 (2010).
- [8] A. M. Turner, Y. Zhang, and A. Vishwanath, Phys. Rev. B 82, 241102R (2010).
- [9] F. Pollmann, E. Berg, A. M. Turner, and M. Oshikawa, Phys. Rev. B 81, 064439 (2010).
- [10] R. Thomale, D. P. Arovas, and B. A. Bernevig, Phys. Rev. Lett. 105, 116805 (2010).
- [11] E. Prodan, T. L. Hughes, and B. A. Bernevig, Phys. Rev. Lett. 105, 115501 (2010).
- [12] Z. Huang and D. P. Arovas, Phys. Rev. B. 86, 245109 (2012).
- [13] Z. Huang and D. P. Arovas, arXiv:1205.6266.
- [14] M. Hermanns, Y. Salimi, M. Haque, and L. Fritz, J. Stat. Mech. (2014) P10030
- [15] H. Yao and X.-L. Qi, Phys. Rev. Lett. 105, 080501 (2010).
- [16] K. Choo, C. W. von Keyserlingk, N. Regnault, and T. Neupert, Phys. Rev. Lett. 121, 086808 (2018).
- [17] C. Kokail, R. van Bijnen, A. Elben, B. Vermersch, and P. Zoller, Nature Phys. 17, 936 (2021).
- [18] X.-L. Qi, H. Katsura, and A. W. W. Ludwig, Phys. Rev. Lett. 108, 196402 (2012).
- [19] B. Swingle and T. Senthil, Phys. Rev. B 86, 045117 (2012).
- [20] A. Chandran, M. Hermanns, N. Regnault, and B. A. Bernevig, Phys. Rev. B 84, 205136 (2011).
- [21] J. I. Cirac, D. Poilblanc, N. Schuch, and F. Verstraete, Phys. Rev. B 83, 245134 (2011).
- [22] I. Peschel, J. Phys. A Math. Gen. 36, L205 (2003).
- [23] Z. Gong and M. Ueda, Phys. Rev. Lett. 121, 250601 (2018).
- [24] P.-Y. Chang, Phys. Rev B 97, 224304 (2018).
- [25] S. Lu and J. Yu, Phys. Rev. A 99, 033621 (2019).
- [26] S. Sayyad, J. Yu, A. G. Grushin, and L. M. Sieberer, Phys. Rev. Research 3, 033022 (2021).
- [27] C. Ortega-Taberner, L. Rødland, and M. Hermanns, Phys. Rev. B 105, 075103 (2022).
- [28] C. Wang, P. Zhang, X. Chen, J. Yu, and H. Zhai, Phys. Rev. Lett. 118, 185701 (2017).
- [29] W. Sun et al, Phys. Rev. Lett. 121, 250403 (2018).
- [30] M. Tarnowski, F. Nur Ünal, N. Fläschner, B. S. Rem, A. Eckardt, K. Sengstock, and C. Weitenberg, Nat. Comm. 10, 1728 (2019).
- [31] F. D. M. Haldane, Phys. Rev. Lett. 107, 116801 (2011).
- [32] R.-Z. Qiu, F. D. M. Haldane, X. Wan, K. Yang, and S. Yi, Phys. Rev. B 85, 115308 (2012).
- [33] Z. Liu, A. Gromov, and Z. Papić, Phys. Rev. B 98, 155140 (2018).
- [34] Z. Liu, A. C. Balram, Z. Papić, and A. Gromov, Phys. Rev. Lett. 126, 076604 (2021).
- [35] H.-X. Ji, L.-H. Mo, and X. Wan, Chin. Phys. Lett. 39, 030301 (2022).
- [36] G. Montambaux, L.-K. Lim, J.-N. Fuchs, and F. Piéchon, Phys. Rev. Lett. 121, 256402 (2018).
- [37] L.-K. Lim, J.-N. Fuchs, F. Piéchon, and G. Montambaux, Phys. Rev. B 101, 045131 (2020).
- [38] F. D.M. Haldane, Phys. Rev. Lett. 61, 18 (1988).
- [39] M.-C. Chung and I. Peschel, Phys. Rev. B 64, 064412 (2001).
- [40] P. Delplace, D. Ullmo, and G. Montambaux, Phys. Rev. B 84, 195452 (2011).
- [41] P. Calabrese and J. Cardy, J. Stat. Mech. P04010 (2005).
- [42] P. Calabrese and J. Cardy, Phys. Rev. Lett. 96, 136801 (2006).