Probing quantum floating phases in Rydberg atom arrays
Abstract
The floating phase, a critical incommensurate phase, has been theoretically predicted as a potential intermediate phase between crystalline ordered and disordered phases. In this study, we investigate the different quantum phases that arise in ladder arrays comprising up to 92 neutral-atom qubits and experimentally observe the emergence of the quantum floating phase. We analyze the site-resolved Rydberg state densities and the distribution of state occurrences. The site-resolved measurement reveals the formation of domain walls within the commensurate ordered phase, which subsequently proliferate and give rise to the floating phase with incommensurate quasi-long-range order. By analyzing the Fourier spectra of the Rydberg density-density correlations, we observe clear signatures of the incommensurate wave order of the floating phase. Furthermore, as the experimental system sizes increase, we show that the wave vectors approach a continuum of values incommensurate with the lattice. Our work motivates future studies to further explore the nature of commensurate-incommensurate phase transitions and their non-equilibrium physics.
The study of quantum phases and quantum phase transitions is one of the central topics in condensed matter, atomic, and high energy physics. Among these, commensurate to incommensurate phase transitions have been actively investigated since the 1980s Huse and Fisher (1982); Ostlund (1981); Howes et al. (1983); Haldane et al. (1983); Huse and Fisher (1984); Dröse et al. (2003) and have attracted renewed attention recently Chepiga and Mila (2019); Rader and Läuchli (2019); Chepiga and Mila (2021a); Maceira et al. (2022); Eck and Fendley (2023); Samajdar et al. (2020). A pivotal question revolves around the nature of these transitions and whether there exists an intermediate incommensurate phase when a commensurate solid melts into the disordered phase. In the context of spontaneous symmetry breaking, commensurate crystalline states in lattice systems often give hints to the underlying universality class of the phase transitions, such as the Ising and Potts classes Wu (1982). Nonetheless, Huse and Fisher Huse and Fisher (1982) proposed that when different kinds of domain walls exist in commensurate phases, they can introduce chiral perturbations, where the sequence of the domains matters. In such cases, several other possibilities could arise for the phase transition between the disordered and the commensurate ordered phases. These include a direct chiral transition Huse and Fisher (1982), a direct first-order transition Huse and Fisher (1984), or an intriguing two-step transition across an incommensurate density-wave-order phase, i.e., the quantum floating phase Huse and Fisher (1984); Bak (1982).
Early efforts in this field focused on probing classical floating phases in the melting of two-dimensional solids on periodic substrates Abernathy et al. (1994); Schreiner et al. (1994); Schuster et al. (1996). Later on, Fendley et al. Fendley et al. (2004) proposed a one-dimensional (1D) constrained hard-boson model that hosts a critical quantum floating phase. The constrained model is of particular relevance to the Rydberg atom array quantum simulation platform, which has made significant advancements in recent years Bernien et al. (2017); Keesling et al. (2019); Labuhn et al. (2016); de Léséleuc et al. (2019); Ebadi et al. (2021); Scholl et al. (2021). Strong blockade interactions between nearby Rydberg atoms directly mimic the constraint in the hard-boson model. Theoretical calculations predict that critical quantum floating phases should exist in the 1D Rydberg atom array system Chepiga and Mila (2019); Rader and Läuchli (2019); Chepiga and Mila (2021a); Maceira et al. (2022); Weimer and Büchler (2010). However, probing the floating phase in the 1D Rydberg system has been proven to be challenging due to their existence in only narrow regions in the phase diagram.
In this study, we construct a quasi-1D array of \ce^87Rb atoms arranged in a two-leg ladder and experimentally probe the quantum floating phase. The Rydberg interactions between the two legs of the ladder array in the chosen geometric aspect ratio introduce stronger chiral perturbations (Supplementary Information) that yield broad regions of the floating phase in experimentally accessible parameter regimes (Fig. 1b), which greatly facilitate our experimental observations. We provide supporting numerical calculations for the full phase diagram of the ladder system and experimentally measure the various phase regimes. By taking snapshots of the prepared states, we obtain the site-resolved Rydberg density and correlation functions. The dominant wave vectors for the measured correlation functions, extracted through Fourier analysis, offer a clear distinction between commensurate and incommensurate phases. An important feature of the floating phase is that, in the thermodynamic limit, the incommensurate wave vectors continuously depend on the physical parameters Bak (1982). We experimentally observe that, as system sizes increase, the incommensurate wave vectors tend towards a continuum of values.
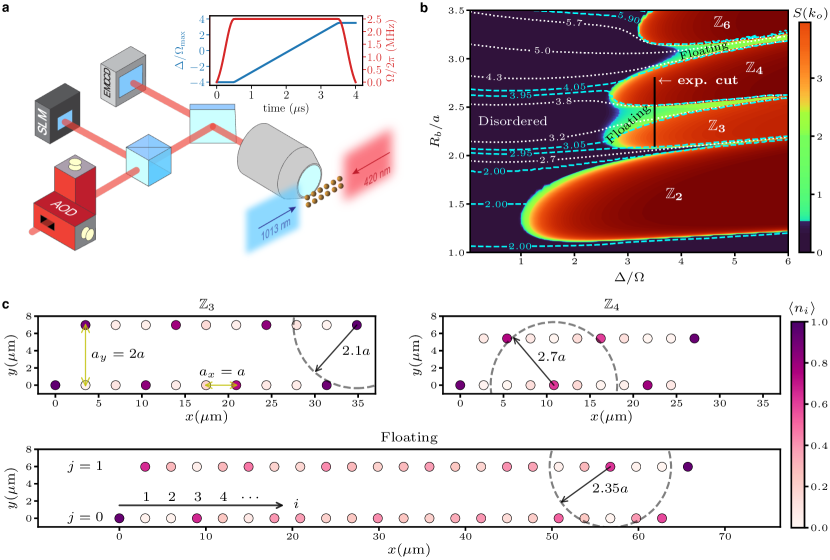
In order to prepare this geometry of atom arrangement, \ce^87Rb atoms are loaded from a magneto-optical trap into a two-dimensional (2D) array of optical tweezers generated using a spatial light modulator (SLM). We then rearrange the initially loaded atoms into a defect-free two-legged pattern using a second set of optical tweezers generated by a pair of crossed acousto-optical deflectors (AODs) Wurtz et al. (2023). In our system, qubits are encoded in the electronic ground state and the Rydberg state . The transition between the two states is driven by a two-photon process with two counter-propagating laser beams at 420 nm and 1013 nm shaped into light sheets (Fig. 1a). The coupling between the states and van der Waals interaction between Rydberg states result in the Hamiltonian
| (1) | |||||
where and are the rung index and the leg index, respectively, is the effective two-photon Rabi frequency, is the two-photon detuning, is the Rydberg density operator, and is the van der Waals interaction where MHz and . In this work, we set the lattice spacings and (Fig. 1c). The interactions are parameterized by the Rydberg blockade radius , within which the interaction is much larger than the Rabi frequency and it is thus energetically unfavorable to have more than one Rydberg excitation.
Complex many-body ground states emerge from the interplay between the detuning and the Rydberg interactions (Fig. 1b). For small positive values of detuning , the system has a low Rydberg state occupancy and displays a featureless disordered ground state. When the detuning becomes large, the Rydberg excitations can occupy one of every consecutive sites, with being an integer number and its value determined by . Such ordered density wave states have been observed experimentally both in 1D and 2D Rydberg arrays Bernien et al. (2017); Keesling et al. (2019); Ebadi et al. (2021). In the intermediate values of between two different crystalline orders, the proliferation of different types of domain-wall excitations destroys the crystalline orders, but it can still stabilize a Rydberg density wave order with a wavelength that is incommensurate with the lattice spacing Huse and Fisher (1982); Chepiga and Mila (2021a), giving rise to the quantum floating phase. Those density wave states have degeneracies related by translation and mirror symmetries. To facilitate experimental observations, we apply special boundary conditions to add two extra sites on the edges of the ladder array as shown in Fig. 1c, which break the aforementioned symmetries (Supplementary Information).
The Rydberg density-density correlation functions can reflect (quasi) long-range orders in density-wave states and the Fourier analysis can extract the dominant wave vectors of these orders. To quantitatively map out the phase diagram, we use the following structure factor:
| (2) |
where is the difference between the Rydberg density on the two sites in the th rung and is an overall normalization factor. Here, is determined by , where peaks at . The ordered phase and the incommensurate floating phase correspond to being integer and non-integer values, respectively, and converges to non-zero constant values as the system sizes increase. On the other hand, goes to zero in the thermodynamic limit for the disordered phase. The phase diagram for our ladder system is shown in Fig. 1b by numerical calculations via density matrix renormalization group (DMRG). The maximum value is plotted as a function of the physical parameters and . The colormap shows clear differences among commensurate ordered phases, incommensurate floating phases, and the disordered phase. Lines of constant are superimposed to the phase diagram in Fig. 1b. They reveal the wavelength of the density-wave order and thus whether it is commensurate or incommensurate. As illustrated, we can see the clear differences between commensurate ordered phases (with ) and the incommensurate floating phase that lies between and orders or between and orders. The order and in fact orders for any odd do not exist due to strong inter-leg Rydberg blockade interactions (Supplementary Information). We emphasize that determining the phase diagram by mapping out the structure factors, as demonstrated here, has the desirable benefit of being directly measurable in our experiments, in contrast to using the entanglement entropy (Supplementary Information).
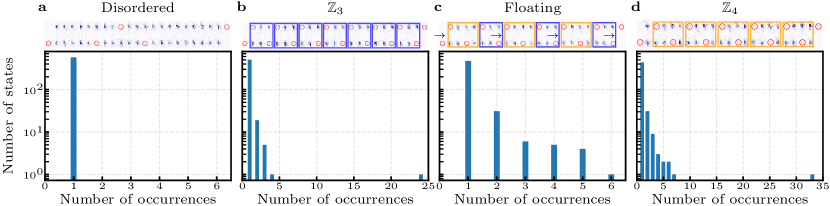
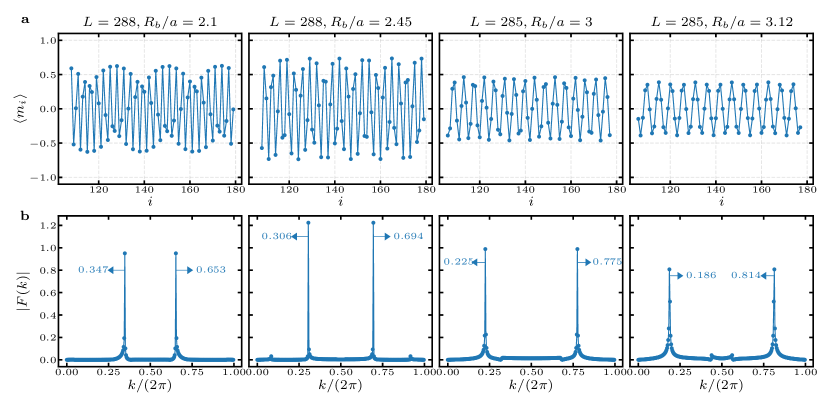
Our experimental setup allows many repetitions of the adiabatic preparation process, giving us direct access to snapshots of bitstrings of each atom in and in each observation. We plot the experimentally measured density profiles for , , and floating phases in Fig. 1c. In each experimental run, the corresponding many-body ground state is prepared by an adiabatic evolution starting from all atoms in the state, followed by an adiabatic sweep similar to the one shown in the inset of Fig. 1a. One can see that the order has large occupation of Rydberg states every -th site on each leg, while the Rydberg density in the floating phase does not have the same repetitive structure in the array. Analysis of the statistical distributions of the read-out configurations provides clear indications of the different many-body phases prepared (Fig. 2). In the case of the disordered state with , the measured bitstring configurations are likely to be all different, i.e., all the bitstrings occur only once (see Fig. 2a, with a total of samples taken in our experiments). A typical measurement read-out shows no order along the ladder, where a representative snapshot is shown in the florescence image above the histogram plot. In contrast, for the commensurate ( samples) and ( samples) phases, there is only one particular configuration that occurs much more frequently than all the other configurations (Fig. 2b and 2d), corresponding to the classical density-wave state with periodicities and , respectively, as shown in the florescence images.
More interestingly, within the floating phase situated between the and phase regimes, the most frequently observed bitstring out of samples does not exhibit or periodicity. Instead, there are always smaller regions with or order appearing alternately, as shown by the alternate orange and blue boxes in the florescence image in Fig. 2c. This observation reveals that the floating phase is not simply a macroscopic superposition of and orders. If the melting of the order is considered, the domain walls can be identified by observing where the domain changes sublattices (Supplementary Information). These domain walls, as indicated by the right arrows, are essential for the incommensurate nature of the quantum floating phase (Fig. 1c). In principle, the domain walls should be distributed at equal distances across the entire system for the ground state. However, changing the position of the domain walls incurs only small energy cost in the floating phase, which results in a nearly continuous distribution of states with high occurrences 111In the thermodynamic limit, a continuum limit can be defined and continuous translations can be performed on each configuration without any cost in energy. This translation corresponds to an overall phase shift of the incommensurate density-wave order, and the degeneracy is a manifestation of an emergent global U(1) symmetry.. We observe such a feature in the bitstring distribution in Fig. 2c. This behaviour stands in contrast to the commensurate ordered phases, where only one bitstring occurs dominantly. These experimental results are fully consistent with theoretical calculations (see the Supplementary Information for numerical results).
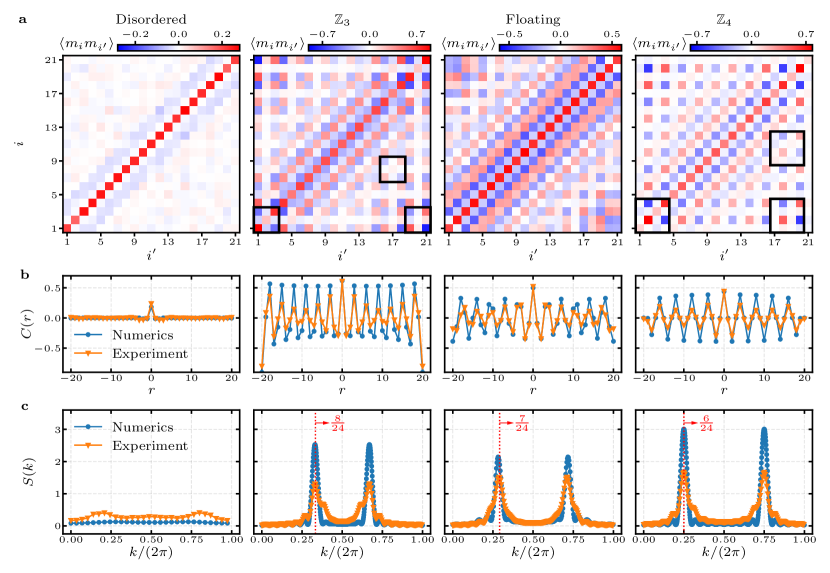
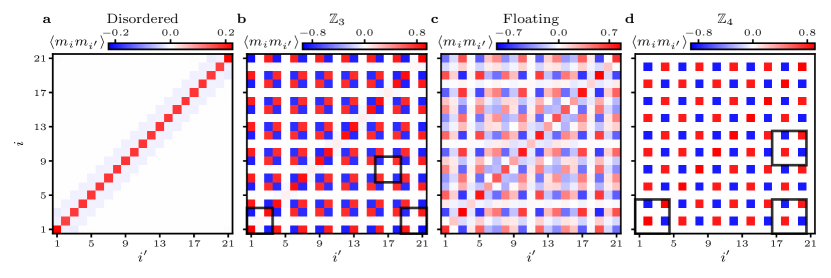
The , , and intermediate quantum floating phases can be further elucidated through a quantitative analysis of the Rydberg density correlations. In Fig. 3a, we present the correlation matrix between rungs and . In the disordered phase, the diagonal elements of the correlation matrix are non-zero, while the off-diagonal elements quickly decay to zero, accompanied by weak site-dependent fluctuations. This behavior indicates that the correlation length is short in this case. Quantitatively, by averaging the correlation functions over sites with a fixed relative distance , we show that the mean correlation function ( is the number of pairs satisfying ) decays to zero immediately for (first column of Fig. 3b). The numerical results are in good agreement with experimental measurements. Both experimental and numerical structure factors show a weak signal for density fluctuations, as shown in the first column of Fig. 3c.
The same analysis is performed for , floating, and phases. The integer-period oscillation patterns for and phases can be easily read from the correlation matrix, where the correlations oscillate with periodicities of and , respectively. On top of the periodic oscillations, there also exists some amplitude decay for the correlations as the distance increases. The black boxes in Fig. 3a indicate the smallest repeating units: and squares for and orders, respectively. There is no such repeating unit in the correlation matrix for the quantum floating phase, indicating that its periodicity is not commensurate with the lattice spacing. The mean correlation function in Fig. 3b also shows perfect and oscillations for the commensurate phases, while it presents an incommensurate oscillation pattern for the floating phase. The plots of exhibit excellent agreement with numerical results in the short range, albeit with amplitude decay due to the finite correlation length in our experiments. The experimental data for the three density-wave orders show strong signals of oscillations, which are absent in the disordered phase.
The structure factor in Fig. 3c has peaks at , , and for the , the incommensurate floating, and the phases, respectively, in agreement with numerical results. These particular values for the peak positions can be explained by the finite size of the ladder and our choice of boundary conditions. With finite detuning, a Rydberg excitation is pinned at each of the two edge sites of the ladder since that minimizes the Rydberg blockade energy, as illustrated in Fig. 1c. Under this boundary condition, the Rydberg density waves for and orders are both compatible with system sizes satisfying , with being any positive integer number. Because of the Rydberg interactions, the pinning of the Rydberg density wave at the edge sites on a finite lattice restricts arbitrary continuous variation of the wavelength in the floating phase, allowing only fractional values of wavelength between the and the orders. For example, in the phase () with a system size of , the most frequently occurring state contains excitations in each leg, while in the phase (), it comprises excitations in each leg. In the floating phase between the and phases, the most common state consists of excitations in each leg, resulting in a fractional , as confirmed by the results in Fig. 2c. In the large limit, this series of waves with fractional wavelengths continuously interpolates between two crystalline orders with integer values and . In the following, we experimentally explore this trend by constructing ladder arrays of different sizes.
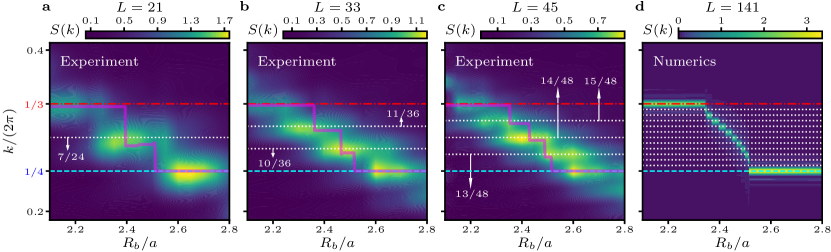
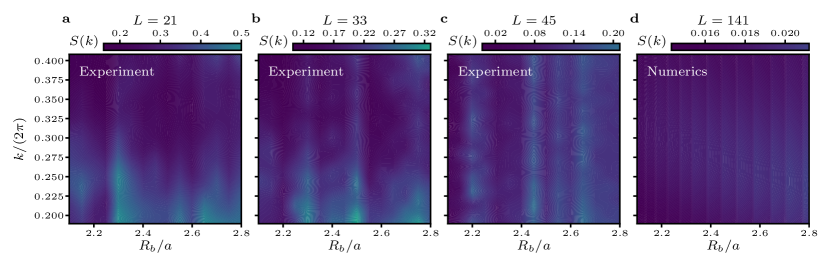
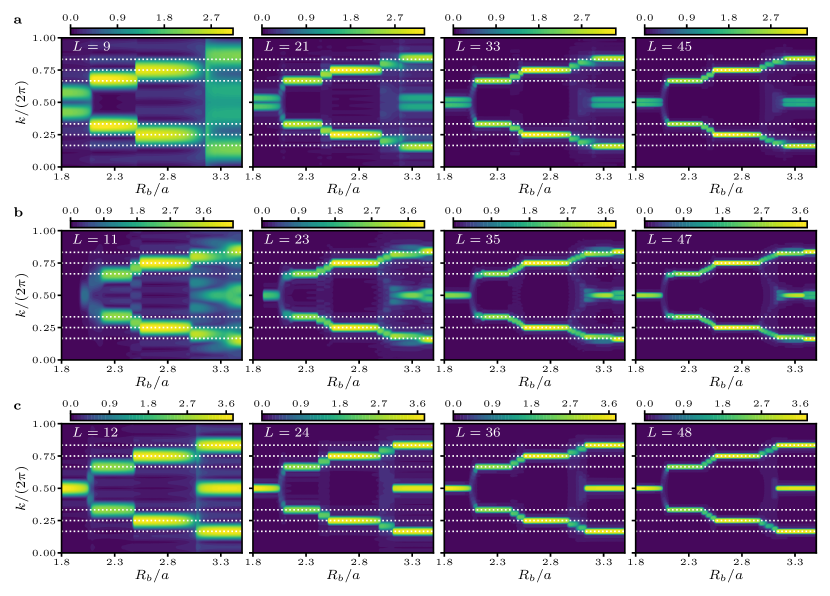
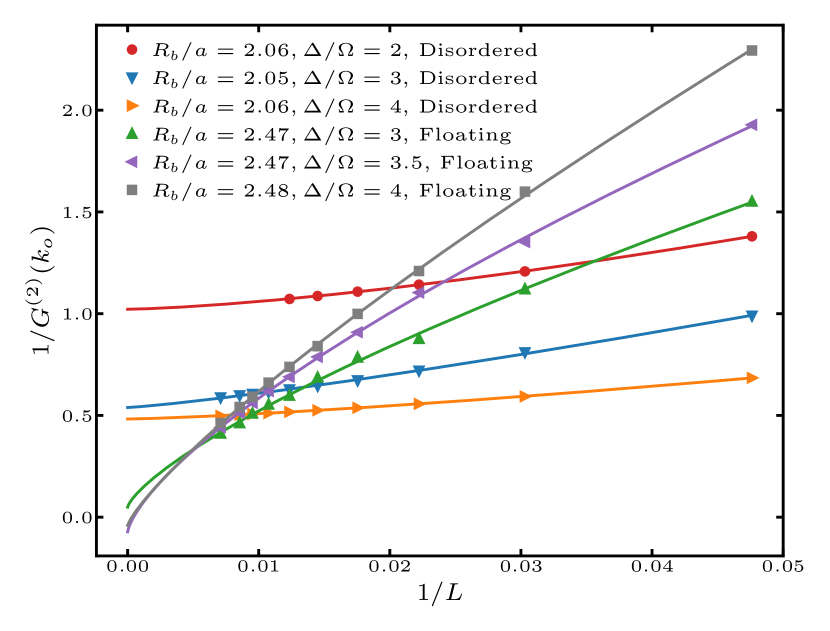
We vary in small steps by changing the lattice constant and examine the changes in the structure factor for various system sizes. This experimental cut is indicated by the black line in Fig. 1b at and ranges from to . is measured for different system sizes , with its dependence on and presented in Fig. 4a-c. We note that at each value of , the corresponding many-body ground state is prepared by an adiabatic sweep starting from all atoms in the state. As we can see, the structure factor exhibits and peak plateaus independent of system sizes, signifying the existence of and orders. More importantly, we experimentally observe, in the floating phase, , , and peak steps for , , and , respectively, which are fully consistent with our theoretical expectations. Furthermore, the step locations are observed at the corresponding incommensurate values, also in agreement with theory results. In particular, we observe for , for , and for . Our experiments demonstrate that the number of incommensurate steps between crystalline orders increases with the system size, which agrees with the theoretical expectation of its tending towards infinity as the system approaches the thermodynamic limit. Consequently, the dominant wave vector of the quantum floating phase would change continuously with the physical parameters. An example of the structure factor in the large limit is shown in Fig. 4d using DMRG calculations for . In this case, the dominant wave vector in the floating phase takes a series of values, nearly forming a continuous curve within a small window between and . In addition, we conducted measurements in the same range with fixed , where the system is always in the disordered phase. The results show very weak peaks in the structure factor, and the signals diminish with increasing system sizes (Supplementary Information). These vanishing signals for the disordered phase confirm that the boundary effects do not induce artificial signatures for the existence of density-wave orders in our experiments, and, in particular, the observed peaks in the incommensurate wave vectors are genuine features of the quantum floating phase.
In summary, our utilization of Rydberg-atom ladder arrays has enabled the experimental observation of an incommensurate density-wave order—the quantum floating phase. Distinct Rydberg density fluctuations are observed in different density-wave states, and the structure factor exhibits strong signatures for the existence of the floating phase. Through systematic tuning of the lattice constant, discrete wave vectors allowed in the quantum floating phase for different system sizes are observed, indicating their convergence to a continuum of incommensurate values in the thermodynamic limit. This experiment underscores the versatility of Rydberg atoms in ladder arrays as highly programmable quantum simulators, facilitating the exploration across various quantum many-body phases. The constructed Rydberg arrays house a broad spectrum of critical lines and points in experimentally accessible regimes, including Ising, Potts, Ashkin-Teller, chiral, Berezinskii–Kosterlitz–Thouless Kosterlitz (1974), Pokrovsky-Talapov Pokrovsky and Talapov (1979), and Lifshitz critical points Chepiga and Mila (2021b) (see Supplementary Information for details). The regime in our system establishes an ideal platform for investigating the Kibble-Zurek mechanism of chiral phase transitions. Our work paves the way for future experimental inquiries into these critical phenomena, and it offers potential applications in diverse contexts, such as quantum simulation of lattice gauge theories Bazavov et al. (2015); Zhang et al. (2018); Surace et al. (2020); Meurice (2021); Heitritter et al. (2022), inhomogeneous phases, the Lifshitz regime of lattice quantum chromodynamics Pisarski et al. (2019); Kojo et al. (2010), and “chiral spiral” condensation in interacting fermionic systems Başar and Dunne (2008).
Acknowledgements.
We thank K. Heitritter, J. Corona, Milan Kornjača, and members of the QuLAT collaboration for helpful discussions, and Simon Evered for providing helpful feedback on the manuscript. Authors from QuEra Computing Inc. acknowledge the support from the DARPA ONISQ program (grant no. W911NF2010021). S.-W.T. acknowledges the support from the National Science Foundation (NSF) RAISE-TAQS under Award Number 1839153. J.Z. is supported by NSFC under Grants No. 12304172 and No. 12347101, Chongqing Natural Science Foundation under Grant No. CSTB2023NSCQ-MSX0048, and Fundamental Research Funds for the Central Universities under Projects No. 2023CDJXY-048 and No. 2020CDJQY-Z003. Y.M. and, in the early stage of the project, J.Z. were supported in part by the U.S. Department of Energy (DoE) under Award Number DE-SC0019139. Computations were performed using the computer clusters and data storage resources of the UCR High Performance Computing Center (HPCC), which were funded by grants from NSF (MRI-1429826) and NIH (1S10OD016290-01A1).References
- Huse and Fisher (1982) D. A. Huse and M. E. Fisher, Phys. Rev. Lett. 49, 793 (1982).
- Ostlund (1981) S. Ostlund, Phys. Rev. B 24, 398 (1981).
- Howes et al. (1983) S. Howes, L. P. Kadanoff, and M. Den Nijs, Nuclear Physics B 215, 169 (1983).
- Haldane et al. (1983) F. D. M. Haldane, P. Bak, and T. Bohr, Phys. Rev. B 28, 2743 (1983).
- Huse and Fisher (1984) D. A. Huse and M. E. Fisher, Phys. Rev. B 29, 239 (1984).
- Dröse et al. (2003) T. Dröse, R. Besseling, P. Kes, and C. M. Smith, Phys. Rev. B 67, 064508 (2003).
- Chepiga and Mila (2019) N. Chepiga and F. Mila, Phys. Rev. Lett. 122, 017205 (2019).
- Rader and Läuchli (2019) M. Rader and A. M. Läuchli, “Floating phases in one-dimensional rydberg ising chains,” (2019), arXiv:1908.02068 [cond-mat.quant-gas] .
- Chepiga and Mila (2021a) N. Chepiga and F. Mila, Nature Communications 12, 414 (2021a).
- Maceira et al. (2022) I. A. Maceira, N. Chepiga, and F. Mila, Phys. Rev. Res. 4, 043102 (2022).
- Eck and Fendley (2023) L. Eck and P. Fendley, “Critical lines and ordered phases in a rydberg-blockade ladder,” (2023), arXiv:2304.08484 [cond-mat.str-el] .
- Samajdar et al. (2020) R. Samajdar, W. W. Ho, H. Pichler, M. D. Lukin, and S. Sachdev, Phys. Rev. Lett. 124, 103601 (2020).
- Wu (1982) F. Y. Wu, Rev. Mod. Phys. 54, 235 (1982).
- Bak (1982) P. Bak, Reports on Progress in Physics 45, 587 (1982).
- Abernathy et al. (1994) D. L. Abernathy, S. Song, K. I. Blum, R. J. Birgeneau, and S. G. J. Mochrie, Phys. Rev. B 49, 2691 (1994).
- Schreiner et al. (1994) J. Schreiner, K. Jacobi, and W. Selke, Phys. Rev. B 49, 2706 (1994).
- Schuster et al. (1996) R. Schuster, I. K. Robinson, K. Kuhnke, S. Ferrer, J. Alvarez, and K. Kern, Phys. Rev. B 54, 17097 (1996).
- Fendley et al. (2004) P. Fendley, K. Sengupta, and S. Sachdev, Phys. Rev. B 69, 075106 (2004).
- Bernien et al. (2017) H. Bernien, S. Schwartz, A. Keesling, H. Levine, A. Omran, H. Pichler, S. Choi, A. S. Zibrov, M. Endres, M. Greiner, V. Vuletić, and M. D. Lukin, Nature 551, 579 (2017).
- Keesling et al. (2019) A. Keesling, A. Omran, H. Levine, H. Bernien, H. Pichler, S. Choi, R. Samajdar, S. Schwartz, P. Silvi, S. Sachdev, P. Zoller, M. Endres, M. Greiner, V. Vuletić, and M. D. Lukin, Nature 568, 207 (2019).
- Labuhn et al. (2016) H. Labuhn, D. Barredo, S. Ravets, S. de Léséleuc, T. Macrì, T. Lahaye, and A. Browaeys, Nature 534, 667 (2016).
- de Léséleuc et al. (2019) S. de Léséleuc, V. Lienhard, P. Scholl, D. Barredo, S. Weber, N. Lang, H. P. Büchler, T. Lahaye, and A. Browaeys, Science 365, 775 (2019).
- Ebadi et al. (2021) S. Ebadi, T. T. Wang, H. Levine, A. Keesling, G. Semeghini, A. Omran, D. Bluvstein, R. Samajdar, H. Pichler, W. W. Ho, S. Choi, S. Sachdev, M. Greiner, V. Vuletić, and M. D. Lukin, Nature 595, 227 (2021).
- Scholl et al. (2021) P. Scholl, M. Schuler, H. J. Williams, A. A. Eberharter, D. Barredo, K.-N. Schymik, V. Lienhard, L.-P. Henry, T. C. Lang, T. Lahaye, A. M. Läuchli, and A. Browaeys, Nature 595, 233 (2021).
- Weimer and Büchler (2010) H. Weimer and H. P. Büchler, Phys. Rev. Lett. 105, 230403 (2010).
- Wurtz et al. (2023) J. Wurtz, A. Bylinskii, B. Braverman, J. Amato-Grill, S. H. Cantu, F. Huber, A. Lukin, F. Liu, P. Weinberg, J. Long, S.-T. Wang, N. Gemelke, and A. Keesling, “Aquila: Quera’s 256-qubit neutral-atom quantum computer,” (2023), arXiv:2306.11727 [quant-ph] .
- Note (1) In the thermodynamic limit, a continuum limit can be defined and continuous translations can be performed on each configuration without any cost in energy. This translation corresponds to an overall phase shift of the incommensurate density-wave order, and the degeneracy is a manifestation of an emergent global U(1) symmetry.
- Kosterlitz (1974) J. M. Kosterlitz, Journal of Physics C: Solid State Physics 7, 1046 (1974).
- Pokrovsky and Talapov (1979) V. L. Pokrovsky and A. L. Talapov, Phys. Rev. Lett. 42, 65 (1979).
- Chepiga and Mila (2021b) N. Chepiga and F. Mila, Phys. Rev. Res. 3, 023049 (2021b).
- Bazavov et al. (2015) A. Bazavov, Y. Meurice, S.-W. Tsai, J. Unmuth-Yockey, and J. Zhang, Phys. Rev. D 92, 076003 (2015).
- Zhang et al. (2018) J. Zhang, J. Unmuth-Yockey, J. Zeiher, A. Bazavov, S.-W. Tsai, and Y. Meurice, Phys. Rev. Lett. 121, 223201 (2018).
- Surace et al. (2020) F. M. Surace, P. P. Mazza, G. Giudici, A. Lerose, A. Gambassi, and M. Dalmonte, Phys. Rev. X 10, 021041 (2020).
- Meurice (2021) Y. Meurice, Phys. Rev. D 104, 094513 (2021).
- Heitritter et al. (2022) K. Heitritter, Y. Meurice, and S. Mrenna, “Prolegomena to a hybrid Classical/Rydberg simulator for hadronization (QuPYTH),” (2022), arXiv:2212.02476 [quant-ph] .
- Pisarski et al. (2019) R. D. Pisarski, V. V. Skokov, and A. M. Tsvelik, Universe 5, 48 (2019).
- Kojo et al. (2010) T. Kojo, Y. Hidaka, L. McLerran, and R. D. Pisarski, Nuclear Physics A 843, 37 (2010).
- Başar and Dunne (2008) G. m. c. Başar and G. V. Dunne, Phys. Rev. Lett. 100, 200404 (2008).
- White (1992) S. R. White, Phys. Rev. Lett. 69, 2863 (1992).
- White (1993) S. R. White, Phys. Rev. B 48, 10345 (1993).
- Östlund and Rommer (1995) S. Östlund and S. Rommer, Phys. Rev. Lett. 75, 3537 (1995).
- Fishman et al. (2022) M. Fishman, S. R. White, and E. M. Stoudenmire, SciPost Phys. Codebases , 4 (2022).
- Affleck and Ludwig (1991) I. Affleck and A. W. W. Ludwig, Phys. Rev. Lett. 67, 161 (1991).
- Holzhey et al. (1994) C. Holzhey, F. Larsen, and F. Wilczek, Nuclear Physics B 424, 443 (1994).
- Vidal et al. (2003) G. Vidal, J. I. Latorre, E. Rico, and A. Kitaev, Phys. Rev. Lett. 90, 227902 (2003).
- Calabrese and Cardy (2004) P. Calabrese and J. Cardy, Journal of Statistical Mechanics: Theory and Experiment 2004, P06002 (2004).
- Calabrese and Cardy (2009) P. Calabrese and J. Cardy, Journal of Physics A: Mathematical and Theoretical 42, 504005 (2009).
- Sela et al. (2011a) E. Sela, M. Punk, and M. Garst, Phys. Rev. B 84, 085434 (2011a).
- Berezinsky (1971) V. L. Berezinsky, Sov. Phys. JETP 32, 493 (1971).
- Kosterlitz and Thouless (1973) J. M. Kosterlitz and D. J. Thouless, Journal of Physics C: Solid State Physics 6, 1181 (1973).
- Huse (1981) D. A. Huse, Phys. Rev. B 24, 5180 (1981).
- Ortiz et al. (2012) G. Ortiz, E. Cobanera, and Z. Nussinov, Nuclear Physics B 854, 780 (2012).
- Sun et al. (2019) G. Sun, T. Vekua, E. Cobanera, and G. Ortiz, Phys. Rev. B 100, 094428 (2019).
- Li et al. (2020) Z.-Q. Li, L.-P. Yang, Z. Y. Xie, H.-H. Tu, H.-J. Liao, and T. Xiang, Phys. Rev. E 101, 060105 (2020).
- Samajdar et al. (2018) R. Samajdar, S. Choi, H. Pichler, M. D. Lukin, and S. Sachdev, Phys. Rev. A 98, 023614 (2018).
- Nyckees et al. (2021) S. Nyckees, J. Colbois, and F. Mila, Nuclear Physics B 965, 115365 (2021).
- Haldane (1981) F. D. M. Haldane, Journal of Physics C: Solid State Physics 14, 2585 (1981).
- Sela et al. (2011b) E. Sela, A. Altland, and A. Rosch, Phys. Rev. B 84, 085114 (2011b).
- Ornstein and Zernike (1914) L. S. Ornstein and F. Zernike, Amsterdam Proc. Sec. Sci. 17, 414 (1914).
- Eisert et al. (2010) J. Eisert, M. Cramer, and M. B. Plenio, Rev. Mod. Phys. 82, 277 (2010).
- Nishimoto (2011) S. Nishimoto, Phys. Rev. B 84, 195108 (2011).
- Coleman (1975) S. Coleman, Phys. Rev. D 11, 2088 (1975).
- Lecheminant et al. (2002) P. Lecheminant, A. O. Gogolin, and A. A. Nersesyan, Nuclear Physics B 639, 502 (2002).
- Hohenberg and Halperin (1977) P. C. Hohenberg and B. I. Halperin, Rev. Mod. Phys. 49, 435 (1977).
- Cardy (1993) J. L. Cardy, Nuclear Physics B 389, 577 (1993).
- Ashkin and Teller (1943) J. Ashkin and E. Teller, Phys. Rev. 64, 178 (1943).
- Kohmoto et al. (1981) M. Kohmoto, M. den Nijs, and L. P. Kadanoff, Phys. Rev. B 24, 5229 (1981).
- Schulz (1983) H. J. Schulz, Phys. Rev. B 28, 2746 (1983).
- Kibble (1976) T. W. B. Kibble, Journal of Physics A: Mathematical and General 9, 1387 (1976).
- Zurek (1985) W. H. Zurek, Nature 317, 505 (1985).
- Polkovnikov (2005) A. Polkovnikov, Phys. Rev. B 72, 161201 (2005).
- Zurek et al. (2005) W. H. Zurek, U. Dorner, and P. Zoller, Phys. Rev. Lett. 95, 105701 (2005).
- Dziarmaga (2005) J. Dziarmaga, Phys. Rev. Lett. 95, 245701 (2005).
- Voit (1995) J. Voit, Reports on Progress in Physics 58, 977 (1995).
- Coppersmith et al. (1982) S. N. Coppersmith, D. S. Fisher, B. I. Halperin, P. A. Lee, and W. F. Brinkman, Phys. Rev. B 25, 349 (1982).
Supplementary Information to:
Probing quantum floating phases in Rydberg atom arrays
Jin Zhang1,2, Sergio H. Cantú3, Fangli Liu3, Alexei Bylinskii3, Boris Braverman3, Florian Huber3, Jesse Amato-Grill3, Alexander Lukin3, Nathan Gemelke3, Alexander Keesling3, Sheng-Tao Wang3, Y. Meurice1, S.-W. Tsai4
1Department of Physics and Astronomy, The University of Iowa, Iowa City, IA 52242, USA
2Department of Physics and Chongqing Key Laboratory for Strongly Coupled Physics, Chongqing University, Chongqing 401331, China
3QuEra Computing Inc., 1284 Soldiers Field Road, Boston, MA, 02135, USA
4Department of Physics and Astronomy, University of California, Riverside, CA 92521, USA
I Methods
I.1 Creation of Atom Array
In this experiment, we utilize \ce^87Rb atoms captured from a magneto optical trap (MOT). The atoms are loaded with probability into optical tweezers generated using 840 nm light, which are created through a phase-only spatial light modulator (SLM, Hamamatsu X15213 series) to generate the trapping potentials with a depth of 10 MHz, as determined by the Stark shift associated with the to transition. Subsequently, we image atoms for 15 ms using near resonant 780 nm light, which is captured through a microscope objective of to image onto an EMCCD camera (Andor iXon Ultra) to capture the occupation of each site with fidelity. From the atom detection results, atoms are moved using acousto-optic deflectors (AODs) to sort atoms onto the target two-legged pattern with sorting fidelity. Following imaging, the atoms are cooled to a temperature of 10 K and polarized into the state.
I.2 Rydberg System
The atomic levels we use in our qubit system are and , which are coherently driven by a two-photon transition induced by lasers at nm and nm. The 420 nm laser is a frequency-doubled Ti:Sapphire laser (M Squared). We frequency stabilize the laser by locking a frequency sideband generated by an electro-optic modulator to an ultra-low-expansion (ULE) reference cavity (notched cylinder design, Stable Laser Systems), with finesse at 840 nm. The 1,013 nm laser source is a whispering-gallery mode laser (OEwaves - OE3745), which is locked to the same reference cavity with a finesse of . The 1013-nm laser is amplified by an fiber amplifier (IPG YAM-100-1013-LP-SF).
We place the Rydberg two-photon transition at a single-photon detuning of GHz blue detuned from the intermediate state with Rabi frequencies MHz, and a two-photon Rabi frequency of MHz.
I.3 Rydberg Pulses
Atoms are adiabatically released from the tweezer traps after initializing them into the ground state . The total time with the traps off is 7 s. It is during the trap-off time that we apply a Rydberg pulse. The pulse is described by a time-dependent Rabi frequency , time-dependent detuning , and instantaneous phase . This is implemented by controlling the amplitude, frequency, and phase of the 420-nm laser using a double-pass acousto-optic modulator (AOM) configuration.
I.4 Rydberg Beam Shape
We shape both Rydberg excitation beams into one-dimensional top-hats (light sheets) to homogeneously illuminate the plane of atoms. This is done by placing a SLM in the Fourier plane of each Rydberg beam. This allows us to control both phase and intensity on the atoms at the cost of efficiency. The tophat geometry is 75 m wide in the plane of the atom array, and has a waist of m along the axis normal to the atom array plane.
I.5 Experimental Results for the Disordered Phase
We have studied the dependence of the structure factor on the Rydberg blockade radius in Fig. 4 in the main text, which shows strong signatures for the existence of the crystalline and orders and the incommensurate floating phase. In order to preclude the possibility that the signals are introduced by the boundary effects, we also experimentally measure in the disordered phase at for the same range of between and and the same system sizes . The results are presented in Figs. 5a-c with a numerical result for in Fig. 5d. Very weak signals can be seen in for all the cases in Fig. 5. More importantly, there is no dominant peak in , so no indication of the presence of a density wave order in the prepared states. These signals in diminish as the system sizes increase, indicating that the structure factor for the disordered phase tends to be zero in the thermodynamic limit. The numerical result shows that the peak height of for is about of that for , which is almost zero and confirms that for the disordered phase approaches zero in the large limit. Therefore, we conclude that the boundary effects will not induce artificial signatures for the existence of density-wave orders in our experiments.
I.6 Numerical Methods
We perform finite-size density-matrix renormalization group (DMRG) calculations White (1992, 1993); Östlund and Rommer (1995) with the ITensor Julia Library Fishman et al. (2022). All the Rydberg interactions within consecutive rungs are kept in the Hamiltonian to maximally mimic the long-range interaction in the Rydberg Hamiltonian. When searching for the ground state, we gradually increase the maximal bond dimension during the variational sweeps until the truncation error is below . Some calculations using different truncation errors are specified later. DMRG sweeps are terminated once the ground-state energy changes less than and the von Neumann entanglement entropy changes less than in the last two sweeps. Generally, thousands of DMRG sweeps are needed in the quantum floating phase and more sweeps are needed for convergence for larger Rydberg blockade radius .
I.7 Simulation of Finite Experimental Measurement Samples
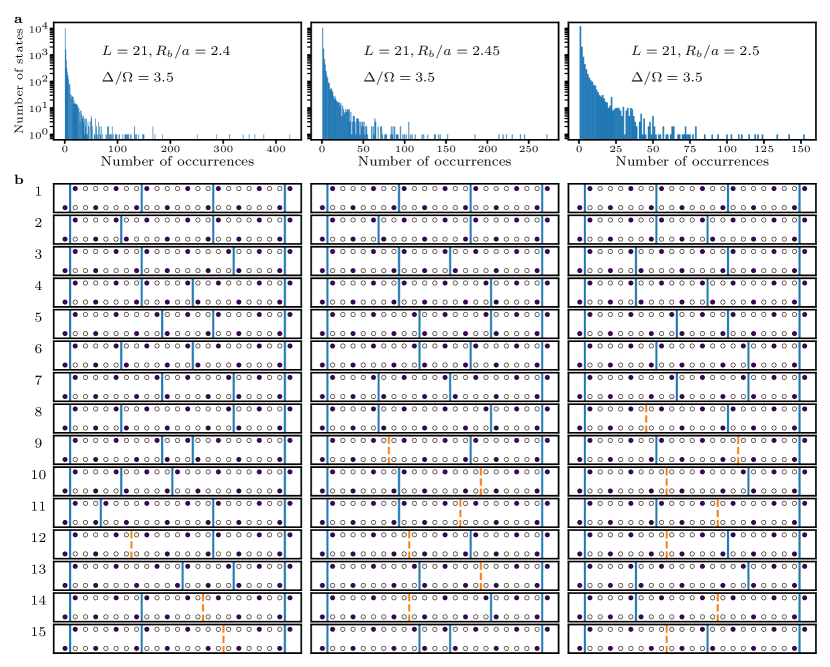
In Fig. 2 of the main text, our experimental data show that the distribution of bitstring occurrence frequency is very distinct in different phases and reveal that the quantum state of the floating phase is created by the proliferation of domain walls. Here, we provide numerical data to the experimental results for the floating phase. Figure 6 shows the numerical bitstring occurrence frequency for and sampled from the many-body wavefunction. The values of , and are inside the floating phase close to boundary, at the midpoint of and boundaries, and close to boundary, respectively. Notice that the floating phase in the experiment has slight shift relative to the numerical results and the experimental results for are presented in the main text. We calculate the ground-state wavefunction using DMRG, and sample the classical bitstrings times according to the density matrix. It is seen that the number of occurrences for the most probable state are 426, 272, and 152, respectively. Unlike the ordered state where the occurrence frequency of the classical state is much larger than other states (see Fig. 2 in the main text), there are many classical bitstrings with similar occurrence frequencies that decrease slowly to zero.
As explained in the main text and here below, the wave vector of the finite-size floating phase for takes one value . It is thus expected that the most probable classical bitstrings have 7 Rydberg excitations in each leg with domain walls almost evenly distributed in the ladder. The most probable bitstrings are shown in Fig. 6b. One can see that the most probable bitstring is exactly the same as the one in experimental measurements. For numerical results, the seven most probable bitstrings for three values of are exactly the same, indicating that the three cases are in the same floating phase as expected. The six most probable bitstrings for the numerical results can also be found in the fifty most probable bitstrings for the experimental measurements. In each leg of these states, the seven Rydberg states arrange themselves such that “rggg" and “rgg" appear alternately. The orders of arrangements of the Rydberg states in the two legs are opposite to further reduce the energy. Notice that the classical state has only one Rydberg state in any two nearest-neighbor (NN) rungs (see Fig. 2d). We identify NN rungs with two Rydberg states on the diagonal sites as a domain wall (type-1, highlighted by blue solid lines in Fig. 6b). This type of domain walls also labels where the domain changes sublattices. For instance, the first domain of the most probable state has Rydberg states on the rungs with indices , while for the second domain and for the third domain. Thus, there are four domain walls equally distributed in the most probable bitstring that has the minimal energy. Nonuniform distributions of domain walls cost energy and have lower occurrence frequency. We have checked that twenty out of twenty-two most probable bitstrings for the experimental results have seven Rydberg excitations in each leg and four type-1 domain walls. So our experiment successfully probe the quantum floating phase up to some small defects.
Another type of domain wall shown in Fig. 6b is the empty NN rungs (type-2, highlighted by orange dashed lines), which not only label where the domain changes sublattices but also reduce the number of Rydberg states and cost more energy. Thus, it appears in the states with relatively lower occurrence frequency. Notice that increasing brings more repulsive energy that tends to decrease the Rydberg density, so the occurrence frequency of the most probable bitstring that only have type-1 domain walls decreases with increasing . In the large limit, the quantum state in the floating phase is a superposition of an infinite number of these domain-wall states. An infinitesimal redistribution of these domain-wall states gives gapless excitations.
II Phase Diagram from Entanglement Entropy
The phase diagram shown in Fig. 1b is plotted from the structure factor , which is experimentally accessible by measuring the density-density correlations. Theoretically, the entanglement entropy is a universal tool to map out the phase diagram of quantum systems without any prior knowledge. Thus, we show numerical results below the corresponding phase diagram produced from entanglement entropy. We also discuss rich physics of quantum phase transitions and critical phenomena present in our Rydberg ladder system setup and provide substantial numerical evidence in the following sections.
For a quantum system consisting of and parts, the bipartite ground-state entanglement entropy is defined as , where the reduced density operator of subsystem is and is the ground state. At critical points of one-dimensional (1D) quantum systems with open boundary conditions (OBC) or periodic boundary conditions (PBC), the conformal field theory (CFT) predicts that the entanglement entropy has the following form Affleck and Ludwig (1991); Holzhey et al. (1994); Vidal et al. (2003); Calabrese and Cardy (2004, 2009)
| (3) |
where is the central charge, are constants, and are the sizes of the 1D system and the subsystem , respectively. For a fixed ratio , the entanglement entropy between two parts diverges logarithmically with , which can be used to pick out the critical lines (phases) in the phase diagram.
In our setup, the two-leg Rydberg ladder has lattice spacings and and it consists of rungs plus two extra sites on the bottom left corner and the top right corner, respectively. We refer this boundary condition in a ladder as the shifted boundary condition (SBC), while ladder systems with OBCs do not have the two extra sites. In DMRG calculations, we treat the ladder system as a “chain with OBC” and label the sites by integers from to . The two boundary sites are labeled by and , respectively. In the bulk, the sites in the bottom row are labeled by even numbers, while the sites in the top row are labeled by odd numbers. The entanglement entropy between two halves of the ladder is used to draw the phase diagram shown in Fig. 7. It is seen that the low entanglement areas precisely depict the crystalline orders with spontaneous () symmetry breaking. In 1D Rydberg chains, orders with integer will successively show up as increases, while ladder systems may forbid certain orders due to strong interchain interactions. Here, orders with odd are forbidden in our ladder system, as we explain in the next paragraph. Based on other studies for 1D Rydberg systems Fendley et al. (2004); Weimer and Büchler (2010); Sela et al. (2011a); Chepiga and Mila (2019); Rader and Läuchli (2019), the high plateau between and orders and the one between and orders are the incommensurate density waves or the critical quantum floating phase with emergent U(1) symmetry studied in the main text. We can also identify the disordered phase in the regime that smoothly connects to the limit.
Strong interchain interactions significantly facilitate the formation of orders with even . Given that the Rydberg state in one leg blockades the region with a length of in the other leg, a order with even needs at most to form, while the formation of orders in the 1D Rydberg chain requires . Consequently, crystalline orders in our ladder system manifest at a significantly smaller Rydberg blockade radius than those in the 1D Rydberg chain Rader and Läuchli (2019); Maceira et al. (2022). However, orders with odd in the ladder system break the reflection symmetry (see Fig. 1c for the Rydberg density map of the order) and cannot form in the same way. If two chains are put together, the minimal energy case is to shift one chain by , leading to two Rydberg states occupying the diagonal sites in two rungs separated by . For odd , orders require that there is a parameter regime where the Rydberg blockade radius is larger than (to form order in each leg) but smaller than the diagonal in every two rungs separated by (to allow both diagonal sites occupied by Rydberg states). In our system, the diagonal of NN rungs is , so a large lobe shows up. However, the above conditions cannot be satisfied for orders with odd , precluding the existence of such density waves in the phase diagram. In the classical limit (), one can show that, due to interchain interactions, the energy of orders with odd is always higher than other crystalline orders.
In ordered phase, there are degenerate states that break symmetry. Shifting one of these states by one lattice spacing times can generate the other degenerate states. This also applies to incommensurate floating phase where there are infinite degenerate states. In finite-size systems, different degenerate states have different boundary energy and the degeneracy is lifted. For Rydberg ladders with SBCs, the two extra sites on the boundary have a smaller Rydberg blockade effect due to a smaller number of neighbors and favor Rydberg excited states, which picks out one particular symmetry-breaking state that starts with Rydberg density and ends with . Notice that if the state with chosen by the left boundary site is different from the one with chosen by the right boundary site, domain walls will appear in the middle of the ladder. This puts a constraint on the length of the ladder to have clean crystalline orders in the system. To make the system size compatible with crystalline orders, the number of rungs of the ladder should be for , , , and orders, respectively. In our calculations for the phase diagram (Fig. 1b and Fig. 7), we use , and for ( and ), ( and ), and (), respectively. In the thermodynamic limit, the choice of different s will not matter.
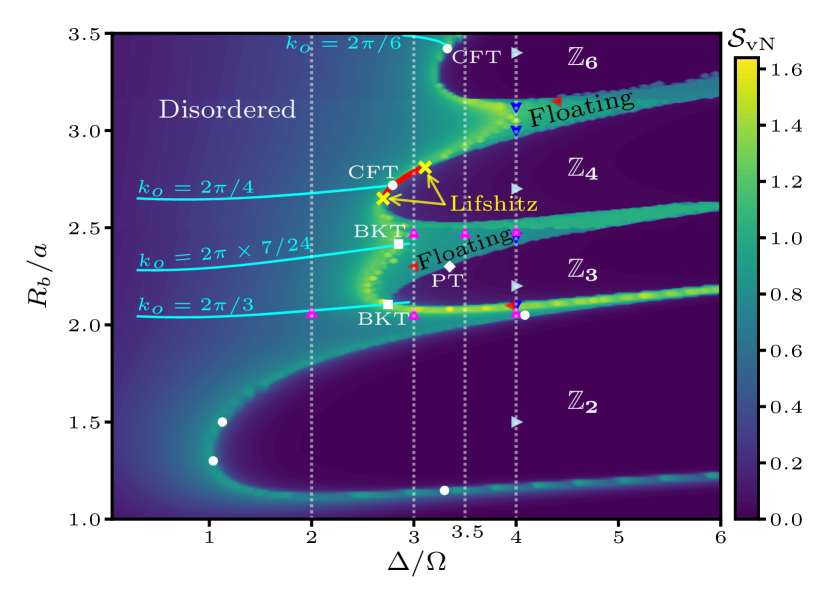
The peaks or the sudden jumps of entanglement entropy can portray all the phase boundaries. The boundary between the order and the disordered phase shows up as a line of peaks of , where the criticality is of Ising universality class with correlation length exponent and dynamical exponent . The bright yellow line of peaks of between the disordered phase and the floating phase is a Berezinskii-Kosterlitz-Thouless (BKT) transition line with an essential singularity in the correlation length as a function of parameters Chepiga and Mila (2019); Berezinsky (1971); Kosterlitz and Thouless (1973); Kosterlitz (1974). The quantum phase transition between the floating phase and crystalline orders is signaled by a sudden jump of and is of Porkrovsky-Talapov (PT) universality class with Pokrovsky and Talapov (1979). Looking at the melting of crystalline orders into the disordered phase, the order only directly shares a small portion of the boundary with the disordered phase (red solid line in Fig. 7), and shares the rest of the boundary with the floating phase. As crystalline orders melt, different types of domain-wall excitations that cost different energies yields chiral perturbations Huse (1981); Ostlund (1981); Huse and Fisher (1982, 1984). If the chiral perturbation is relevant, the quantum phase transition between crystalline ordered and the disordered phases becomes chiral with . Stronger chiral perturbations will lead to the critical floating phase with emergent U(1) symmetry between crystalline orders and the disordered phase. The critical exponents change continuously with parameters on the chiral transition line, which ends at Lifshitz points with where the floating phase bounded by BKT and PT lines appears Chepiga and Mila (2021b). There should be a single CFT point with on the chiral transition line where the chiral perturbation vanishes, residing at the intersection of the commensurate line and the boundary Chepiga and Mila (2021a). All of these predictions are observed around the order in Fig. 7 and numerical evidence is provided in later sections. The Lifshitz points are found roughly around by looking at where the floating phase starts to show up. The CFT point for order is accurately determined at (see below for details). The same observation applies to order and the CFT point is found around .
The observations around the order in our ladder system are the same as those for and orders in 1D Rydberg chains, but the situations around and orders in the ladder system are very different. Unlike the 1D Rydberg chain, the order in the two-leg Rydberg ladder is fully covered by the floating phase and does not directly melt into the disordered phase. Notice that there is a narrow floating phase between the disordered phase and the order near the lower part of the lobe; for example, is in the floating phase (see below). In the ladder, the state with odd breaks symmetry, while the state with even still breaks symmetry. By shifting and flipping the ladder, there are six degenerate configurations for the order in the ladder system, while the degeneracy of the order in 1D chain is three. This means that according to the studies of clock models Ortiz et al. (2012); Sun et al. (2019); Li et al. (2020), continuous symmetry can emerge from large discrete cyclic symmetry even without chiral perturbations. Therefore, the observation that the order is fully covered by a critical phase is reasonable. Similar explanations also apply to the 1D Rydberg chain, where there is always a critical phase between the order and the disordered phase due to strong chiral perturbations and the emergence of continuous symmetry from large discrete cyclic symmetry. However, in the two-leg Rydberg ladder, the strong interchain interaction may destabilize criticality so that direct melting of the order to the disordered phase is still possible (Fig. 20). In the following sections, we provide substantial numerical evidence for all the above analyses about the phase diagram in Fig. 7.
III Density Profiles, Structure Factors, and Effects of Boundary Conditions
III.1 Numerical Density Profiles and Fourier Transforms
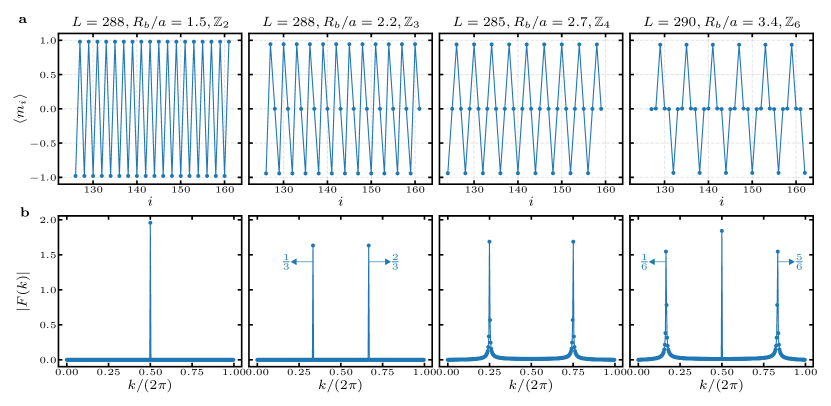
We first show numerical results for the density profiles and corresponding Fourier transforms for the crystalline orders (Fig. 8) and the floating phase (Fig. 9) for a large system size. For a two-leg ladder, the order parameter is the Fourier transform of the local density, where is the rung index and is the leg index. In our case, all the density-wave orders in the phase diagram break the up-down symmetry and is finite. Thus, it is enough to probe those orders only using in the Fourier transform. In the following, we will omit the subscript and just use in the Fourier transform. The profiles for the density difference of each rung are plotted in Fig. 8a for crystalline orders. For , , and orders, the profile of takes the form “”, “”, and “”, respectively. The degeneracy of the symmetry breaking states is equal to the periodicity of the density wave. The profile of the order takes the form “”, and there are degenerate states. Notice that the maximal value of should be smaller than in the quantum regime. The absolute value of the Fast Fourier Transform (FFT) of , ( is the wavelength of the density wave), is presented in Fig. 8b. It is seen that the peak of is located at and as expected. For the order, also has a peak at , which is easy to check using the bitstring of . Similarly, the profile of for the floating phase is presented in Fig. 9a. We show four floating phases that have fractional wavelengths between and , between and , between and , and between and , respectively. The FFT in Fig. 9b also gives the expected wave vector. For the floating phase at , the wave length is very close to integer and the wave vector is close to . A density wave like , so the small frequency difference gives rise to a big wave packet in the profile.
III.2 Structure Factors
Local density profiles of density wave orders can be mixed with domain walls due to finite size and boundary effects, and the Friedel oscillations from the boundary may overwhelm the signal of the bulk oscillations. The correlation functions are more suitable to study the bulk properties associated with quantum phase transitions. We have experimentally measured the structure factor , which is the Fourier transform of density-density correlations as defined in Eq. (2) in the main text. The numerical density-density correlations are presented in Fig. 10. Same as the experimental results, the correlation matrix for the disordered phase has non-zero diagonal elements and nearly zero off-diagonal elements, but the numerical off-diagonal elements have no site-dependent fluctuations, which the experimental results have as shown in the main text. In the crystalline orders, the numerical correlations show perfect periodic oscillations without any amplitude decay with the distance , demonstrating the existence of long-range orders. The black boxes in Figs. 10b and d encircle the smallest repeating units for and orders, respectively. No such repeating unit is observed in the numerical correlation matrix for the floating phase, indicating that the floating phase has a wavelength that is incommensurate with the lattice spacing.
In our experiment, one of the limitations of creating ordered phases is the introduction of errors due to quantum fluctuations and a thermal environment. This is evidenced by a finite correlation length, , as an exponential amplitude decay between correlations across two points during single shot measurements and averaged across the whole experiment.
III.3 Effects of Different Boundary Conditions
In Fig. 11, we show more numerical results on the structure factor in small systems along cut and illustrate the boundary effects. For SBCs, we show the results for four system sizes that are compatible with both and orders, but not with and orders. In the regime of and orders, the structure factor shows the correct peaks at and . But in the regime of and orders, the peak at is split into two and the peak at is shifted due to domain wall defects. Using SBCs, the states should have inversion symmetry around the center of the ladder such that the sum in are almost canceled and the peak at splits. These effects diminish as increases.
For OBCs, the boundary rungs also favor Rydberg states, the four system sizes presented are , which are also compatible with and orders. For , most regime of the order has no up-down symmetry breaking in DMRG calculations and there is no peak in , while the symmetry breaking happens for larger system sizes. For , the size of rungs is larger than the blockade radius, the boundary rungs can have double occupations such that the bulk has a clean order. The peak at does not split into two, so the system sizes are also compatible with order. However, is not compatible with order, so the peak at is shifted. The small jump of the plateau around comes from the change of symmetry of the state from reflection symmetry to inversion symmetry (signaled by the splitting of the peak). These discrepancies observed above again diminish as increases. Finally, the systems with and PBCs are compatible with all () orders and the peak of precisely resides at .
Using the proper normalization factor described in the main text, the peak height of is for the classical orders with even , and for odd . In the quantum regime, the peak height is lower than that in the classical limit. The peak heights of in Fig. 11 and Fig. 16 are consistent with the above expectations. Assuming that the local density for the floating phase is , where is the incommensurate wave vector, one can show that at least for the floating phase in the large limit, while is zero in the disordered phase. These facts can be used to differentiate between the floating phase and the disordered phase in the incommensurate regime.
In the incommensurate regime between crystalline orders, the wave vectors change continuously with the physical parameters in the thermodynamic limit. For finite systems, however, the constraints on the amplitude of density waves on the boundaries discretize the allowed wave vectors. For SBCs, the Rydberg density on boundary sites tends to be and only certain wavelengths can satisfy the boundary conditions. The PBCs also naturally discretize the wave vectors. If for SBCs or ( is an integer) for PBCs, the discrete wave vectors allowed in the floating phase takes values between and orders, values between and orders, and values between and orders. For OBCs, the boundary rungs favor Rydberg states that can reside in the same leg or different legs. The constraints on the density waves for OBCs are weaker than those for SBCs and PBCs. There are more allowed wave vectors between crystalline orders. The results in Fig. 11 confirm all the above expectations. Notice that the incommensurate regime between and orders is mainly the disordered phase, so most of the peak plateaus of decay as increases. On the other hand, the narrow peak plateaus that do not decay with increasing near plateau demonstrate the existence of a narrow floating phase there. In the thermodynamic limit, , the wave vector changes continuously with the physical parameters.
A Rydberg ladder with PBCs is a three dimensional cylinder with a height and is not realizable in our experiments. For OBCs, because the geometry is symmetric under flipping the leg index, the adiabatic time evolution initialized from all atoms in the state will randomly prepare one of two degenerate states related by flipping the leg index, which obfuscates the observation of the density waves from the average density profile. Figure 11 shows that the structure factor for SBCs has cleaner signals than that for OBCs in our experimental regime from the order to the order, so we use SBCs in our experiments.
IV Criticality of the Quantum Floating Phase
Based on symmetry arguments, the emerging incommensurate quantum floating phase with continuous U(1) symmetry can be explained by simple chiral clock models Samajdar et al. (2018); Nyckees et al. (2021). In fact, there is a simple intuitive picture for the incommensurate density waves with an irrational wave length (in units of lattice spacing ). Assuming the density wave is described by with being an irrational number, the phase takes different values for any two different s and the local density profile never repeats. When takes all integer values, exhausts all values between and . So an arbitrary shift in the phase does not change the incommensurate wave and the continuous translational symmetry emerges. Here, the periodicity is infinite and symmetry with becomes a U(1) symmetry. Theoretically, the floating phase should be a critical phase that has infinite degeneracies and it can be described by the Tomonaga-Luttinger Liquid (TLL) effective theory Haldane (1981); Sela et al. (2011b). In this section below, we provide numerical evidence to show the criticality of the quantum floating phase by the divergence of the correlation length and find that its central charge by fitting the entanglement entropy.
IV.1 Correlation Length
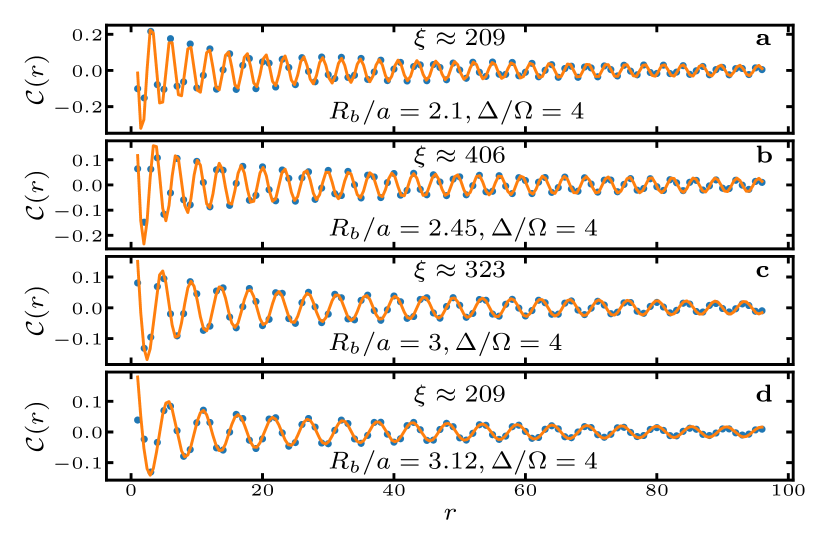
To demonstrate that the floating phase is critical, we first show numerically that the correlation length diverges. The connected density-density correlators () for are presented in Fig. 12 based on DMRG calculations, where the four floating phases have the same parameters as those in Fig. 9. One can see that decreases slowly with the distance for all the floating phases shown here, indicating that the correlation length is large. We fit the connected correlators to the Ornstein–Zernicke form Ornstein and Zernike (1914)
| (4) |
and extract the correlation length . The first two data points for are discarded in the curve fit. It can be seen that the quality of curve fit is excellent for all the cases and the extracted is , , , and for , , , and on the cut, respectively. All the fitted values of are of the same order as the system size , indicating that the correlation length diverges in the thermodynamic limit and the floating phase is gapless.
IV.2 Entanglement Entropy
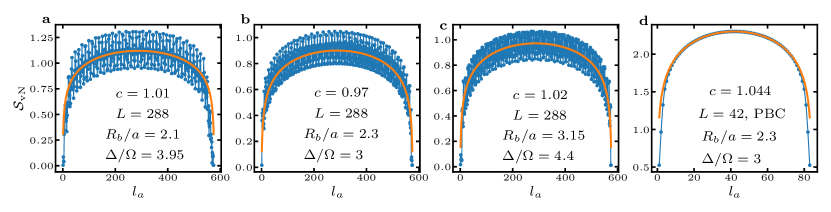
Another feature of the critical phase in 1D system is that the entanglement entropy as a function of subsystem size should satisfy the formula in Eq. (3). Here, the periodic oscillations of density waves should also result in fluctuations in on top of Eq. (3). We plot as a function of the number of sites of the subsystem for three floating phases between and orders, and orders, and and orders in Fig. 13a, b, and c, respectively. The number of rungs for the ladder system is for the first three subplots. In Fig. 13d, the results for the floating phase between and orders with and PBC (the truncation error is used in DMRG) are presented. We remark that the crystalline orders have short-range correlations and are gapped phases, area laws Eisert et al. (2010) ensure that the entanglement entropy of symmetry breaking phases is close to zero and does not scale with the system size (not shown here).
It can be seen that there indeed exist oscillations in for the floating phase with SBCs. The pattern of the oscillations is not clear, but Eq. (3) should correctly describe the main behavior of . We fit the formula in Eq. (3) to , where of the data points on both sides are discarded to reduce the boundary effects. The fitted values of the central charge are , , and for the three finite-size floating phases with SBCs, respectively. For the system with and PBC, there is no oscillation in . Due to the translational invariance in units of lattice spacing in systems with PBCs and the incommensurate wave vector of the floating phase, translational symmetry breaking cannot happen and the density wave form of the floating phase does not show up. The formula in Eq. (3) for PBCs applies to the entanglement entropy in Fig. 13d and the fitted central charge is . All the results are consistent with the expectation that the central charge of the floating phase should be , which means the low-energy effective theory is described by TLL Nishimoto (2011) or the sine-Gordon model Coleman (1975); Lecheminant et al. (2002).
V 1D Rydberg Chain versus Two-leg Rydberg Ladder
In this section, we numerically compare and contrast the 1D Rydberg chain setup with our two-leg Rydberg ladder setup and show that the floating phase regions are much broader in our two-leg ladder array than the 1D chain. First, we introduce the connected density-density correlator and demonstrate subsequently that the conclusions drawn from the connected density-density correlators are consistent with our results obtained from the structure factors. We examine the 1D Rydberg chain and show that the connected density-density correlators diverge in the thermodynamic limit at the peak wave vector in the floating phase. There are narrow regions of quantum floating phase between the and orders, but most of the incommensurate regime there is in the disordered phase. These conclusions are consistent with previous studies Chepiga and Mila (2019); Rader and Läuchli (2019); Chepiga and Mila (2021a, b); Maceira et al. (2022).
On the other hand, similar analysis shows that there are broad regions of the quantum floating phase between the and orders for the two-leg ladder system. As is analysed before, interactions among the two legs of the ladder in the chosen geometric aspect ratio can lead to the appearance of the translational-symmetry-breaking states at much smaller . In particular, the state in our two-leg ladder, which breaks the symmetry, has more types of domain walls in the melting process than the state in the 1D Rydberg chain does. Intuitively, we suspect that more types of domain walls can generate stronger chiral perturbations between the crystalline ordered and the disordered phases, which in turn produce bigger regions of the floating phase. The existence of broad regions of the floating phase in experimentally accessible parameters of greatly facilitate our experimental observation of the floating phase.
V.1 Connected Density-Density Correlator
We have numerically demonstrated in the previous section that the incommensurate regime with high entanglement plateau in the phase diagram is a critical floating phase. The connected density-density correlation function quantifies the extent of quantum fluctuations in real space, and its Fourier transform
| (5) |
is an analog of magnetic susceptibility and diverges in the critical floating phase at the density wave vector (the peak position of the structure factor). Here, we also use the effective length as the normalization factor, where is the wave length of the density wave and can be determined by the peak position of . In crystalline orders, the correlation is short-range and is close to zero. As long as the system is in a gapped phase and the correlation length is finite, the peak height of would be finite.
V.2 One-dimensional Rydberg Chain
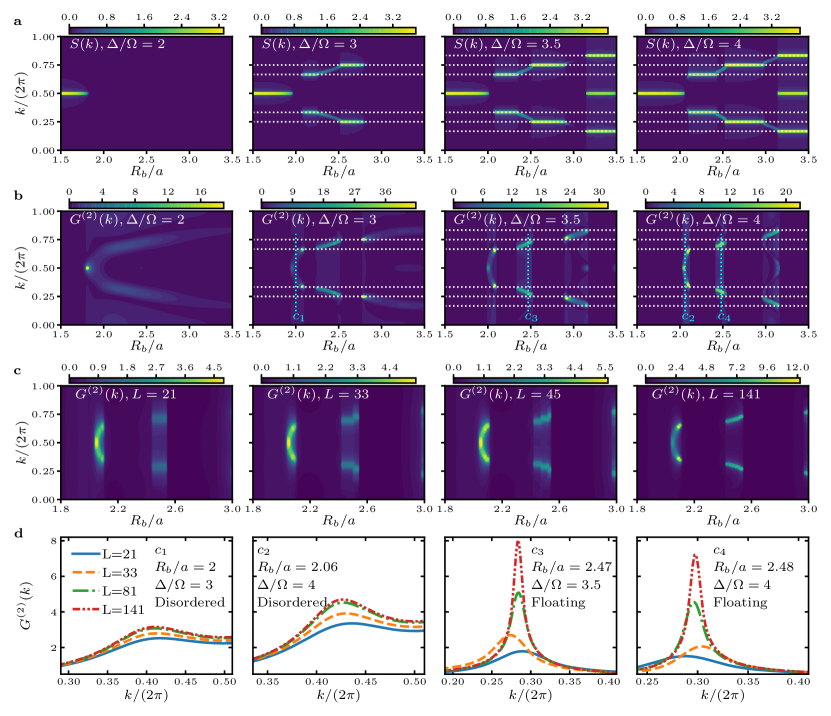
In order to check the above statements, we first examine the results for the well studied 1D Rydberg chain. In Fig. 14, we show the structure factor and the connected density-density correlator for the 1D Rydberg chain on the cut. The full phase diagram of the 1D chain can be found in Ref. Maceira et al. (2022). We focus on the regime where , , and orders appear successively. The system sizes (number of sites) with are compatible with all three crystalline orders. Figure 14a shows the structure factor as a function of and defined in the same way as Eq. (2) in the main text. The mean density is subtracted from the local density in the calculation to remove the peak of at . For classical orders, one can show that the structure factor for the 1D Rydberg chain is always at and . We can see that the numerical values of for precisely depict the peak at and with peak height close to . It can also be seen that the peak width decreases with increasing . The structure factor in the incommensurate regime between and orders does not show obvious peaks even for the small system with and decreases close to zero as increases. On the other hand, there are clear peaks in between and orders. Because the boundary sites favor Rydberg excited states, particular density waves starting with and ending with are chosen and the allowed wave vectors are discretized. For ( is an integer), the allowed wave vectors in units of takes values between and orders: . The results for in Fig. 14a confirm the above arguments. These peaks suggest that there exist an floating phase between and orders. For very large , the peak height of for most of the regime between and orders becomes close to zero, while the peak height in very narrow parts near the crystalline boundaries remains finite. This indicates that there only exists a narrow floating phase near the boundaries of crystalline orders and most of the incommensurate regime between and orders is in the disordered phase.
The information about the critical floating phase can also be read out from in Fig. 14b. In the regime of crystalline orders, is nearly zero, while it is large in the incommensurate regime between crystalline orders. It is clear that the regime between and orders is the disordered phase, where should be finite except two critical points at the phase transitions between orders and the disordered phase. As increases, the peak height of in the disordered phase saturates to a finite value (first plot of Fig. 14c), while the peak heights at the two critical points keep increasing. Due to the existence of a critical floating phase between and orders, the peak height of is larger and increases faster than that in the regime between and orders (Fig. 14c). For the regime between and orders with , one can see two narrow parts with sharp peaks in near order and order, respectively, and the middle part of the regime has relatively smaller peaks.
To clarify these observations more clearly, we present as a function of for five system sizes and four values of in Fig. 14c. The system is in the disordered phase for and the peak height at the peak position saturates to a finite value, while the system is in the floating phase for and seems to diverge in the large limit. Figure 15 depicts the inverse peak height of as a function of for the 1D Rydberg chain. The data points are fit to the power-law function and the extrapolated value is the inverse peak height of in the thermodynamic limit. For , the system is in the disordered phase between and orders. For , it is in the disordered phase between and orders. For , the system is in the floating phase near and orders, respectively. One can see that the extrapolated value of converges to a finite value for the disordered phase, while it approaches zero for the floating phase in the thermodynamic limit. Our analyses thus verify that the connected density-density correlator diverges in the floating phase. All the results presented here are consistent with previous works for the 1D Rydberg chain Chepiga and Mila (2019); Rader and Läuchli (2019); Chepiga and Mila (2021a, b); Maceira et al. (2022).
V.3 Two-leg Rydberg Ladder
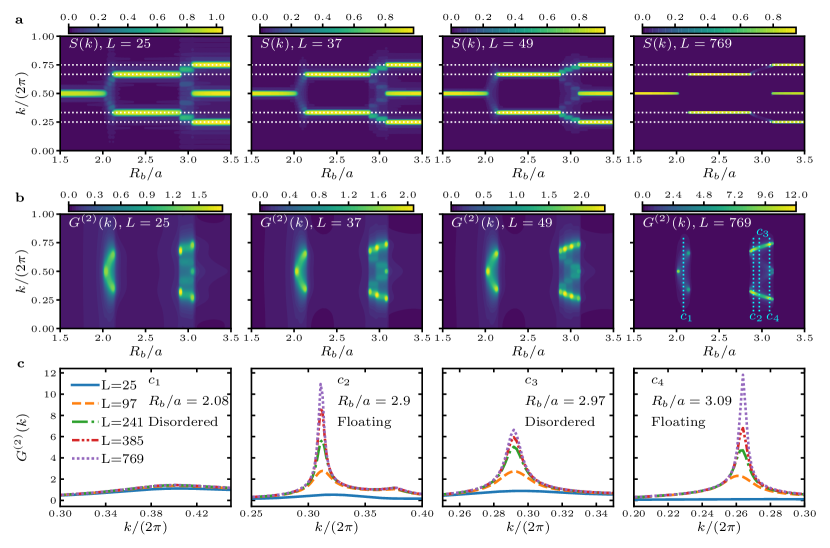
We now perform similar analysis for the two-leg Rydberg ladder studied in this work. Figure 16 shows the structure factors and the connected density-density correlators for various system sizes. In Fig. 16a, as a function of and on four vertical cuts are presented, where the data sets are the same as those in Fig. 1b. The cut only goes from order into the disordered phase, and thus only shows sharp peaks at . Note that the regime where has prominent peaks with peak positions changing continuously is the floating phase. One can easily identify what density wave orders other cuts go through by looking at the peak of . In particular, the cut goes into the disordered phase after order, and between and orders on the cut is the disordered phase. Notice that between and orders are the disordered phase followed by a narrow floating phase near order, which is supported by the narrow peaks of near plateau on the cuts (zoom in for better view).
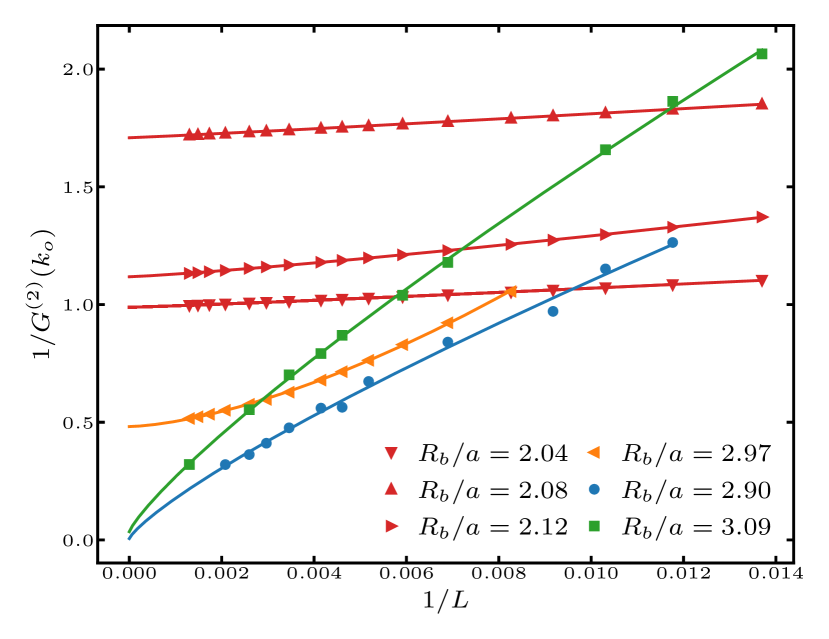
Figure 16b shows the connected correlator for the same parameter regime as Fig. 16a. Similar behaviors for as those in the 1D Rydberg chain can be seen and only incommensurate regimes between crystalline orders have prominent peaks. The narrow but finite regime of sharp peaks in before regime also suggests a floating phase there. Figure 16c shows more plots of at and for smaller system sizes, where one can see the peak heights of for the floating phase also increases with increasing . As mentioned before, SBCs discretize the wave vectors for the floating phase and result in steps in the peak plateaus between and orders. We also show as a function of for four system sizes and four sets of parameters in Fig. 16d and plot the finite-size scaling of the inverse peak height of in Fig. 17. Similar observations as those in the 1D Rydberg chain can be seen and the same conclusion can be drawn that the connected density-density correlator diverges in the floating phase of the two-leg Rydberg ladder. Importantly, the comparison between the 1D Rydberg chain and the two-leg Rydberg ladder shows that the floating phase region is much broader for the two-leg ladder than the 1D Rydberg chain between and orders, which greatly facilitates the experimental observation of the floating phase in our experiment using the two-leg ladder setup.
VI Quantum Phase Transitions in the Two-leg Rydberg Ladder
Since our experiments can probe both crystalline orders and the floating phase, the associated quantum phase transitions can be studied in future works. Here, we provide numerical studies for the quantum phase transitions in the two-leg Rydberg ladder. Previous works studied the quantum phase transitions in the 1D Rydberg chain by looking at divergence of the correlation length extracted from DMRG calculations of correlation functions for very large systems (up to ) Chepiga and Mila (2019, 2021a, 2021b); Maceira et al. (2022). Here, we use Binder Cumulant and the energy gap to locate the phase transition point and determine the correlation length exponent and the dynamical exponent . The Binder Cumulant is defined by
| (6) |
where is the order parameter of the density wave order with wave vector . If is fixed, at the phase transition point between two gapped phases, the correlation length diverges as , where is the value of at the critical point and is the correlation length exponent. The Binder Cumulant satisfies the functional form
| (7) |
up to a subleading correction around the critical point, where is some universal function. It is a dimensionless quantity and has a fixed point at the phase transition point. In the large limit, with different s should intersect at the phase transition point . By finding the best data collapse of for different system sizes, we can determine the values of both and .
The dynamical exponent is defined such that the dispersion relation for small at the critical point. This means that the characteristic time of the system can relate to the correlation length by Hohenberg and Halperin (1977). For phase transition points that are described by CFTs, there is a linear dispersion relation and . There also exist other phase transition points like chiral transitions with Cardy (1993); Nyckees et al. (2021). Numerically, the energy gap between the first excited state and the ground state in finite systems can be used to determine , utilizing the ansatz
| (8) |
where is another universal function. The best data collapse of the rescaled energy gap can simultaneously give values of , , and . In practice, we first fit as a function of in a small window around the critical point to a high-degree polynomial, scanning the values of and to minimize the residual sum of squares. Then, we perform the same procedure for the energy gap with fixed and obtained from to determine .
In the following subsections, we carefully investigate the quantum phase transitions across the , and lobes. Through thorough numerical analysis, we show the existence of a variety of quantum phase transitions, including Ising phase transitions, conformal and chiral phase transitions, and BKT and PT phase transitions, which are similarly present in the 1D Rydberg chain Chepiga and Mila (2019); Rader and Läuchli (2019); Chepiga and Mila (2021a, b); Maceira et al. (2022). Compared to the 1D chain, however, some of the phase transitions are more readily accessible in experiment in the two-leg Rydberg ladder setup. Hence, our theoretical analysis here paves the way for near-future experimental studies of rich quantum phase transition physics experimentally accessible in the two-leg Rydberg ladder.
VI.1 Ising Phase Transitions
The domain wall excitations on top of the symmetry breaking state have only one type and no chiral perturbation is introduced. As shown in Fig. 1(b), the peak position of the structure factor around order is constant at and . The quantum phase transitions between order and disordered phases are of Ising CFT points with and . To show the numerical evidence and test the validity of data collapse, we present Binder Cumulant and rescaled energy gap for four phase transition points on the boundary of order in Fig. 18.
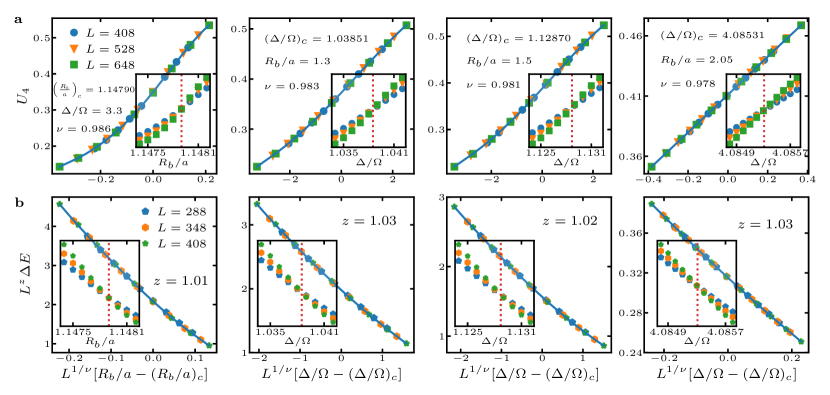
We note that the regime of order is at , where NN sites in the same leg are blockaded but the two sites in the same rung are not. The local degrees of freedom that do not favor order can introduce large finite-size effects. We perform data collapse of for large system sizes and that of for to reduce the finite- effects. The first phase transition point we studied is the intersection between the cut and the lower boundary of order. We calculate and at nine values of starting from with an increment of . The best data collapse is found at , . One can see that all the data for with different s collapse onto a smooth curve that is a function of . The inset in the first plot of Fig. 18a shows versus for different s, which cross exactly at . Fixing and , we scan values of and the best data collapse for happens at . The inset in the first plot of Fig. 18b shows versus , which also cross exactly at . The same procedures are performed on the other three phase transition points on cuts, respectively. The data points take nine values of starting from with an increment of , nine values of starting from with an increment of , and eleven values of starting from with an increment of , respectively. The phase transition points and critical exponents are found to be , , and , respectively. A smaller truncation error is used for the cut, because the phase transition is very close to other critical regime (the floating phase below order). One can see that all the values of and obtained from data collapse are consistent with and for Ising transitions. Data collapse of Binder Cumulant and the energy gap is a reliable method to extract critical points and critical exponents in Rydberg systems.
VI.2 Conformal and Chiral Phase Transitions
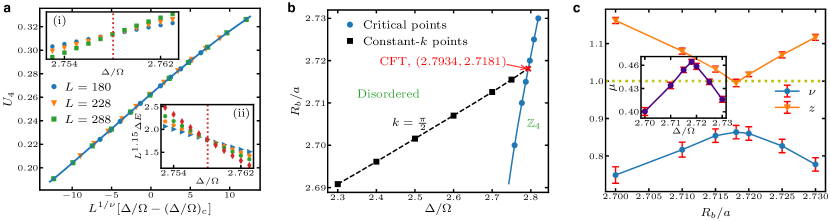
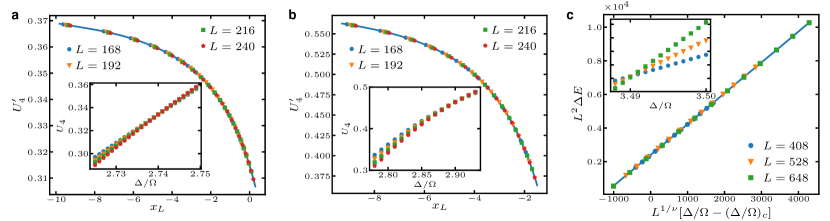
We now focus on the conformal and chiral quantum phase transitions between the order and the disordered phase. As mentioned above, on the boundary of order, there exists a segment of direct transitions between the crystalline order and the disordered phase. The segment contains a CFT point with and other points are chiral transition points with continuously changing from to . We again use data collapse of and to determine the phase transition points and critical exponents and for chiral phase transitions. One example on data collapse for the chiral transition along cut is shown in Fig. 19a. We calculate and for eleven values of taking from with an increment of . Three system sizes are used for the collapse of and four system sizes are used for the collapse of . The best data collapse is found at , , and . The inset (i) [(ii)] shows that () as a function of for different system sizes cross exactly at the critical point . We use the same method to find the critical points and critical exponents for other cuts. The critical points are plotted in Fig. 19b and cubic spline interpolation is applied to draw the boundary of order.
One can calculate more critical points to precisely locate the CFT point with . Meanwhile, the CFT point is the intersection between the boundary and the commensurate line where the chiral perturbation from domain-wall excitations is zero. From the phase diagram in Fig. 1b, it is found that the commensurate lines meet the crystalline lobes around , respectively (also shown in Fig. 7). To accurately determine the CFT points, we precisely locate the peak position of the structure factor for various values of with step on constant cuts and use spline interpolation to find the commensurate point with for . Then, we extrapolate the commensurate points to the values in the thermodynamic limit for each constant cut. The extrapolated commensurate points are plotted in Fig. 19b. Another extrapolation procedure is performed to find that the commensurate line intersects with the boundary at the CFT point . To double check that the intersection is a CFT point, we perform data collapse on cut: the critical point and exponents are found to be , where the value of is consistent with that the transition point is conformal with . The value of obtained here is consistent with the predicted regime where the chiral perturbation is relevant for the Ashkin-Teller model describing the universality classes for physical systems with four effective degrees of freedom Ashkin and Teller (1943); Kohmoto et al. (1981); Schulz (1983).
We further calculate the results for the CFT point with smaller truncation error . It is found that for the CFT point. The results are very close to those for and the value of increases a little towards the expected value . Based on this, one can estimate that the errors of the critical points, , and calculated with is of order , , and , respectively. We can also correct the values of and for other critical points calculated with based on the changes for the CFT point with smaller , as long as the critical points are not far from the CFT point. We plot values of and as functions of in Fig. 19c. It is seen that reaches maximum at the CFT point, while gets to the minimum about at the CFT point. The results clearly verify that the phase transitions between the order and the disordered phase is chiral with except at a single CFT point with . The Kibble Zurek exponent Kibble (1976); Zurek (1985); Polkovnikov (2005); Zurek et al. (2005); Dziarmaga (2005) is calculated and shown in the inset of Fig. 19c, where we see that the maximum is also at the CFT point. The critical exponents and will continuously decrease and increase respectively until and , where the chiral transition line ends at Lifshitz points and splits into one BKT line and one PT line that surround a critical floating phase Chepiga and Mila (2021b).
Unlike the 1D Rydberg chain where order cannot directly melts into the disordered phase, the two-leg Rydberg ladder considered here has a direct transition line between the order and the disordered phase. In Fig. 20, we study the data collapse on the commensurate line and the cut. Here, the truncation error in DMRG is used for good accuracy. The commensurate line is determined by the same way as that for line in Fig. 19b. Notice that is required for the ladder system with SBCs to be compatible with the order, so we use here for the data collapse. The critical points and critical exponents are found to be . The value of is consistent with the expected value for CFT. Thus, the quantum phase transition along the line is also a CFT point. On cut, the critical point is close to the CFT point on the commensurate line. It is expected that is still close to . As shown in Fig. 20b, , which is consistent with our expectation. More chiral critical points and critical exponents on and lobes are beyond the scope of this work and will be left for future work.
VI.3 BKT and PT Phase Transitions
In this section, we numerically demonstrate the existence of BKT and PT transitions. As mentioned before, the floating phase is a critical phase with the central charge . Thus, the dispersion relation is linear and the low-energy effective theory is a TLL. TLL depends on two parameters: the Luttinger liquid parameter and the velocity Haldane (1981); Voit (1995). If exceeds some critical value, TLL becomes unstable and a BKT transition to the disordered phase happens. Going towards BKT transitions from the gapped side, the correlation length diverges fast and approaches an essential singularity: Kosterlitz (1974), where is a constant and is the distance to the BKT point. If the velocity , TLL does not flow and a PT transition to crystalline orders happens, where the linear dispersion vanishes and the quadratic dispersion dominates. Approaching PT transitions from the gapped side, the correlation length diverges as and the energy gap ; that is, the critical exponents and .
The Binder Cumulant can also be used to probe BKT transitions. In this case, is a universal function of . As logarithmic corrections exist for BKT transitions, a correction factor is applied to increase accuracy , where is a constant. Therefore, collapse of Binder Cumulant for BKT transitions takes the form . We probe BKT transitions along one commensurate line and one incommensurate line . The two constant- lines are found by the extrapolation method described before. We have mentioned that there is no direct melting of the order into the disordered phase and a very narrow floating phase below the lobe exists. To verify that, we only need to show that there exists a BKT transition along the commensurate line because the chiral perturbations in incommensurate regime will further favor the existence of the floating phase Nyckees et al. (2021); Coppersmith et al. (1982). We first assume that the order can directly melt into the disordered phase and the Binder Cumulant still satisfies the form . However, an unreasonably large is found using data for . The extracted value of increases quickly by using more data with larger system sizes. These observations reveal the existence of an infinite-order BKT transition and there is no direct transition between the order and the disordered phase. We then use the BKT form for data collapse as shown in Fig. 21. The insets of Fig. 21a and Fig. 21b show that for different s nearly coalesce after the intersection, indicating a gapped-to-gapless transition. The best data collapse is found at for and for . The values of are determined as and , respectively.
We finally use collapse of the rescaled energy gap to determine the values of and for PT transitions. The ansatz is the same as the one used before. As there is no collapse of near PT transitions, we just use the collapse of to determine the critical points and critical exponents simultaneously. The results for the cut are shown in Fig. 21c, where data for with are used. The best data collapse is found at . If we fix , the best data collapse is found at and . All these results are consistent with theoretical predictions , for PT transitions. Therefore, the phase transition between the floating phase and the crystalline orders is of PT universality class.