SCoFT: Self-Contrastive Fine-Tuning for Equitable Image Generation
Abstract
Accurate representation in media is known to improve the well-being of the people who consume it. Generative image models trained on large web-crawled datasets such as LAION are known to produce images with harmful stereotypes and misrepresentations of cultures. We improve inclusive representation in generated images by (1) engaging with communities to collect a culturally representative dataset that we call the Cross-Cultural Understanding Benchmark (CCUB) and (2) proposing a novel Self-Contrastive Fine-Tuning (SCoFT) method that leverages the model’s known biases to self-improve. SCoFT is designed to prevent overfitting on small datasets, encode only high-level information from the data, and shift the generated distribution away from misrepresentations encoded in a pretrained model. Our user study conducted on 51 participants from 5 different countries based on their self-selected national cultural affiliation shows that fine-tuning on CCUB consistently generates images with higher cultural relevance and fewer stereotypes when compared to the Stable Diffusion baseline, which is further improved with our SCoFT technique. Resources can be found at https://ariannaliu.github.io/SCoFT.
![[Uncaptioned image]](/html/2401.08053/assets/x1.png)
1 Introduction
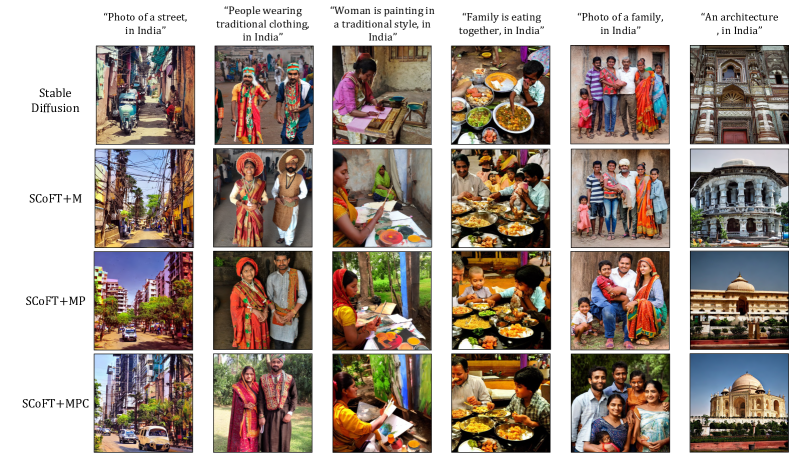
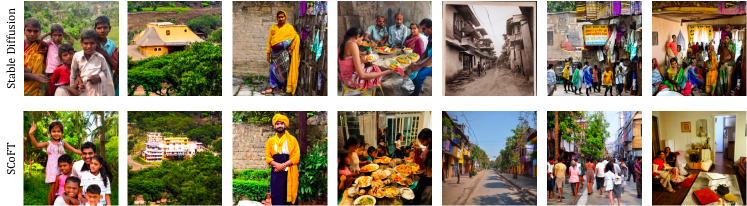
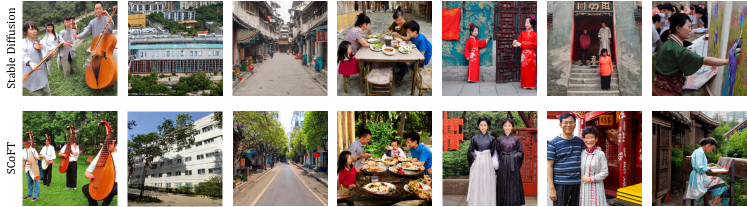
Representation matters. In media, studies repeatedly show that representation affects the well-being of its viewers [53, 8, 12]. Representation can positively affect viewers by providing them with role models that they identify with, but it can also negatively affect viewers by creating harmful, stereotypical understandings of people and culture [7]. When people are accurately represented in media, it allows people to properly understand cultures without harmful stereotypes forming [11, 37]. To date, unfortunately, many media-generating AI models show poor representation in their results [40, 31] and have been deployed for cases with negative impacts on various groups, such as nonconsensual images [33]. Many of these issues stem from their large training datasets which are gathered by crawling the Internet without filtering supervision and contain malignant stereotypes and ethnic slurs among other problematic content [4], impacting a range of applications[22]. Researchers have shown that large datasets such as LAION-400M [51] used to train many text-to-image synthesis models, including Stable Diffusion [46], center the Global North [4, 5, 31] and struggle to accurately depict cultures from the Global South as shown in Figure 1.
To ensure models better represent culture and more accurately represent the world, we introduce a new task of culturally-aware image synthesis with the aim of addressing representation in image generation: generating visual content that is perceived to be more representative of national cultural contexts. Our overarching goal is to improve the well-being of viewers of the AI-generated images with particular attention to those who are from a selection of groups marginalized by existing methods.
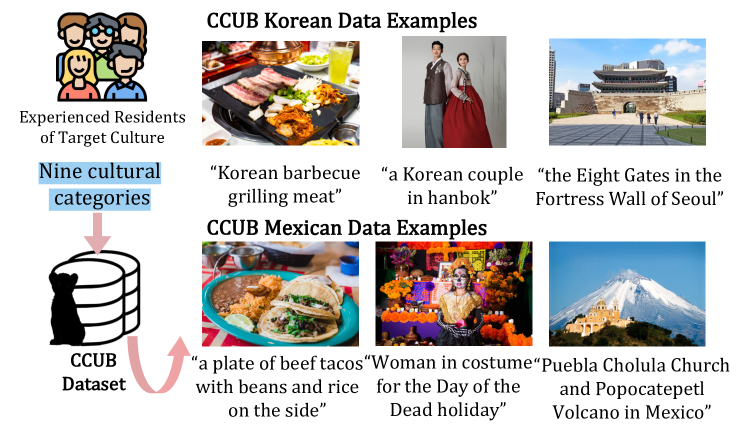
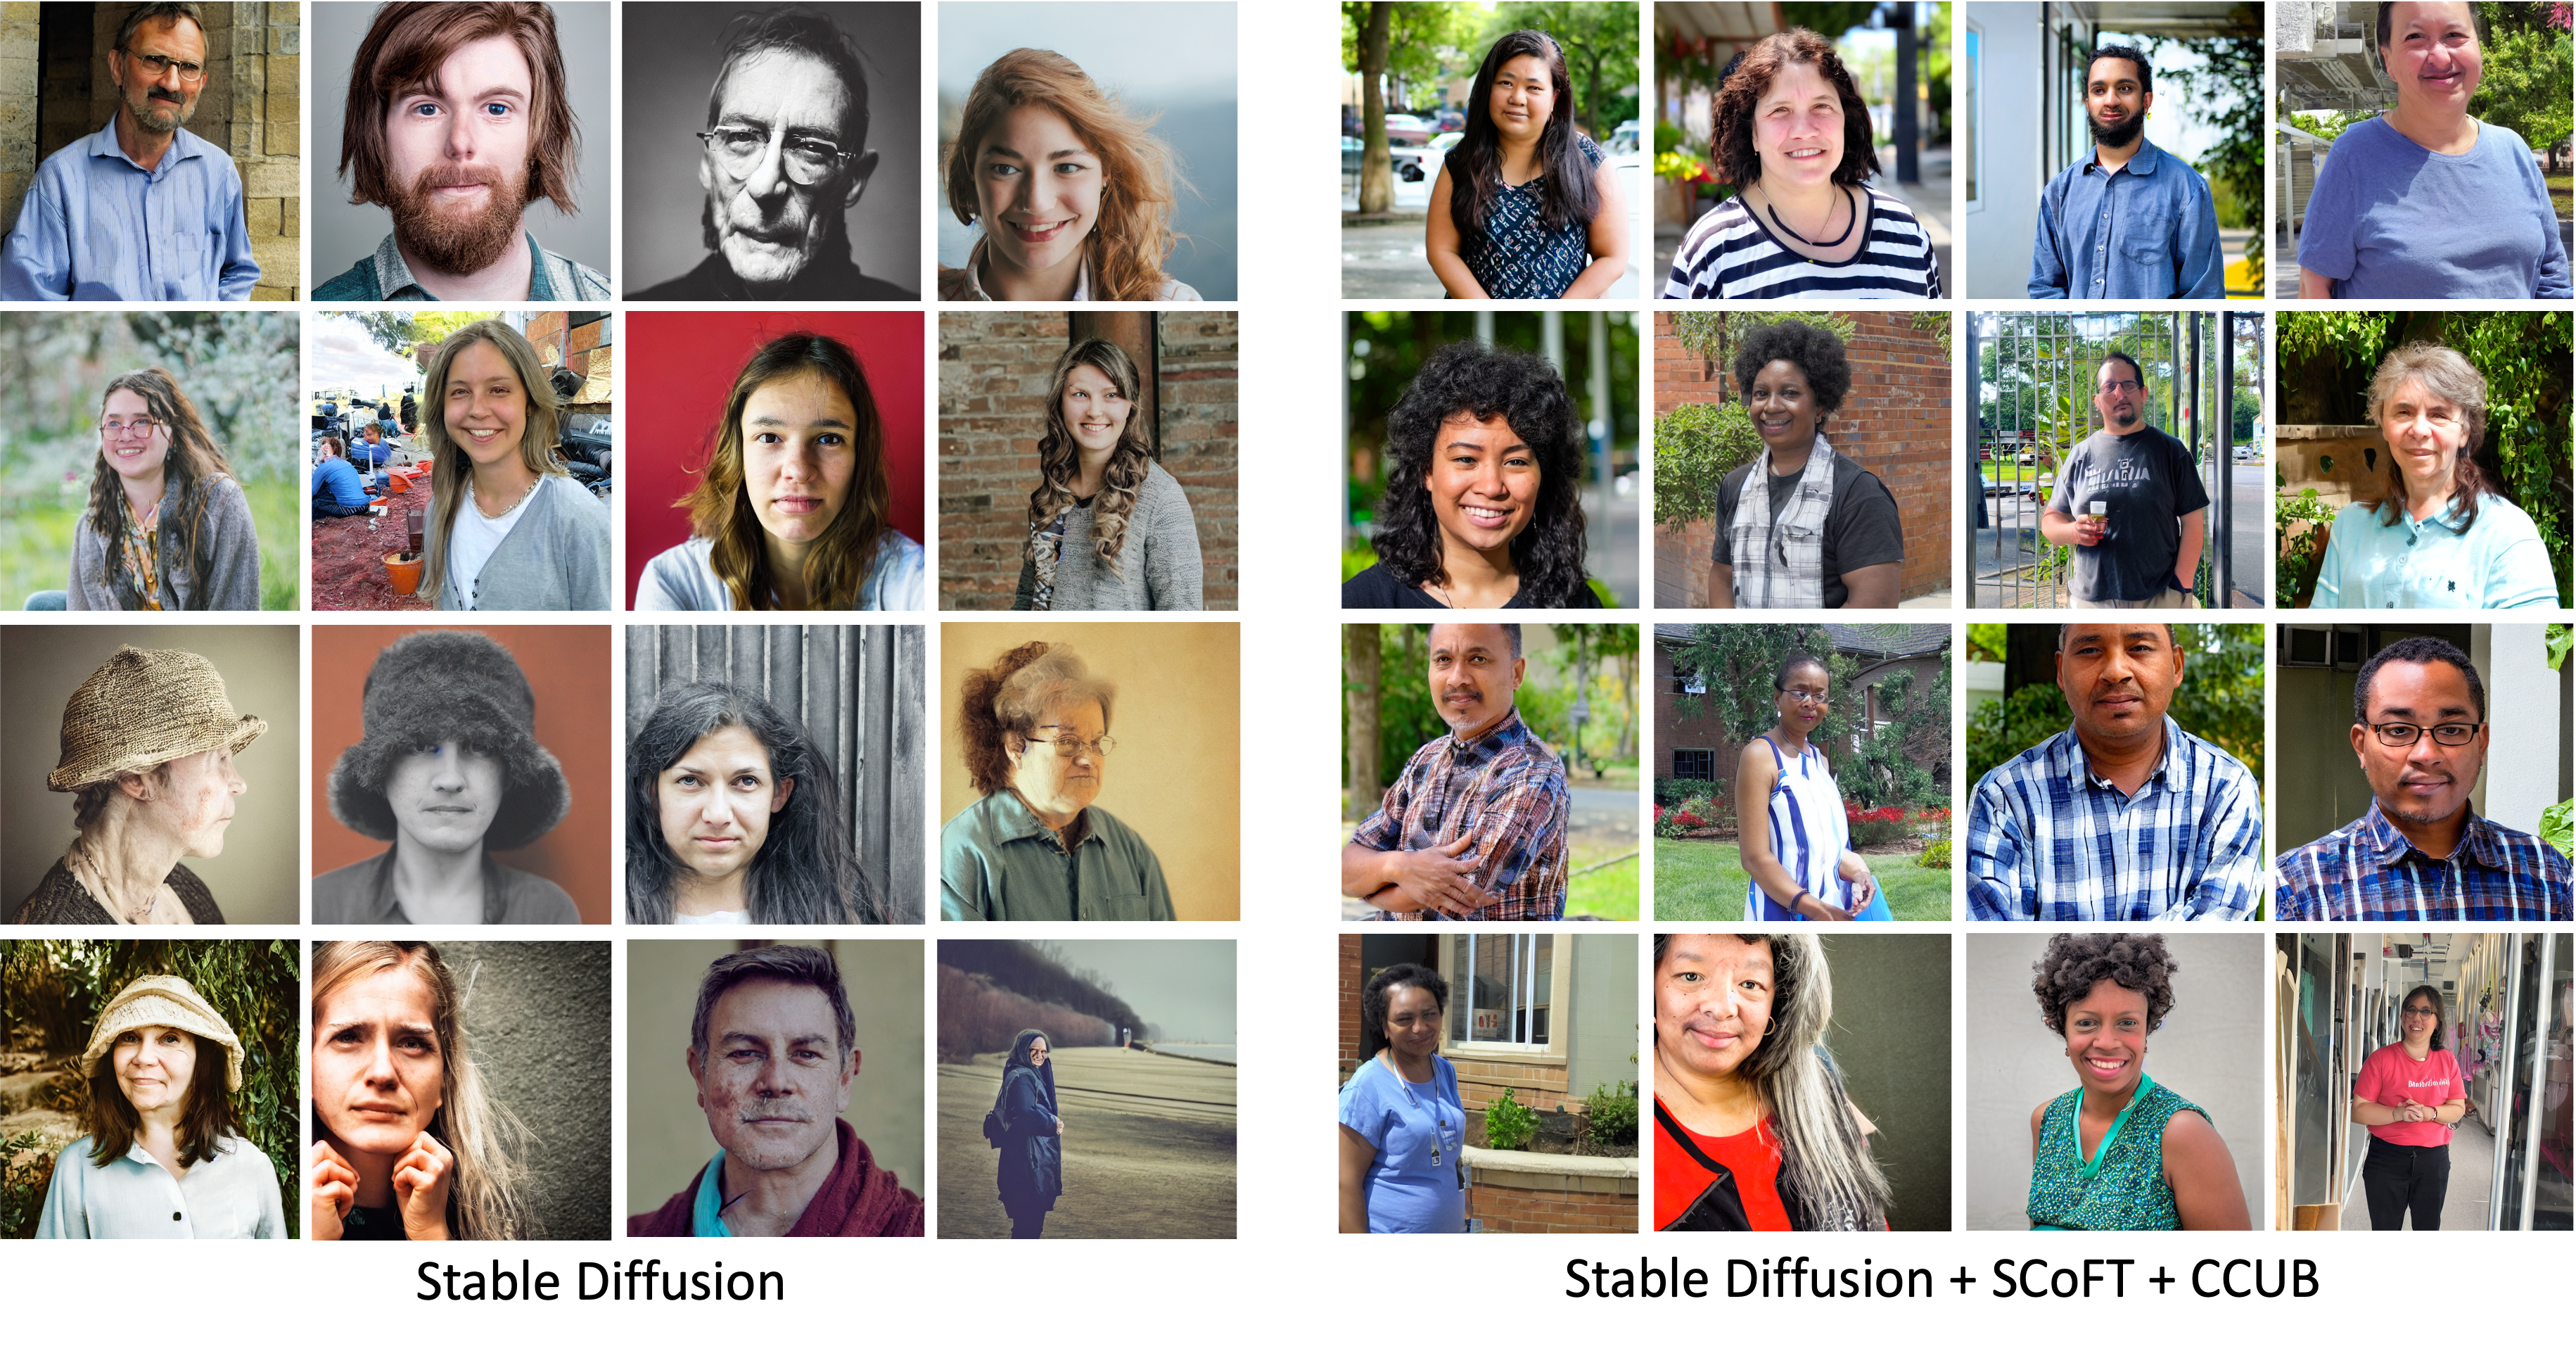
Our research question is, how can effective, existing text-to-image models be improved to become more culturally representative and thus less offensive? Since it may be infeasible to vet billions of training examples for accurate cultural content, we hypothesize that a small dataset that is veritably representative of a culture can be used to prime pre-trained text-to-image models to guide the model toward more culturally accurate content creation. To verify the hypothesis, we collected a dataset of image and caption pairs for 5 cultures. For each culture, data was collected by people who self-selectedly affiliated with that culture as they are the people who properly understand it and are most affected by its misrepresentations. We call this the Cross-Cultural Understanding Benchmark (CCUB) dataset which comprises 150 - 200 images for each culture each with a manually written caption as shown in Figure 2.
To encode the culturally representative information in CCUB into a pre-trained model, we propose to fine-tune the model with the new dataset. Existing fine-tuning techniques work well for low-level adaptations such as style changes or introducing new characters to models [21], but we show that these methods struggle to encode high-level, complex concepts such as culture. Additionally, fine-tuning on small datasets, such as CCUB, can lead to overfitting.
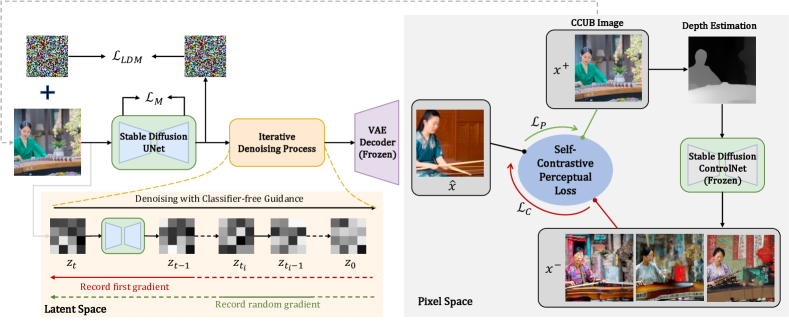
Unlike concept editing tasks [16, 15] with specific image editing directions, depicting cultural accuracy remains more abstract and challenging. We propose a novel fine-tuning approach, Self-Contrastive Fine-Tuning (SCoFT, pronounced /sôft/), to address these issues. SCoFT leverages the pre-trained model’s cultural misrepresentations against itself. We harness the intrinsic biases of large pre-trained models as a rich source of counterexamples; shifting away from these biases gives the model direction towards more accurate cultural concepts. Image samples from the pre-trained model are used as negative examples, and CCUB images are used as positive examples, to train the model to discern subtle differences. We de-noise latent codes in several iterations, project them into the pixel space, and then compute the contrastive loss. The loss is backpropagated to the diffusion model UNet and optimized to push generated samples towards the positive distribution and away from the negative. This is all done in a perceptual feature space so that the model learns more high-level, complex features from the images.
To evaluate our results we recruited participants who identify as being a member of the cultural communities in the CCUB dataset to rank images generated by Stable Diffusion with or without the proposed self-contrastive fine-tuning on CCUB. Fine-tuning on CCUB was found to decrease offensiveness and increase the cultural relevance of generated results based on 51 participants across five cultures and 766 image comparisons. Our proposed SCoFT approach further improved these results. We share the findings from our experiments to provide a basis for an important aspect of AI-generated imagery: that cultural information should be accurately presented and celebrated equitably. Our contributions are as follows:
-
1.
The introduction of culturally-aware text-to-image synthesis as a valuable task within text-to-image synthesis;
-
2.
The Cross-Cultural Understanding Benchmark (CCUB) dataset of culturally representative image-text pairs across 5 countries; and
-
3.
Self-Contrastive Fine-Tuning (SCoFT), a novel technique for encoding high-level information into a pre-trained model using small datasets.
2 Related Work
Cultural Datasets Various efforts have been made to evaluate and document the impacts of datasets[50, 23, 59]. Dollar Street [45] aimed to capture accurate demographic information based on socioeconomic features, such as everyday household items and monthly income, of 63 countries worldwide. However, this dataset offers less diverse scenarios, as most of its images are indoor views with limited cultural features. Likewise, the WIT [55] and MLM [1] strive for cultural representation but use Wikipedia/WikiData sources for images that are not representative of all aspects of culture and are over-saturated with old, streotypical images. Other works, capturing the idea of a diverse dataset, aim to reduce stereotypical bias through self-curation [10] or cultural-driven methods [35, 38, 17], inspiring our data collection methodology.
The MaRVL dataset [29], for example, was curated by people who identify as affiliated with one of several particular cultures, MaRVL was developed to mitigate biases for reasoning tasks covering popular concepts and is unsuitable for text-to-image synthesis. Our dataset was also designed to cover a diverse sample of cultures and engage with people who are native, but it is specifically curated for vision-language tasks and diverse cultural categories.
Fine-Tuning Text-to-Image Models Fine-tuning pre-trained text-to-image synthesis models with a new dataset is an approach to encode additional new simple concepts and content into the model [48, 21, 42, 54, 30]. But culture is a complex, high-level concept that poses many challenges when attempting to fine-tune a model to understand it.
Fine-Tuning on Small Datasets. Our CCUB dataset and, more generally, datasets that are collected and verified by hand rather than scraped from the internet en masse are small, leading to challenges when fine-tuning [39]. While fine-tuning techniques, such as LoRA [21], DreamBooth [48], or Specialist Diffusion [30], adapt models to learn simple concepts (e.g., a single character’s appearance) with only a hand full of training images, these techniques may overfit to the training data when fine-tuning for a high-level, complex concept such as a culture.
Fine-Tuning on Cultural Data. Prior work in adapting pre-trained models to be culturally relevant found some success using millions of culturally relevant text-image pairs, as in ERNIE-ViLG 2.0. [13] and Japanese Stable Diffusion [54]. The size of these training datasets leads to better cultural representations of Japan and China, but it is not easy to be used universally, as these approaches require millions of training examples which cannot possibly be met for cultures with less internet presence. Besides, these datasets are so large that it is infeasible to vet them for harmful and stereotypical information. We propose a fine-tuning technique that adapts pre-trained models to learn complex, elusive concepts, namely culture, from small datasets.
Fine-Tuning Stable Diffusion in the Pixel Space. Latent diffusion models are customarily trained in the latent space, however, the latent codes can be decoded into images differentiably. Multiple works compute losses on the decoded images to optimize over the input latent code [58] or the decoder weights [2]. DiffusionCLIP [25] optimizes UNet parameters using losses computed on image outputs, however, this is performed on a small, non-latent diffusion model. Latent diffusion models’ high parameter count makes it intractable to record gradients through multiple passes of the UNet and then decode into the pixel space. We develop a novel method for reducing the size of the computation graph to make backpropagating loss through Stable Diffusion tractable.
Perceptual Losses. Perceptual losses, such as LPIPS [61], have been shown to align more closely with human perception than pixel space Euclidean distance [49]. In this work, we use perceptual loss to prevent over-fitting on our small CCUB data, because perceptual losses ignore low-level differences (e.g., colors) and capture high-level details (e.g., objects), which are more important for the complex concepts such as cultures. To our knowledge, no other work has trained a latent diffusion model using perceptual loss, likely due to the technical challenges of back-propagating loss through the diffusion process and latent decoder, which we address in this paper.
Contrastive Losses. Perceptual features have also been used in contrastive losses [36], where a model is trained to generate samples that are similar in distribution to a dataset. We build on these approaches and introduce a Self-Contrastive method that uses data produced from a pre-trained model as negative examples along with a veritable dataset as positive examples to push the model towards producing from the positive distribution. Utilizing the model’s inherent counterexamples facilitates the identification of abstract and complex concepts, such as culture, which are typically challenging to articulate.
3 CCUB Dataset
Can a CCUB tame a LAION? As opposed to the LAION [52] dataset which scraped images and captions from the internet with minimal supervision leading to a prominence in harmful content, our CCUB dataset was collected by hand by the people most affected by cultural misrepresentations in text-to-image synthesis.
Following the definition of culture in [18], [29], and [24], nine categories are used to represent cultural elements in our dataset: architecture (interior and exterior), city, clothing, dance music and visual arts, food and drink, nature, people and action, religion and festival, utensils and tools. The categories are further divided into traditional and modern to reflect how cultural characteristics change over time.
For each culture, we recruited at least 5 people with at least 5 years of experience living in one of 5 countries (China, Korea, India, Mexico, and Nigeria) to each provide 20-30 images and captions. The images were collected either by collecting image links from Google searches or the collectors’ own photographs. Figure 2 shows some selected samples of our CCUB dataset.
4 Method
Given our CCUB dataset, our objective is to alter Stable Diffusion to have a more accurate understanding of a given culture. We next offer a brief background on training latent diffusion models (Sec. 4.1), a modification to a regularization loss to prevent over-fitting (Sec. 4.2), a novel approach to computing perceptual loss on decoded images (Sec. 4.3), and a method to contrastively use Stable Diffusion’s misrepresentations of culture to refine itself (Sec. 4.4).
4.1 Latent Diffusion Model Loss
Diffusion models are latent variable models that sample from a desired distribution by reversing a forward noising process. The latent noise at any timestep is given by , where is the latent variable encoded from the real image and is the strength of the gaussian noise . We are interested in the pretrained deonising network , which denoises the noisy latent to get conditioned on the text . The training objective for the denoiser is minimizing the noise prediction:
| (1) |
where is the weight to control the noise schedules. A pretrained model can be further trained, or fine-tuned, using the original objective with a new dataset. In this paper, we use the Low-Rank Adaptation (LoRA) [21] approach which reduces memory demands and over-fitting by training new low-rank weight matrices.
4.2 Memorization Loss
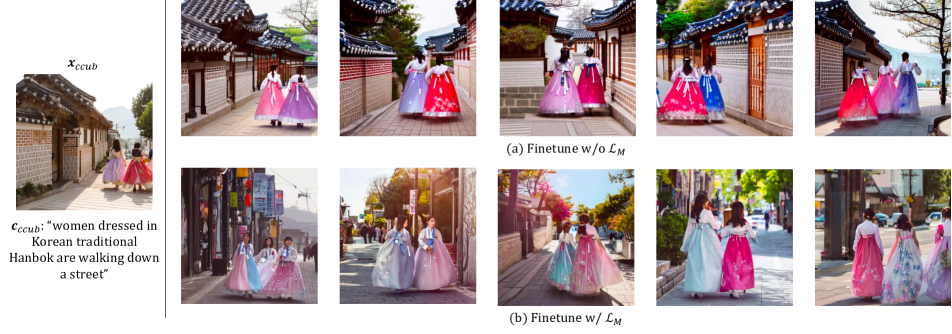
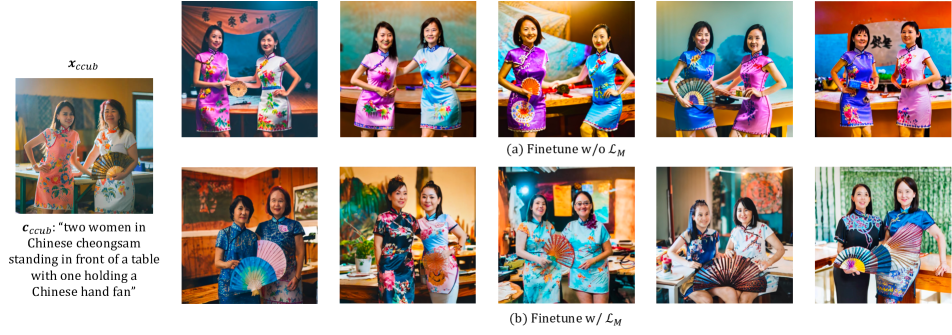
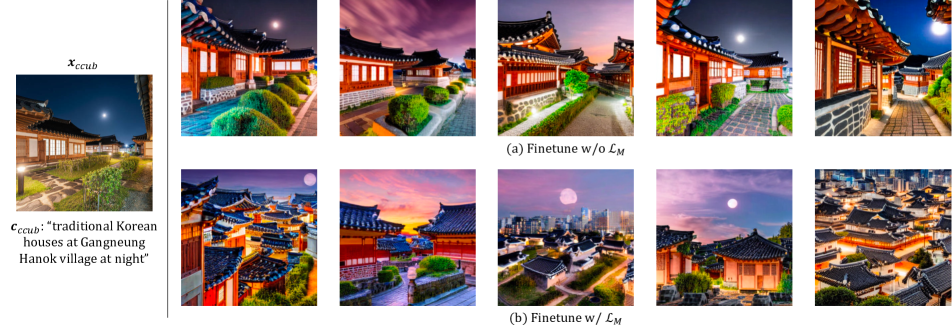
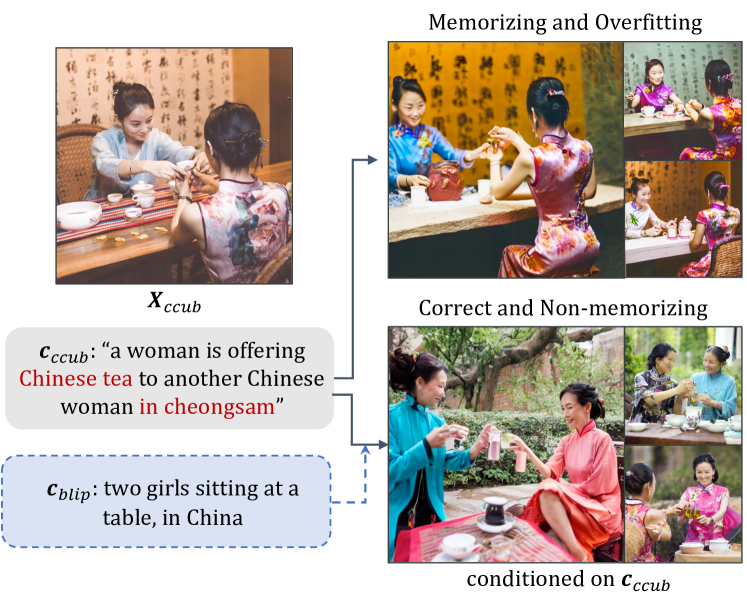
Despite CCUB’s rich cultural content, its size still remains small compared to LAION. The challenges of language drift and decreased output diversity are prevalent issues encountered during this few-shot fine-tuning [47]. Moreover, CCUB’s text captions can be highly specific, as shown in Fig. 2. Fine-tuning solely on the CCUB dataset using Equation 1 may lead to the undesirable outcome of reproducing training data as shown in Figure 6. Inspired by [26], which proposed a model-based concept ablation by letting the model memorize the mapping between newly generated anchor images and , our approach differs by focusing on preventing memorizing during fine-tuning on a small dataset (e.g., CCUB). We harness the property of BLIP automatic caption on , which is the naive version of our cultural text prompt , to regularize the model outputs conditioned on , as shown in Figure 6. To achieve this, we introduce a memorization penalty loss leveraging BLIP [27] generated captions of CCUB images. We utilize multiple BLIP captions to regularize the one-on-one mapping between CCUB images and cultural captions:
| (2) | ||||
where stands for a stop-gradient operation of the current network to reduce memory cost.
4.3 Perceptual Loss
and are loss functions that operate on the latent codes within a diffusion model. Operating directly on these latent codes is ideal for fine-tuning models for adding simple concepts such as adding a character’s appearance to the model. For adding more complex, abstract concepts, like culture, we propose to decode the latent space into the pixel space in order to utilize pre-trained perceptual similarity models. We propose to use a perceptual loss, , which is computed as the difference in extracted perceptual features between the decoded, generated image, , and an image from a training set, :
| (3) |
where is some perceptual similarity function and is a pretrained feature extractor.
Backpropagation through sampling. State-of-the-art perceptual models typically process inputs in the pixel space. In contrast, Stable Diffusion is fine-tuned in a latent space. To fulfill our objective function, an intuitive strategy entails iteratively denoising latent features and then decoding them back into the pixel space for use with perceptual models. Concurrent work [9] denoises the stable diffusion latent from Gaussian noise into the pixel space based solely on text prompts and by optimizing the Stable Diffusion UNet with a reward function computed using the decoded image. Instead, our approach starts from the latent code at timestep : , making it coupled with the Stable Diffusion fine-tuning process. We utilize classifier-free guidance, iteratively denoising the latent code according to , where is the guidance scale and is a null text embedding. This enables the model to generate images conditioned on cultural text prompts and unveils its cultural understanding, as illustrated in Figure 3. In practice, we denoise for 20 timesteps. Starting from , our method ensures that the denoised image aligns with the same pose and structure as the original training image . This facilitates a more meaningful comparison for perceptual loss and subsequent self-contrastive perceptual loss, exposing major differences in cultural concepts.
Directly backpropagating through the multiple UNet denoising iterations, the latent space decoder, and the perceptual model produce huge memory costs and computational time. To address this, we selectively record the gradient on a single denoising step and employ stopgrad on other denoising steps. Our findings indicate that recording the gradient from the first step has the most significant impact on refining the model’s cultural understanding. Further comparisons on gradient recording and perceptual model backbone are detailed in Sec. 6.
4.4 Self-Contrastive Perceptual Loss
To further improve Perceptual Loss, we raise an intriguing question: Can Stable Diffusion leverage its intrinsic biases to refine its own? We seek to leverage the model’s prior of its cultural understanding and propose a contrastive learning approach. Utilizing our CCUB dataset, we designate the positive examples to be representing preferred features. To unveil the cultural biases within Stable Diffusion, we employ images generated by the model itself as negative samples.
It is imperative to ensure that the generated negative samples share a high-level similarity with positive samples, such as pose and structure, thereby emphasizing that the primary distinctions lie in the diffusion model’s perception of cultural features. We achieve this by incorporating a pre-trained ControlNet [60] module , conditioned on the estimated depth of , into Stable Diffusion. As depicted in Figure 3, negative examples are obtained as , where is the MiDaS [6, 44] depth estimator, and represents followed by a cultural suffix (e.g., “in Korea”).
To enhance the cultural fine-tuning process, our objective is to ensure that images generated by the current model, denoted as have closer perceptual distances to positive examples and farther distances from negative examples. This reinforces the model’s alignment with preferred cultural features, distancing itself from undesirable biases in negative examples, indicated by: , where is some perceptual similarity function and is a pre-trained feature extractor. Thus, we formulate this objective, which we call Self-Contrastive Perceptual Loss, using triplet loss:
| (4) |
where denotes the weights on negative examples, is the constant margin between positive and negative examples, and is a feature extractor. We evaluate a variety of state-of-the-art perceptual embeddings and report comparison results in Section 6.
Our full fine-tuning approach, SCoFT, is a weighted sum of all previously mentioned loss functions.
5 Experiments
| Automatic Metrics | User Survey Results - Average Rank | |||||||||||||||||||||||
|---|---|---|---|---|---|---|---|---|---|---|---|---|---|---|---|---|---|---|---|---|---|---|---|---|
| Model Name |
|
|
|
|
|
|
|
|||||||||||||||||
| Stable Diffusion[46] | 30.355 | 4.396 | 0.813 | 3.09 | 3.07 | 2.98 | 3.07 | |||||||||||||||||
| SCoFT+M | ✓ | 22.643 | 4.711 | 0.802 | 2.57 | 2.56 | 2.66 | 2.59 | ||||||||||||||||
| SCoFT+MP | ✓ | ✓ | 21.360 | 4.936 | 0.800 | 2.33 | 2.35 | 2.34 | 2.30 | |||||||||||||||
| SCoFT+MPC | ✓ | ✓ | ✓ | 19.621 | 4.819 | 0.799 | 1.83 | 1.84 | 1.91 | 1.78 | ||||||||||||||
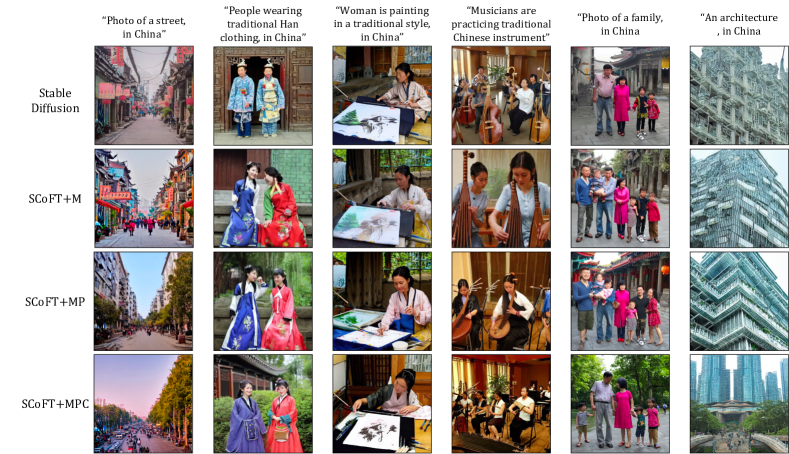
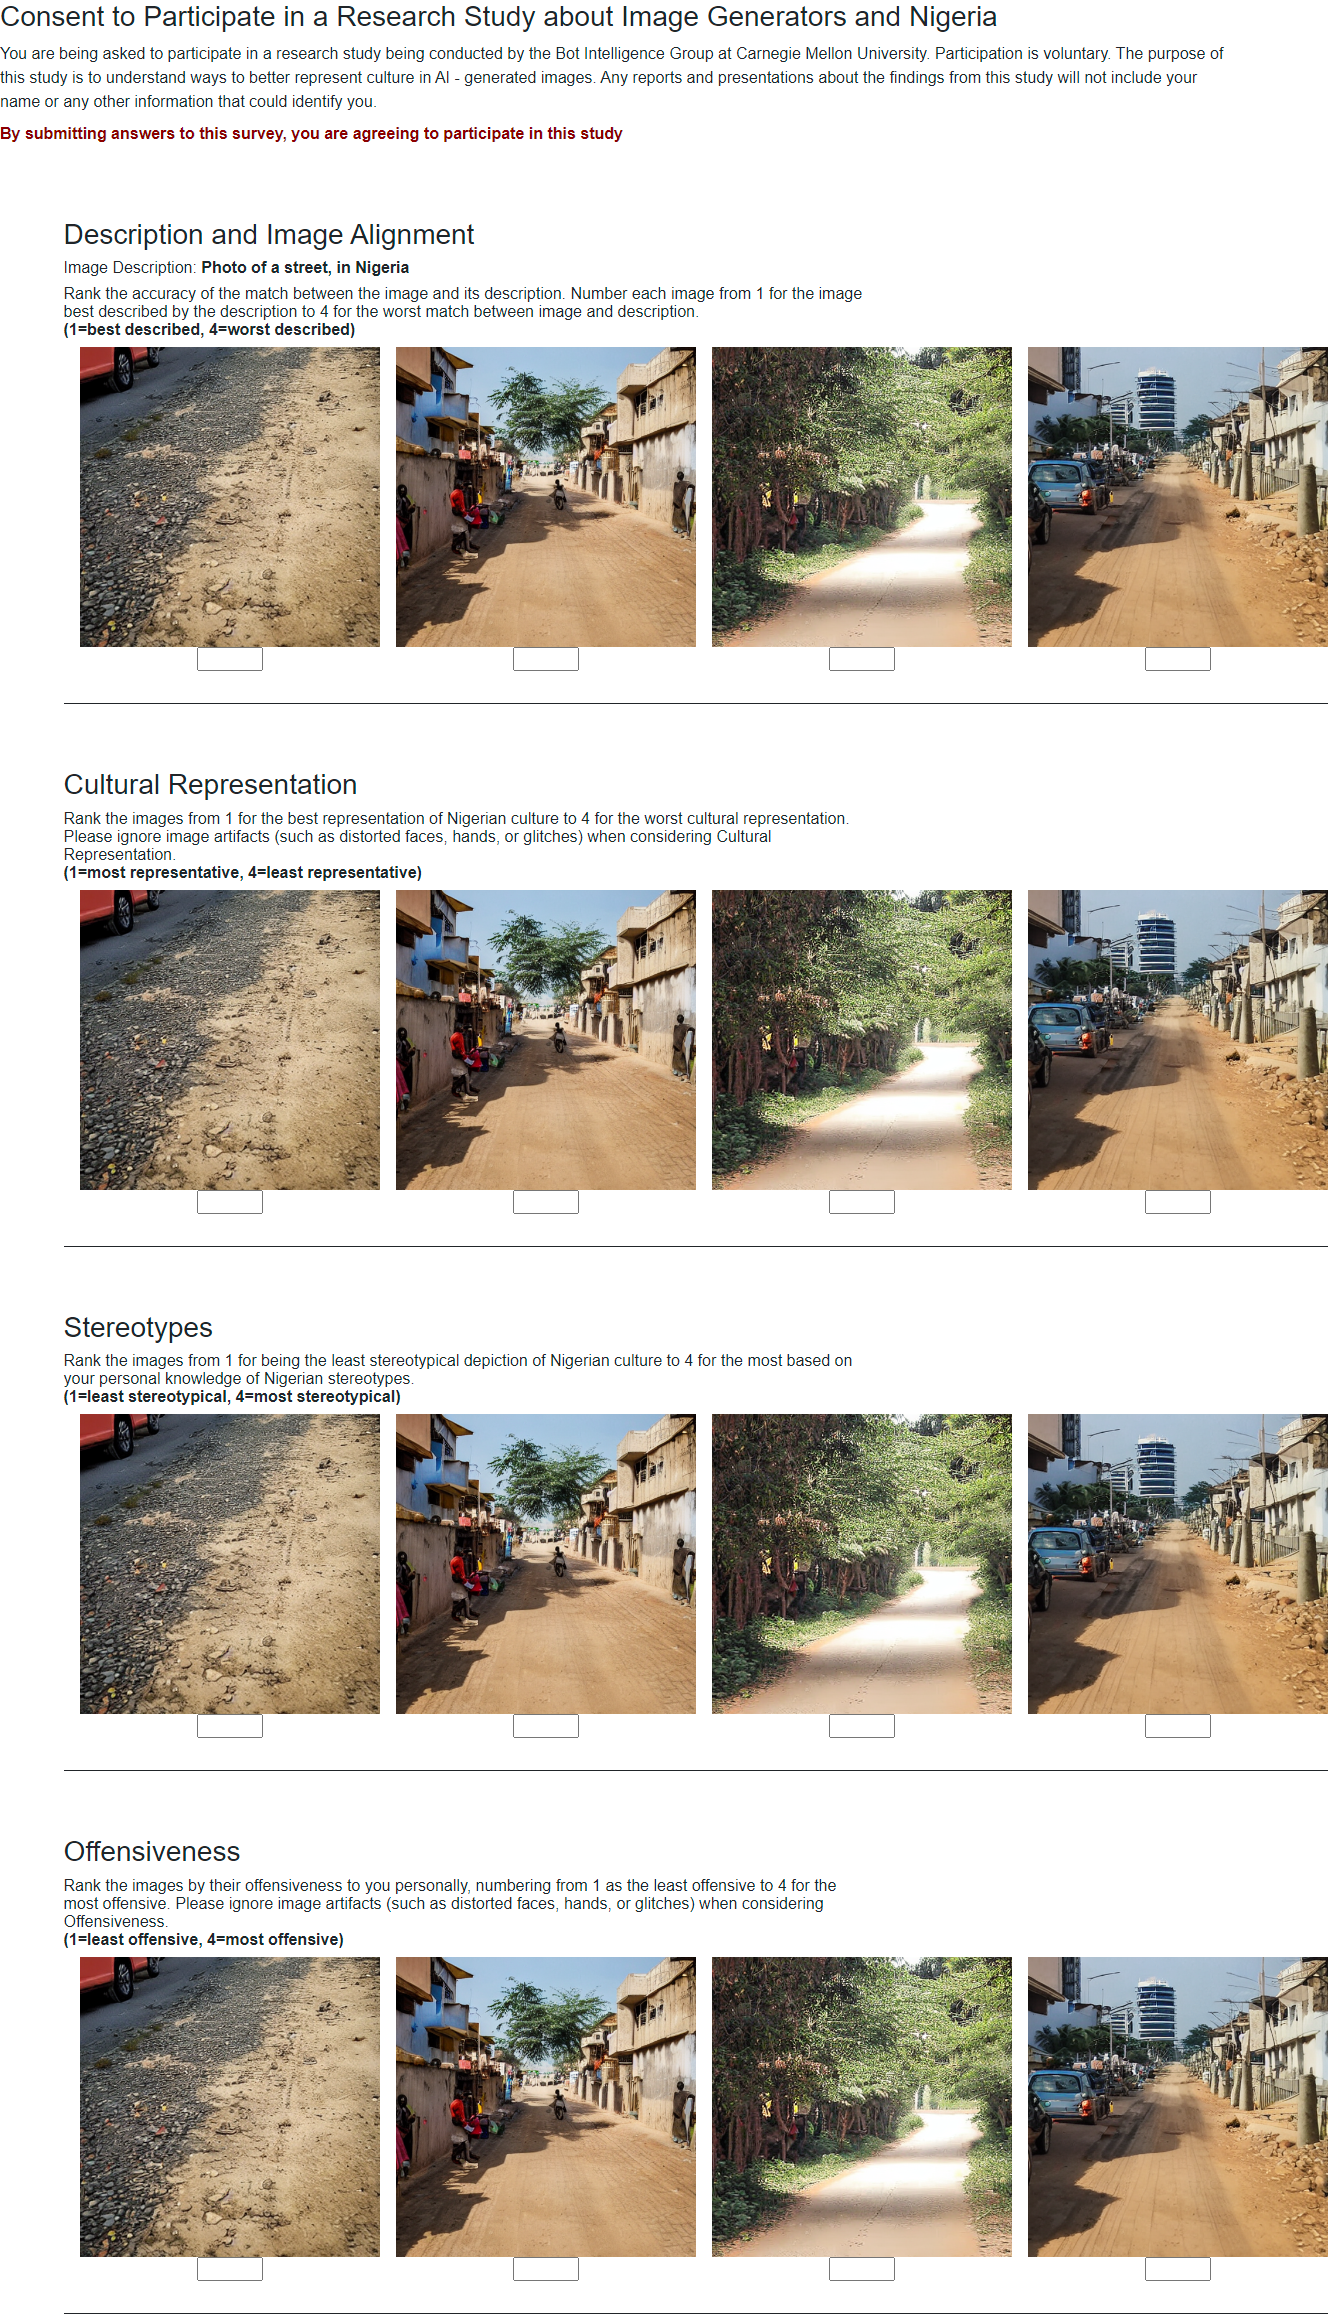
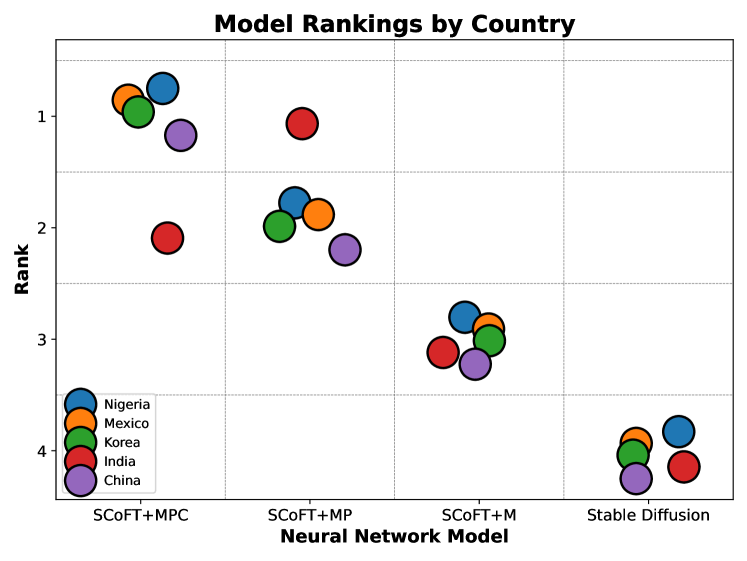
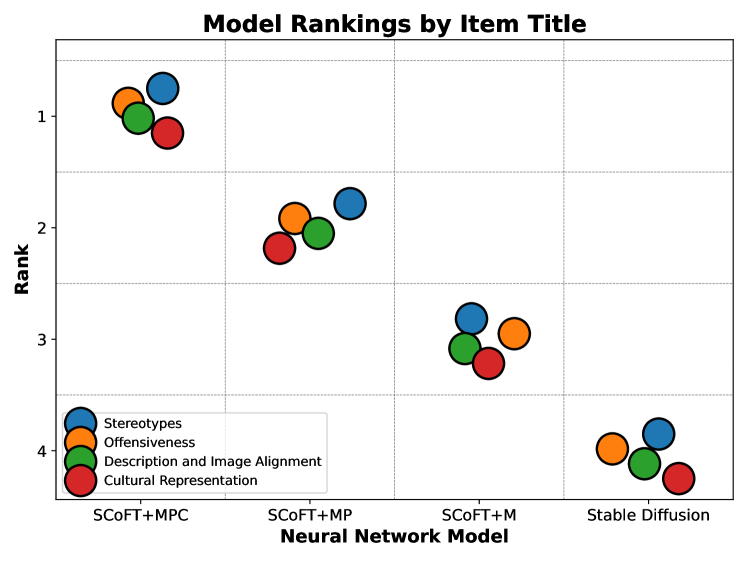
User Survey. Our goal of improving the cultural perception of generated images is a subjective metric largely determined by members of a given identity group. To evaluate our performance on this criterion, we recruited people with at least 5 years of cultural experience in each of the 5 countries with survey questions specific to their self-selected national cultural affiliation. A single page of the survey form provides one description (prompt) and one image made by four different generators using a common random seed, for four total images. We compare four image generators: Stable Diffusion against three fine-tuned ablations. All fine-tunings were performed with the CCUB dataset using along with one or more proposed loss functions, see Tab. 4. For example, SCoFT+M is Stable Diffusion fine-tuned on CCUB using the sum of and as a loss function. Each survey page has a total of four survey items (rows that participants respond to) to rank images on (a) Description and Image Alignment, (b) Cultural Representation, (c) Stereotypes, and (d) Offensiveness. Participants respond by numerically ranking the set of randomly ordered images from best image to worst image once for each item. An image labeled rank 1 would signify both best aligned and least offensive when each case is ranked, while rank 4 would be least well aligned and most offensive. Details about our survey can be found in Sec. 11.1.
We quantitatively estimate the subjective perceived performance of each method with Matrix Mean-Subsequence-Reduced (MMSR) [32] model in crowd-kit [56], an established algorithm [34] for noisy label aggregation, followed by a weighted majority vote to aggregate labels across workers, and then a simple majority vote aggregating labels into rankings, thus MMSR+Vote.
6 Results
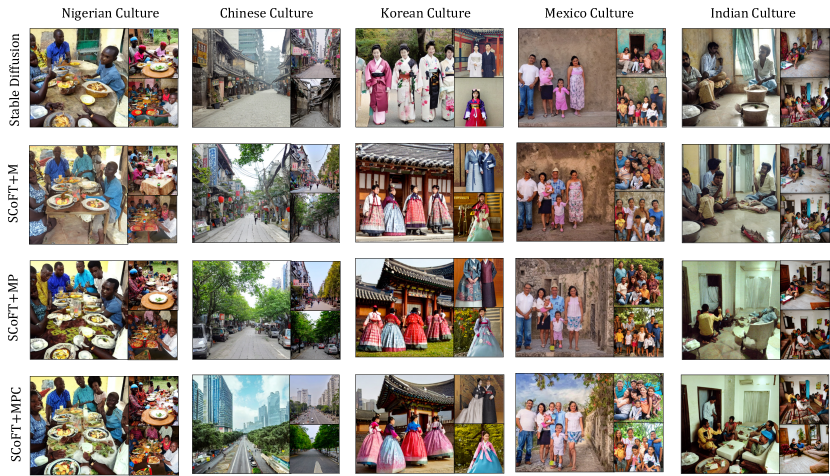
Qualitative Comparison. We qualitatively compare our SCoFT model versus the original Stable Diffusion in Figure 1. SCoFT is able to guide Stable Diffusion away from generating stereotypes and misrepresentations of culture. For example, many of the Stable Diffusion results for a “Photo of a traditional building, in …” depict disheveled structures, which promote a harmful stereotype that some cultures are poor or simple, whereas SCoFT promotes more accurate and less stereotypical buildings for each nation. To investigate the effects of each loss function within SCoFT we also qualitatively compare each ablation in Figure 4. We tend to see the SCoFT models modernize generated images, which decreases harmful stereotypes.
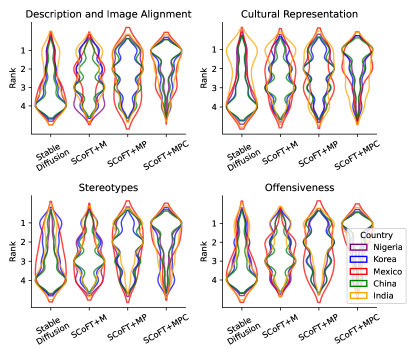
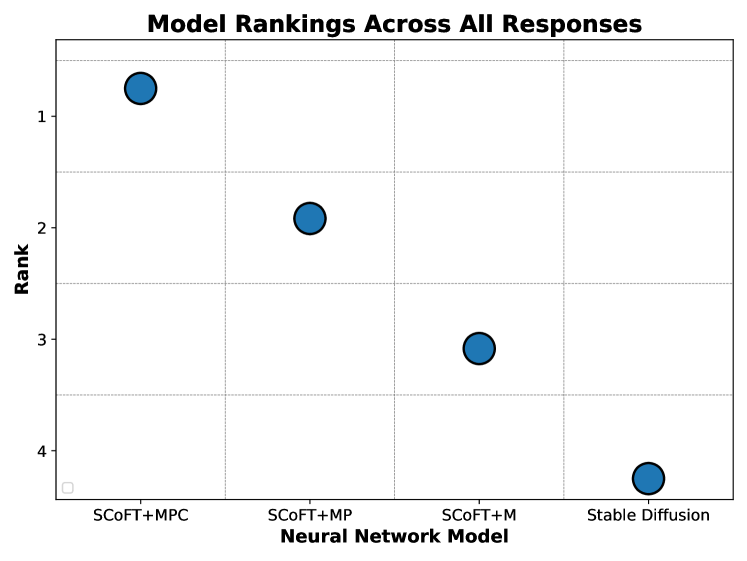
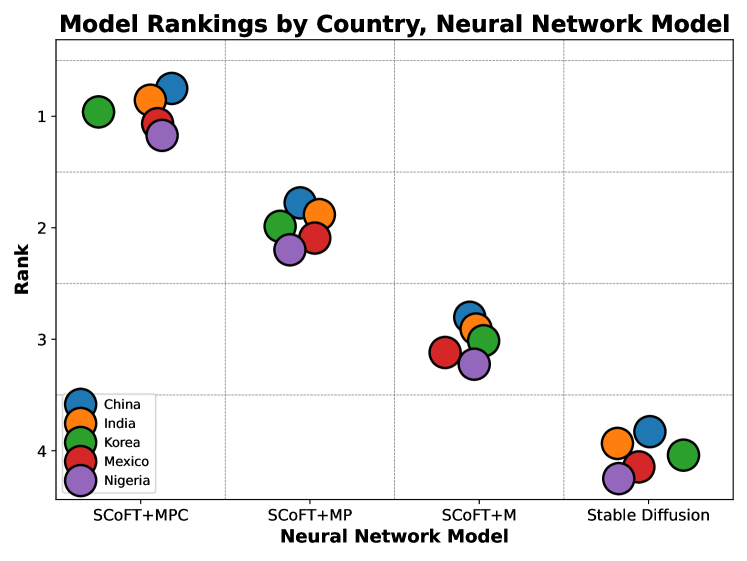
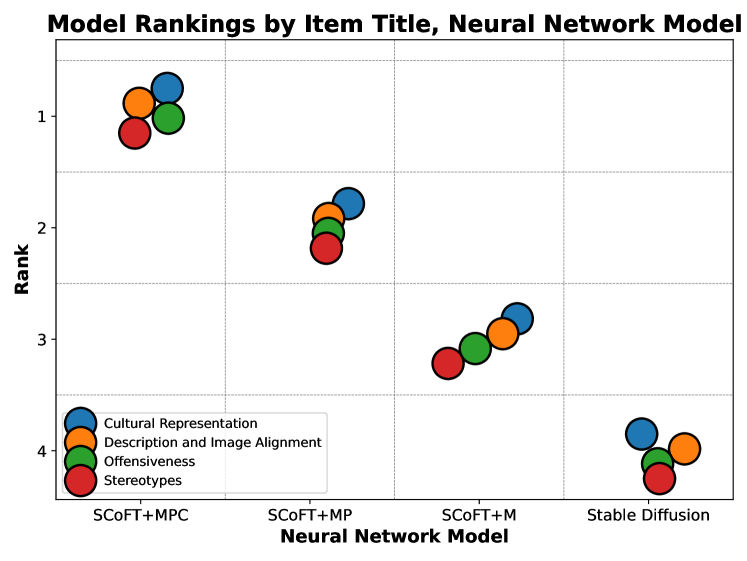
User Survey Results. 51 survey participants from five countries ranked images across four ablations by responding to each of the four survey items in Sec. 5. The average participant rankings can be found in Table 1. We also ran the MMSR [32] noisy data labeling algorithm across all responses (see Sec. Sec. 5, Supplement), finding a participant consensus ranking of: (1) SCoFT+MPC (2) SCoFT+MP, (3) SCoFT+M, and finally (4) Generic Stable Diffusion. MMSR found that particpants reached an identical consensus when separately ranking each ablation with respect each of the four survey items. MMSR also found a participant consensus in which every country individually agreed with the ranking above, with the exception of India, which swapped (1) SCoFT+MP and (2) SCoFT+MPC.
We convert the rankings into binary comparisons by isolating two ablations and comparing their rankings. This way, we can compare the effects of each of the loss functions of SCoFT. SCoFT+M was ranked less offensive than Stable Diffusion 63% of the time, SCoFT+MP was less offensive than SCoFT+M 56% of the time, and SCoFT+MPC was less offensive than SCoFT+MP 62% of the time. We see that each loss function contributed significantly to decreasing the offensiveness of generated results, and this trend continued for the other three survey items. We note that the initial addition of fine-tuning and the contrastive loss produced more dramatic improvements in SCoFT compared to adding perceptual loss.
We compare whole distributions of the rankings in Figure 5. Across survey items, we see very similar distributions. For example, Stable Diffusion images were very commonly ranked fourth for both Stereotypes and Cultural Representation. Participants in the Chinese and Korean surveys ranked images with less variance than participants in the Indian and Mexican surveys. This is potentially due to a difference in the number of participants for each survey.
Automatic Metric Results. The automated evaluation results are summarized in Table 1 where the proposed approach achieves the best result in terms of the KID score based on the CCUB test set, indicating that the fine-tuned model is able to generate images with a similar quality to the culturally curated data. By contrast, the original Stable Diffusion model achieves the highest score in terms of the CLIP Score that measures the text-image alignment as well as the KID score based on the MS COCO dataset. This result is not surprising as the CLIP model is itself known to be biased [4] in ways shared with Stable Diffusion [31], where the number of measurable outputs people perceive as hatred scales with the training set [5]. CLIP biases have also been quantitatively shown to be passed on to downstream applications [22]. Since human evaluators found our SCoFT+MPC method outperforms Stable Diffusion, we conclude that CLIP-Score is not an appropriate metric for assessing cultural competence.
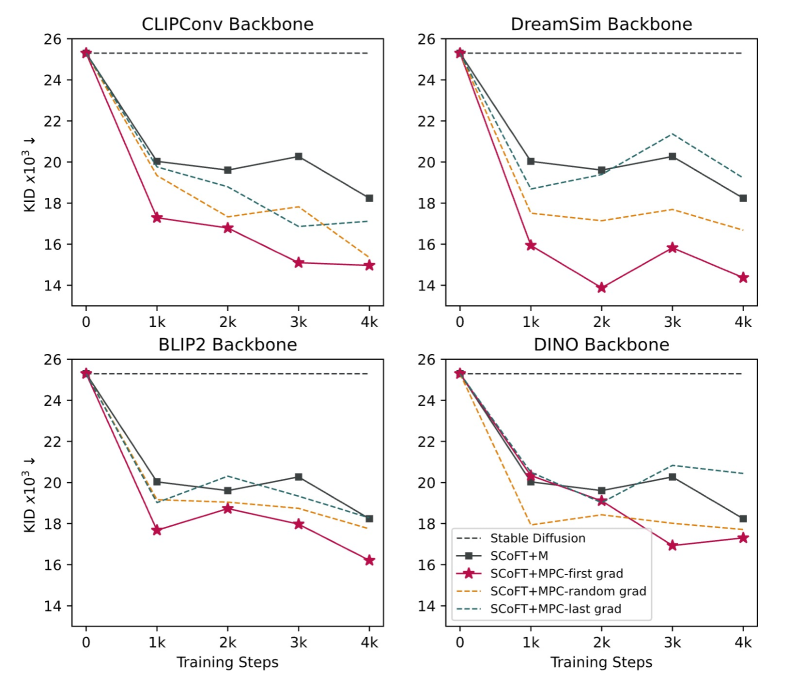
Perceptual Backbones and Gradient Recording. SCoFT uses a perceptual backbone to compare images in feature spaces rather than pixel space to avoid overfitting to training images. We test several backbones to extract image features, including the output of CLIP [43] convolutional layers [57], and the last layer of DreamSim [14], DINOv2 [41], BLIP2 [28]. For each comparison, we generate 200 images and calculate the KID with CCUB test set with the Korean, Chinese, and Indian models and see that the CLIP convolutional layers and DreamSim output provide the best generalization. For all other experiments, we use the CLIP convolutional layers as the SCoFT backbone.
We also compare the effect of recording the gradient during the first, last, and random iterations of denoising during fine-tuning, as reported in Figure 7. We see that the best generalization comes when recording the gradient during the first iteration of denoising. This is in contrast to concurrent work [9] which recorded the last gradient, indicating that culture is a high-level concept where important information is created early in the diffusion process, as opposed to aesthetics which are low-level and correspond more strongly to later stages of diffusion.
| Prompts from Training set | Prompts from Test set | |||||
|---|---|---|---|---|---|---|
| Method | CLIP-I | DINO | DreamSim | DIV train | DIV test | CLIPScore |
| Finetune | 0.912 | 0.836 | 0.591 | 0.302 | 0.317 | 0.824 |
| Finetune w/ | 0.897 | 0.808 | 0.550 | 0.356 | 0.379 | 0.814 |
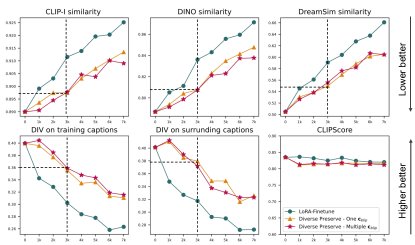
Effectiveness of the Memorization Loss. We fine-tune Stable Diffusion using the original with and without Memorization Loss, , on the CCUB dataset. To evaluate the consequence of over-fitting and reproducing training images during few-shot fine-tuning, we randomly select 10 text-image pairs for each culture from the CCUB training set. For each training text prompt, we generate 20 images. We evaluate the process using three metrics: CLIP-Image (CLIP-I), DINO, and DreamSim. All metrics measure the average pairwise cosine similarity between the embeddings of generated and real training images that share the same text prompt. For both metrics, lower values signify more effective prevention of overfitting and reproduction of training images. Figure 6 shows the qualitative results of generating more creative images. Quantitative results in Table 2 show that the memorization loss effectively reduces overfitting.
To quantify output diversity, we randomly select 10 training text prompts and 10 CCUB testing text prompts. For each text prompt, we generate 20 images. We introduce the diversity metric (DIV), which calculates the average pair-wise DreamSim cosine distance between generated images with same text prompt. Higher values indicate enhanced diversity in the generated outputs, reflecting a more varied and expressive synthesis of images. We also report a comparable CLIP Score on the generated image using CCUB testing text prompts with baseline fine-tuning.
Limitations. To tackle the bias in the data, we aim for two goals: 1) to generate accurate images given a specific cultural context and 2) to generate diverse images given a generic text prompt without any specific cultural context. Our current approach is focused on achieving the first goal. Our current model can generate promisingly diverse images for some generic prompts as shown in Figure 8 when compared to the baseline model that generates biased images.
Our CCUB dataset was collected by experienced residents; however, to improve the quality of the dataset, more vigorous verification will be needed.
7 Conclusion
The biases of generative AI have already led to substantial and very public impacts [33, 19], so it is essential that we ensure models generate images that more accurately represent the diversity of the world. We propose Self-Contrastive Fine-Tuning (SCoFT), which is specifically designed to fine-tune the model for high-level concepts using a small dataset, for instance, to pay attention to subtle cultural elements. Our proposed methods have potential applications in other domains such as reducing the risk of copyright infringement, better respecting cultural and community-defined boundaries, and addressing offensiveness across a broader range of identity characteristics and other criteria. We confirm positive associations with some automated metrics while demonstrating others are not a good fit for this task.
Our extensive user survey and metric evaluation quantitatively demonstrate improvements in subjective metrics with respect to image and description alignment, more culturally representative image contents, as well as reductions in stereotyping and offensiveness.
Acknowledgment. We are grateful to Lia Coleman, Youeun Shin for their collaboration, to Chaitanya Chawla, Pablo Ortega, Vihaan Misra, Ingrid Navarro, Yu Chen, Jinyun Xu, Jiaji Li, Mingzhu Liu for contributing the CCUB dataset collection, and to Nupur Kumari, Zeyu Qin, Heng Yu, Jinqi Luo for their helpful discussion. This work was in part supported by NSF IIS-2112633 and the Technology Innovation Program (20018295, Meta-human: a virtual cooperation platform for specialized industrial services) funded By the Ministry of Trade, Industry & Energy(MOTIE, Korea). Youngsik Yun, and Jihie Kim were supported by the MSIT (Ministry of Science, ICT), Korea, under the High-Potential Individuals Global Training Progracm (RS-2022-00155054) supervised by the IITP (Institute for Information & Communications Technology Planning & Evaluation) (50%). Andrew Hundt’s contributions are based upon work supported by the National Science Foundation under Grant # 2030859 to the Computing Research Association for the CIFellows Project with subaward # 2021CIF-CarnegieMellon-72.
References
- Armitage et al. [2020] Jason Armitage, Endri Kacupaj, Golsa Tahmasebzadeh, Swati, Maria Maleshkova, Ralph Ewerth, and Jens Lehmann. Mlm: a benchmark dataset for multitask learning with multiple languages and modalities. In Proceedings of the 29th ACM International Conference on Information & Knowledge Management, pages 2967–2974, 2020.
- Avrahami et al. [2023] Omri Avrahami, Ohad Fried, and Dani Lischinski. Blended latent diffusion. ACM Transactions on Graphics (TOG), 42(4):1–11, 2023.
- Bińkowski et al. [2018] Mikołaj Bińkowski, Danica J Sutherland, Michael Arbel, and Arthur Gretton. Demystifying mmd gans. arXiv preprint arXiv:1801.01401, 2018.
- Birhane et al. [2021] Abeba Birhane, Vinay Uday Prabhu, and Emmanuel Kahembwe. Multimodal datasets: misogyny, pornography, and malignant stereotypes. arXiv preprint arXiv:2110.01963, 2021.
- Birhane et al. [2023] Abeba Birhane, Vinay Prabhu, Sang Han, and Vishnu Naresh Boddeti. On hate scaling laws for data-swamps, 2023.
- Birkl et al. [2023] Reiner Birkl, Diana Wofk, and Matthias Müller. Midas v3.1 – a model zoo for robust monocular relative depth estimation. arXiv preprint arXiv:2307.14460, 2023.
- Castañeda [2018] Mari Castañeda. The power of (mis) representation: Why racial and ethnic stereotypes in the media matter. Challenging inequalities: Readings in race, ethnicity, and immigration, 2018.
- Caswell et al. [2017] Michelle Caswell, Alda Allina Migoni, Noah Geraci, and Marika Cifor. ‘to be able to imagine otherwise’: community archives and the importance of representation. Archives and Records, 38(1):5–26, 2017.
- Clark et al. [2023] Kevin Clark, Paul Vicol, Kevin Swersky, and David J Fleet. Directly fine-tuning diffusion models on differentiable rewards. arXiv preprint arXiv:2309.17400, 2023.
- Desai et al. [2021] Karan Desai, Gaurav Kaul, Zubin Aysola, and Justin Johnson. Redcaps: Web-curated image-text data created by the people, for the people. arXiv preprint arXiv:2111.11431, 2021.
- Dixon and Linz [2000] Travis L Dixon and Daniel Linz. Overrepresentation and underrepresentation of african americans and latinos as lawbreakers on television news. Journal of communication, 50(2):131–154, 2000.
- Elbaba [2019] Rawan Elbaba. Why on-screen representation matters, according to these teens. PBS NewsHour, 14, 2019.
- Feng et al. [2022] Zhida Feng, Zhenyu Zhang, Xintong Yu, Yewei Fang, Lanxin Li, Xuyi Chen, Yuxiang Lu, Jiaxiang Liu, Weichong Yin, Shikun Feng, et al. Ernie-vilg 2.0: Improving text-to-image diffusion model with knowledge-enhanced mixture-of-denoising-experts. arXiv preprint arXiv:2210.15257, 2022.
- Fu et al. [2023] Stephanie Fu, Netanel Tamir, Shobhita Sundaram, Lucy Chai, Richard Zhang, Tali Dekel, and Phillip Isola. Dreamsim: Learning new dimensions of human visual similarity using synthetic data. arXiv preprint arXiv:2306.09344, 2023.
- Gandikota et al. [2023] Rohit Gandikota, Joanna Materzynska, Tingrui Zhou, Antonio Torralba, and David Bau. Concept sliders: Lora adaptors for precise control in diffusion models. arXiv preprint arXiv:2311.12092, 2023.
- Gandikota et al. [2024] Rohit Gandikota, Hadas Orgad, Yonatan Belinkov, Joanna Materzyńska, and David Bau. Unified concept editing in diffusion models. In Proceedings of the IEEE/CVF Winter Conference on Applications of Computer Vision (WACV), pages 5111–5120, 2024.
- Garcia et al. [2023] Noa Garcia, Yusuke Hirota, Yankun Wu, and Yuta Nakashima. Uncurated image-text datasets: Shedding light on demographic bias. In Proceedings of the IEEE/CVF Conference on Computer Vision and Pattern Recognition, pages 6957–6966, 2023.
- Halpern [1955] Ben Halpern. The dynamic elements of culture. Ethics, 65(4):235–249, 1955.
- Heikkilä [2022] Melissa Heikkilä. The viral ai avatar app lensa undressed me without my consent, 2022. Accessed on December 16, 2023.
- Hessel et al. [2021] Jack Hessel, Ari Holtzman, Maxwell Forbes, Ronan Le Bras, and Yejin Choi. CLIPScore: a reference-free evaluation metric for image captioning. In EMNLP, 2021.
- Hu et al. [2021] Edward J Hu, Yelong Shen, Phillip Wallis, Zeyuan Allen-Zhu, Yuanzhi Li, Shean Wang, Lu Wang, and Weizhu Chen. Lora: Low-rank adaptation of large language models. arXiv preprint arXiv:2106.09685, 2021.
- Hundt et al. [2022] Andrew Hundt, William Agnew, Vicky Zeng, Severin Kacianka, and Matthew Gombolay. Robots enact malignant stereotypes. FAccT, page 743–756, 2022.
- Hutchinson et al. [2021] Ben Hutchinson, Andrew Smart, Alex Hanna, Emily Denton, Christina Greer, Oddur Kjartansson, Parker Barnes, and Margaret Mitchell. Towards accountability for machine learning datasets: Practices from software engineering and infrastructure. In Proceedings of the 2021 ACM Conference on Fairness, Accountability, and Transparency, page 560–575, New York, NY, USA, 2021. Association for Computing Machinery.
- Key and Comrie [2021] Mary Ritchie Key and Bernard Comrie, editors. IDS. Max Planck Institute for Evolutionary Anthropology, Leipzig, 2021.
- Kim et al. [2022] Gwanghyun Kim, Taesung Kwon, and Jong Chul Ye. Diffusionclip: Text-guided diffusion models for robust image manipulation. In Proceedings of the IEEE/CVF Conference on Computer Vision and Pattern Recognition, pages 2426–2435, 2022.
- Kumari et al. [2023] Nupur Kumari, Bingliang Zhang, Sheng-Yu Wang, Eli Shechtman, Richard Zhang, and Jun-Yan Zhu. Ablating concepts in text-to-image diffusion models. In ICCV, 2023.
- Li et al. [2022] Junnan Li, Dongxu Li, Caiming Xiong, and Steven Hoi. Blip: Bootstrapping language-image pre-training for unified vision-language understanding and generation. arXiv preprint arXiv:2201.12086, 2022.
- Li et al. [2023] Junnan Li, Dongxu Li, Silvio Savarese, and Steven Hoi. Blip-2: Bootstrapping language-image pre-training with frozen image encoders and large language models. arXiv preprint arXiv:2301.12597, 2023.
- Liu et al. [2021] Fangyu Liu, Emanuele Bugliarello, E. Ponti, Siva Reddy, Nigel Collier, and Desmond Elliott. Visually grounded reasoning across languages and cultures. ArXiv, abs/2109.13238, 2021.
- Lu et al. [2023] Haoming Lu, Hazarapet Tunanyan, Kai Wang, Shant Navasardyan, Zhangyang Wang, and Humphrey Shi. Specialist diffusion: Plug-and-play sample-efficient fine-tuning of text-to-image diffusion models to learn any unseen style. In Proceedings of the IEEE/CVF Conference on Computer Vision and Pattern Recognition, pages 14267–14276, 2023.
- Luccioni et al. [2023] Sasha Luccioni, Christopher Akiki, Margaret Mitchell, and Yacine Jernite. Stable bias: Evaluating societal representations in diffusion models. In Thirty-seventh Conference on Neural Information Processing Systems Datasets and Benchmarks Track, 2023.
- Ma and Olshevsky [2020] Qianqian Ma and Alex Olshevsky. Adversarial crowdsourcing through robust rank-one matrix completion. In Advances in Neural Information Processing Systems, pages 21841–21852. Curran Associates, Inc., 2020.
- [33] Emanuel Maiberg. Inside the ai porn marketplace where everything and everyone is for sale.
- Majdi and Rodriguez [2023] Mohammad S. Majdi and Jeffrey J. Rodriguez. Crowd-certain: Label aggregation in crowdsourced and ensemble learning classification, 2023.
- Mandal et al. [2021] Abhishek Mandal, Susan Leavy, and Suzanne Little. Dataset diversity: measuring and mitigating geographical bias in image search and retrieval. In Proceedings of the 1st International Workshop on Trustworthy AI for Multimedia Computing, pages 19–25, 2021.
- Manocha et al. [2021] Pranay Manocha, Zeyu Jin, Richard Zhang, and Adam Finkelstein. Cdpam: Contrastive learning for perceptual audio similarity. In ICASSP 2021-2021 IEEE International Conference on Acoustics, Speech and Signal Processing (ICASSP), pages 196–200. IEEE, 2021.
- Mastro and Greenberg [2000] Dana E Mastro and Bradley S Greenberg. The portrayal of racial minorities on prime time television. Journal of Broadcasting & Electronic Media, 44(4):690–703, 2000.
- Miquel-Ribé and Laniado [2019] Marc Miquel-Ribé and David Laniado. Wikipedia cultural diversity dataset: A complete cartography for 300 language editions. In Proceedings of the International AAAI Conference on Web and Social Media, pages 620–629, 2019.
- Moon et al. [2022] Taehong Moon, Moonseok Choi, Gayoung Lee, Jung-Woo Ha, and Juho Lee. Fine-tuning diffusion models with limited data. In NeurIPS 2022 Workshop on Score-Based Methods, 2022.
- Ntoutsi et al. [2020] Eirini Ntoutsi, Pavlos Fafalios, Ujwal Gadiraju, Vasileios Iosifidis, Wolfgang Nejdl, Maria-Esther Vidal, Salvatore Ruggieri, Franco Turini, Symeon Papadopoulos, Emmanouil Krasanakis, et al. Bias in data-driven artificial intelligence systems—an introductory survey. Wiley Interdisciplinary Reviews: Data Mining and Knowledge Discovery, 10(3):e1356, 2020.
- Oquab et al. [2023] Maxime Oquab, Timothée Darcet, Theo Moutakanni, Huy V. Vo, Marc Szafraniec, Vasil Khalidov, Pierre Fernandez, Daniel Haziza, Francisco Massa, Alaaeldin El-Nouby, Russell Howes, Po-Yao Huang, Hu Xu, Vasu Sharma, Shang-Wen Li, Wojciech Galuba, Mike Rabbat, Mido Assran, Nicolas Ballas, Gabriel Synnaeve, Ishan Misra, Herve Jegou, Julien Mairal, Patrick Labatut, Armand Joulin, and Piotr Bojanowski. Dinov2: Learning robust visual features without supervision, 2023.
- Pinkney [2022] Justin Pinkney. Text to pokemon generator, 2022.
- Radford et al. [2021] Alec Radford, Jong Wook Kim, Chris Hallacy, Aditya Ramesh, Gabriel Goh, Sandhini Agarwal, Girish Sastry, Amanda Askell, Pamela Mishkin, Jack Clark, et al. Learning transferable visual models from natural language supervision. In International conference on machine learning, pages 8748–8763. PMLR, 2021.
- Ranftl et al. [2022] René Ranftl, Katrin Lasinger, David Hafner, Konrad Schindler, and Vladlen Koltun. Towards robust monocular depth estimation: Mixing datasets for zero-shot cross-dataset transfer. IEEE Transactions on Pattern Analysis and Machine Intelligence, 44(3), 2022.
- Rojas et al. [2022] William Gaviria Rojas, Sudnya Diamos, Keertan Ranjan Kini, David Kanter, and Vijay Janapa Reddi. The dollar street dataset: Images representing the geographic and socioeconomic diversity of the world. 2022.
- Rombach et al. [2021] Robin Rombach, Andreas Blattmann, Dominik Lorenz, Patrick Esser, and Björn Ommer. High-resolution image synthesis with latent diffusion models, 2021.
- Ruiz et al. [2022] Nataniel Ruiz, Yuanzhen Li, Varun Jampani, Yael Pritch, Michael Rubinstein, and Kfir Aberman. Dreambooth: Fine tuning text-to-image diffusion models for subject-driven generation. arXiv preprint arXiv:2208.12242, 2022.
- Ruiz et al. [2023] Nataniel Ruiz, Yuanzhen Li, Varun Jampani, Yael Pritch, Michael Rubinstein, and Kfir Aberman. Dreambooth: Fine tuning text-to-image diffusion models for subject-driven generation. In Proceedings of the IEEE/CVF Conference on Computer Vision and Pattern Recognition, pages 22500–22510, 2023.
- Schaldenbrand et al. [2023] Peter Schaldenbrand, James McCann, and Jean Oh. Frida: A collaborative robot painter with a differentiable, real2sim2real planning environment. In 2023 IEEE International Conference on Robotics and Automation (ICRA), pages 11712–11718. IEEE, 2023.
- Scheuerman et al. [2021] Morgan Klaus Scheuerman, Alex Hanna, and Emily Denton. Do datasets have politics? disciplinary values in computer vision dataset development. Proc. ACM Hum.-Comput. Interact., 5(CSCW2), 2021.
- Schuhmann et al. [2021] Christoph Schuhmann, Richard Vencu, Romain Beaumont, Robert Kaczmarczyk, Clayton Mullis, Aarush Katta, Theo Coombes, Jenia Jitsev, and Aran Komatsuzaki. Laion-400m: Open dataset of clip-filtered 400 million image-text pairs. arXiv preprint arXiv:2111.02114, 2021.
- Schuhmann et al. [2022] Christoph Schuhmann, Romain Beaumont, Richard Vencu, Cade Gordon, Ross Wightman, Mehdi Cherti, Theo Coombes, Aarush Katta, Clayton Mullis, Mitchell Wortsman, et al. Laion-5b: An open large-scale dataset for training next generation image-text models. arXiv preprint arXiv:2210.08402, 2022.
- Shaw [2010] Adrienne Shaw. Identity, identification, and media representation in video game play: An audience reception study. PhD thesis, University of Pennsylvania, 2010.
- Shing and Sawada [2022] Makoto Shing and Kei Sawada. Japanese stable diffusion. 2022.
- Srinivasan et al. [2021] Krishna Srinivasan, Karthik Raman, Jiecao Chen, Michael Bendersky, and Marc Najork. Wit: Wikipedia-based image text dataset for multimodal multilingual machine learning. In Proceedings of the 44th International ACM SIGIR Conference on Research and Development in Information Retrieval, pages 2443–2449, 2021.
- Ustalov et al. [2023] Dmitry Ustalov, Nikita Pavlichenko, and Boris Tseitlin. Learning from crowds with crowd-kit, 2023.
- Vinker et al. [2022] Yael Vinker, Ehsan Pajouheshgar, Jessica Y Bo, Roman Christian Bachmann, Amit Haim Bermano, Daniel Cohen-Or, Amir Zamir, and Ariel Shamir. Clipasso: Semantically-aware object sketching. ACM Transactions on Graphics (TOG), 41(4):1–11, 2022.
- Wallace et al. [2023] Bram Wallace, Akash Gokul, Stefano Ermon, and Nikhil Naik. End-to-end diffusion latent optimization improves classifier guidance. arXiv preprint arXiv:2303.13703, 2023.
- Wang et al. [2022] Angelina Wang, Solon Barocas, Kristen Laird, and Hanna Wallach. Measuring representational harms in image captioning. In Proceedings of the 2022 ACM Conference on Fairness, Accountability, and Transparency, page 324–335, New York, NY, USA, 2022. Association for Computing Machinery.
- Zhang and Agrawala [2023] Lvmin Zhang and Maneesh Agrawala. Adding conditional control to text-to-image diffusion models. arXiv preprint arXiv:2302.05543, 2023.
- Zhang et al. [2018] Richard Zhang, Phillip Isola, Alexei A Efros, Eli Shechtman, and Oliver Wang. The unreasonable effectiveness of deep features as a perceptual metric. In Proceedings of the IEEE conference on computer vision and pattern recognition, pages 586–595, 2018.
Supplementary Material
Overview. In Sec. 8, we present the pseudocode for SCoFT and report the training details for the experiments. Sec. 9 provides statistics about the CCUB dataset. Sec. 9 showcases the results of automatic metrics per culture, followed by the human evaluation survey question and additional analysis on human evaluation feedback in Sec. 11. Finally, Sec. 12 includes more examples for our models, and Sec. 13 discusses the ethics and limitations.
8 SCoFT Method
8.1 SCoFT Pseudocode
We show here the pseudocode of our SCoFT method.
8.2 Training Details
We detail the training specifics and hyperparameters and maintain uniform settings for each model for a fair comparison. Throughout training, we employ the Adam optimizer with and for 3000 iterations, utilizing a learning rate of . The batch size is set to 1, and LoRA is exclusively applied to UNet parameters with a rank of 64. We select CLIPConv using the fifth convolutional layer as the backbone and record the first gradient during backpropagation through sampling. For each positive example, we generate 5 negative examples, employing DreamSim to filter out false negatives which are similar to positive sample. As the training weights for different losses,, we set and . To manage time costs, we compute every 10 iterations, denoising the latent using 20 steps of DDIM sampling, with . The training process runs for approximately 2.5 hours on a single NVIDIA V100 GPU for each CCUB cultural dataset.
9 CCUB Dataset Scale
Table 3 illustrates the scale of our CCUB dataset. The number of hand-selected images and their corresponding captions in nine cultural categories for six different cultures are listed.
CCUB contains the image web links and the manual captions. We do not own the copyright of the images.
|
food & drink |
people & actions |
clothing |
architecture |
city |
dance music art |
nature |
utensil & tool |
religion & festival |
total |
|||
|---|---|---|---|---|---|---|---|---|---|---|---|---|
| Korea | 34 | 22 | 20 | 20 | 21 | 20 | 8 | 6 | 11 | 162 | ||
| China | 33 | 31 | 24 | 23 | 27 | 23 | 5 | 15 | 8 | 189 | ||
| Nigeria | 21 | 16 | 18 | 17 | 13 | 21 | 11 | 8 | 15 | 140 | ||
| Mexico | 22 | 19 | 14 | 18 | 15 | 10 | 7 | 10 | 19 | 134 | ||
| India | 19 | 26 | 24 | 21 | 16 | 18 | 9 | 7 | 8 | 148 | ||
|
23 | 22 | 10 | 17 | 29 | 15 | 16 | 12 | 7 | 151 | ||
| Total | 152 | 136 | 110 | 116 | 121 | 107 | 56 | 58 | 68 | 924 |
10 Automatic Metrics
Figure 9 demonstrates that serves to prevent memorization and enhance diverse expression. The metrics are calculated during training and averaged across three cultures. Additionally, Table 4 offers supplementary details, abalating SCoFT for automatic metrics performance across each culture.
| KID-CCUB | KID-COCO | CLIP Score | |||||||||||||
|---|---|---|---|---|---|---|---|---|---|---|---|---|---|---|---|
| Model Name | CN | KR | NG | IN | MX | CN | KR | NG | IN | MX | CN | KR | NG | IN | MX |
| Stable Diffusion | 25.244 | 28.061 | 32.687 | 39.988 | 25.796 | 4.396 | 4.396 | 4.396 | 4.396 | 4.396 | 0.827 | 0.844 | 0.799 | 0.773 | 0.819 |
| SCoFT+M | 18.798 | 24.118 | 24.539 | 20.566 | 25.196 | 4.890 | 4.497 | 4.461 | 5.342 | 4.364 | 0.804 | 0.832 | 0.792 | 0.757 | 0.825 |
| SCoFT+MP | 15.895 | 23.007 | 25.638 | 19.799 | 22.462 | 5.090 | 4.403 | 5.135 | 5.112 | 4.941 | 0.798 | 0.836 | 0.792 | 0.753 | 0.8232 |
| SCoFT+MPC | 14.667 | 17.413 | 23.261 | 18.342 | 24.424 | 5.102 | 4.222 | 4.987 | 5.457 | 4.325 | 0.793 | 0.825 | 0.795 | 0.753 | 0.829 |
11 Human Evaluation
| Item Title | Item Text |
|---|---|
| Description and Image Alignment | Rank the accuracy of the match between the image and its description. Number each image from 1 for the image best described by the description to 4 for the worst match between image and description. (1=best described, 4=worst described) |
| Cultural Representation | Rank the images from 1 for the best representation of culture to 4 for the worst cultural representation. Please ignore image artifacts (such as distorted faces, hands, or glitches) when considering Cultural Representation. (1=most representative, 4=least representative) |
| Stereotypes | Rank the images from 1 for being the least stereotypical depiction of culture to 4 for the most based on your personal knowledge of stereotypes. (1=least stereotypical, 4=most stereotypical) |
| Offensiveness | Rank the images by their offensiveness to you personally, numbering from 1 as the least offensive to 4 for the most offensive. Please ignore image artifacts (such as distorted faces, hands, or glitches) when considering Offensiveness. (1=least offensive, 4=most offensive) |
11.1 Survey Description
Our goal of improving the cultural perception of generated images is a subjective metric largely determined by members of a given identity group. To evaluate our performance on this criteria, we recruited people with at least 5 years of cultural experience in each of the 5 countries with survey questions specific to their self-selected national cultural affiliation. A single page of the survey form provides one description (prompt) and one image made by each of the four generators using a common random seed, for four total images. Each survey page has a total of four survey items (rows that participants respond to, see Table 5) to rank relative to (a) Description and Image Alignment, (b) Cultural Representation, (c) Stereotypes, and (d) Offensiveness. Participants respond by numerically ranking the set of randomly ordered images from best image to worst image once for each item. An image labeled rank 1 would signify both best aligned and least offensive when each case is ranked, while rank four would be least well aligned and most offensive. A sample of a single survey page can be viewed in Figure 25.
11.2 Analysis and Evaluation of Model Performance
We quantitatively estimate the subjective perceived performance of each model using the crowd-kit implementation of the Matrix Mean-Subsequence-Reduced (MMSR) model, an established algorithm for noisy label aggregation, followed by a weighted majority vote to aggregate labels across workers, and then a simple majority vote aggregating labels into rankings, thus MMSR+Vote. MMSR models the varying levels of participant expertise as a vector, which we frame as representing consensus alignment to account for the combination of knowledge and subjective perception we are measuring, and the equivalent term chosen by is “skills”. We abstract rankings in survey responses into unique binary pairwise comparison labels asking if the left image is perceived as better than the right image with respect to the given survey item. An example of a binary comparison is when a respondent has indicated that it is true that an image given rank 1 is less offensive than the image given rank 2. MMSR is provided with the participant, survey item, and abstracted response labels, then models the noisy label prediction problem as:
| (5) |
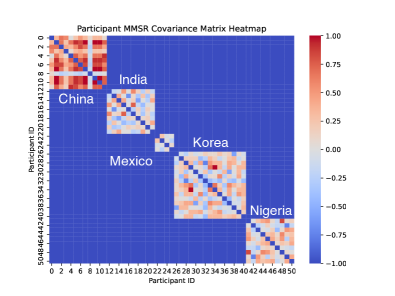
where is the participant covariance matrix (Figure 12), is the number of labels (true, false), and is a matrix filled with the width and height of . We run 10k iterations of robust rank-one matrix completion with a stopping tolerance of 1e-10 to compute the initial label estimates. We aggregate the binary labels with a weighted majority vote, and then estimate aggregate rankings from labels with a simple majority vote.
One limitation of MMSR evaluation is that it prioritizes a single consensus response. This means a comparatively small quantity of insightful but marginalized perspectives might be undervalued in a manner undifferentiated from a small quantity of random responses.
We run MMSR under three configurations:
(1) Figure 10(a) Overall Best Method: where all rankings for all items and all countries are supplied together to estimate the best method across all responses. This model found a participant consensus indicating our SCoFT+MPC method performs best, followed by SCoFT+MP, SCoFT+M, and finally Generic Stable Diffusion as the least preferred.
(2) Figure 10(b) Overall best method by Country: This model found a participant consensus in complete agreement with configuration 1, with the exception of India where the consensus agreement rated the SCoFT+MP method best, followed by SCoft+MPC, SCoFT+M, and Generic Stable Diffusion.
(3) Figure 10(c) Overall best method by Survey Item: This model found overall participant ratings of models across each of the survey topics (Prompt to Image Alignment, Cultural Representation, Stereotyping, and Offensiveness) agree with configuration 1.
Figure 12 shows the MMSR Covariance matrix heatmap representing the strength of agreement between different participants. Each row and column is a separate participant. The deep blue areas represent questions with zero overlap, as participants from each country were asked independent groups of questions. The lighter blue through dark red squares are the similarity of answers between ay two participants. The squares from top left to bottom right represent China, India, Mexico, Korea, and Nigeria, respectively. The covariance matrix for China is notably a darker red compared to all other countries, indicating a combination of a stronger agreement in combination with the greater number of questions answered per participant with experiences in China, on average.
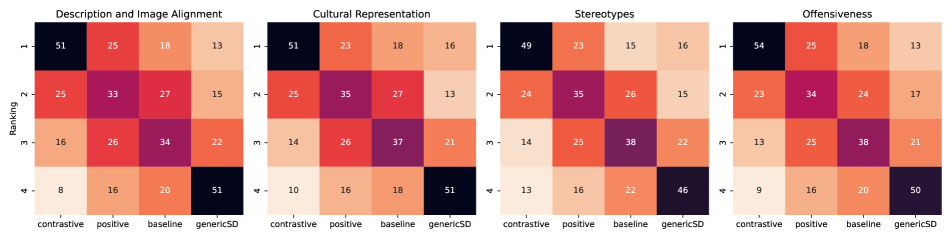
Figure 13 displays the counts of survey item responses (Table 5) for each ablation. Our contrastive approach SCoFT+MPC is consistently selected as the top-ranked choice across all survey evaluation items.
Noisy Bradley Terry. We quantitatively estimate the subjective perceived performance of each model using the crowd-kit implementation of the Noisy Bradley Terry (NBT) model, an algorithm that performs noisy binary label aggregation for the purpose of further substantiating our existing results. As Figure 11 shows, the NBT composite score of participant responses consistently ranks SCoFT+MPC method as the best, followed by SCoFT+MP, SCoFT+M, and finally Generic Stable Diffusion as the least preferred in every case, including the Overall rankings in Figure 11(a), the rankings by Country in Figure 11(b), and the Rankings by Survey Item in Figure 11(c).
Taken together, the reliable consistency of model rankings across multiple different evaluation methods, maximum participant count (Figure 13), and simple averaging, represent very strong quantitative evidence of the improvements constituted by our SCoFT+MPC method with respect to Description and Image Alignment, Cultural Representation, Stereotyping, and Offensiveness when compared to Stable Diffusion.
12 Additional Qualitative Samples
12.1 Memorization Loss
We present more examples comparing fine-tuning Stable Diffusion with CCUB using with and without memorization loss () in Figures 14, 15, and 16. The addition of prevents the model from generating images similar to the training images given a training text prompt. This is an important property when fine-tuning on a small dataset, e.g., CCUB.
12.2 Ablation on Self-Contrastive Perceptual Loss
In Figures 17 and 18, we present additional ablations on SCoFT, showcasing the impact of different losses on the CCUB datasets for Chinese and Indian cultures. SCoFT improves generated images compared to conventional fine-tuning by reducing stereotypes such as old, poor looking regions and adhering to culturally important aspects such as art tools, clothing, and architectual styles.
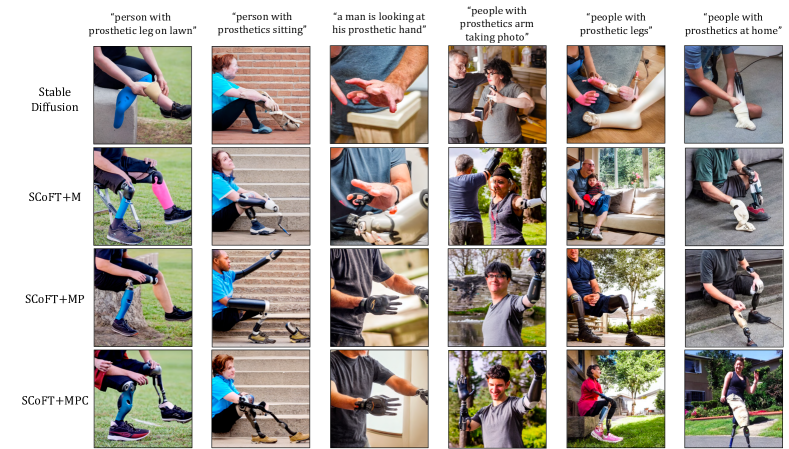
In Figure 19, we validate the efficacy of each loss in our SCoFT framework using an internal prosthetics dataset. Our findings indicate that generic Stable Diffusion tends to introduce inherent biases in representations of the prosthetic using community and often generates inaccurate images. In contrast, our SCoFT+MPC approach consistently produces accurate representations. Moreover, we demonstrate the versatility of SCoFT by applying it to other fine-tuning domains, such as the prosthetics dataset, where it proves effective in generating more accurate images. We hope to perform future work in demonstrating SCoFT’s abilities to improve generated images for many communities harmed by bias and inaccurate representation.
12.3 More Qualitative Examples
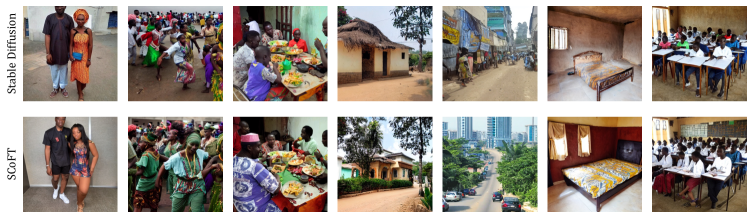
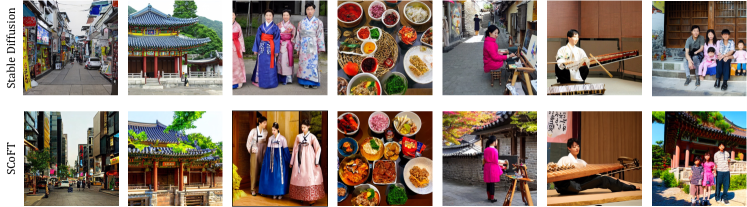
In Figures 20 to 24, we present additional qualitative examples illustrating how our SCoFT model outperforms the original Stable Diffusion in cultural understanding and the ability to generate less offensive images for various cultural concepts. Results are showcased across Nigeria, Korea, India, Mexico, and China. Furthermore, our models exhibit good performance for text prompts beyond our nine cultural categories, such as “photo of a bedroom”, “students are studying in the classroom”.
13 Additional Limitations
This work has the potential to shift the way that image generators operate at achievable costs to ensure that several categories of harm from ‘AI’ generated models are mitigated, while the generated images become much more realistic and representative of the AI-generated images that populations want around the world. Our proposed methods have potential applications in other domains such as reducing the risk of copyright infringement, better respecting cultural and community-defined boundaries, and addressing offensiveness across a broader range of identity characteristics and other criteria. Additionally, this work carries several risks, for example, the algorithm can easily be inverted to generate the most problematic images possible. While our approach works toward collecting and training datasets in a respectful manner, we do not address the nonconsensual use of images for training the baseline Stable Diffusion models we use as a starting point.