[1]R. Chen
1]\orgdivDepartment of Physics and Astronomy, \orgnameNorthwestern University, \orgaddress\street633 Clark St, \cityEvanston, \postcode60208, \stateIL, \countryUS
2]\orgnameArgonne National Laboratory, \orgaddress\street9700 S Cass Ave, \cityLemont, \postcode60439, \stateIL, \countryUS
3]\orgdivDepartment of Physics, \orgnameUniversity of Massachusetts Amherst, \orgaddress\street710 N Pleasant St, \cityAmherst, \postcode01003, \stateMA, \countryUS
4]\orgdivDepartment of Physics, \orgnameUniversity of Toronto, \orgaddress\street27 King’s College Cir, \cityToronto, \postcode M5R 0A3, \stateON, \countryCanada
5]\orgdivDepartment of Physics, \orgnameMassachusetts Institute of Technology, \orgaddress\street77 Massachusetts Ave, \cityCambridge, \postcode02139, \stateMA, \countryCanada
Modeling and characterization of TES-based detectors for the Ricochet experiment
Abstract
Coherent elastic neutrino-nucleus scattering (CE\textnuNS) offers a valuable approach in searching for physics beyond the Standard Model. The Ricochet experiment aims to perform a precision measurement of the CE\textnuNS spectrum at the Institut Laue–Langevin nuclear reactor with cryogenic solid-state detectors. The experiment plans to employ an array of cryogenic thermal detectors, each with a mass around 30 g and an energy threshold of sub-100 eV. The array includes nine detectors read out by Transition-Edge Sensors (TES). These TES based detectors will also serve as demonstrators for future neutrino experiments with thousands of detectors. In this article we present an update in the characterization and modeling of a prototype TES detector.
keywords:
CE\textnuNS, BSM physics, neutrino, TES, cryogenic calorimeter1 Introduction
In 1974, Daniel Freedman predicted that for sufficiently small momentum transfers, neutrinos can interact coherently with nuclei [1]. The process, known as Coherent Elastic Neutrino(\textnu)-Nucleus Scattering (CE\textnuNS), evaded detection until 2017. The COHERENT experiment measured CE\textnuNS at the Spallation Neutron Source (SNS) with a neutrino energy of 30 MeV [2]. This measurement took advantage of the enhanced cross section with the coherent interaction, enabling a detection with kg-scale target mass rather than the traditional ton-scale neutrino detectors.
The Ricochet experiment[3, 4] aims to measure the spectrum of CE\textnuNS with high-statistics and high-precision at the Institut Laue–Langevin (ILL) nuclear reactor in Grenoble, France. The experiment is located 8.8 m from the reactor core, which provides a high neutrino flux that is 1000 times higher than that from the SNS. However, the lower energy of neutrinos from the reactor requires a lower detector threshold ( eV) to take advantage of this flux. To achieve such a low energy threshold, the Ricochet experiment will employ cryogenic calorimeters. Two technologies—Neutron Transmutation Doped (NTD) thermistors and Transition Edge Sensors (TES)—will be used. The NTD-based detector array is called the Cryocube [5, 6] and the TES-based detector array is named the Q-Array [7]. This paper focuses on the development of the TES-based detector and characterization of a prototype detector with a germanium target.
2 Detector Architecture and Experiment Setup
2.1 Detector Architecture
A Q-Array style detector consists of two components [8]:
-
1)
A target constituted by a crystal with a thin gold film deposited on the surface;
-
2)
A modular thermal sensor equipped with a TES reading out the temperature excitation from the target.
In its quiescent state the detector target is held near the critical temperature of the TES. Particle interactions raise the temperature of the target. A 300-nm thick gold film is deposited with an electron beam evaporator onto the target to collect the energy released by the particle interaction through electron-phonon coupling. The absorbed energy is guided from the gold film to the TES sensor via a gold wire bond. The other end of the TES sensor is connected to the thermal bath via an engineered thermal impedance. The thermal impedance, referred to as a “meander”, controls the heat flow through the TES. The TES and the meander are deposited on a mm3 silicon chip. The sensor modularity and separation from the target makes this detector architecture easily scalable and allows for flexibility in the target material choice. The electrical signal generated by the TES is read out via two niobium traces which connect to a Superconducting Quantum Interference Device (SQUID) nearby the detector housing.
2.2 Experiment Setup
We tested a germanium target with the modular TES-based sensor described in Sec. 2.1. The TES consists of an Al/Mn bi-layer with a critical temperature of 20 mK, fabricated by Argonne National Laboratory. More details of the TES chip will be presented in a companion paper [9]. The detector is housed in a light-tight copper holder. The germanium target is held by 8 sapphire spheres [10] to isolate the target from copper holder, where in this case the copper holder functions as a thermal bath. The TES chip is glued to the housing using GE Varnish. The germanium target was activated using an Pu-Be source, resulting in the generation of an activated peak at 10.37 keV from decay.
3 Complex Impedance Measurement and Modeling
The complex impedance of the detector was measured and leveraged to characterize the device. To measure the complex impedance, a signal generator injects sine waves with varying frequencies and amplitudes into the TES bias circuit [13]. Meanwhile, the readout circuit records the detector response to these injected signals. The complex impedance was measured from 2 Hz to 5 kHz. Figure 1 shows the result of the complex impedance measurement with our detector and also for a TES-only device by theory. It illustrates that the complex impedance of our detector is significantly different from the theory.
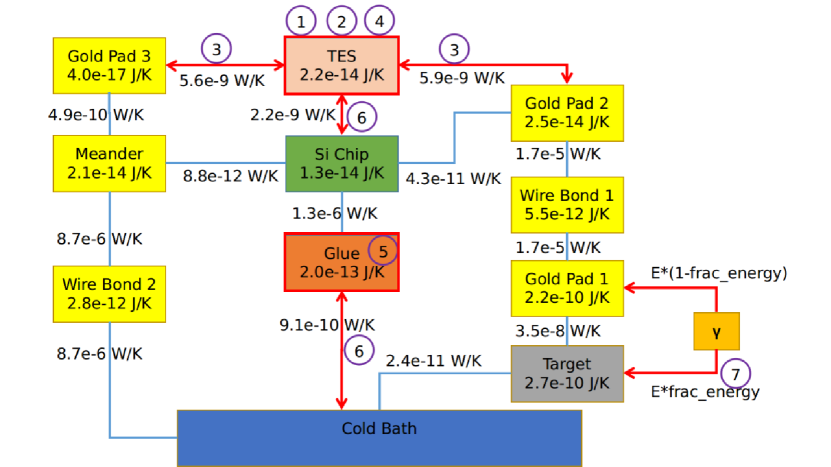
In order to gain a better understanding of the detector’s behavior, optimize its design and improve its future performance, we constructed a numerical model for simulating this specific type of detector [8, 14, 15]. In the model, each component is simplified as a point with a heat capacity and zero thermal diffusion relaxation time, as shown in Fig. 2. The thermal connections between components are described by a set of linearized thermal diffusion equations.
This work aimed to model both the static and dynamic response of the detector by reproducing the complex impedance results and the average pulse and allows us to estimate:
-
1)
Heat capacities of each component;
-
2)
Thermal conductance between each component;
-
3)
Temperature sensitivity and current sensitivity of the TES [16].
A Markov Chain Monte Carlo (MCMC) was used to fit the complex impedance data. Parameters selected for the MCMC optimization are highlighted with a red box or arrow in Fig. 2 (left).
| Categories | Parameters | units | MCMC | MCMC |
| initialization | results | |||
| TES Parameters | Temperature sensitivity of TES | No Unit | 9 | 18 |
| Current sensitivity of TES | No Unit | 1.00 | 0.96 | |
| Heat Capacities | Germanium Target | J/K | ||
| Au Pad 1 | J/K | |||
| Wire Bond 1 | J/K | |||
| Au Pad 2 | J/K | |||
| TES | J/K | |||
| Si Chip | J/K | |||
| Meander | J/K | |||
| Wire Bond 2 | J/K | |||
| Glue | J/K | |||
| Thermal Conductances | Between Target and Cold Bath | W/K | ||
| Between Target and Au Pad 1 | W/K | |||
| Between Au Pad 1 and Wire Bond 1 | W/K | |||
| Between Wire Bond 1 and Au Pad 2 | W/K | |||
| Between Au Pad 2 and TES | W/K | |||
| Between Au Pad 3 and TES | W/K | |||
| Between Au Pad 2 and Si Chip | W/K | |||
| Between TES and Si Chip | W/K | |||
| Through Gold Pad 3 and Meander | W/K | |||
| Between Meander and Si Chip | W/K | |||
| Between Si Chip and Glue | W/K | |||
| Between Glue to Cold Bath | W/K | |||
| Between Meander and Wire Bond 2 | W/K | |||
| Between Wire Bond 2 and Cold Bath | W/K | |||
| Simulation Parameter | Fraction of Energy into Target | No Unit | 100% | 50% |
The MCMC method is implemented through a python package called “PyMC3” [17] which uses gradient-based MCMC algorithms.
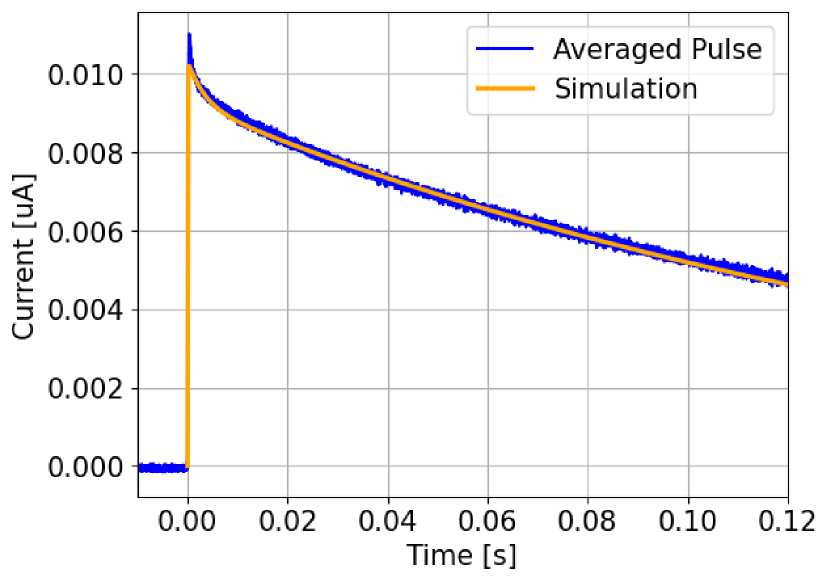
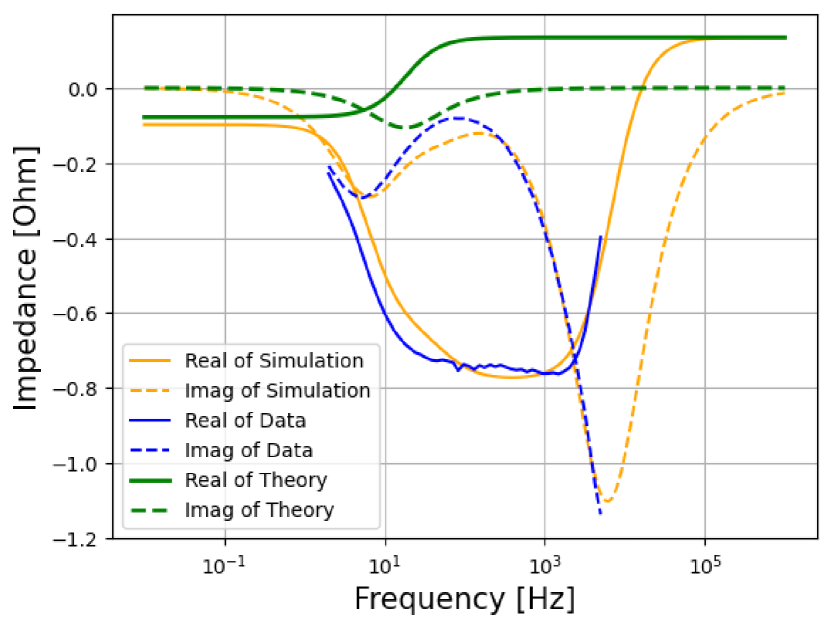
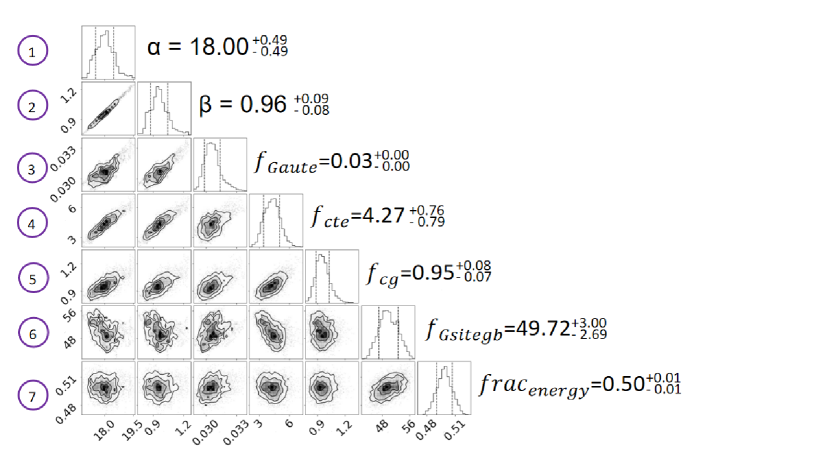
Figure 1 shows the complex impedance data and the average pulse (blue), and its MCMC fit to the simulation (orange). Parameters from the MCMC fit are reported in Table 1. Figure 2 (right) shows the corner plot of the MCMC fit which illustrates the distribution of each parameter in the Markov chain and their correlation with the other parameters. A definition of parameters in the corner plot can be found in Table 2.
Despite being a thermal detector, athermal processes can still occur and impact the pulse shape. To simulate this phenomenon in the model, instead of injecting the total energy from an event directly into the target, a fraction of the energy is injected into gold pad 1. The thermal impedance between this pad and the TES is smaller and can be used to simulate the effects of faster thermalization to the gold through athermal processes. The fraction of energy injected into the gold pad 1 is defined as , as shown in the corner plot Fig. 2 (right).
A discussion of results follows:
-
1)
The value is the thermal conductance between gold pad 2 and 3, and the TES. The difficulty in accurately estimating the thermal conductance through the interface between nanometer scale thin films has resulted in a large uncertainty. To avoid over-constraining the fit, we have estimated the thermal conductance through the gold pad, which sets a fairly high upper limit for , and assume a flat prior down to zero conductance. The corner plot shows that the fit prefers a value 3 % of the first estimation. A lower conductance indicates a slow response time of the detector and a lower the energy efficiency because some energy will bypass the TES. In future experiments, we will employ a different chip which has a larger overlap area between gold pad and TES to improve this conductance.
-
2)
The factor controls the thermal conductance from TES through glue to the cold bath. The value of 50 from the MCMC fitting indicates a large thermal conductance through the glue which could allow energy to enter the thermal bath without passing through the TES. This detrimental effect will be mittigated by new mounting strategies, such as clamping the chip mechanically, will be tested to reduce this effect.
| Ref. # in | Ref. in | |
| Fig. 2 | Fig. 2 | Description |
| (left) | (right) | |
| 1 | \textalpha | \textalpha, Temperature sensitivity of TES |
| 2 | \textbeta | \textbeta, Current sensitivity of TES |
| 3 | Factor for Therm. Cond. between Gold and TES | |
| 4 | Factor for heat capacity of TES | |
| 5 | Factor for heat capacity of glue | |
| 6 | Factor for Therm. Cond. from TES to the cold bath | |
| 7 | Fraction of energy injected into target, rest injects to the gold pad 1 |
4 Conclusion and Plan
A germanium detector equipped with a modular TES-based sensor was tested and characterized at the NEXUS test facility. Currently we are suffering from a vibrations induced noise by the pulse tube so that the energy resolution is not ideal so we focused on the complex impedance measurement and modeling.
The successful concurrent fitting of pulse shape and complex impedance measurements have enabled us to gain insights into the heat capacities and thermal conductance of the system as well as identify key limitations affecting performance. For example, the thermal conductance from the target to TES is lower than the original estimation which may limit the energy efficiency. This limit will be tackled with a newer version of the modular sensor design, which is capable of improving thermal diffusion along the TES thanks to a larger overlap area between gold and TES, thereby reducing the decay time constant and increase the energy efficiency. These ongoing efforts are geared towards further enhancing the performance and capabilities of the detector system.
5 Acknowledgements
This work is supported in part by NSF grant PHY-2209585, the Connaught Fund at University of Toronto, and the Canada First Research Excellence Fund through the Arthur B. McDonald Canadian Astroparticle Physics Research Institute. This research was enabled in part by support provided by SciNet (www.scinethpc.ca) and the Digital Research Alliance of Canada (alliancecan.ca). This work is part of R&D for Ricochet experiment and we would like to thank all members of Ricochet.
This work made use of the NUFAB facility of Northwestern University’s NUANCE Center, which has received support from the SHyNE Resource (NSF ECCS-2025633), the IIN, and Northwestern’s MRSEC program (NSF DMR-1720139).
Work at Argonne National Lab, including work performed at the Center for Nanoscale Materials, a U.S. Department of Energy Office of Science User Facility, is supported by the U.S. Department of Energy, Office of Science, Office of High Energy Physics and Office of Basic Energy Sciences, under Contract No. DE-AC02-06CH11357.
A portion of the work carried out at MIT was supported by a U.S. Department of Energy (DOE) DOE QuantISED award DE-SC0020181, the NSF under Grant PHY-2110569, and the Heising-Simons Foundation, United States.
Data Availability
The datasets analysed during the current study are available from the corresponding author on reasonable request.
References
- \bibcommenthead
- D.Z. Freedman [1974] D.Z. Freedman: Coherent effects of a weak neutral current. Phys. Rev. D 9, 1389 (1974) https://doi.org/10.1103/PhysRevD.9.1389
- D. Akimov et al. [2017] D. Akimov, J. B. Albert, P. An et al.: Observation of coherent elastic neutrino-nucleus scattering. Science 357, 1123 (2017) https://doi.org/10.1126/science.aao0990
- C. Augier et al. [2023a] C. Augier, G. Beaulieu, V. Belov, et al.: Ricochet progress and status. J Low Temp Phys 212(3), 127–137 (2023) https://doi.org/10.1007/s10909-023-02971-5
- C. Augier et al. [2023b] C. Augier, G. Beaulieu, V. Belov et al.: Fast neutron background characterization of the future ricochet experiment at the ill research nuclear reactor. Eur Phys J C Part Fields 83(1), 20 (2023) https://doi.org/%****␣main.bbl␣Line␣100␣****10.1140/epjc/s10052-022-11150-x
- T. Salagnac et al. [2023] T. Salagnac, J. Billard, J. Colas et al.: Optimization and Performance of the CryoCube Detector for the Future RICOCHET Low-Energy Neutrino Experiment. J. Low Temp. Phys. 211, 398–406 (2023) https://doi.org/10.1007/s10909-023-02960-8
- C. Augier et al. [2023a] C. Augier, G. Beaulieu, V. Belov et al.: First demonstration of 30 eVee ionization energy resolution with Ricochet germanium cryogenic bolometers (2023)
- C. Augier et al. [2023b] C. Augier, G. Beaulieu, V. Belov et al.: Results from a prototype tes detector for the ricochet experiment. Nucl Instrum Methods Phys Res A 1057, 168765 (2023) https://doi.org/10.1016/j.nima.2023.168765
- R. Chen et al. [2023] R. Chen, H. D. Pinckney, E. Figueroa-Feliciano et al.: Transition Edge Sensor Chip Design of a Modular CE\textnuNS Detector for the Ricochet Experiment. J. Low Temp. Phys. 211, 237–247 (2023) https://doi.org/10.1007/s10909-022-02927-1
- [9] G. Wang et al: Properties of Low Tc AlMn TES (manuscript in preparation)
- H.D. Pinckney et al. [2022] H.D. Pinckney, G. Yacteen, A. Serafin et al: The thermal conductance of sapphire ball based detector clamps. J. Low Temp. Phys. 209, 1204–1211 (2022) https://doi.org/10.1007/s10909-022-02777-x
- R. Ren et al. [2021] R. Ren, C. Bathurst, Y. Y. Chang et al.: Design and characterization of a phonon-mediated cryogenic particle detector with an eV-scale threshold and 100 keV-scale dynamic range. Phys. Rev. D 104, 032010 (2021) https://doi.org/10.1103/physrevd.104.032010
- M. Battaglieri et al. [2017] M. Battaglieri, A. Belloni, A. Chou et al.: US Cosmic Visions: New Ideas in Dark Matter 2017: Community Report (2017)
- K. Hattori et al. [2020] K. Hattori, R. Kobayashi, S. Takasu, D. Fukuda: Complex impedance of a transition-edge sensor with sub-μs time constant. AIP Adv. 10, 035004 (2020) https://doi.org/10.1063/1.5127100
- Figueroa-Feliciano [2006] Figueroa-Feliciano, E.: Complex microcalorimeter models and their application to position-sensitive detectors. J. Appl. Phys. 99, 114513 (2006) https://doi.org/10.1063/1.2191449
- N. Bastidon et al. [2018] N. Bastidon, J. Billard, E. Figueroa-Feliciano, S. Heine, Z. Hong, H. D. Pinckney: Optimizing thermal detectors for low-threshold applications in neutrino and dark matter experiments. J Low Temp Phys 193(5), 1206–1213 (2018) https://doi.org/10.1007/s10909-018-2073-2
- Irwin and Hilton [2005] Irwin, K.D., Hilton, G.C.: In: Enss, C. (ed.) Transition-Edge Sensors, pp. 63–150. Springer, Berlin, Heidelberg (2005). https://doi.org/10.1007/10933596_3
- J. Salvatier et al. [2016] J. Salvatier, T. V. Wiecki, C. Fonnesbeck: Probabilistic programming in Python using PyMC3. PeerJ Comput. Sci. 2, 55 (2016) https://doi.org/10.7717/peerj-cs.55