How to distinguish white dwarf and neutron star X-ray binaries during their X-ray outbursts?
Abstract
We present spectral signatures of neutron stars (NSs) and white dwarfs (WDs) hosted in accreting X-ray binaries that can be easily identified in X-ray observations. We perform spectral and timing analysis of 4U 1636–53 and SS Cygni, as typical representatives of such NS and WD binaries, based on their X-ray observations by RXTE, ASCA, Suzaku and BeppoSAX uising Comptonization spectral model. As a result, we formulate a criterion that makes it easy to distinguish NS from WD in such binaries: NS X-rays exhibits quasi-stable behavior with the index and is characterized by quasi periodic oscillations (QPOs) at Hz, although WD X-rays is stable with and is accompanied by QPOs at Hz during source outbursts. In addition, we revealed that in 4U 1636–53 the mHz QPOs anti-correlate with the plasma temperature, of Compton cloud (or the corona around a NS. This allowed us to associate mHz-QPOs with the corona dynamics during outburst cycle. The above index effect, now well established for 4U 1636–53 and SS Cygni using extensive observations, has previously been found in other low-mass X-ray NS and WD binaries and agrees well with the criterion for distinguishing NSs and WDs presented here.
1 Introduction
Compact objects – black holes, neutron stars (NSs) and white dwarfs (WDs) represent a unique opportunity to study stars at its late evolution stages and, thus, to study the properties of matter in superdense states that are not found in terrestrial conditions. These objects have some differences, both observational and theoretical. For example, NSs and WDs, in contrast to black holes, have a hard surface. The NS and WD themselves differ in size and physical parameters. NSs and WDs, which are hosted in low-mass X-ray binaries (LMXBs), sometimes accreting matter from a companion star, causing X-ray outbursts. These episodes give their clear observational signatures of NSs and WDs and thus help us to formulate similarities and differences in their observational manifestations. In X-ray outbursts, they follow a similar evolution, demonstrating different spectral states, probably associated with different accretion regimes. Of these spectral states, two of the most important can be distinguished: the low-hard states (LHS) and the high-soft states (HSS). It is believed that Compton scattering by hot electrons predominates in the hard state; and the soft state is associated with thermal radiation, for an example from the accretion disk and a NS surface in the NS case. An evolution of such sources during X-ray outbursts follows a q-shaped counterclockwise motion trajectory in terms of a hardness-intensity diagram (HID). Outbursts can last from a few weeks to many months before eventually returning to a low-luminosity dormant state. In addition to HID, low-frequency quasi peridic oscillations (LF-QPOs) have proven to be a useful tool for tracking spectral states and transitions between them. Recently, Sonbas et al. (2022) introduced a “Minimum Time Scale” (MTS), a timing property, to track spectral transitions with an intensity variability diagram that plots the source count rate as a function of MTS as the source undergoes spectral changes during an outburst. The MTS represents the time scale associated with the shortest time response in the light curve, or equivalently, the highest frequency component of the signal above the Poisson noise in the power spectra Mohamed et al. (2021).
| Parameter | 4U 1636–53 | SS Cygni |
|---|---|---|
| Class of primary | NS, | WD |
| Mass of an X-ray star, M⊙ | 1.4 Giles et al. (2002) | 1.19 0.02 Friend et al. (1990), 0.81 0.19 Bitner et al. (2007) |
| Spectral type of secondary | … | K5/5 |
| Mass of an optical star, M⊙ | 0.4 | 0.70 0.02 Friend et al. (1990) |
| Orbital inclination, , deg | 70 Sanna et al. (2013); Casares et al., (2006); Frank et al. (1987) | 37 5 , 45–56 Bitner et al. (2007) |
| Distance, pc | (6.00.5) Ritter & Kolb (2003) | 166 12 Galloway et al. (2020) |
| Orbital period, hr | 3.8 Smale & Mukai (1988); van Paradijs et al. (1990) | 6.603 Harrison et al. (2004) |
A task of searching/formulating distinctive features of NSs and WDs that are easily recognizable in observations has become urgent. In this paper, we study observational differences in terms of X-ray spectra using samples of two bright representatives of these classes, 4U 1636–53 and SS Cygni, during their X-ray outbursts. The low mass X-ray binary (LMXB) 4U 1636–53 is a member of the class Hasinger & van der Klis (1989). It contains a NS accreting matter from a companion star of mass 0.4 M⊙ (see Table 1). This source has been extensively observed over the past five decades and is considered as a persistent X-ray source Liu et al. (2007). Its optical counterpart (V801 Ara) revealed its 3.8 hr orbital period (see, e.g. Smale & Mukai (1988) and van Paradijs et al. (1990)) as photometric variations, but the period has also been detected spectroscopically Casares et al., (2006).
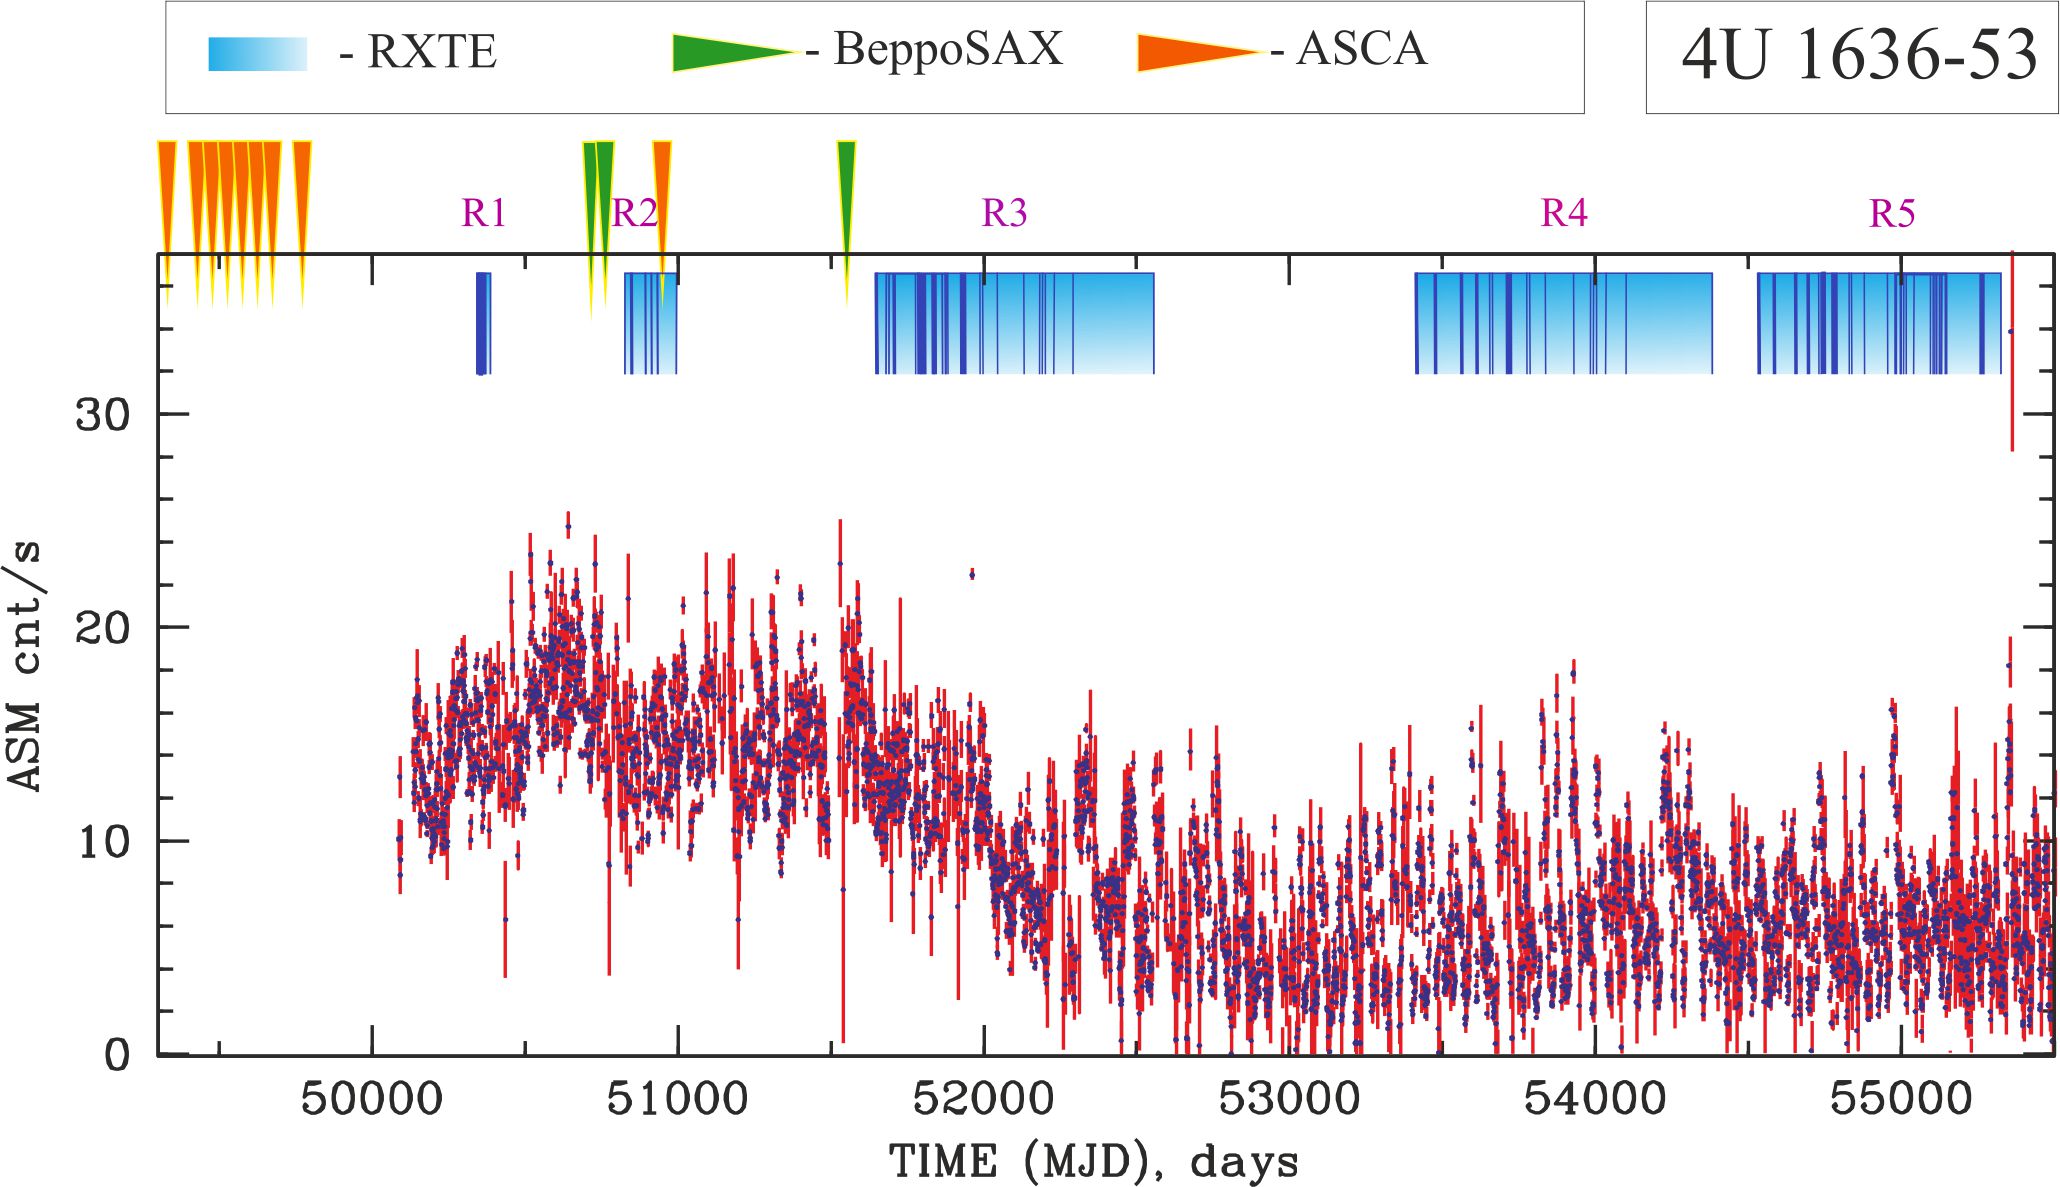
4U 1636–53 shows bursts of thermonuclear combustion on the surface of a star, which immediately classifies it as a reliable NS source Strohmayer (1998). The distance to 4U 1636–536 was determined to be 6.00.5 kpc, assuming that its brightest outbursts with an expansion of the photospheric radius caused by pure helium Galloway et al. (2006, 2018), which is consistent with the measured value of 4.42 kpc by Gaia Galloway et al. (2020). Previous studies suggest this source has a high inclination, however a lack of dips in the X-ray light curve limits the inclination Sanna et al. (2013); Casares et al., (2006); Frank et al. (1987). X-ray observations with the All Sky Monitor (ASM) onboard RXTE shown that light curve of 4U 1636–53 demonstrates two kinds of long-term segments with different mean flux levels. Up to 2000, the ASM mean count-rate was significantly higher than that after 2001 (see Fig. 1). During 2001, the ASM recorded an obvious, gradual decline of the X-ray flux. Within a year, it began to exhibit a substantial quasi-periodic, long-term variability of 30–40 days Shih et al. (2005). This variability is consistent with temporal and energy changes that occur between two states of atoll sources: the island (hard) and banana (soft) states Hasinger & van der Klis (1989). Furthermore, Shih et al. (2005) also reported that this variation was present in both X-ray soft (2–12 keV, RXTE/ASM) and hard (20–100 keV, INTEGRAL/IBIS) energy bands, but that these ones were anti-correlated. Such a clear energy-dependent pattern is explained by an accretion disc instability.
| Set | Satellite | Obs. ID | Start time (UT) | End time (UT) | MJD interval |
|---|---|---|---|---|---|
| B1 | BS | 20168003 | 1998 Feb 28 22:40:24 | 1998 Mar 1 12:50:17 | 50873.0–50873.5 Fiocchi et al. (2006) |
| B2 | BS | 20537002 | 1998 Feb 24 19:20:13 | 1998 Feb 24 15:07:18 | 50868.8–50869.6 Fiocchi et al. (2006) |
| B3 | BS | 20836001 | 2000 Feb 15 23:52:07 | 2000 Feb 17 01:11:09 | 51589.9–51591.1 Fiocchi et al. (2006) |
| A1 | ASCA | 40026000 | 1993 Aug 9 10:31:22 | 1993 Aug 10 15:53:50 | 49208.4–49209.7 |
| A2 | ASCA | 42004000 | 1994 Aug 31 06:43:44 | 1994 Sep 1 10:40:48 | 49595.2–49596.4 |
| A3 | ASCA | 42004010 | 1994 Sep 9 04:34:17 | 1994 Sep 10 06:10:35 | 49604.2–49605.3 |
| A4 | ASCA | 42004020 | 1994 Sep 5 12:44:18 | 1994 Sep 5 17:11:54 | 49600.5–49605.7 |
| A5 | ASCA | 42004030 | 1994 Sep 13 01:05:00 | 1994 Sep 13 21:23:40 | 49608.0–49608.9 |
| A6 | ASCA | 42004040 | 1994 Sep 7 17:32:44 | 1994 Sep 8 18:46:54 | 49602.7–49603.8 |
| A7 | ASCA | 42004050 | 1994 Sep 6 11:41:54 | 1994 Sep 6 17:09:18 | 49601.5–49601.7 |
| A8 | ASCA | 42004060 | 1995 Mar 20 06:32:58 | 1995 Mar 21 03:24:10 | 49796.3–49797.1 |
| A9 | ASCA | 46011000 | 1998 Aug 19 09:23:04 | 1998 Aug 20 06:52:08 | 51044.3–51045.3 Corbel & Kaaret (2000) |
Belloni et al. (2007) revealed the dependence of timing pattern on the mean X-ray luminosity, sampling effect and spectral hardness of 4U 1636–35 as well as provided further evidence regarding the nature of the long-term variability of this source Belloni et al. (2007). Twenty years after the discovery of kHz quasi-periodic oscillations (QPOs) in NS low-mass X-ray binaries Strohmayer et al. (1996); van der Klis et al. (1996), a pretty convincing explanation of the origin of this QPO phenomenon remains a challenge Mendez et al. (2006). Millihertz quasi-periodic oscillations (mHz QPOs) Revnivtsev01 ; Altamirano08 ; Lyu15 and their harmonics Fei21 were found in 4U 1636–53, which were immediately attributed to nuclear combustion processes on the surface of a NS. However, Heger et al. (2007) showed that stable nuclear burning of helium on the surface of a neutron star can lead to mHz-QPO only in the case of the Eddington accretion regime Heger07 . Such a regime corresponds to an accretion rate an order of magnitude higher than the average accretion rate determined from observations. To address this inconsistency, Heger et al. (2007) suggested that the local accretion rate in the burning layer, where mHz QPOs originate, may be higher than the global rate. Regarding variation in chemical composition as a reason for the formation of mHz-QPOs, Keek et al. (2014) found that mHz-QPOs cannot be initiated at observed accretion rates by changing only the chemical composition and nuclear reaction rate Keek14 .
Altamirano et al. (2008) found that the frequency of mHz-QPOs in 4U 1636–53 systematically decreased before the type I X-ray burst, and then the QPOs disappeared when the burst occurred Altamirano08 . Recently, the same behavior was found in another mHz QPO source, LMXB EXO 0748–676 Mancuso19 . The frequency drift behavior of QPOs in mHz indicates that QPOs in mHz are closely related to nuclear burning on the surface of a neutron star. In addition, Linares et al. (2012) reported a smooth evolution between their Hz QPOs and X-ray bursts in IGR J17480–2446: as the accretion rate increased, the bursts gradually turned into mHz-QPOs, and vice versa Linares12 . Recently, other properties of the mHz-QPO have been investigated. Lyu et al. (2015) found that the mHz-QPO frequency does not have a significant correlation with the surface temperature of a NS in 4U 1636–53, contrary to model predictions Lyu15 .
| Set | Dates, MJD | Obs. ID | Dates UT |
|---|---|---|---|
| R1 | 50446–50503 | 10088 | Dec 29, 1996 – Feb 24, 1997 |
| R2 | 50869–51118 | 30053 Corbel & Kaaret (2000), 40028, 40031 | Feb 25, 1998 – June 15, 1999 |
| R3 | 51852–52646 | 50030, 60032 | Nov 4, 2000 – Jan 7, 2003 |
| R4 | 53606–54371 | 91027 Lyu et al. (2014), 91152 Belloni et al. (2007), 93091 | Aug 29, 2005 – Sep 28, 2007 |
| R5 | 54523–55336 | 93091 Lyu et al. (2014), 93082, 94310 Lyu et al. (2014), 94437 | Feb 27, 2008 – May 20, 2010 |
In addition, Stiele et al. (2016) studied the phase-resolved energy spectra of the mHz QPOs in 4U 1636–53 and concluded that the QPOs were not associated with modulations of the neutron star surface temperature Stiele16 . In contrast, Strohmayer et al. (2018) recently found that, in GS 1826–238, the mHz fluctuations are consistent with the change in the black-body temperature on the surface of the neutron star Strohmayer18 . To date, the question of the origin of the mHz QPO in NS remains open. Therefore, in this paper, we investigated this problem within the framework of the transition layer (TL) model in order to search for other possible interpretations.
It is commonly supposed that the X-ray spectrum of LMXBs is made of a soft thermal component because of the NS/WD surface and the accretion disk while a hard component is formed due to the Comptonization of soft thermal NS/WD and disk soft photons in a corona consisting of energetic electrons Barret (2001); Lin et al. (2007). In cataclysmic variables (CVs) with matter transfer, accretion disks (ADs) are usually too very cold ( keV) to emit X-rays Lewin & van der Klis (2006). The main X-ray source has been associated with the TL, the region between the spiraling AD and the surface of the slower rotating disk, where a most part of the gravitational energy is emitted. The physical characteristics of the TL and described in terms of the observed soft and hard X-ray spectral emission Titarchuk et al. (2014).
SS Cygni binary hosts a WD with a mass of 1.190.02 M⊙ (see Table 1), a secondary star with a mass of 0.7040.002 M⊙ Friend et al. (1990), and a K5/5 spectral type Ritter & Kolb (2003). This binary is distanced at 16612 pc Harrison et al. (2004) and is characterized by an inclination of 37 5∘ Ritter & Kolb (2003) and an orbital period oforbital rotation 6.603 hr Harrison et al. (2004). This source is one of the well studied in terms of outburst states, as it shows outburst in optical band every 50 days Mauche & Robinson (2001); Lewin & van der Klis (2006).
Lewin and van der Klis (2006) revealed a reflection component in the 4U 1636–53 spectrum during both the quiescent and active states, with a larger contribution in the active phases Done & Osborne (1997); Lewin & van der Klis (2006). Mukai et al. (2003) analyzed the spectrum in quiescence in frame of MKCFLOW model and found that the plasma temperature increases to 80 keV Mukai et al. (2003). Okada et al (2008) also analyzed the Chandra observations of SS Cygni and argued that in quiescence, the spectra are dominated by the H-like iron Kα-lines, whereas at outburst the He-like iron lines are as intense as the H-like irom lines Okada et al. (2008). As a result, they formulated a scenario for the formation of radiation in SS Cygni: the observed Kα-emission lines from O to Si originate in the transition region between the optically thick AD and the optically thin TL region, where the Keplerian motion gradually transforms into thermal motion due to hard friction. They constrained the temperature of the TL from 1.6 keV (outburst) to 4.1 keV (quiescence) using the bremss model.
A maximum temperature of the plasma 20.4 keV in quiescence and 6 keV in outburst revealed by Ishida et al. (2009) during a Suzaku observation of this source on the 2005 November in the quiescent and outburst states using the CVMEKAL model. Byckling et al. (2010) also explored these data but obtained different temperatures (10–42 keV) using the MEKAL and KCFLOW models in the quiescence. They also found iron line with energy of 6.4 keV in SS Cygni with the equivalent width of 754 eV. Xu et al. (2016) analyzed Suzaku data of SS Cygni in 2005 using the CEVMKL model and found a maximum plasma temperature 20.8 keV (in the quiescence state) and minimal plasma temperature of 5.80.3 keV (in the outburst state) Xu et al. (2016). Finally, Maiolino et al. (2020) demonstrated a presence of strong emission lines at energies of 1–1.5 keV and 6–7 keV against the Comptonization continuum and a plasma temperature variation from 5 keV to 25 keV in the outburst and the quiescence, respectively using the Chandra HETG/ACIS observation of SS Cygni using the thermalCOMPTT and Gaussian models Maiolino et al. (2020).
| Set | Satellite | Obs. ID | Start time (UT) | End time (UT) | MJD interval |
|---|---|---|---|---|---|
| S1 | Suzaku | 400006010 | 2005 Nov 2 01:12:32 | 2005 Nov 2 23:39:24 | 53676.0–53676.9 Ishida et al. (2009) |
| S2 | Suzaku | 400007010 | 2005 Nov 18 14:33:32 | 2005 Nov 19 20:45:08 | 53692.6–53692.8 Ishida et al. (2009) |
| S3 | Suzaku | 109015010 | 2014 Dec 19 06:23:57 | 2014 Dec 19 23:56:18 | 57010.2–57010.8 |
| As1 | ASCA | 30001000 | 1993 May 26 21:06:16 | 1993 May 27 18:22:46 | 49133.8–49134.6 Done & Osborne (1997) |
| As2 | ASCA | 30004000 | 1995 Nov 27 04:01:52 | 1995 Nov 27 17:50:21 | 50048.1–50048.5 Done & Osborne (1997) |
| Set | Dates, MJD | Obs. ID | Dates UT |
|---|---|---|---|
| Rs1 | 51337–51350 | 40012 balman12 | Jun 8 – 21, 1999 |
| Rs2 | 51609–51697 | 50011 balman12 | March 6 – Jun 2, 2000 |
| Rs3 | 51780–51926 | 50012 balman12 ; Maiolino et al. (2020) | Aug 24, 2000 – Jan 17, 2001 |
| Rs4 | 53267–53395 | 90007 | Sep 19, 2004 – Jan 25, 2005 |
| Rs5 | 55312–55328 | 95421 balman12 | Apr 26 – May 12, 2010 |
Recently, Kimura et al. (2021) pointed to an unusual failure of SS Cygni outburst activity that occurred in 2021 in the form of a long quiescent state with reduced luminosity Kimura et al. (2021). A similar phenomenon has already been observed earlier in Z Can-type DNes. They analyzed the source spectra with the tbabs*(reflect*cevmkl + Gaussian) model using NICER and NuStar observation. They showed that during this standstill phase the observed gradual increase in optical and X-ray emissions is due to contributions from the inner part (TL) of the accretion disk, even in such a quiescent state.
Here we develop the comparative analysis for 4U 1636–53 and SS Cygni using the RXTE, ASCA, BeppoSAX and observations. In §2 we present the list of observations used in our data analysis while in §3 we provide the details of X-ray spectral analysis. We analyze an evolution of X-ray spectral and timing properties during the state transition in §4. In §5 we present a description of the spectral models used for fitting these data. In §6 we discuss the main results of the paper. In §7 we present our final conclusions.
2 DATA SELECTION
BeppoSAX data. We used BeppoSAX (BS) data of 4U 1636–53, which were obtained on February 24–28, 1998 and February 15–17, 2000. In Table 2 (top part) we present the log of the BS observation analyzed in this paper. We analyzed the related BS spectral distributions obtained from three BS Narrow Field Instruments (NFIs): the Low Energy Concentrator Spectrometer (LECS, Parmar et al. (1997)) for 0.3 – 4 keV, the Medium Energy Concentrator Spectrometer (MECS, Boella et al. (1997)) for 1.8 – 10 keV and the Phoswich Detection System (PDS, Frontera et al. (1997)) for 15 – 60 keV. The SAXDAS data analysis software was employed in order to analyze this data set. We made this investigation where the response matrix is definitely found. Both LECS and MECS spectra were accumulated in circular regions of 8′ radius. We renormalized the LECS data using MECS as a base template. We treat normalizations as fit-free parameters and 1 for NFIs and MECS, correspondingly. We checked after that this fitting procedure and if normalizations were in a standard range for each instrument. We also re-binned the data in order to increase their significance. For example, for the LECS data the binning factor changes with energy using re-binnig template files in GRPPHA of XSPEC (see Cookbook for the BS-NFI spectral analysis). We applied a linear binning factor 2 (for which resulting bin width is 1 keV for the PDS spectra and with systematic errors 1%).
ASCA data. ASCA implemented observations of 4U 1636–53 on 1993—1995 and 1998, and also SS Cygni on 1993 and 1995. In Tables 2 and 4 (bottom parts) we summarized the start time, end time, and the MJD interval for 4U 1636–53 and SS Cygni, respectively, indicated by orange triangles in top of Figs. 1 and 2. The ASCA instrumentation and data analysis was described in Tanaka et al. (1994). The ASCA data were screened using the ftool ascascreen and the standard screening criteria. The spectrum for both sources were extracted using spatial regions with a diameter of 4′ centered on the nominal position of the source. The background was extracted using source-free regions. We implemented the data re-binning in order to improve statistics (¿ 20 counts per spectral bin) and also applied the -technique. The 0.6 – 10 keV and 0.8 – 10 keV ranges were used to fit the solid and gas imaging spectrometer data, respectively. The background was extracted using source-free regions.
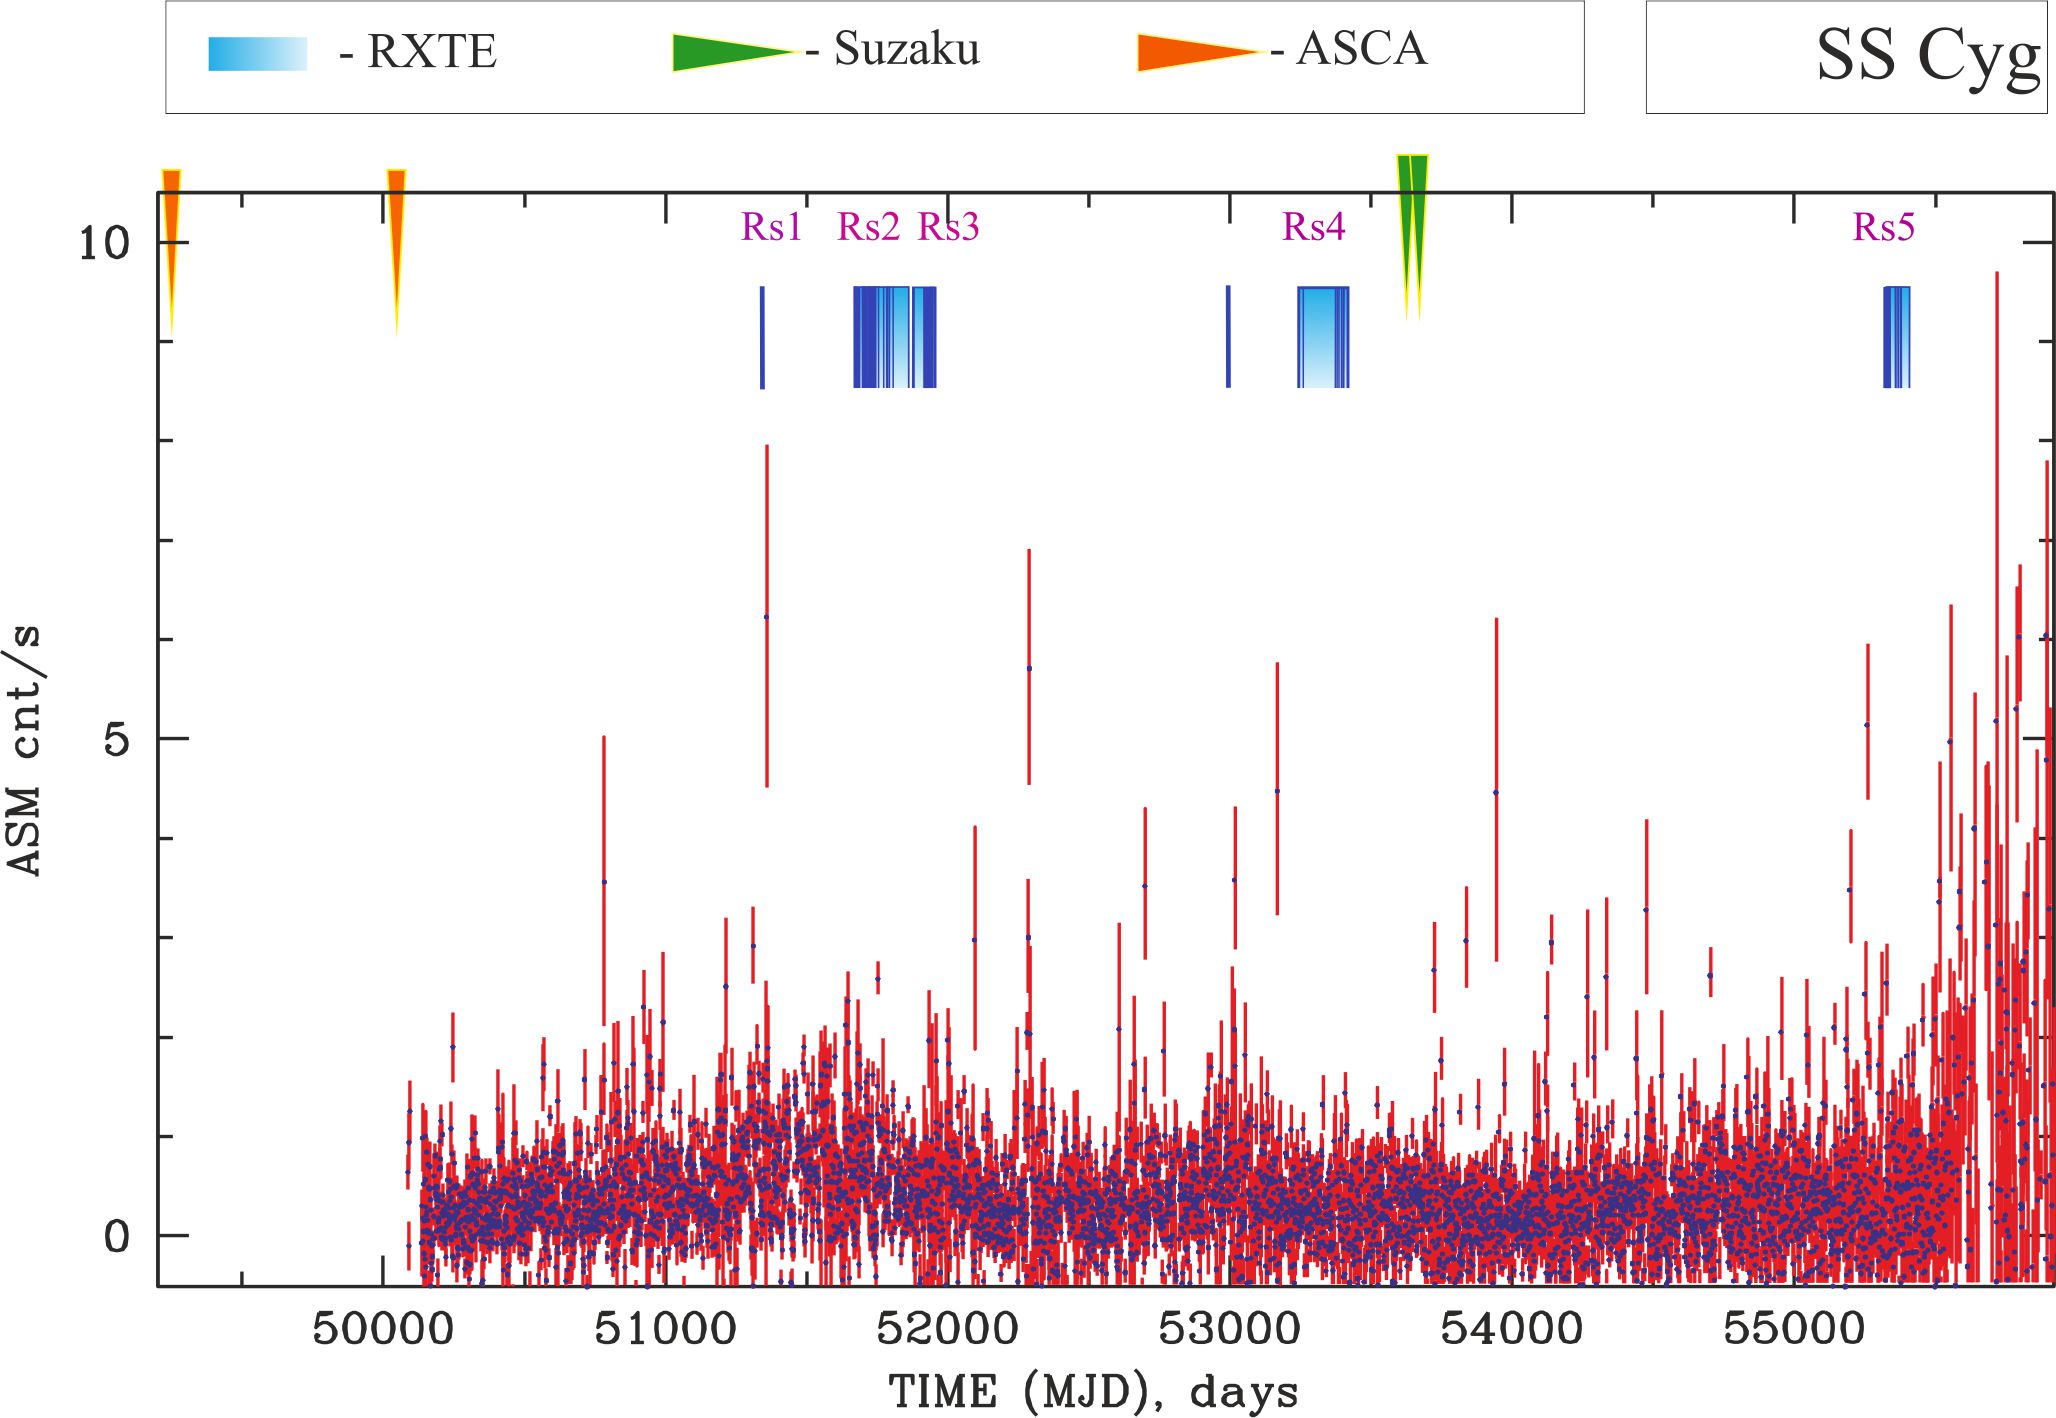
Suzaku data. Suzaku observed SS Cygni in the quiescence (November 2, 2005 and November 27, 2014) and at the outburst (November 18, 2005). Table 4 (top part) shows the start–end times, and the MJD interval duration, indicated by green triangles in top of Fig. 2. Mitsuda et al. (2007) and Koyama et al. (2007) present a description of the Suzaku instrumentation Mitsuda et al. (2007); Koyama07 . We used observations of SS Cygni, performed by a focal X-ray CCD camera of the X-ray Imaging Spectrometer [XIS, 0.3–12 keV energy range] and processed them with the Suzaku data processing pipeline. The HEASOFT software package of version 6.25 and the Suzaku Data Reduction Guide111http://heasarc.gsfc.nasa.gov/docs/suzaku/analysis/ were applied in order to make the data reduction. The source spectra were extracted using spatial regions within the 3.51′-radius circle centered on the nominal position of SS Cygni [, , J2000.0, while a background was extracted from source-free regions (the outer 4′–6′ annulus) for each XIS module separately. The spectral data re-binning was implemented in order to get at least 20 cnts per a spectral bin and to use the -statistic applying XSPEC v12.10.1 for our spectral fitting. Thus, we made the 0.3 – 10 keV spectral fits for the XISs. it is worth noting that we did not use energies around 1.75 and 2.23 keV related to the XIS spectral problems around Si and Au edges.
RXTE data. We analyzed the data of 4U 1636–53 (1996 – 2010) and SS Cygni (1999 – 2001, 2004 – 2005 and 2010) obtained with RXTE (see Bradt et al 1993). Observations made at different luminosity states of these sources were selected to study the characteristics of their outbursts. In summary, we analyzed the RXTE sample of 4U 1636–53 data collected over 14 years for five intervals (marked with blue boxes in Fig. 1 and listed in Table 3). Similarly, the RXTE sample for SS Cygni accumulated over 11 years with five intervals shown in blue boxes in Fig. 2 and listed in Table 5) was analyzed. RXTE/PCA spectra have been extracted and analyzed, wherein PCA Standard 2 mode data, collected in the 3 – 50 keV energy range, using the most recent release of PCA response calibration (ftool pcarmf v11.1). The relevant deadtime corrections to energy spectra have been applied. We used the data which are available through the GSFC public archive222http://heasarc.gsfc.nasa.gov. In Table 3 we listed the groups of RXTE observations of 4U 1636–53, which cover the source evolution from faint to bright phase events. Available RXTE data contains three bright phase set () and two faint phase set ( – ). In Table 5 we listed the groups of RXTE observations of SS Cygni, which cover the source evolution from faint to bright (phase) events. Thus, available RXTE data includes four faint phase set ( – ) and one bright phase set (). The PCA energy spectra were modeled using XSPEC astrophysical fitting software. Systematic error of 0.5% have been applied to the analyzed spectra.
We have also used public 4U 1636–53 and SS Cygni data from the All-Sky Monitor (ASM) on-board RXTE. The 4U 1636–53 light curve [1–12 keV ] shows long-term variability of mean soft flux during two six year intervals (Fig. 1). We use definitions of the fainter and brighter on luminosity phases to relate these phases to the source luminosity and we demonstrate that during the bright/faint phase transition of 4U 1636–53 the CompTB Normalization changes from 0.05 to 0.4 where is the soft photon luminosity in units of erg/s and in units of 10 kpc is distance to the source. As mentioned above, the RXTE/ASM light curve of 4U 1636–53 demonstrates long-term evolution of mean flux level: bright (15 cts/s, 1997 – 2000) and faint (6 cts/s, 2001 – 2010, see Fig. 1). This variability is consistent with two states of sources: the (hard) and (soft) states Hasinger & van der Klis (1989). In turn, the light curve of SS Cygni [1–12 keV] exhibits high X-ray variability at the level of 1–2 cnt/s with short-time bursts up to 7 cnt/s during 1996 – 2009. For comparison, the object flared every 50 days from 12m to 8m in the optical range Lewin & van der Klis (2006); Mauche & Robinson (2001). In 2010, the object demonstrates an increase in the average level up to 3–4 cnt/s and a more prolonged burst with an amplitude of 7–8 cnt/s (Fig. 2).
3 RESULTS
3.1 Color-Color Diagrams
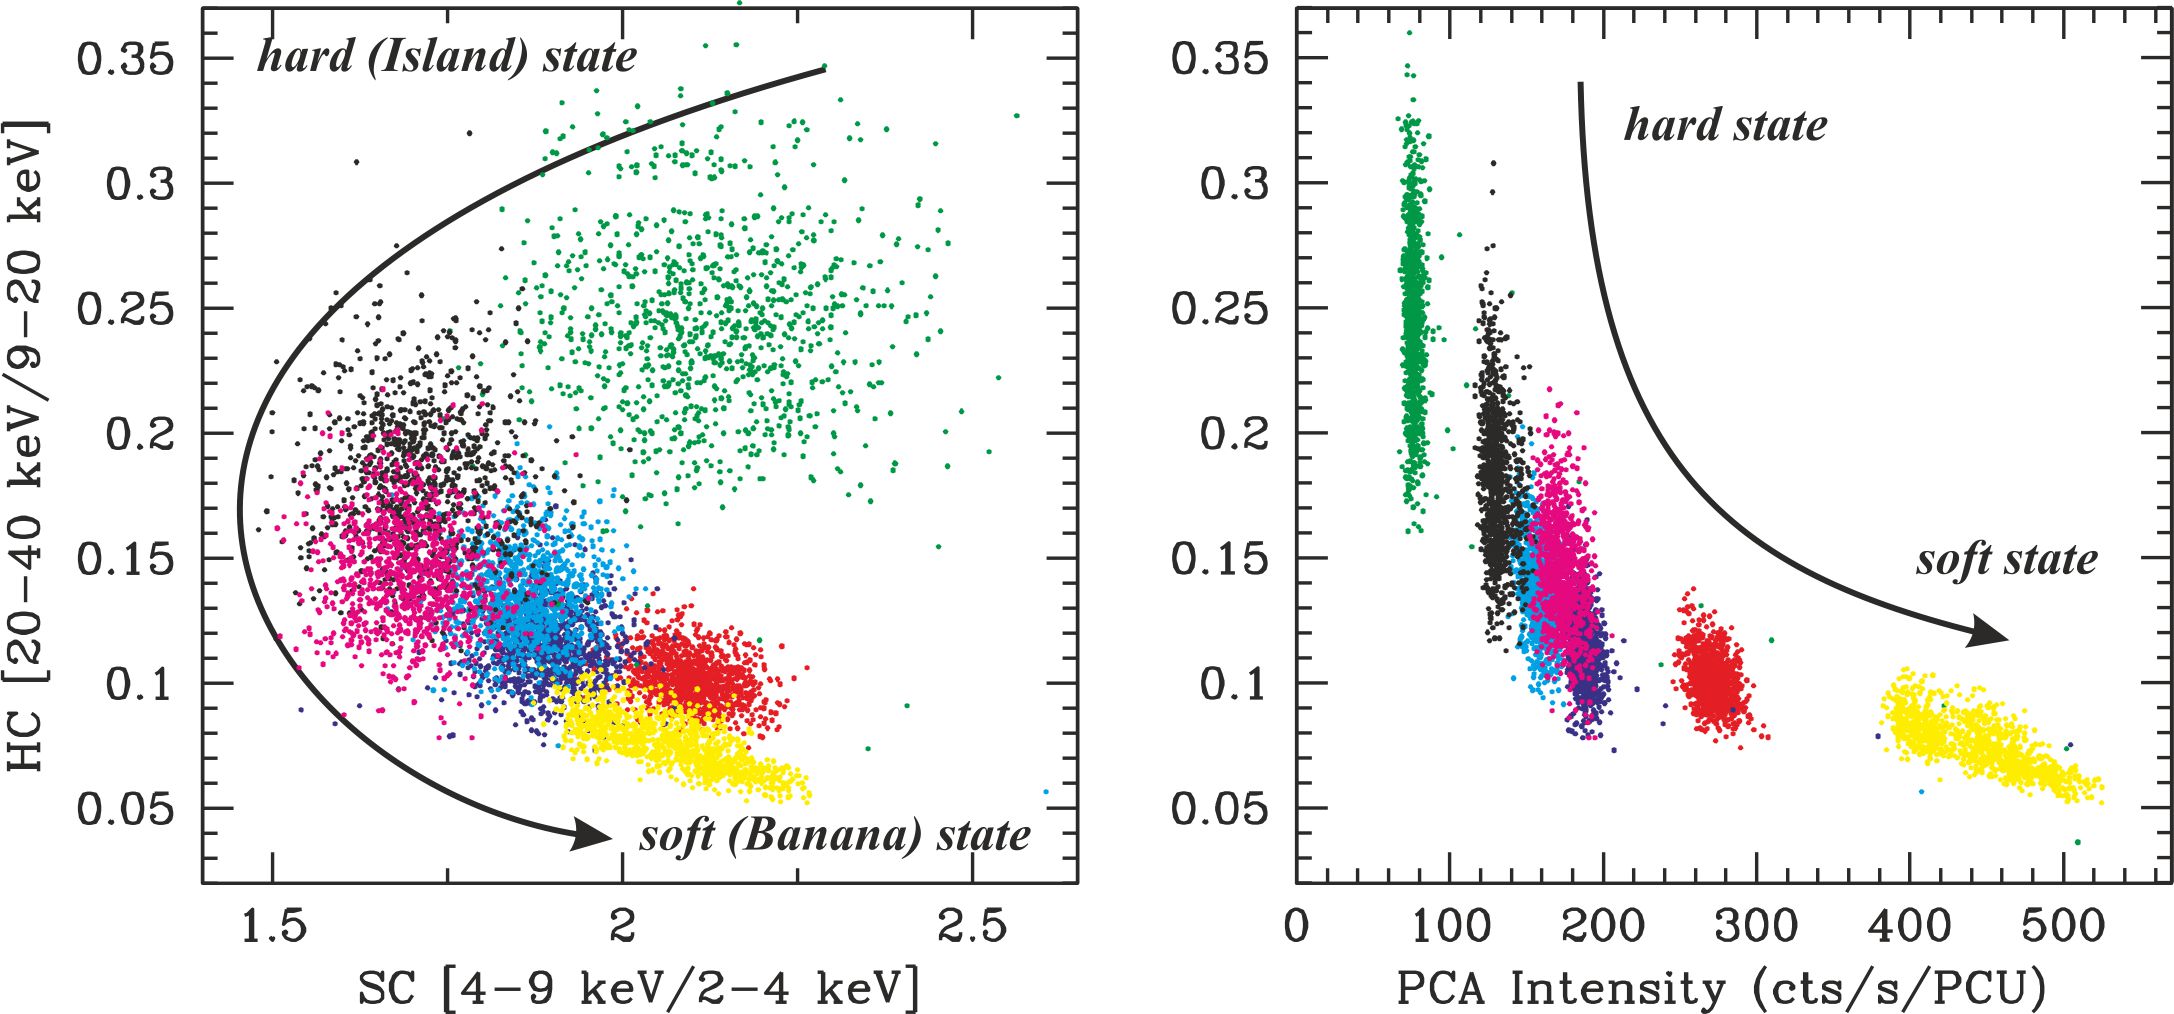
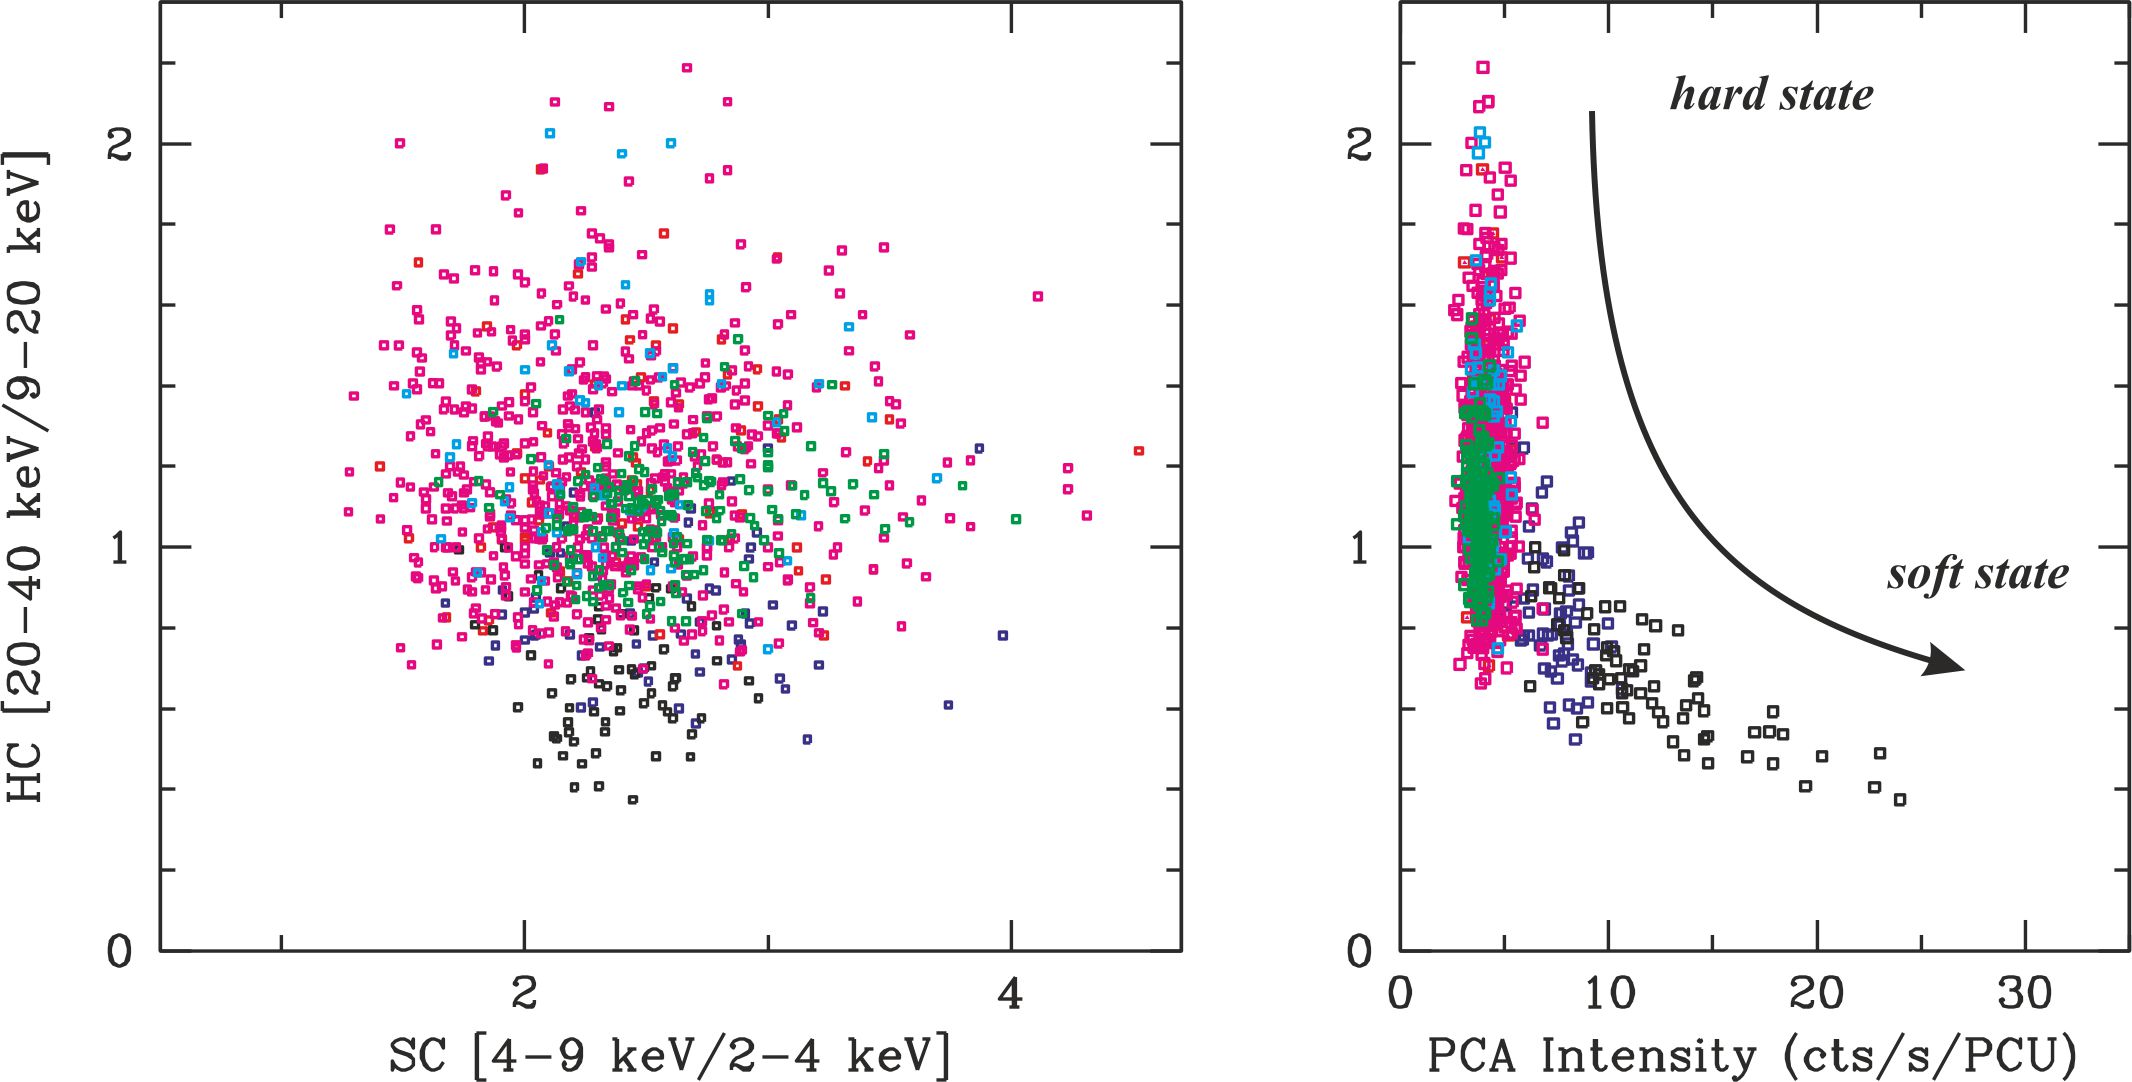
Before performing spectral analysis, we studied the properties of 4U 1636–53 and SS Cygni in terms of color diagrams to trace the spectral state of the source as a first approximation. Namely, we investigate the light curves with 16s time binning of Standard-2 data for four energy channels 5 – 10, 11 – 24, 25 – 54 and 55 – 107. These channel ranges correspond to the 1.94 – 4.05 keV, 4.05 – 9.03 keV, 9.03 – 20.3 keV and 20.3 – 39.99 keV energy ranges, respectively. We constructed color-color diagrams (CCDs) of the sources using these energy-dependent light curves and defined the soft color (SC) as the ratio of count rates in the 4.05 – 9.03 keV and 1.94 – 4.05 keV energy bands, while the hard color (HC) is calculated as the ratio of count rates in the 20.3 – 39.99 keV and 9.03 – 20.3 keV energy ranges.
The obtained CCDs and hardness intensity diagrams (HIDs) are shown in Fig. 3 for 4U 1636–53 and in Fig. 4 for SS Cygni. From these figures we can see that the HID tracks of these two sources display a smooth and monotonic function, denoting to the similar, for these two objects, physical mechanism of the hard/soft flux transition during a source evolution. In contrast to HIDs, CCD tracks for these two sources are fair different. So, for 4U 1636–53 the ranges of CS (1.5–2.5) and HC (0.05–0.35) are smaller than CS (1.2–5) and HC (0.4–2.2) for SS Cygni. In addition, CCDs for 4U 1636–53 present a family of tracks, which are elongated and characterized by a clear “”-like shape. Although for SS Cygni it resembles circular scattering and are characterized by a“”-like shape. The typical error bars for the colors and intensities are negligible.
3.2 Spectral Analysis
Initially, for both sources we have tried a model consisting of an absorbed thermal Comptonization component (CompTB) [the CompTB is a XSPEC contributed model333http://heasarc.gsfc.nasa.gov/docs/software/lheasoft—/xanadu/xspec/models/comptb.html, F08 ], but this model gave a poor description of data. Significant positive residuals around 6.5 keV suggest a presence of the fluorescent iron emission line. An addition of a Gaussian line component at 6.4 keV considerably improves the fitting quality of both sources. Therefore, we include in the model a simple Gaussian component, which parameters are a centroid line energy , the width of the line and normalization, to fit the data in the 6 – 8 keV energy range. Furthermore, an addition of a thermal component (bbody) to the spectra of 4U 1636–53 further improves fit quality and provides a statistically acceptable . At the first time the fluorescent iron emission line in 4U 1636–53 was detected by Lyu et al. (2014) using Suzaku, XMM-Newton, and RXTE. Lyu et al. (2014) successfully described this emission feature with the Gaussian line model. They used a model consisting of thermal components [representing the accretion disk by Diskbb Mitsuda et al. (1984); Makishima et al. (1986), the NS surface and boundary layer by Bbody; for both of the models dominating energy release are around 1 keV], and a Comptonized component [representing a hot corona by Nthcomp Zdziarski et al. (1996); Zycki et al. (1999)], and either a Gaussian or a relativistic line component of the model of an iron emission line at 6.5 keV.
We also use the interstellar absorption with a column density in the model. It should be noted that we fixed certain parameters of the CompTB component: (low energy index of the seed photon spectrum) and because we neglect an efficiency of the bulk inflow effect versus the thermal Comptonization for NS 4U 1636–53 and WD SS Cygni. We apply a value of hydrogen column cm-2 (for 4U 1636–53, Fiocchi et al. (2006)) and cm-2 (for SS Cygni, Madejski et al. (1999)). As a result, in our spectral data analysis for 4U 1636–53 we use a model which consists a sum of a Comptonization component (CompTB), a soft blackbody component of the temperature, and the Gaussian line component. We also modeled the SS Cygni spectra using a combination of CompTB component and iron line components. The CompTB spectral component has the following parameters: the seed photon temperature, , the energy index of the Comptonization spectrum (), the electron temperature , a Comptonization fraction [, which is the relative weight of the Comptonization component and normalization of the seed photon spectrum, .
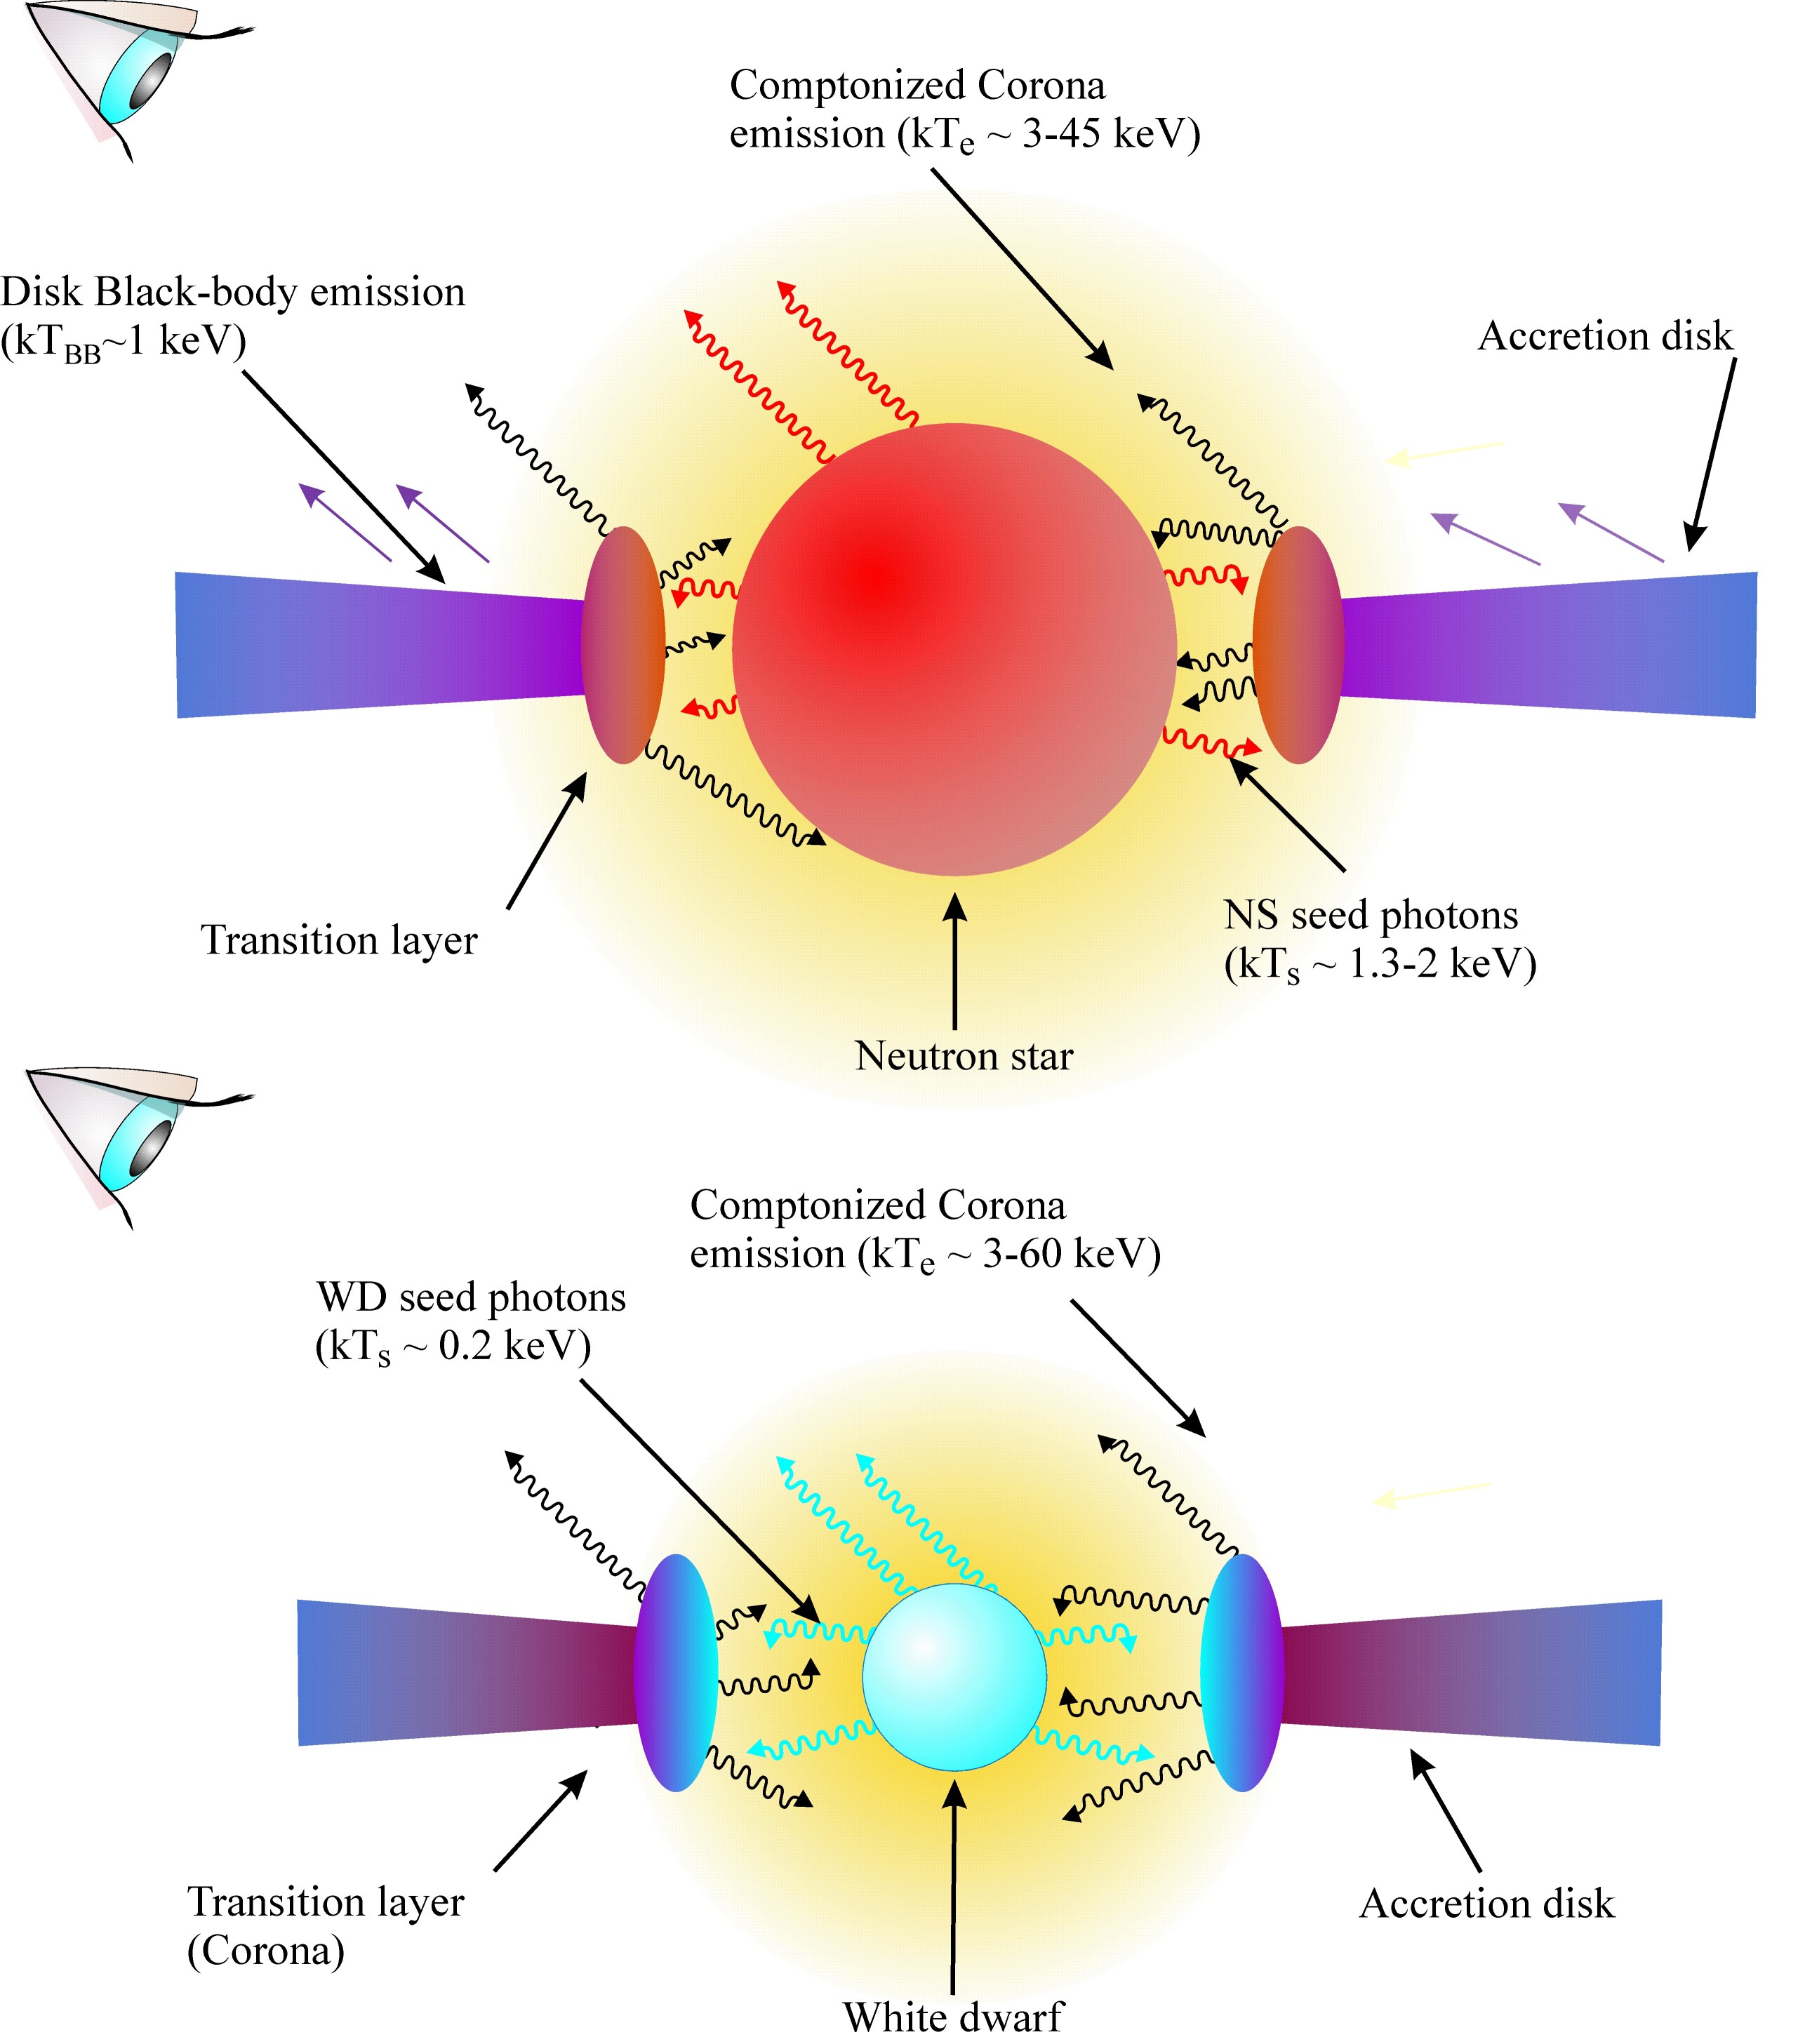
In Figure 5 we illustrate our spectral model as a basic model for fitting the X-ray spectral data for 4U 1636–53 (top, NS case) and SS Cygni (bottom, WD case). We assume that accretion onto a NS/WD takes place when the material passing through the two main regions: a geometrically thin accretion disk [the standard Shakura-Sunyaev disk, see Shakura & Sunyaev (1973)] and the TL, where a NS/WD and disk soft photons are upscattered off hot electrons (see, Titarchuk et al.1998). In our picture, the emergent thermal Comptonization spectrum is formed in the TL, where thermal disk seed photons and soft photons from the NS/WD are up-scattered off the relatively hot plasma. Some fraction of these seed soft photons can be also seen directly (blue arrows for a NS case). Recall that the accretion disk around WD (or CVs) is usually too cold ( keV) and does not emit X-rays. Red and black photon trajectories shown in Fig. 5 correspond to soft (seed) and hard (up-scattered) photons, respectively. Furthermore, the NS surface is capable of scattering/reflecting the TL photons. In contrast to a NS, the WD surface in nonmagnetic CVs will no scatter/reflect TL photons but observed them. It is colder than that in a NS case.
3.2.1 4U 1636–53
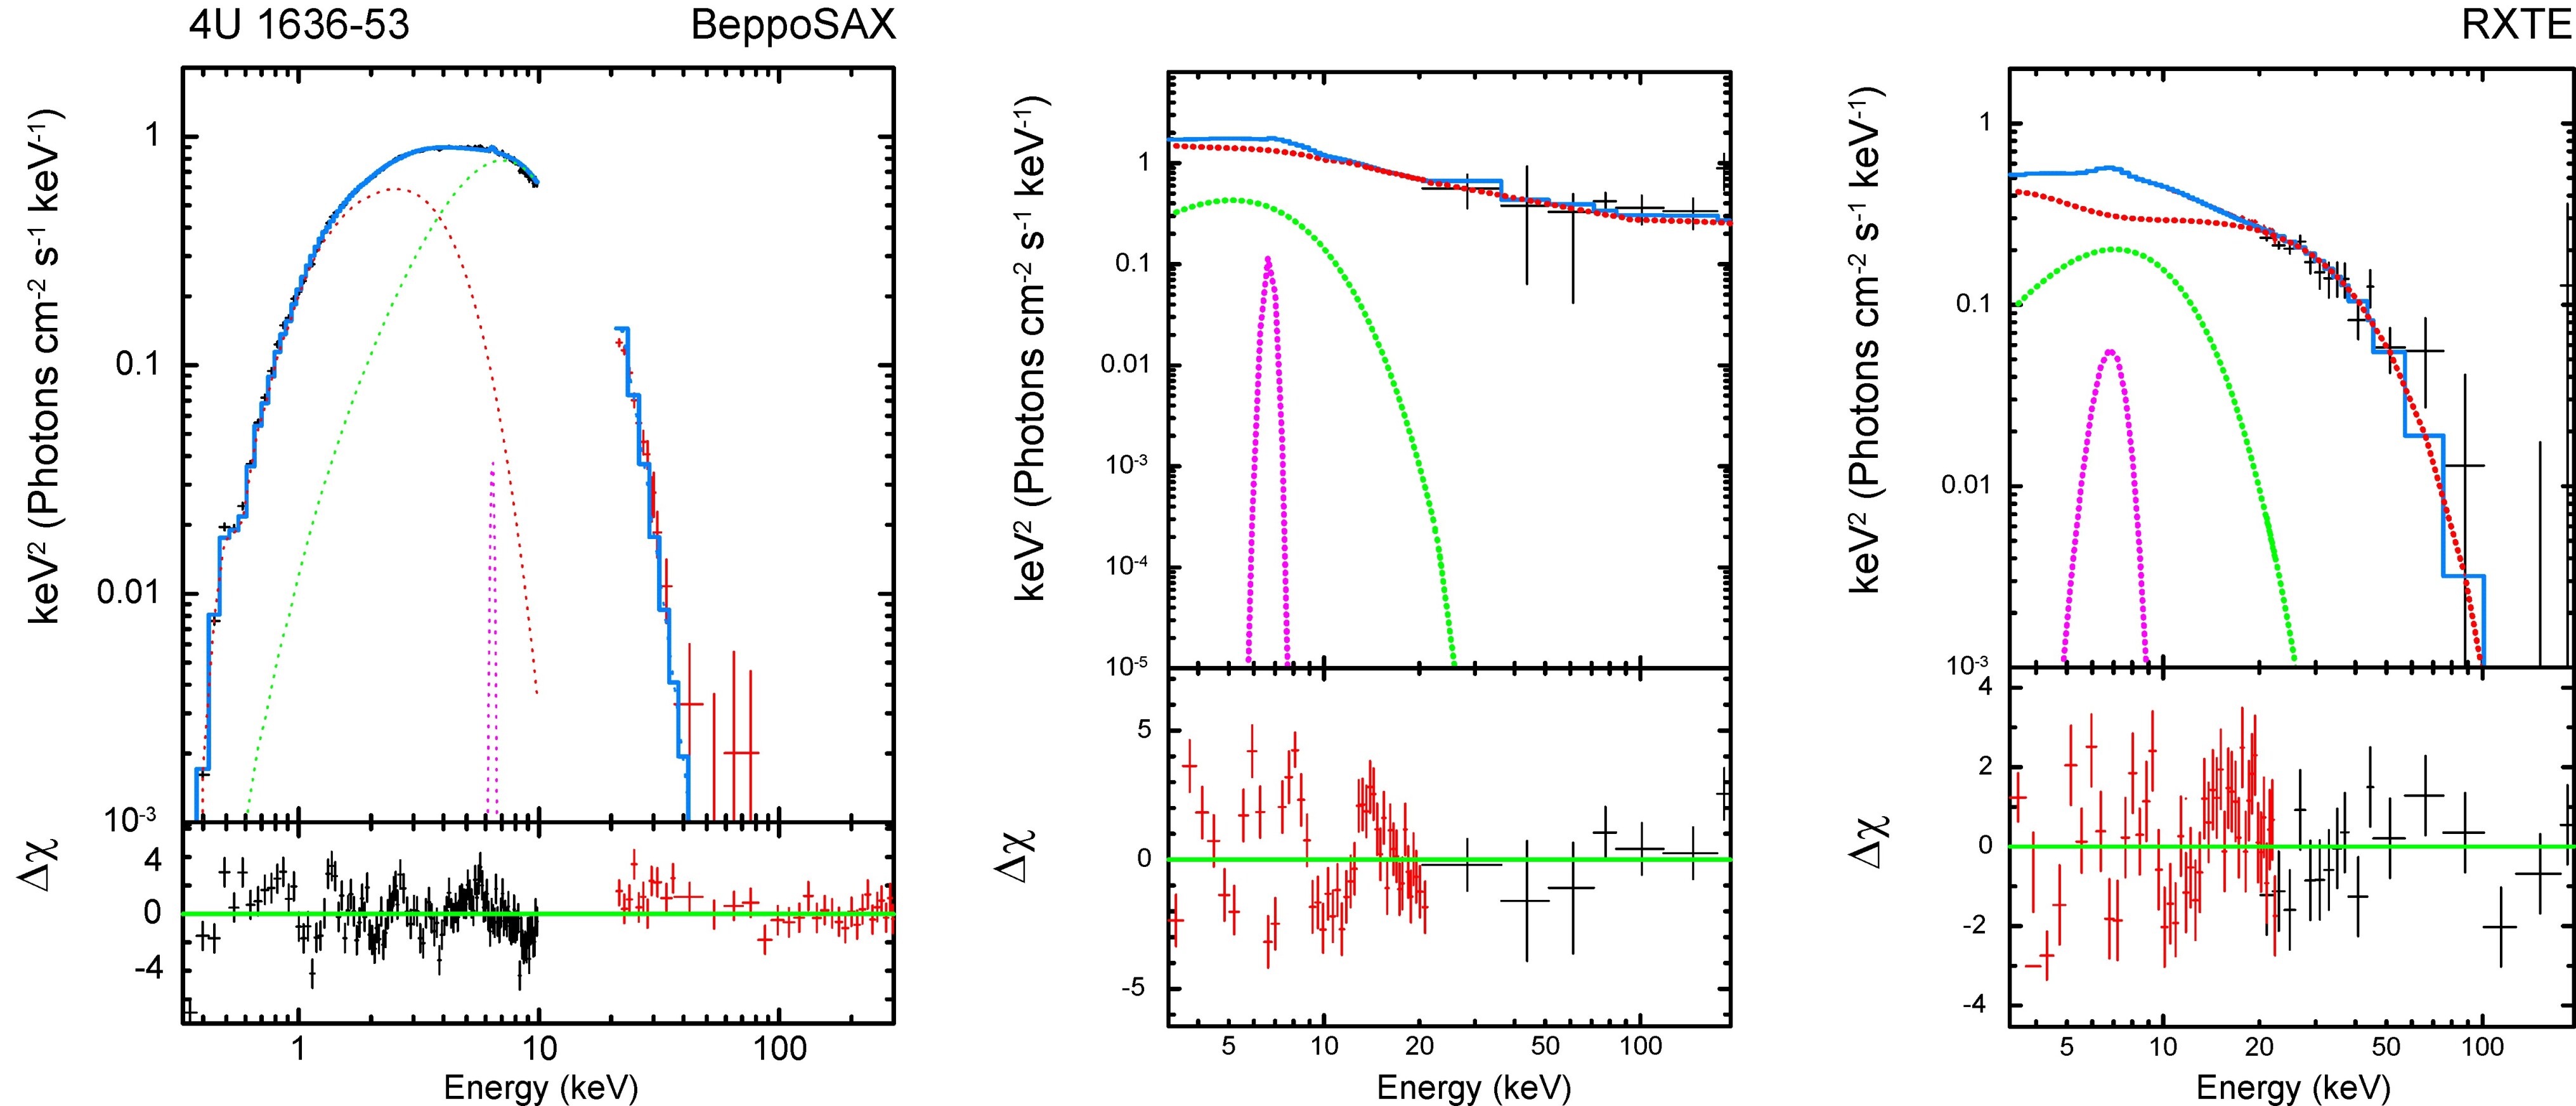
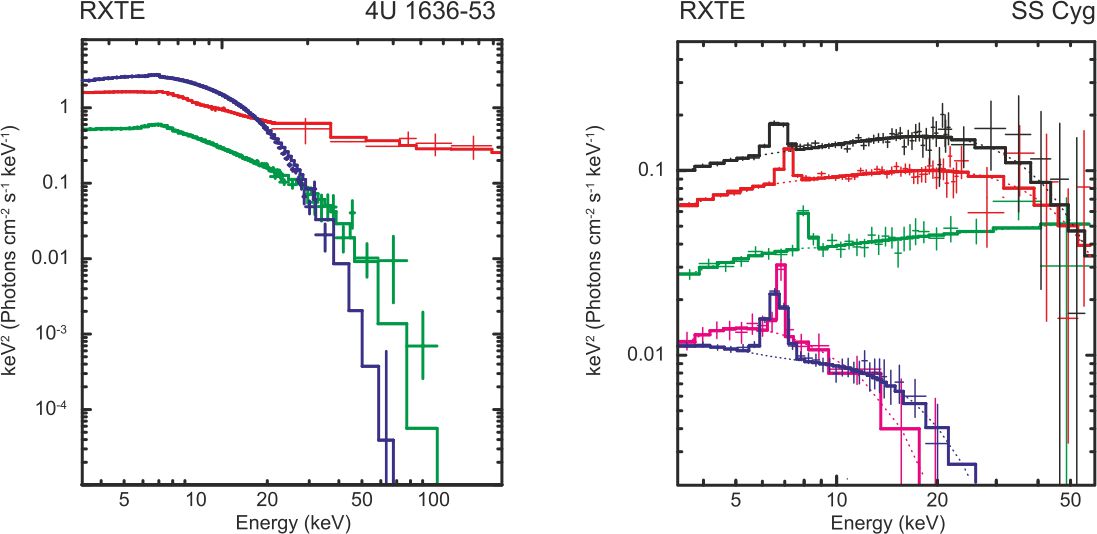
We show examples of X-ray spectra of 4U 1636–53 in Fig. 6 using SAX (left panel) and RXTE (central and right panels) data, respectively. Spectral analysis of BeppoSAX and RXTE observations indicates that X-ray spectra of 4U 1636–53 can be described by a model with a Comptonization component represented by the CompTB model.
| Set | , | , | N | Eline, | ||||||
|---|---|---|---|---|---|---|---|---|---|---|
| keV | keV | keV | keV | (dof) | ||||||
| B1 | 0.71(8) | 39.7(2) | 1.99(1) | 1.00(4) | 2.36(8) | 0.04(1) | 5.35(1) | 6.4(2) | 0.14(1) | 1.08(219) |
| B2 | 0.70(6) | 26.7(1) | 1.97(1) | 1.00(4) | 2.54(9) | 0.66(2) | 12.59(1) | 6.5(2) | 0.06(1) | 1.09(168) |
| B3 | 0.72(9) | 20.5(1) | 1.80(1) | 0.98(3) | 3.21(7) | 0.48(7) | 5.81(3) | 6.4(1) | 0.02(1) | 0.83(363) |
† The spectral model is tbabs*(Blackbody + CompTB + Gaussian), normalization parameters of blackbdody and CompTB components are in units of , where is the soft photon luminosity in units of 1035; is the distance to the source in units of 10 kpc and Gaussian component is in units of total photons cm-2s-1 in line.
On the top of Figure 6 we demonstrate the best-fit BeppoSAX spectrum of 4U 1636–53 using our model for BeppoSAX observation (id=20836001) carried out on 15–17 February, 2000. The data are presented by crosses and the best-fit spectral model, tbabs * (Blackbody + CompTB + Gaussian) by green line. The model components are shown by blue, red and crimson lines for the blackbdody, CompTB and Gaussian components, respectively. On the bottom we show vs photon energy in keV. From Fig. 6 we can see that the low-energy end of BeppoSAX spectrum the 4U 1636–53 the source emission is modified by photoelectric absorption. The best-fit model parameters are =1.980.03, =3.680.05 keV and =6.40.1 keV (reduced =0.83 for 363 d.o.f) (see more details in Table 6). In particular, we find that an addition of the soft thermal component of the temperature 0.60.7 keV significantly improves the fit quality of the BeppoSAX spectra. For the BeppoSAX data (see Tables 6) we find that the spectral index is of 1.030.04 (or the corresponding photon index is 2.030.04). The color temperature of the CompTB component changes from 1.2 keV to 1.7 keV, which is consistent with that using the BeppoSAX data set of our analysis (see Table 6) and previous NS studies by Balman et al. (2001) and Chenevez et al. (2006). We should also emphasize that the temperature of the seed photons of the CompTB component usually increases up to 1.7 keV in the fainter phases and generally decreases to 1.2 keV in the bright phases.
| Set | , | , | N | Eline, | ||||||
|---|---|---|---|---|---|---|---|---|---|---|
| keV | keV | keV | keV | (dof) | ||||||
| A1 | 0.70(3) | 25.3(3) | 1.81(2) | 1.00(4) | 3.0(2) | 1.00††† | 5.14(2) | 6.4(3) | 0.21(1) | 1.08(647) |
| A2 | 0.75(7) | 22.8(1) | 1.83(1) | 1.01(5) | 2.5(1) | 0.42(4) | 5.54(1) | 6.4(2) | 0.14(3) | 1.13(769) |
| A3 | 0.69(8) | 26.8(1) | 1.81(1) | 1.00(3) | 2.4(1) | 0.43(1) | 6.18(2) | 6.5(2) | 0.01(1) | 1.17(794) |
| A4 | 0.71(4) | 29.8(3) | 1.79(2) | 0.96(4) | 2.3(1) | 0.43(2) | 6.62(4) | 6.4(1) | 0.02(1) | 1.14(638) |
| A5 | 0.70(5) | 35.8(2) | 1.84(1) | 1.00(5) | 2.4(1) | 0.38(2) | 6.14(2) | 6.5(2) | 0.05(1) | 1.15(801) |
| A6 | 0.75(8) | 20.9(1) | 1.81(1) | 1.02(4) | 2.5(1) | 0.37(2) | 3.91(1) | 6.4(1) | 0.01(1) | 1.10(790) |
| A7 | 0.72(4) | 23.2(1) | 1.80(1) | 1.00(3) | 2.6(1) | 0.41(3) | 5.56(3) | 6.5(2) | 0.04(1) | 1.00(647) |
| A8 | 0.71(8) | 16.5(1) | 1.90(2) | 0.99(5) | 2.7(1) | 0.54(1) | 4.71(1) | 6.4(1) | 0.01(1) | 1.02(739) |
| A9 | 0.70(3) | 14.3(1) | 1.74(1) | 1.01(4) | 2.5(8) | 0.35(1) | 3.34(1) | 6.4(2) | 0.01(1) | 1.11(771) |
† The spectral model is tbabs*(Blackbody + CompTB + Gaussian), normalization parameters of Blackbody and CompTB components are in units of , where is the soft photon luminosity in units of 1035; is the distance to the source in units of 10 kpc and Gaussian component is in units of total photons cm-2s-1 in line; ††† when parameter , it is fixed to a value 1.0 (see comments in the text).
However, the main part of ASCA observations (A1–A8) fells on the initial observation interval, up to 1996 (MJD 50000), when ASM/RXTE did not perform X-ray monitoring. The spectral analysis for these ASCA observations of 4U 1636–53 indicates a typical active state of the source with an increased X-ray luminosity in average. During these observations, the plasma temperature turns out to be low 2–4 keV, the seed photon temperature varied slightly at the level of 1.2–1.7 keV, but the spectral index showed quasi-constancy at the 1 level (see Table 7).
Furthermore, the spectral model tbabs * (Bbody + CompTB + Gaussian), tested on BeppoSAX and ASCA observations, was applied to the RXTE data of 4U1636–53. Unfortunately RXTE detectors cannot provide well calibrated spectra below 3 keV while the broad energy band of BeppoSAX telescopes allows us to determine the parameters of Blackbody components at low energies. Thus in order to fit the RXTE data we have to fix the temperature of blackbdody component at a value of 0.6 keV obtained as an upper limit in our analyze of the BeppoSAX data. The best-fit spectral parameters using RXTE observations are presented in Fig. 7. In particular, we find that electron temperature of the CompTB component varies from 2.3 to 48 keV, while the photon index is almost constant () for all observations. It is worth noting that the width of Gaussian component does not vary much and it is in the range of 0.5 – 0.8 keV.
In Figure 6 we show examples of the typical photon spectra [ spectral diagrams] of 4U 1636–53 during the fainter phase (94437-01-01-010, right panel) and the brighter phases 10088-01-09-02, central panel) detected by RXTE on MJD 55084.6 and 50503.2, respectively. The adopted spectral model shows a very good fidelity throughout all data sets used in our analysis. Red, green and purple lines stand for the CompTB, Blackbody, and Gaussian components, respectively. While the resulting spectrum is shown by a blue line. In the bottom panels we indicate residuals. The best-fit model parameters are (for soft state) =1.990.02, =2.940.01 keV and =6.530.06 keV; and (for hard state) =2.000.04, =12.540.09 keV and =6.350.04 keV, respectively (Fig. 7). A value of reduced , where is a number of degree of freedom, is less or about 1.0 for most observations.
We find some differences between our values of the best-fit model parameters and those in the literature. In particular, the photon index , estimated by Lyu et al. (2014) for observation IDs=91027-01-01-000, 93091-01-01-000, 93091-01-02-000, 94310-01-02-03, 94310-01-02-04, 94310-01-02-05, 94310-01-02-02, 94310-01-03-000, 94310-01-03-00, and 94310-01-04-00, varies from 1.8 to 2.7, while we got a more modest variation from 1.8 to 2.2. This discrepancy in the index may be the result of using somewhat different spectral models by us and by Lyu et al. (2014). They used the wabs*(Diskbb + Bbody + NthComp + Gaussian) spectral model and applied it to a slightly different set of observations by RXTE. It is also possible that such a discrepancy is associated with a slightly different energy range for fitting the combined RXTE and XMM-Newton spectra used by Lyu et al. (2014).
Such comparisons indicate that it is important to take into account the contribution of radiation from a NS at low energies in the spectrum. Using broadband observations of BeppoSAX and ASCA, we can well determine all the parameters of our spectral model, while thanks to extensive observations of 4U 1636–53 with RXTE, we can explore the long-term general behavior of the source during the spectral transitions in the 3 – 50 keV energy range.
3.2.2 SS Cygni
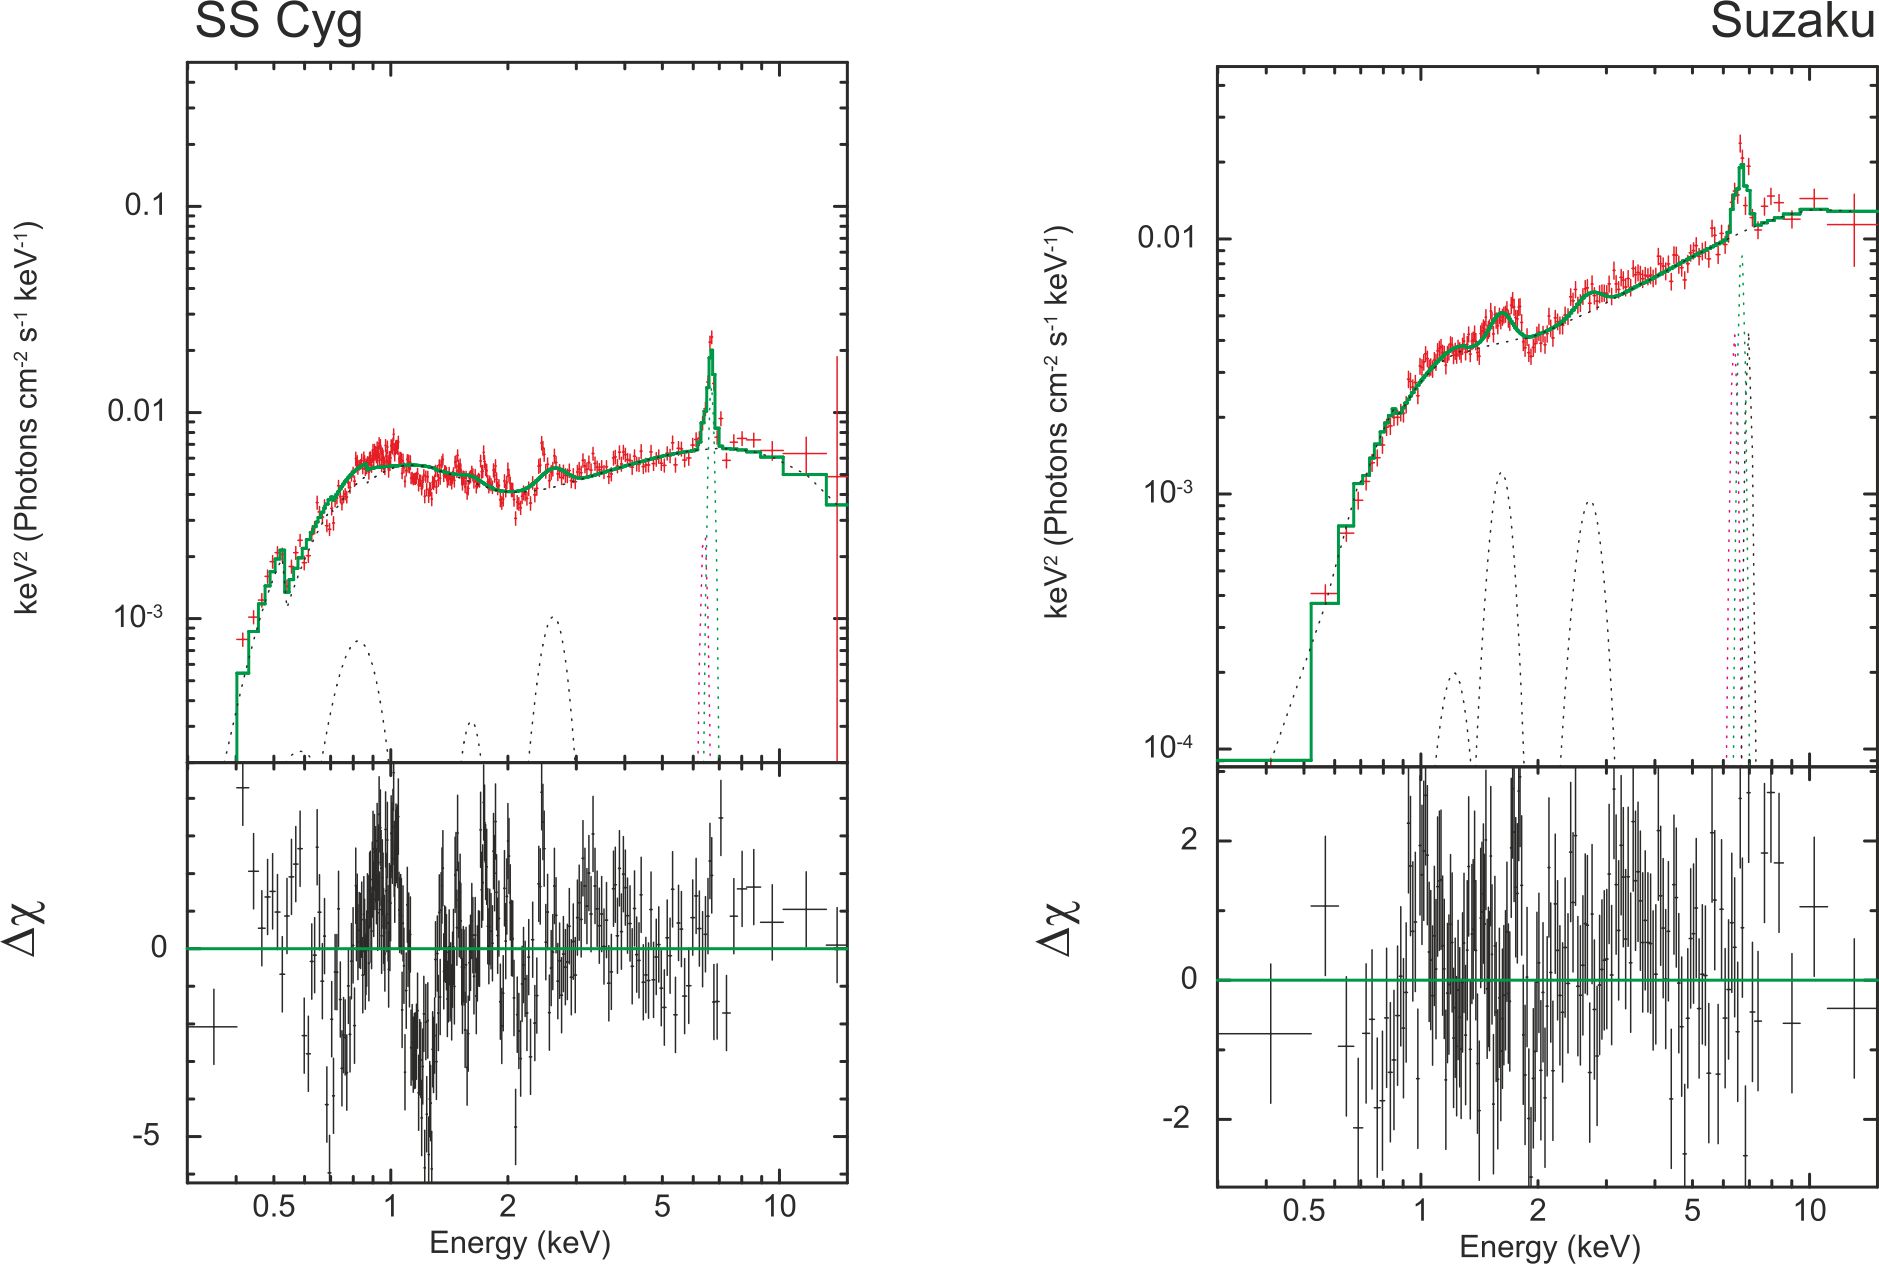
Suzaku observations of SS Cygni made it possible to study the source at the quiescence ( and , see Table 4) and in the outburst (). We have shown that the X-ray source continuum can be described by the Comptonization model with the maximum plasma temperature at quiescence 20 keV, which is much higher than in the outburst 6 keV. The degree of illumination is 1 at the quiescence. We consider the standard optically thin TL as the most plausible picture of the plasma configuration at the quiescence. The degree of illumination in the outburst state and the broad line of iron 6.4 keV indicate that the reflection in the outburst state comes from the accretion disk and the equatorial accretion “belt”. The broad line at 6.4 keV indicates that the optically thin thermal plasma is distributed over the accretion disk like a corona.
In Figure 9, we present the spectral components of SS Cygni in the 0.3–20 keV band: the Comptonized thermal plasma model provides a description of the hard X-ray emission (red), and the reflection of the hard X-ray emission by an accretion disk and/or the surface while the disk gives the observed iron fluorescence lines Kα and hump in a continuum (green; Done & Osborne (1997); Ishida et al. (2009)). It is clearly seen that the energy range of 6.4–7.0 keV also contains other lines associated with neutral, He-like, and H-like Kα Fe lines. We found a number of positive (emission) excesses in the spectrum, and in order to better describe the spectrum, we added a number of additional lines. In this approach, we found lines at energies of 1.02, 1.85, 2.8, 6.39, 6.67, and 6.97 keV, which are easily associated with Ne X, Si XIII, S XV, Fe I–XXII, Fe XXV, and Fe XXVI Kα lines, respectively.
We also analyze archived ASCA X-ray data from SS Cygni both at rest and in outburst using Comptonization model for continuum and Gaussian profiles for line emission. The best-fit model parameters of the model are given in Table 8. The difference between the obtained TL and WD surface temperatures indicates that the only reflector is the surface of the inner part (TL) of the disk, and not the white dwarf. The degree of illumination of TL 1 in the outburst also more closely matches the hard X-ray emission that forms the corona above the surface of the WD, and not just the equatorial “belt”. We detect a partially ionized absorption in the ASCA outburst spectrum, which is likely the X-ray signature of the outflowing wind. The ASCA data also allow a detailed study of SS Cygni at the quiescence when the source spectrum becomes harder. The outburst spectrum, on the other hand, is much softer. Although the outburst spectrum of SS Cygni is much softer than the quiescence spectrum, the total luminosity of the X-ray component is the same in both cases, indicating the importance of optically thin plasma emission even it the outburst. We note that the Suzaku and ASCA observations of SS Cygni make it possible to resolve many lines and thus, take into account the complex pattern of reflection in SS Cygni.
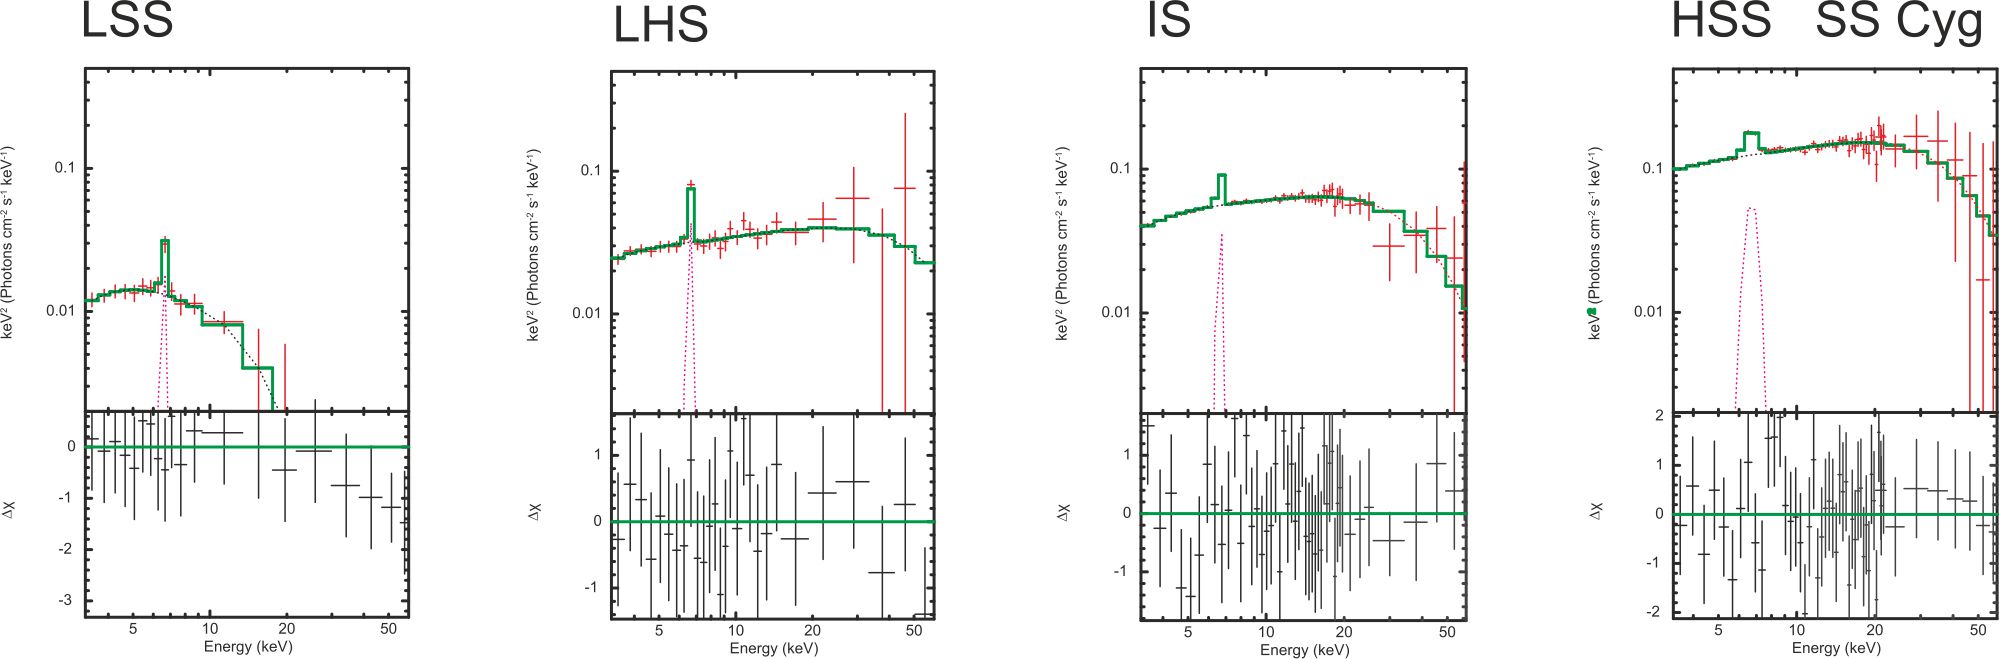
Figure 10 presents examples of the typical spectral diagram of SS Cygni during the low-soft state (LSS, left panel), the low-hard state (LHS, central left panel), the intermediate state (IS, central right panel) and the high-soft state (HSS, right panel) events. The best-fit RXTE spectra (top panels) in the model with (bottom panels) for the LSS [95421-01-01-05 observation, =0.93 for 54 dof], LHS [95421-01-03-06, =0.94 for 54 dof], IS [90007-01-05-00, =0.98 for 54 dof], and HSS [40012-01-15-00, =0.86 for 54 dof]. The best-fit model parameters are =1.850.08, =2.400.06 keV and =6.60.2 keV (for LSS) ; =1.850.07, =11.00.4 keV and =6.60.1 keV (for LHS); =1.850.09, =7.60.6 keV and =6.640.3 keV (for IS); and =1.80.1, =7.90.2 keV and =6.670.06 keV (for HSS), respectively. Green and violet lines stand CompTB and Gaussian components, respectively.
| ObsID | S1 | S2 | S3 | As1 | As2 | Line transition | |
|---|---|---|---|---|---|---|---|
| Model | Parameter | identification | |||||
| CompTB | , keV | 0.20(7) | 0.23(1) | 0.20(7) | 0.21(7) | 0.23(2) | |
| 0.75(9) | 0.80(2) | 0.8(1) | 0.76(5) | 0.77(2) | |||
| 0.13(5) | 0.22(4) | 0.5(1) | 0.2(1) | 0.78(3) | |||
| , keV | 15(2) | 3.9(4) | 4.3(1) | 32(1) | 6.8(1) | ||
| N | 4.3(6) | 3.7(1) | 1.6(2) | 3.19(7) | 1.24(8) | ||
| Gauss1 | El1, keV | 6.94(8) | 6.95(4) | 6.91(8) | 6.9(1) | 6.95(9) | Fe XXVII |
| 0.31(7) | 0.32(2) | 0.3(6) | 0.3(1) | 0.3(1) | |||
| Gauss2 | El2, keV | 6.69(4) | 6.67(6) | 6.68(5) | 6.67(9) | 6.67(2) | Fe XXVI |
| 0.22(6) | 0.23(4) | 0.21(7) | 0.2(1) | 0.20(5) | |||
| Gauss3 | El3, keV | 6.39(7) | 6.41(9) | 6.40(5) | 6.46(8) | 6.4(2) | Fe I |
| 0.27(5) | 0.28(5) | 0.26(3) | 0.25(4) | 0.2(1) | |||
| Gauss4 | El4, keV | 2.8(1) | 2.80(5) | 2.82(3) | 2.8(1) | 2.80(9) | S XVI |
| 0.19(7) | 0.20(7) | 0.18(2) | 0.17(9) | 0.16(5) | |||
| Gauss5 | El5, keV | 1.82(9) | 1.8(1) | 1.83(4) | 1.8(1) | 1.83(8) | Si XIII |
| 1–1 | |||||||
| 0.21(5) | 0.22(9) | 0.20(5) | 0.2(1) | 0.21(9) | |||
| Gauss6 | El6, keV | 1.07(8) | 1.05(6) | 1.03(9) | 1.0(1) | 1.06(7) | Ne X 1–2/Fe XVII |
| 2–24 | |||||||
| 0.14(4) | 0.15(4) | 0.13(2) | 0.12(4) | 0.11(3) | |||
| (dof) | 0.86(464) | 0.98(1271) | 0.96(981) | 0.89(244) | 0.96(189) |
† The spectral model is tbabs*(CompTB + Gaussian1 + Gaussian2 + Gaussian3 + Gaussian4 + Gaussian5 + Gaussian6), normalization parameter of CompTB component is in units of , where is the soft photon luminosity in units of 1035; is the distance to the source in units of 10 kpc and Gaussian components are in units of total photons cm-2s-1 in line.
Five representative spectral diagram of SS Cygni during the LSS, LHS, IS and HSS events are presented in Fig. 11. Data are taken from RXTE observations 95421-01-01-05 (cyan, LSS), 4012-01-05-00 (blue, LSS), 95421-01-03-05 (green, LHS), 50011-01-69-00 (red, IS), and 40012-01-15-00 (black, HSS).
Although RXTE data do not have this capability in terms of line resolution for 4U1636–35 and SS Cygni, they cover a larger time interval and allow us to study the long-term evolution of source properties and make the complete picture of which is shown in the next section.
3.3 Overall pattern of X-ray properties versus transient behavior
3.3.1 Evolution of X-ray spectral properties during transitions in 4U 1636–53
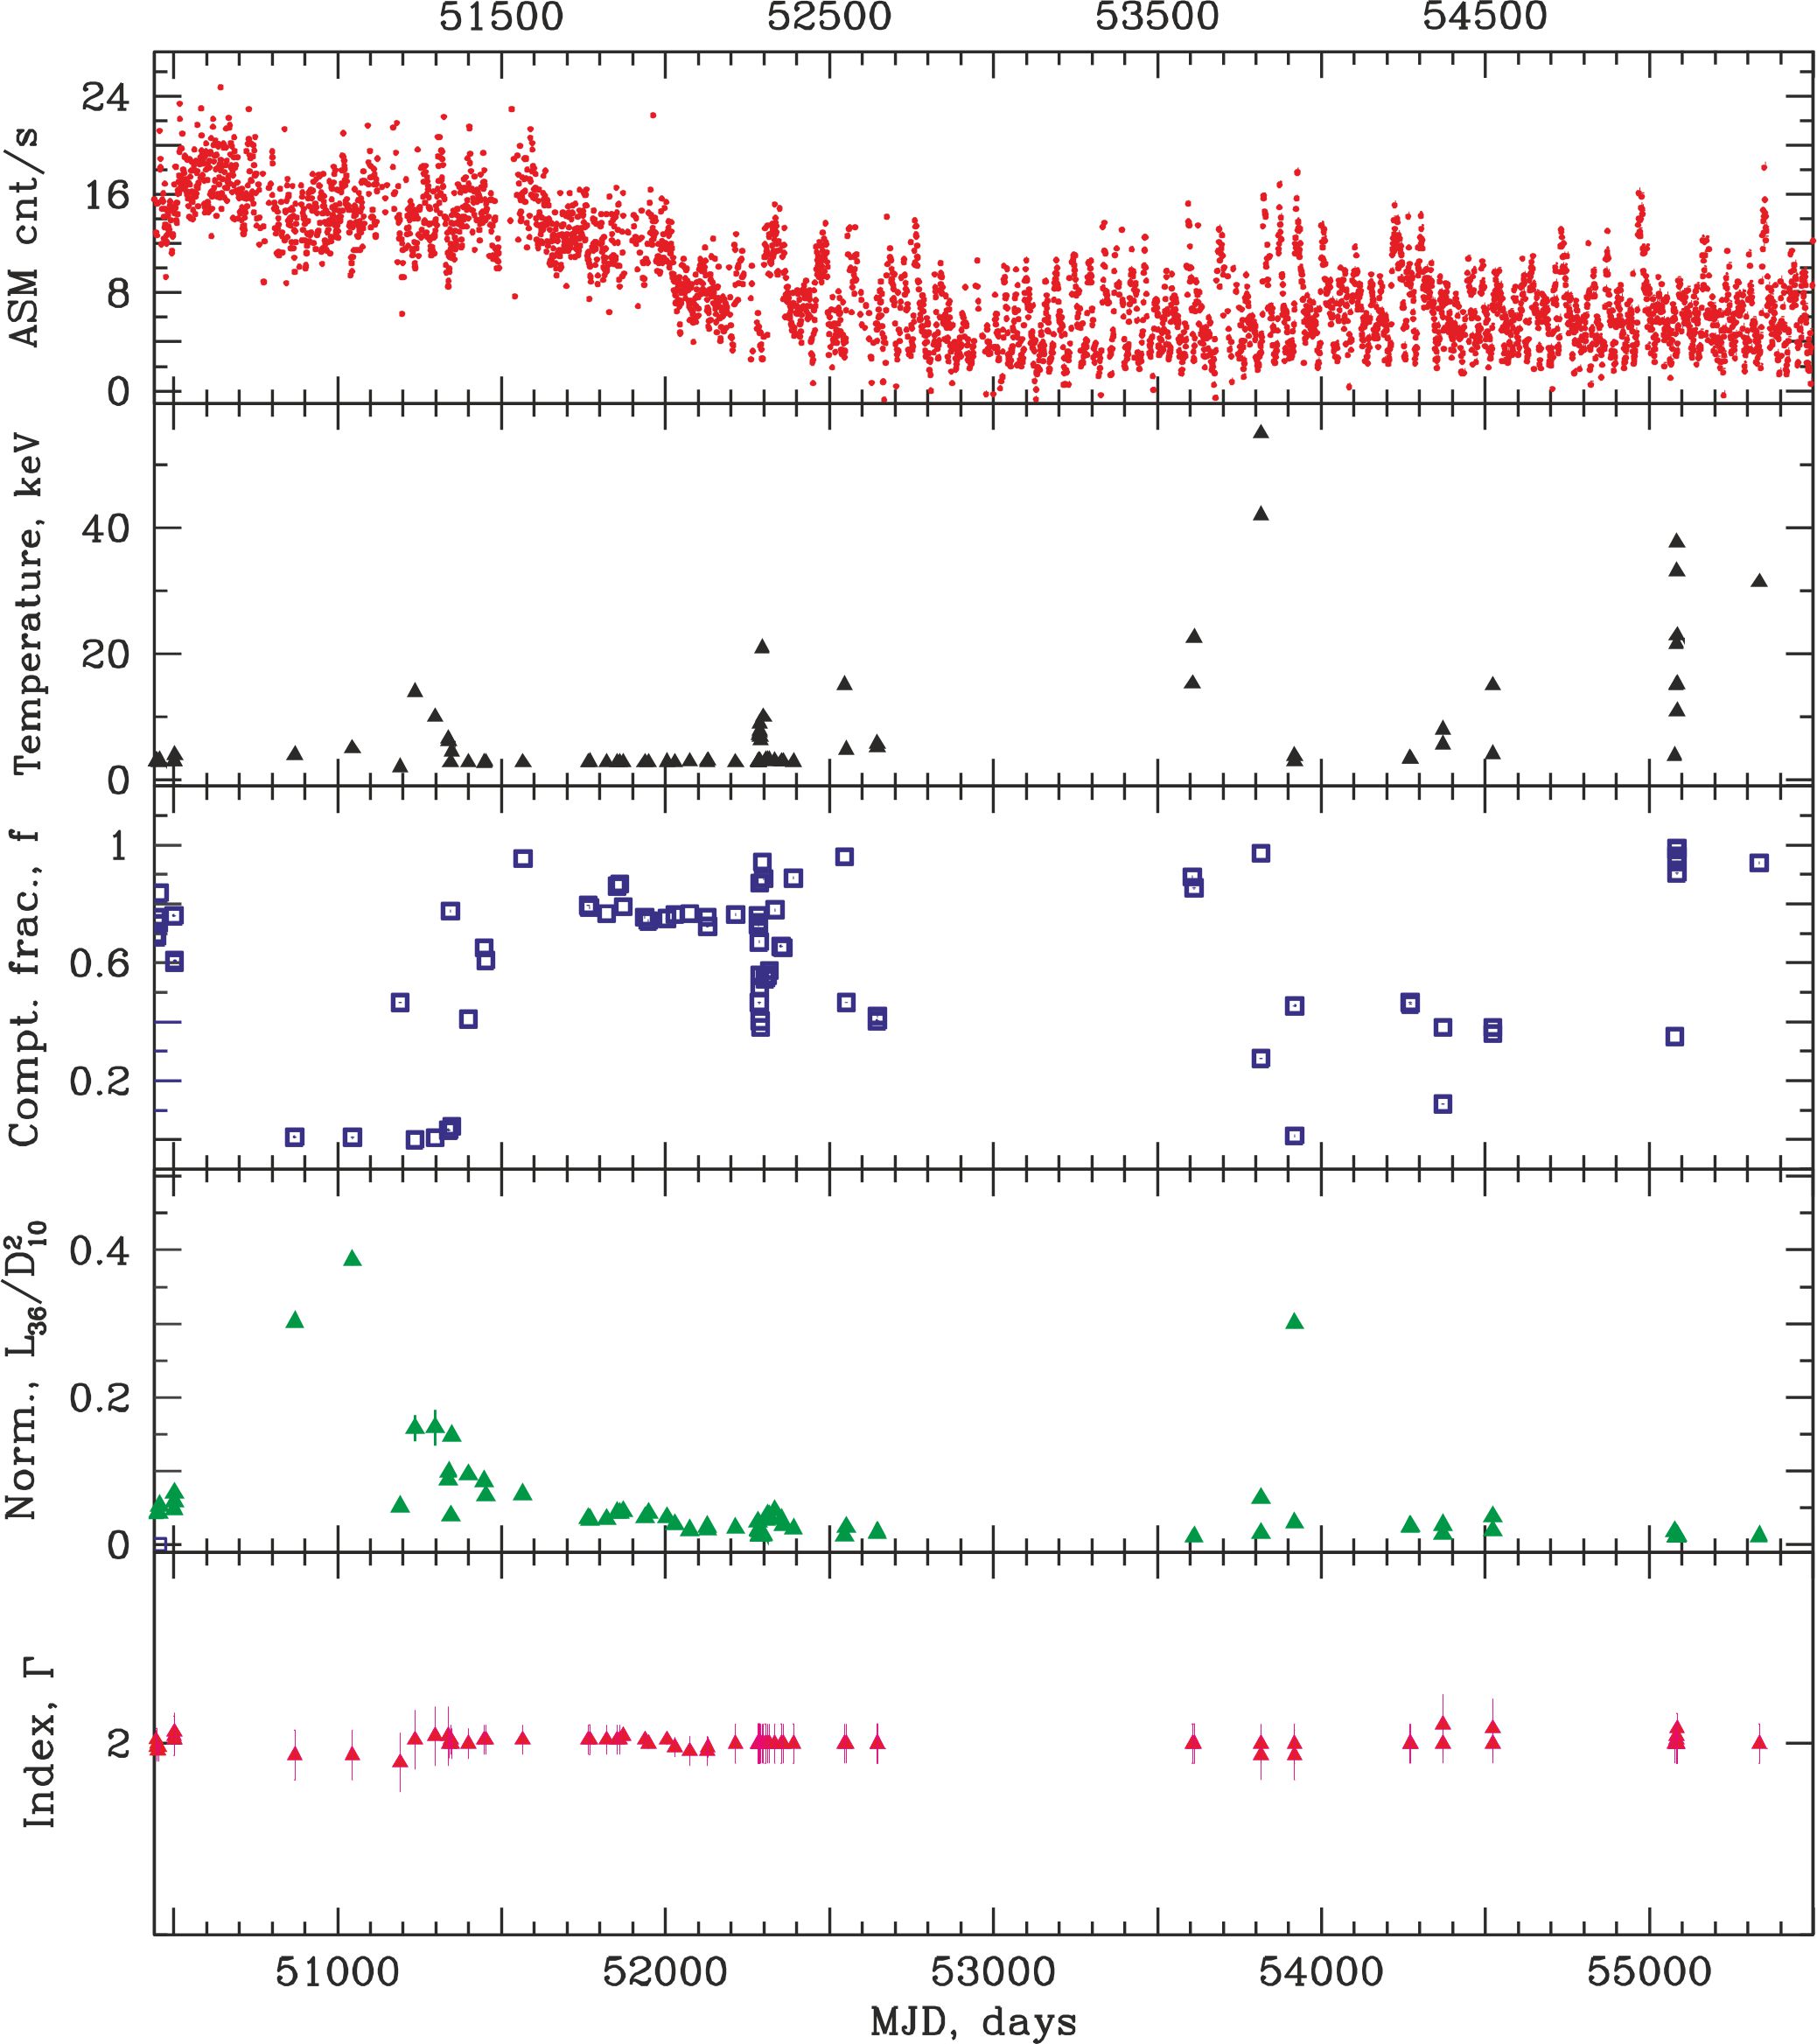
As was mentioned above, at time scales longer thah one minute, 4U 1636–53 exhibits two kinds of variability, slow and mild. The former one (slow) has a time scale of order of a few years. This slow variability is seen in the faint and bright phases which are related to low (200 – 2010) and high (1996 – 2000) luminosities, respectively. On the other hand the mild variability has a time scale of order of days and modulation depth is typically 20% in the 3 – 10 keV flux. The ASM (2 – 12 keV) mean flux correlates with the CompTB normalization () and tends to anti-correlate with the electron plasma temperature of the Compton cloud, (Fig. 7). Such mild variability is detected for both, the faint and bright phases for 4U 1636–53. It should be noted that the CompTB normalization, changes larger in the bright state than that during the faint state.
One can relate slow and mild variabilities of 4U 1636–53 in order to demonstrate slow and mild changes of the mass accretion rate, respectively. The slow variability by factor five has been seen in the 1996 – 2010 observations by ASM/RXTE. We found that the X-ray spectra of 4U 1636–53 over the bright and faint phases are quite stable. The faint/bright phase transitions (see Fig. 7) are characterized by the spectra with almost constant photon index about 2. We have also established common characteristics of the rise-decay spectral transition of 4U 1636–53 based on their spectral parameter evolution of X-ray emission in the energy range from 3 to 50 keV using RXTE/PCA data. It is important to emphasize that normalization of the thermal component is a factor of 2 higher in the bright phase than that in the faint phase, although the photon indices for each of these spectra only vary in the range from 1.9 to 2.1 and are concentrated around =2 (see Fig. 8).
A number of X-ray flaring episodes of 4U 1636–53 has been detected with RXTE during 1996 – 2010 ( sets) with a good rise-decay coverage. We have searched for common spectral and timing features which can be revealed during these spectral transition episodes. We present the combined results of the spectral analysis of these observations using our spectral model, tbabs*(Blackbody + CompTB + Gaussian). in RXTE/ASM count rate is shown on the top panel of Figure 7. Further, from the top to the bottom, we show a change of the transition layer electron temperature . One can clearly see the low amplitude spectral transition on time scales of 1 – 2 days from the bright phase to the faint phase at MJD 51570/51552 while the electron temperature, only varies from 2.3/2.5 keV to 20/40 keV during this transition, respectively.
Normalization of the CompTB (green points) is shown in the next panel of Fig. 7. In particular, one can see from this figure how the CompTB normalization correlates with the variations of ASM count rate and the model flux in 3–10 keV energy band. The Comptonization fraction, varies from 0.1 to 0.9 as seen next panel (blue points) while the index slightly varies with time around 2 (see Fig. 7). Note that in most cases the soft disk radiation of 4U 1636–53 is subjected to reprocessing in a Compton cloud and only some fraction of disk emission component () is directly seen by the Earth observer. The energy spectrum of 4U 1636–53 during almost all states is dominated by a Comptonized component while the direct disk emission is always weak and detectable in the flaring episodes only (see Fig. 7)
It is worth noting here that in a BH the spectral transition related to a change of the photon index (see e.g. ST09). However, there is no a one-to-one correspondence between and cutoff (or efold) energy . Titarchuk & Shaposhnikov (2010) demonstrate using RXTE data for BH binary XTE J1550–564 that decreases when increases from 1.4 to until reaches 2.2 and then increases Titarchuk & Shaposhnikov (2010). Thus for a BH the main parameter used for the spectral transition definition is a variable photon index, which monotonically increases when the source goes into the bright phase. In contrast, for NS and WD binaries, this approach does not work and another parameter is needed to track source outbursts, for example, normalization or electron temperature of the Compton cloud (TL) during the transition from a weak phase to a bright one.
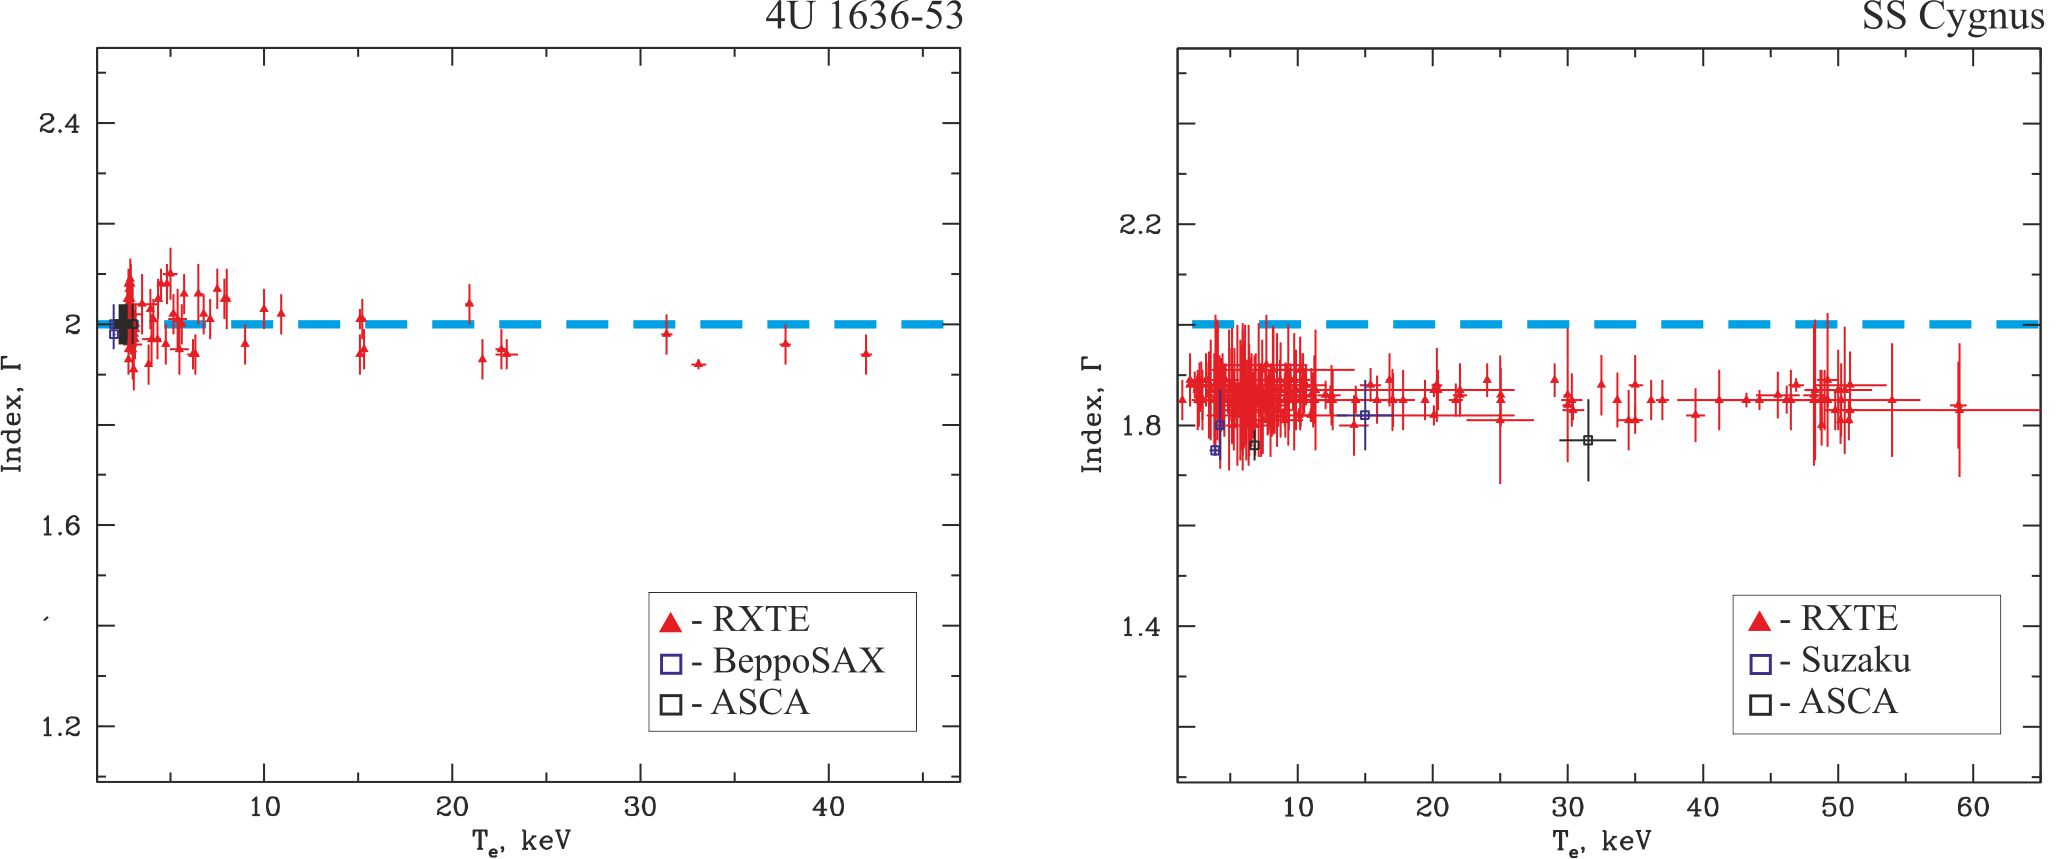
We define the state transition in a NS source in terms of the CompTB normalization. In the NS case we relate the faint phase to a low normalization value while the bright phase relate to a high normalization value. The CompTB normalization and electron temperature are a directly measurable quantity (Fig. 7). In Figure 8 (left panel) we demonstrate dependence of the photon index on the electron temperature using these best-fit parameters for 4U 1636–53 obtained with analysis of BeppoSAX, ASCA and RXTE data. Furthermore, from Figure 7 one can clear see a monotonic behavior of vs when the electron temperature, decreases and the soft flux increases.
3.3.2 Evolution of X-ray spectral properties during transitions in SS Cygni
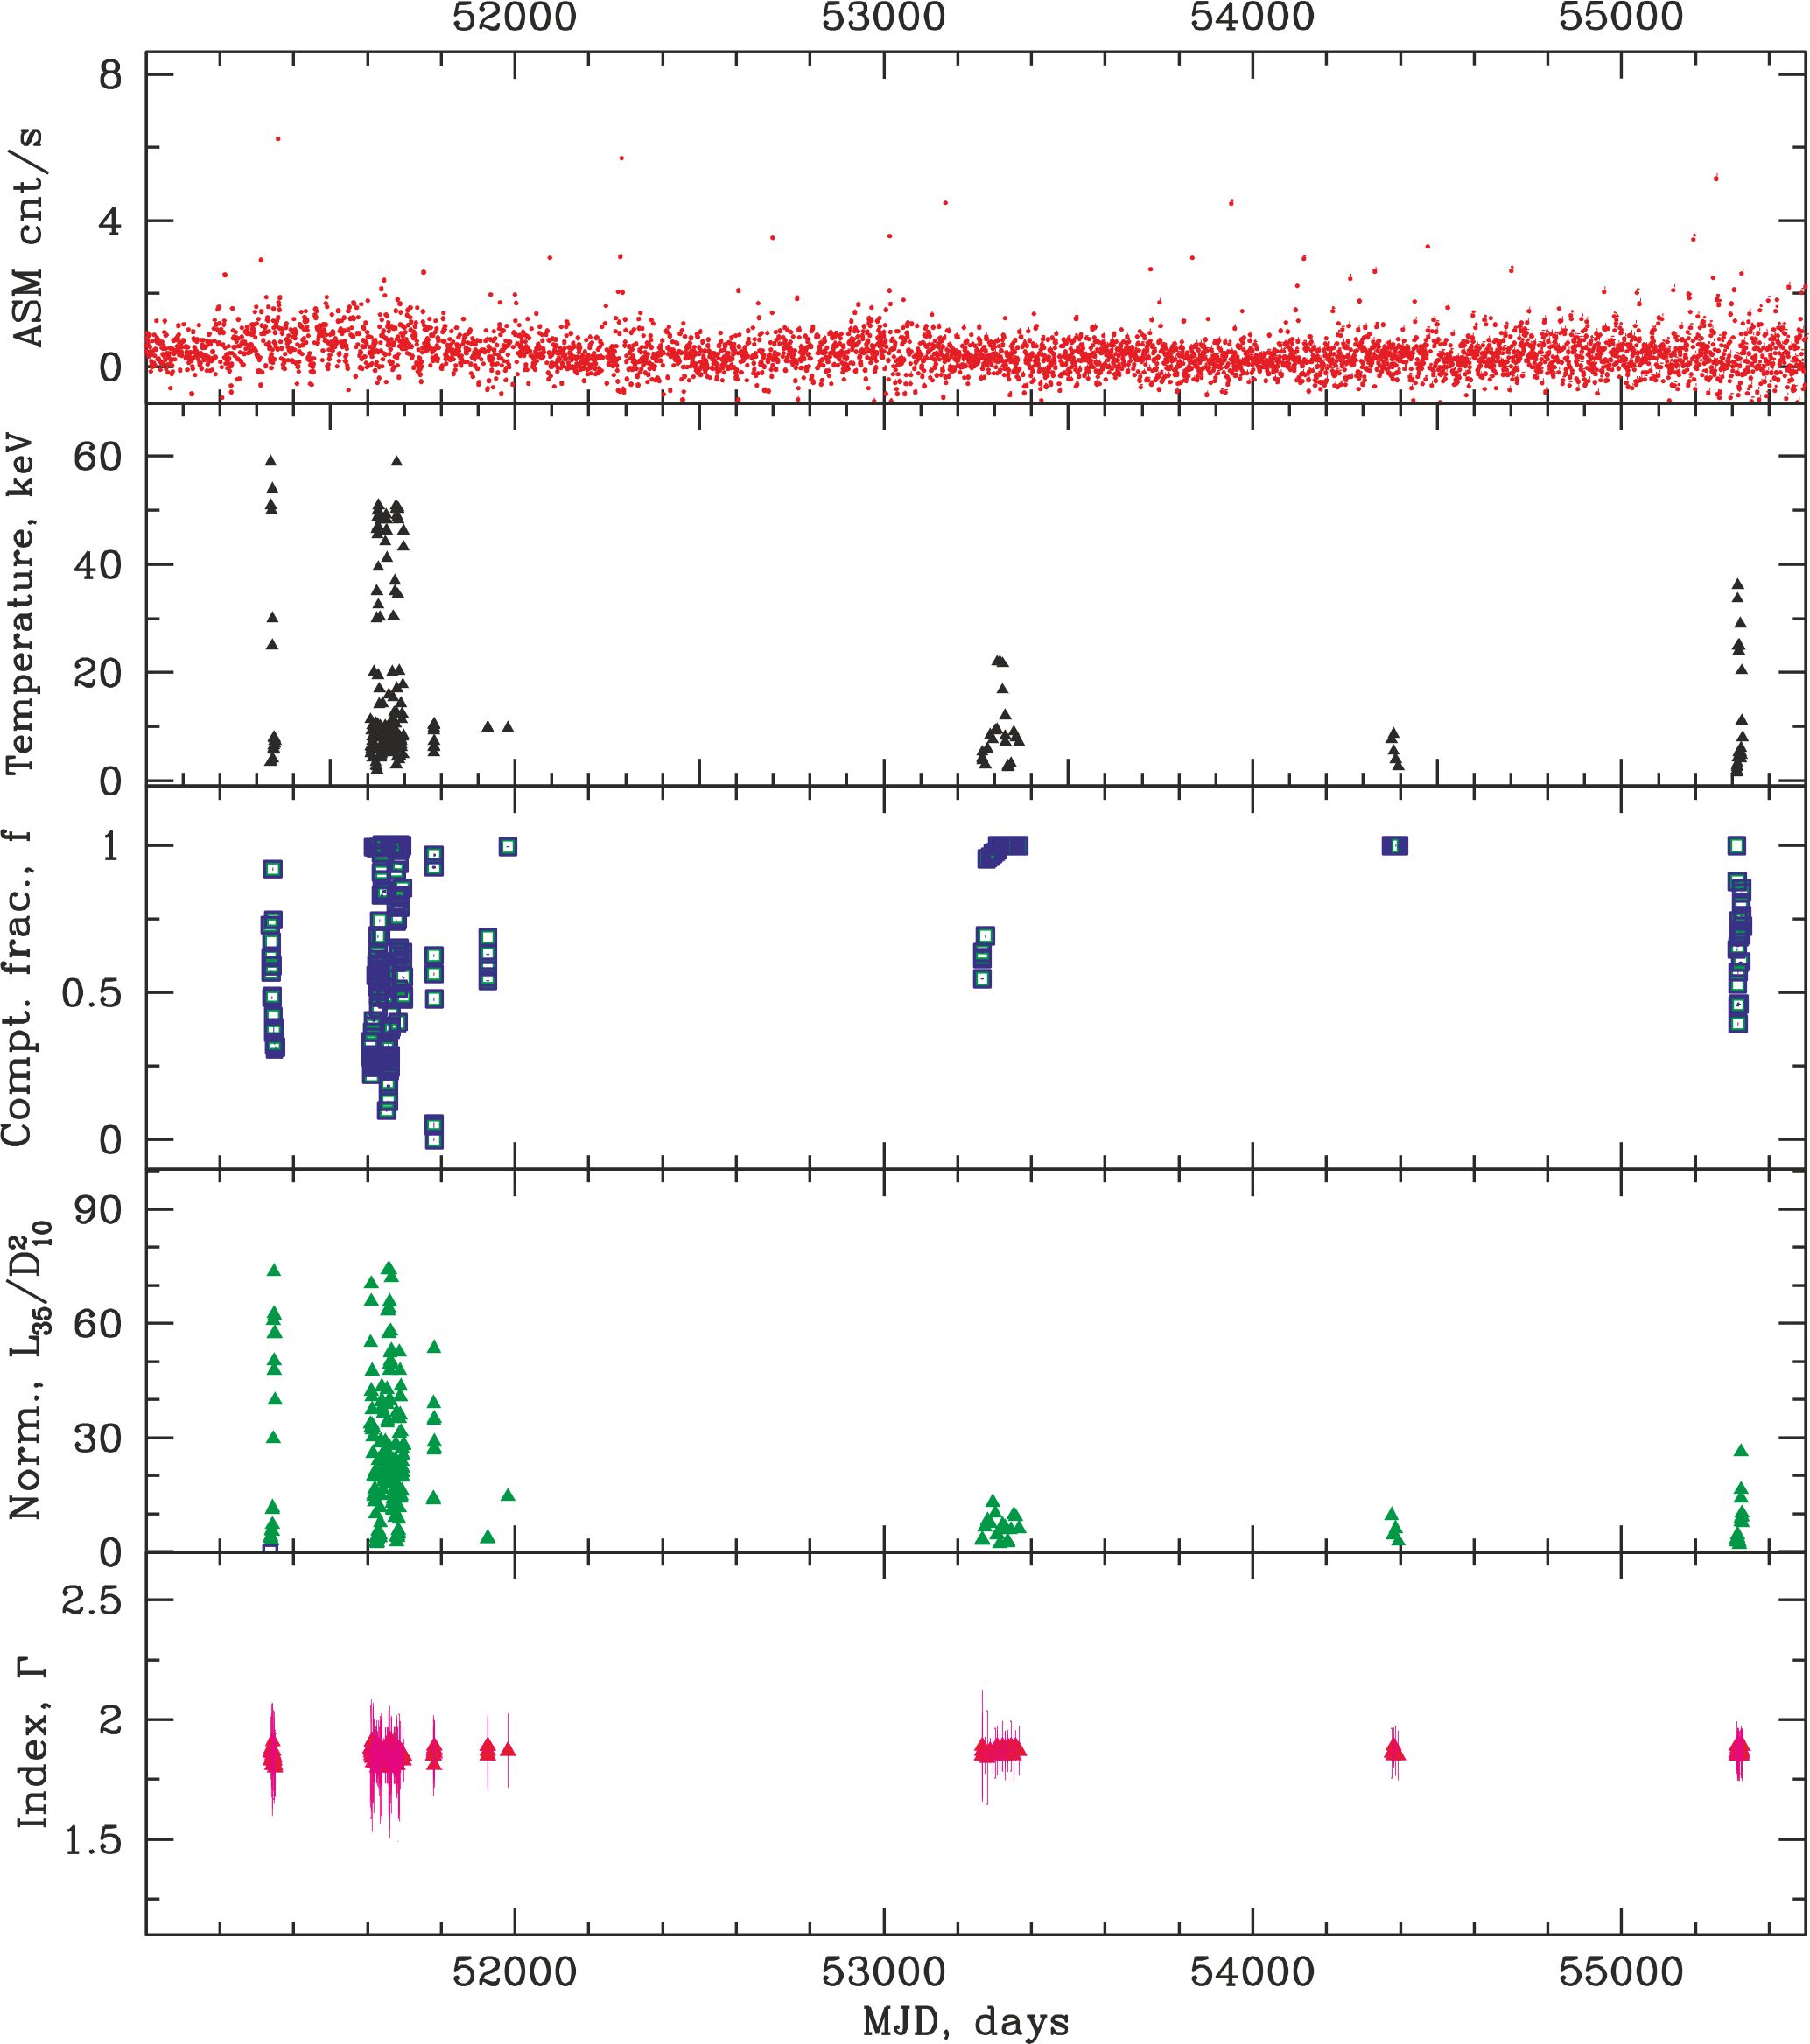
In Figure 12, we present an evolution of the X-ray parameters of SS Cygni from 1996 to 2010. The top panel shows the behavior of the ASM/RXTE count rate (red points), accompanied by frequent weak X-ray bursts [2–12 keV] at the level of 0–2 cnt/s and rare powerful bursts up to 6 cnt/s. The electron temperature (the panel next to the top, black points) varies from 3 to 60 keV. At these moments, the Comptonization fraction (middle panel, blue points) ranges from 0.1 to 1, but tends to 1 more often, especially at the burst maximum. This indicates a high degree of illumination of the transition layer. The normalization (penultimate panel below, green points) increases during outbursts from 0.1 to 75 . However, the photon index (bottom panel, crimson points) remains nearly constant around 1.85 for all states during the outburst.
4 DISCUSSION
4.1 Comparison of timing properties between NS 4U 1636–53 and WD SS Cygni sources
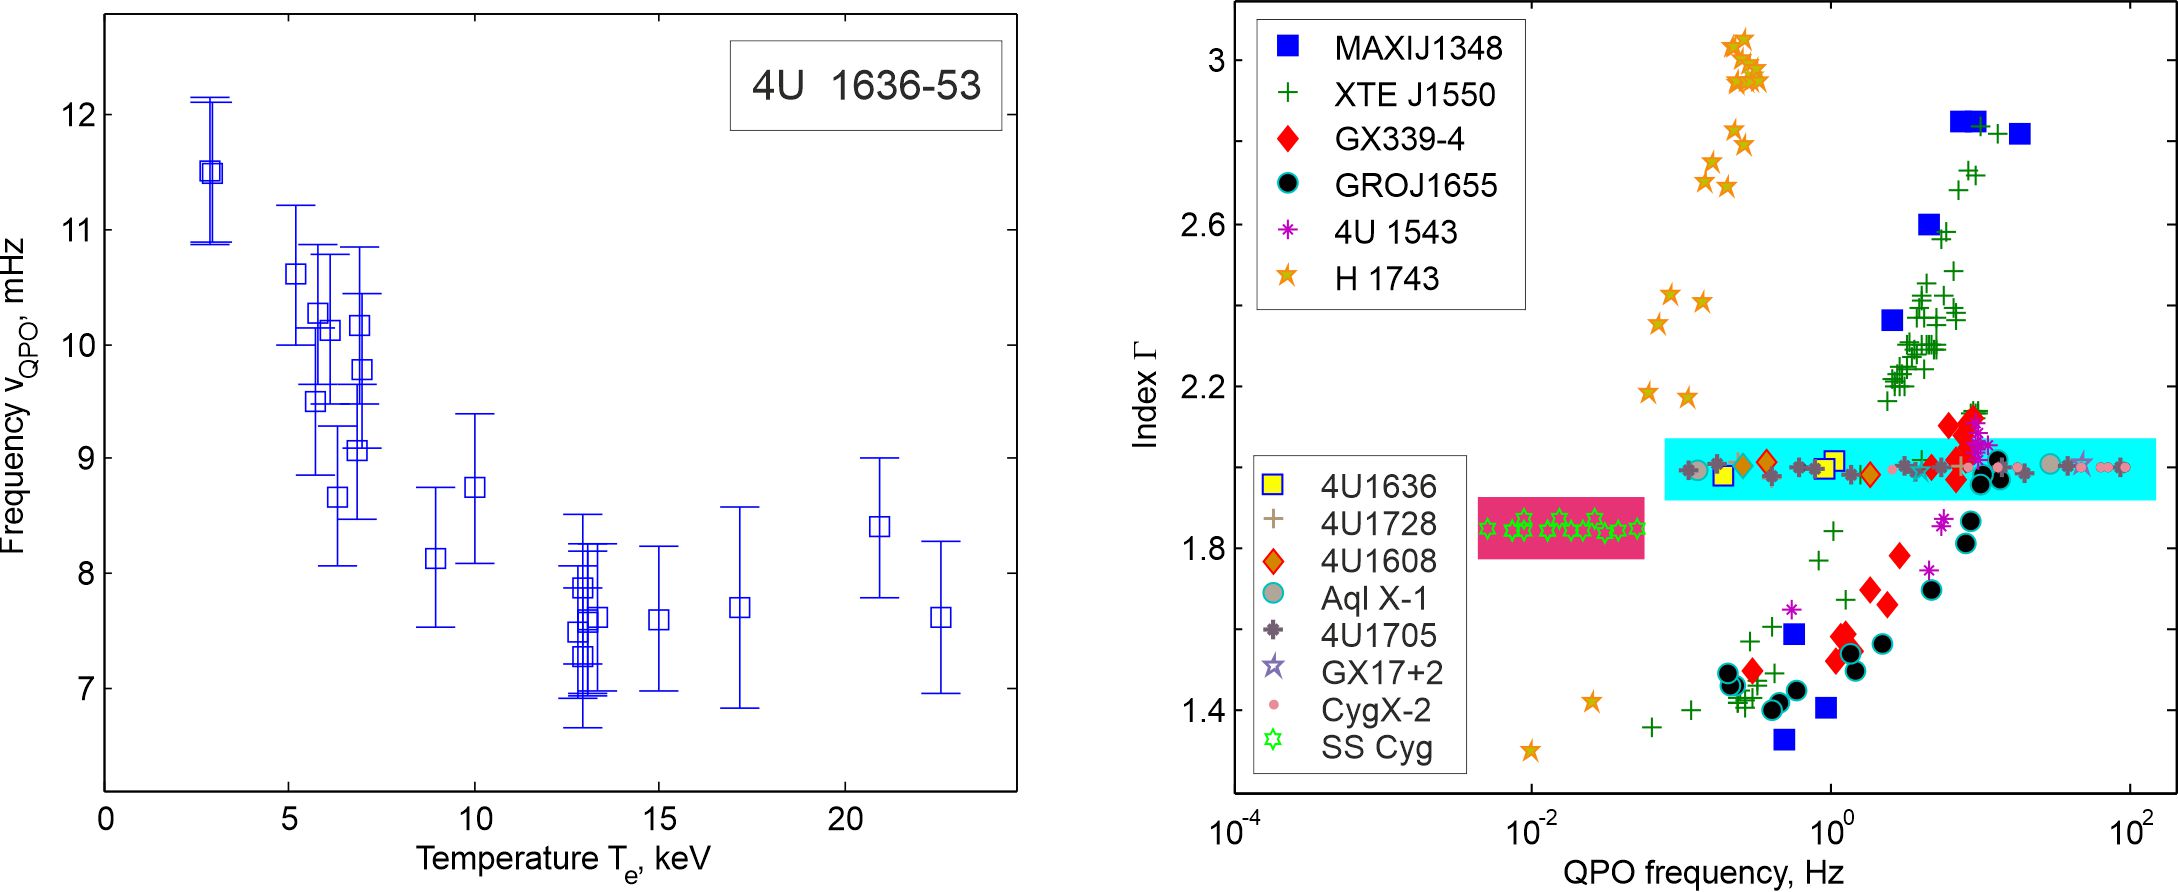
We extracted light curves of 1 s resolution in the 2–4.5 keV energy range from all available proportional counter units (PCUs). The RXTE light curves were analyzed using the powspec task. The data analysis of the PDSs was performed using a simplified version of the diffusion model tsa07 ; ts08 in which the PDS continuum shape at frequencies below the driving frequency can be approximated by an empirical KING model . Following tsa07 , the break frequency found in the PDS is related to a diffusion time of perturbation propagation while the QPO low frequency is an eigenfrequency of the volume (magnetoacoustic) oscillation of the medium (in our case it is a CC). We revealed that in 4U 1636–53 the mHz QPOs are consistent with variation of the plasma temperature of CC (or corona) around a NS. Namely, the anticorrelation of mHz-QPO frequency with the electron temperature indicates on the corona size is compacted when the is decreased. This allow us to associate mHz-QPOs origine with the corona dynamics during outburst cycle (Fig. 14, left).
It is now well known that dwarf novae exhibit different types of short-term variations HackLaDawes93 :QPOs (0.005 0.05 Hz), coherent oscillations ( 0.1 Hz) and flickering ( 0.01 Hz) balman12 ; Maiolino et al. (2020). In the right panel of Fig. 14, we present the dependence of the index on the frequency of QPOs associated with the change of spectral states between LHS and HSS during outburst for NS (4U 1636–53, 4U 1728–34, 4U 1608–52, Aql X–1, 4U 1705–44, GX 17+2 and Cyg X–2) and WD (SS Cygni). One can immediately see the difference between the NS and BC localization regions in this diagram: the NS are focused in the horizontal rectangular region for and (marked by a rectangle with a blue fill), although WDs are concentrated in a horizontal rectangular regions for and . To complete the picture, we have added a similar dependence for BH (MAXI J1348–630, XTE J1550–564, GX 339–4, GRO J1655-40, 4U 1543–47 and H 1743–322). It is clear that BHs are very different in terms of this diagram, showing oblique tracks over a wide range of QPO frequencies.
4.2 Comparison of spectral properties between NS 4U 1636–53 and WD SS Cygni sources
In this section we compare 4U 1636–53 with other NS binaries and to identify differences and similarities of these sources. We make a comparison
with four NS sources (GX 340+0 Seifina et al. (2013), 4U 1728–34 st11 , GX 3+1 Seifina & Titarchuk (2012) 4U 1820–30 Titarchuk et al. (2013)) and three WD sources (U Gem, VW Hyi and SS Aur) using the same spectral model, which consists of the Comptonized continuum and the Gaussian line components.
All parameters are summarized in Table 9, from which it can be seen that all sources, regardless of distance, show the following behavior pattern:
the photon index (3rd column) is quasi-constant versus the electron temperature (4th column) for both source classes, but with fair different -levels, namely with (for NSs) and (for WDs);
the range of the Comptonization fraction parameter (7th column) is quite wide for both NS and WD sources ();
the plasma temperature varies approximately in the same intervals keV; and
the seed photon temperature of NSs turns out to be higher (¿1 keV) than for WDs (¡0.2 keV).
Apparently, this fact indicates the difference in the surface temperatures of the central object ( keV and keV). In this context, the high temperature of the NS provides a high reflectivity of the NS surface, while the low temperature of the WD ensures the absorption of radiation, which also affects the value of the photon index.
4.3 Comparison with other results in the literature
Changes in the properties of the 4U 1636–53 continuum spectrum as the source moves through the CCD are generally consistent with those for other LMXB NSs. For example, Farinelli & Titarchuk (2011) measured the spectral index and electron temperature of the Comptonizing component in LMXB NSs Sco X–1, GX 349+2, X 1658–298, 1E 1724–3045, GX 17+2, Cyg X–2, GX 340+0, GX 3+1 and GS 1826–238, and found that the spectral index ( in the NthComp component) remains more or less constant at . Using the RXTE and BeppoSAX observations, st11 ; Seifina & Titarchuk (2012) showed that in GX 3+1 and 4U 1728–34 the photon index also remains more or less constant during abrupt changes in the coronal temperature . Titarchuk et al. (2013) found that in another NS binary, 4U 1820–30, the photon index remains almost constant for different source states Titarchuk et al. (2013). Lyu et al. (2014) showed that the power index in 4U 1636–53 changes from 1.7 in the hard state to 2.8 Lyu et al. (2014) in the soft state (depending on the model used to fit the iron line), which is somewhat larger than variations in sources studied by Farinelli & Titarchuk (2011). Titarchuk et al. (2013) concluded that the spectral index quasi-stability is an intrinsic property of binary neutron stars, which is fundamentally different from the property of black hole binaries Titarchuk et al. (2013). Seifina & Titarchuk (2011) suggested that this index stability occurs when the energy released in the corona itself is much higher than the energy flux from the disk st11 . The continuum changes are also broadly consistent with the LMXB truncated disk scenario Done et al. (2007). The temperature of the disk increases and the inner radius of the disk decreases as the estimated mass accretion rate increases. The electron temperature of the NthComp component and the surface temperature of the NS in Lyu et al. (2014) are also consistent with this scenario.
Previous studies has shown that the parameters of the spectral components differ in different spectral states. The temperature of thermal components is usually in the range of 0.5–2.0 keV in the soft state DiSalvo et al. (2000); Oosterbroek et al. (2001) and below 1 keV in the hard state Church et al. (2001); Barret et al. (2003). The coronal temperature changes in the opposite way, from 2–3 keV in the soft state to several tens of keV in the hard state Gierlinski & Done (2003).
Lyu et al. (2014) found that the temperature at the inner radius of the disk in 4U 1636–53 increases significantly from 0.2 keV Lyu et al. (2014) in the hard state to about 0.8 keV in the soft state (see their Fig. 4, top panel), while the Blackbody temperature increases slightly from 1.5 to 2 keV with increasing X-ray luminosity of the source (Fig. 4, second panel from the top). This is in full agreement with our results, taking into account the small differences between the models and the different meanings of model component bindings. So in our case, varies from 0.2 keV (in the hard state) to 0.7 keV (in the soft state), and we associate this temperature with the disk and its internal parts. Further, the temperature of the seed photons of the disk penetrating into the transition layer and participating in the Comptonization processes, , increases from 1.2 keV to 1.7 keV with the development of the outburst. This Lyu’s Blackbody temperature, in fact, was described using a separate blackbdody component. We used the CompTB model, which allows us to determine this temperature of the seed photons and immediately takes into account that these photons will participate in the processes of energy exchange with the hot electrons of the transition layer. For this reason, we do not use a separate BBody component, but the meaning of is the same as the temperature used in Lyu et al. (2014). However, that their model to fit the Comptonization component is different from the one we used here
Our spectral analysis results for SS Cygni from the ASCA data are somewhat different from the results obtained in Done & Osborne (1997). They described the observed spectrum of the X-ray continuum with a phenomenological model, a power law with a photon index of 2, while fixing at this value. But we did not fix it and described the observed spectrum using a physically justified first principles model taking into account the interaction of matter and radiation in the X-ray range, the Comptonization model CompTB and obtained 1.8. With taking into account these differences in the models, as well as observational errors, our and Done & Osbotn’s results agree with each other.
| Source | Distance, | Index, | , | , | , | |
|---|---|---|---|---|---|---|
| name | kpc | keV | keV | |||
| GX 340+0 | 10.55 | 2.130.08 | 3–21 | 0.08–0.2 | 1.1–1.5 | 0.01–0.5 |
| GX 3+1 | 4.56 | 2.020.05 | 2.3–4.5 | 0.04–0.15 | 1.16–1.7 | 0.2–0.9 |
| 4U 1728–34 | 4.2-6.47 | 1.990.02 | 2.5–15 | 0.02–0.09 | 1.3 | 0.5-1 |
| 4U 1820–30 | 5.8-88 | 2.040.07 | 2.9–21 | 0.02–0.14 | 1.1–1.7 | 0.2–1 |
| 4U 1636–53 | 7.49 | 2.000.02 | 2.7–30 | 0.01–0.08 | 1.1–1.8 | 0.1–1 |
| SS Cyg | 0.1710 | 1.850.03 | 2.7–60 | 0.001–0.007 | 0.02–0.210 | 0.1–1 |
| VW Hyi | 0.0510 | 1.750.09 | 5–10 | 0.0001–0.0006 | 0.1–0.1511 | 0.1–1 |
| SS Aur | 0.1710 | 1.850.04 | 6.1–37 | 0.0001–0.0005 | 0.05–0.1710 | 0.1–1 |
| U Gem | 0.110 | 1.800.09 | 5.0–43 | 0.0001–0.0008 | 0.08–0.1510 | 0.1–1 |
1 Seifina et al. (2013); 2 Seifina & Titarchuk (2012); 3 st11 ; 4 Titarchuk et al. (2013); 5 Fender & Hendry (2000); Ford & van der Klis (1998); Christian & Swank, (2006); 6 Kuulkers & van der Klis (2000); Ford00 ; 7 van Paradijs (1978); 8 Shaposhnikov & Titarchuk (2004); 9 Ritter & Kolb (2003); 10 Maiolino et al. (2020); 11 Nakaniwa et al. (2019).
5 CONCLUSIONS
We presented the results of spectral and timing analysis of 4U 1636–53 and SS Cygni during transitions between the faint and bright phases. We analyzed all transient episodes for these sources and established clear observational differences between NS and WD during outbursts in these binaries using results from the BeppoSAX, Suzaku, ASCA and RXTE missions. We show that the X-ray broad-band energy spectra for both sources during all spectral states can be well fitted by a sum of the Comptonization and Gaussian components. For the NS 4U 1636–35, we added Blackbody component to better fit the source spectrum. A wide variation of parameter , obtained in the framework of our spectral model, points out a significant variation of the illumination of the Comptonization region (transition layer) by X-ray soft photons in 4U 1636–53 and SS Cygni. We also show that the spectral index of the best-fit Comptonized component for 4U 1636–53 is almost constant, about 1 and consequently almost independent of CompTB normalization (which is proportional to the disk mass accretion rate ) and the electron temperature . Using the plasma temperature as an outburst tracer, we confirmed that the X-ray spectral index of SS Cygni is also constant throughout outbursts, but it tends to different value, . This is consistent with what was previously found from less extensive data from RXTE, Chandra and XMM-Newton for a number of other low-mass X-ray NSs and WDs. We should remind a reader that this index stability () has been recently suggested for a wide variety of other NS sources, for example, for atoll sources: GX 3+1 Seifina & Titarchuk (2012), X 1658–298, GS 1826–238, 1E 1724–3045, 4U 1728–34 Farinelli & Titarchuk (2011); st11 and also for Z-sources: Cyg X–2, Sco X–1, GX 17+2, GX 340+0, GX 349+2 , which were observed by BeppoSAX and RXTE Farinelli & Titarchuk (2011); st11 . In turn, recall also that such index stability () has recently been suggested for a number of other WD sources, for example, for U Gem, VW Hyi and SS Aur, which were observed by XMM-Newton and Chandra. We interpret this difference in terms of the TL model, which is sensitive to different boundary conditions and the temperatures of NS and WD surfaces. In fact, the higher temperature obtained for the NS surface provides a higher reflectivity than for the WD surface. As a consequence, the WD surface absorbs X-rays produced in the TL better than the NS surface, which leads to different values of the spectral index.
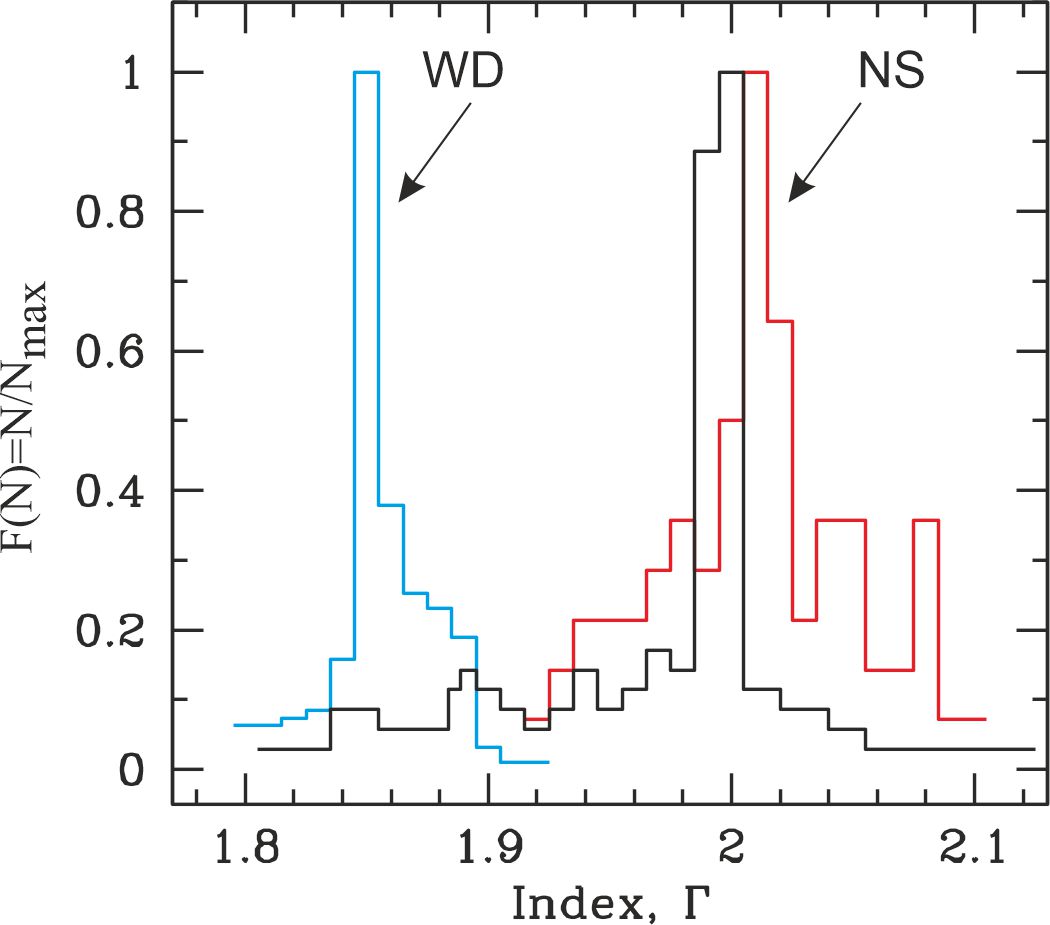
In addition, we revealed that in 4U 1636–53 the mHz-QPOs are consistent with variation of the plasma temperature of Compton cloud (or corona) around a NS. Namely, the anticorrelation of mHz-QPO frequency with the electron temperature indicates on the corona size is compacted when the is decreased. This indicates on the corona size is compacted when the is decreased and allow us to associate mHz-QPOs origine with the corona dynamics during outburst cycle. We also stated different patterns for NS and WD in terms of the highest QPO frequency component of the signal above the Poisson noise in the power spectra. NS X-ray spectra most often show quasi-stable behavior at the level and are characterized by LF-QPO in a wide frequency range (0.5–90 Hz), although WD X-rays stabilize at the level and accompanied with QPOs in a narrower frequency range (0.005–0.05 Hz). This index effect, now well established for 4U 1636–53 and WD SS Cygni in extensive observations, was previously found in other low-mass X-ray NSs and WDs. The index constancy for WD and its lower value in comparison with NS in combination with a higher QPO frequency indicates a fundamental difference between NS and WD sources and is a new set of features that is easily detected in observations.
ACKNOWLEDGMENTS
The Authors are very happy to get a careful reading and editing our manuscript by Chris Shrader.
References
- Sonbas et al. (2022) Sonbas E, Mohamed K, Dhuga KS, et al. A Temporal Scale to Track the Spectral Transitions in Low-Mass X-ray Binaries. MNRAS. 2022;511:2535-2543.
- Mohamed et al. (2021) Mohamed K, Sonbas E, Dhuga KS, et al. A minimal timescale for the continuum in 4U 1608-52 and Aql X-1. MNRAS. 2021;502:L72-L78.
- Hasinger & van der Klis (1989) Hasinger G, van der Klis M. Two patterns of correlated X-ray timing and spectral behaviour in low-mass X-ray binaries. A&A. 1989;225:79-96.
- Liu et al. (2007) Liu QZ, van Paradijs J, van den Heuvel EPJ. A catalogue of low-mass X-ray binaries in the Galaxy, LMC, and SMC (Fourth edition). AAP. 2007;469:807-810.
- Fiocchi et al. (2006) Fiocchi M, Bazzano A, Ubertini P, et al. Disk-Jet Coupling in the Low-Mass X-Ray Binary 4U 1636-53 from INTEGRAL Observations. ApJ. 2006;651:416-420.
- Corbel & Kaaret (2000) Corbel S., Kaaret P, Simultaneous ASCA and RXTE observations of the Atoll X-Ray Binary 4U1636-536. Rossi2000: Astrophysics with the Rossi X-ray Timing Explorer. March 22–24, 2000 at NASA’s Goddard Space Flight Center, Greenbelt, MD USA. 2000;6.
- Smale & Mukai (1988) Smale AP, Mukai K. The orbital variability of XB 1636-536. MNRAS. 1988;231:663-671.
- van Paradijs et al. (1990) van Paradijs J, van der Klis M, van Amerongen, et al. The orbital period of 4U/MXB 1636-53 (V801 Arae). A&A. 1990;234:181.
- Casares et al., (2006) Casares J, Cornelisse R, Steeghs D, et al. Detection of the irradiated donor in the LMXBs 4U 1636-536 (=V801 Ara) and 4U 1735-444 (=V926 Sco). MNRAS. 2006;373:1235-1244.
- Strohmayer (1998) Strohmayer T. RXTE observations of GX 3+1. AIP Conf. Proc., 1997 October Astrophysics Conference in Maryland: ”Accretion Processes in Astrophysics, Some Like it Hot”. 1998;431;397-400.
- Giles et al. (2002) Giles AB, Hill KM, Strohmayer TE, et al. Burst Oscillation Periods from 4U 1636-53: A Constraint on the Binary Doppler Modulation. ApJ. 2002;568:279-288.
- Bitner et al. (2007) Bitner MA, Robinson EL, Behr BB. The Masses and Evolutionary State of the Stars in the Dwarf Nova SS Cygni. ApJ. 2007;662:564-573.
- Galloway et al. (2006) Galloway DK, Psaltis D, Muno MP, et al. Eddington-limited X-Ray Bursts as Distance Indicators. II. Possible Compositional Effects in Bursts from 4U 1636-536. ApJ. 2006;639:1033-1038.
- Galloway et al. (2018) Galloway DK, in’t Zand JJM, Chenevez J, et al. The Influence of Stellar Spin on Ignition of Thermonuclear Runaways. ApJ. 2018;857:L24.
- Galloway et al. (2020) Galloway DK, in’t Zand J, Chenevez J, et al. The Multi-INstrument Burst ARchive (MINBAR). ApJS. 2020;249:32.
- Sanna et al. (2013) Sanna A, Hiemstra B, Mndez, M, et al. Broad iron line in the fast spinning neutron-star system 4U 1636-53. MNRAS. 2013;432:1144-1161.
- Frank et al. (1987) Frank J, King AR, Lasota J-P. The light curves of low-mass X-ray binaries. A&A. 1987;178:137-142.
- Lyu et al. (2014) Lyu M, Mndez M, Sanna A, et al. Iron-line and continuum variations in the XMM-Newton and Suzaku spectra of the neutron-star low-mass X-ray binary 4U 1636-53. MNRAS. 2014;440:1165-1178.
- Shih et al. (2005) Shih IC, Bird AJ, Charles PA, et al. Periodic variability during the X-ray decline of 4U 1636-53. MNRAS. 2005;361:602-606.
- Belloni et al. (2007) Belloni T, Homan J, Motta S, et al. Rossi XTE monitoring of 4U1636-53 – I. Long-term evolution and kHz quasi-periodic oscillations. MNRAS. 2007;379:247-252.
- Strohmayer et al. (1996) Strohmayer TE, Zhang W, Swank JH, et al. Millisecond X-Ray Variability from an Accreting Neutron Star System. ApJ. 1996;469:L9.
- van der Klis et al. (1996) van der Klis M, Swank JH, Zhang W, et al. Discovery of Submillisecond Quasi-periodic Oscillations in the X-Ray Flux of Scorpius X-1. ApJ. 1996;469:L1.
- Mendez et al. (2006) Mndez M. On the maximum amplitude and coherence of the kilohertz quasi-periodic oscillations in low-mass X-ray binaries. MNRAS. 2006;371:1925-1938.
- (24) Revnivtsev M, Churazov E, Gilfanov M, Sunyaev R. New class of low frequency QPOs: Signature of nuclear burning or accretion disk instabilities? A&A. 2001;372:138-144.
- (25) Fei Z, Lyu M, Méndez M, et al The Harmonic Component of the Millihertz Quasi-periodic Oscillations in 4U 1636-53. ApJ. 2021;922:119.
- (26) Heger A, Cumming A, Woosley SE. Millihertz Quasi-periodic Oscillations from Marginally Stable Nuclear Burning on an Accreting Neutron Star. ApJ. 2007;665:1311-1320.
- (27) Keek L, Cyburt RH, Heger A. Reaction Rate and Composition Dependence of the Stability of Thermonuclear Burning on Accreting Neutron Stars. ApJ. 2014;787:101.
- (28) Yu W, van der Klis M. Kilohertz Quasi-periodic Oscillation Frequency Anticorrelated with Millihertz Quasi-periodic Oscillation Flux in 4U 1608-52. ApJL. 2002;567:L67-L70.
- (29) Altamirano D, van der Klis M, Wijnands R, et al. Millihertz Oscillation Frequency Drift Predicts the Occurrence of Type I X-Ray Bursts. ApJL. 2008;673:L35.
- (30) Mancuso GC, Altamirano D, García F, et al. Discovery of millihertz quasi-periodic oscillations in the X-ray binary EXO 0748-676. MNRAS. 2019;486:L74-L79.
- (31) Linares M, Altamirano D, Chakrabarty D, et al. Millihertz Quasi-periodic Oscillations and Thermonuclear Bursts from Terzan 5: A Showcase of Burning Regimes. ApJ. 2012;748:82.
- (32) Lyu M, Méndez M, Zhang G, et al. Spectral and timing analysis of the mHz QPOs in the neutron-star low-mass X-ray binary 4U 1636-53. MNRAS. 2015;454:541-549.
- (33) Yu W, van der Klis M. Kilohertz Quasi-periodic Oscillation Frequency Anticorrelated with Millihertz Quasi-periodic Oscillation Flux in 4U 1608-52. ApJL. 2002;567:L67-L70.
- (34) Stiele H, Yu W, Kong AKH. Millihertz Quasi-periodic Oscillations in 4U 1636-536: Putting Possible Constraints on the Neutron Star Size. ApJ. 2016;831:34.
- (35) Strohmayer TE, Gendreau KC, Altamirano D, et al. NICER Discovers mHz Oscillations in the “Clocked” Burster GS 1826-238. ApJ. 2018;865:63.
- Barret (2001) Barret D. The broad band x-ray/hard x-ray spectra of accreting neutron stars. Adv. Space Res. 2001;28:307-321.
- Lin et al. (2007) Lin D, Remillard RA, Homan J. Evaluating Spectral Models and the X-Ray States of Neutron Star X-Ray Transients. ApJ. 2007;667:1073-1086.
- Lewin & van der Klis (2006) Lewin WHG, van der Klis M. Compact Stellar X-Ray Sources. Cambridge, UK:: Cambridge Univ. Press). 2006;39.
- Titarchuk et al. (2014) Titarchuk L, Seifina E, Shrader C. X-Ray Spectral and Timing Behavior of Scorpius X-1. Spectral Hardening during the Flaring Branch. ApJ. 2014;789:98.
- Friend et al. (1990) Friend MT, Martin JS, Smith RC, Jones DHP. The 8190-A sodium doublet in cataclysmic variables III. Too cool for credibility. MNRAS. 1990;246:654-667.
- Ritter & Kolb (2003) Ritter H, Kolb U. Catalogue of cataclysmic binaries, low-mass X-ray binaries and related objects (Seventh edition). A&A. 2003;404:301-303.
- Harrison et al. (2004) Harrison TE, Johnson JJ, McArthur BE, et al. An Astrometric Calibration of the MV-Porb Relationship for Cataclysmic Variables based on Hubble Space Telescope Fine Guidance Sensor Parallaxes. AJ. 2004;127:460-468.
- Mauche & Robinson (2001) Mauche CW, Robinson EL. First Simultaneous Optical and Extreme-Ultraviolet Observations of the Quasi-coherent Oscillations of SS Cygni. ApJ. 2001;562:508-514.
- Ishida et al. (2009) Ishida M, Okada S, Hayashi T, et al. Suzaku Observations of SS Cygni in Quiescence and Outburst. PASJ. 2009;61:77-91.
- (45) Balman S, Revnivtsev M. X-ray variations in the innner accretionflow of dwarf novae.’ A&A. 2012;546:A112.
- (46) Farinelli R, Titarchuk L, Paizis A, Frontera F. A New Comptonization Model for Weakly Magnetized, Accreting Neutron Stars in Low-Mass X-Ray Binaries. ApJ. 2008;680:602-614.
- Mitsuda et al. (1984) Mitsuda K, Inoue H, Koyama K, et al. Energy spectra of low-mass binary X-ray sources observed from Tenma. PASJ. 1984;36:741-759.
- Shaposhnikov & Titarchuk (2009) Shaposhnikov N, Titarchuk L. Determination of black hole masses in galactic black hole binaries using scaling of spectral and variability characteristics, ApJ, 2009;699:453-468.
- Titarchuk & Seifina (2023) Titarchuk L, Seifina E. MAXI J1348–630: Estimating the black hole mass and binary inclination using a scaling technique”. A&A. 2023;669:A57.
- Makishima et al. (1986) Makishima K, Maejima Y, Mitsuda K, et al. Simultaneous X-Ray and Optical Observations of GX 339-4 in an X-Ray High State. ApJ. 1986;308:635-643.
- Zdziarski et al. (1996) Zdziarski AA, Johnson WN, Magdziarz P. Broad-band -ray and X-ray spectra of NGC 4151 and their implications for physical processes and geometry. MNRAS. 1996;283:193-206.
- Zycki et al. (1999) Zycki PT, Done C, Smith DA. The 1989 May outburst of the soft X-ray transient GS 2023+338 (V404 Cyg). MNRAS. 1999;309:561-575.
- Madejski et al. (1999) Madejski GM, Sikora M, Jaffe T, et al. X-Ray Observations of BL Lacertae during the 1997 Outburst and Association with Quasar-like Characteristics. ApJ. 1999;521:145-154.
- Shakura & Sunyaev (1973) Shakura NI, Sunyaev RA. Black holes in binary systems. Observational appearance. A&A. 1973;24:337-355.
- Balman et al. (2001) Balman , Godon P, Sion EM, et al. XMM-Newton Observations of the Dwarf Nova RU Peg in Quiescence: Probe of the Boundary Layer. ApJ. 2011;741:84.
- Chenevez et al. (2006) Chenevez J, Falanga M, Brandt S, et al. Two-phase X-ray burst from GX 3+1 observed by INTEGRAL. A&A. 2006;449:L5-L8.
- (57) Titarchuk L, Shaposhnikov N. Implication of the Observed Spectral Cutoff Energy Evolution in XTE J1550-564. ApJ. 2010;724:1147-1152.
- (58) Seifina E, Titarchuk L. On the Constancy of the Photon Index of X-Ray Spectra of 4U 1728-34 through All Spectral States. ApJ. 2011;738:128-148
- (59) Titarchuk L, Shaposhnikov N, Arefiev V. Power Spectra of Black Holes and Neutron Stars as a Probe of Hydrodynamic Structure of the Source: Diffusion Theory and Its Application to Cygnus X-1 and Cygnus X-2 X-Ray Observations. ApJ. 2007;660:556-579.
- (60) Titarchuk L, Shaposhnikov N. On the Nature of the Variability Power Decay toward Soft Spectral States in X-Ray Binaries: Case Study in Cygnus X-1. ApJ. 2008;678:1230-1236.
- Titarchuk & Shaposhnikov (2010) Titarchuk L, Shaposhnikov N. Implication of the Observed Spectral Cutoff Energy Evolution in XTE J1550-564. ApJ. 2010;724:1147-1152.
- (62) Hack M, Ladous C, Jordan SD, et al. Cataclysmic variables and related objects. NASSP. 1993;507.
- Done et al. (2007) Done C, Gierlnski M, Kubota A. Modelling the behaviour of accretion flows in X-ray binaries. Everything you always wanted to know about accretion but were afraid to ask. A&AR. 2007;15:1-66.
- Maiolino et al. (2020) Maiolino T, Titarchuk L, D’Amico F. et al. Testing Comptonization as the Origin of the Continuum in Nonmagnetic Cataclysmic Variables: The Photon Index of X-Ray Emission. ApJ. 2020;900:153.
- Seifina et al. (2013) Seifina E, Titarchuk L, Frontera F. Stability of the Photon Indices in Z-source GX 340+0 for Spectral States. ApJ. 2013;766:63.
- Seifina & Titarchuk (2012) Seifina E, Titarchuk L. GX 3+1: The Stability of Spectral Index as a Function of Mass Accretion Rate. ApJ. 2012;747:99.
- Titarchuk et al. (2013) Titarchuk L, Seifina E, Frontera F. Spectral State Evolution of 4U 1820-30: The Stability of the Spectral Index of the Comptonization Tail. ApJ. 2013;767:160.
- Fender & Hendry (2000) Fender RP, Hendry MA. The radio luminosity of persistent X-ray binaries. MNRAS. 2000;317:1-8.
- Ford & van der Klis (1998) Ford E, van der Klis M. Strong Correlation between Noise Features at Low Frequency and the KilohertzQuasi-Periodic Oscillations in the X-Ray Binary 4U 1728-34. ApJ. 1998;506:L39-L42.
- Christian & Swank, (2006) Christian DJ, Swank JH. The Survey of Low-Mass X-Ray Binaries with the Einstein Observatory Solid-State Spectrometer and Monitor Proportional Counter. ApJS. 1997;109:177-224.
- Kuulkers & van der Klis (2000) Kuulkers E, van der Klis M. The first radius-expansion X-ray burst from GX 3+1. A&A. 2000;356:L45-L48.
- (72) Ford EC, van der Klis M. Mendez, M., et al. Simultaneous Measurements of X-Ray Luminosity and Kilohertz Quasi-Periodic Oscillations in Low-Mass X-Ray Binaries. ApJ. 2000;537:368-373.
- van Paradijs (1978) van Paradijs J. Average properties of X-ray burst sources. Nature. 1978;274:650-653.
- Shaposhnikov & Titarchuk (2004) Shaposhniko N, Titarchuk L. On the Nature of the Flux Variability during an Expansion Stage of a Type I X-Ray Burst: Constraints on Neutron Star Parameters for 4U 1820-30. ApJL. 2004;606:L57-L60.
- Nakaniwa et al. (2019) Nakaniwa N, Hayashi T, Takeo M, et al. Variation of mass accretion rate on to the white dwarf in the dwarf nova VW Hyi in quiescence. MNRAS. 2019;488:5104-5113.
- Farinelli & Titarchuk (2011) Farinelli R, Titarchuk L. On the stability of the thermal Comptonization index in neutron star low-mass X-ray binaries in their different spectral states. A&A. 2011;525:102.
- Done & Osborne (1997) Done C, Osborne JP. The X-ray spectrum of the dwarf nova SS CYG in quiescence and outburst. MNRAS. 1997;288:649-664.
- (78) Di Salvo T,Mendez M,van der Klis M, et al. Study of the Temporal Behavior of 4U 1728–34 as a Function of Its Position in the Color-Color Diagram. ApJ. 2001;546:1107-1120.
- Oosterbroek et al. (2001) Oosterbroek T, Barret D, Guainazzi M, et al. . Simultaneous BeppoSAX and RXTE observations of the X-ray burst sources GX 3+1 and Ser X-1. A&A. 2001;366:138-145.
- Church et al. (2001) Church MJ, Baluciska-Church M. Results of a LMXB survey: Variation in the height of the neutron star blackbody emission region. A&A. 2001;369:915-924.
- Barret et al. (2003) Barret D, Olive JF, Oosterbroek T. Simultaneous BeppoSAX and Rossi X-ray timing explorer observations of 4U 1812-12. A&A. 2003;400:643-647.
- Gierlinski & Done (2003) Gierliski M, & Done C. The X-ray/-ray spectrum of XTE J1550-564 in the very high state. MNRAS. 2003;342:1083-1092.
- DiSalvo et al. (2000) Di Salvo T, Iaria R, Burderi L, et al. The Broadband Spectrum of MXB 1728-34 Observed by BeppoSAX. ApJ. 2000;542:1034-1040.
- (84) Balman S. Accretion Flows in Nonmagnetic White Dwarf Binaries as Observed in X-rays. Advances in Space Research. 2020;66:1097-1122.
- Okada et al. (2008)
- Mukai et al. (2003) Mukai K, Kinkhabwala A, Peterson JR, et al. Two Types of X-Ray Spectra in Cataclysmic Variables. ApJL. 2003;586:L77-L80. Okada S, Nakamura R, Ishida M. Chandra HETG Line Spectroscopy of the Nonmagnetic Cataclysmic Variable SS Cygni. ApJ. 2008;680:695-704.
- Byckling et al. (2010) Byckling K, Mukai K, Thorstensen JR, et al. Deriving an X-ray luminosity function of dwarf novae based on parallax measurements. MNRAS. 2010;408:2298-2311.
- Xu et al. (2016) Xu X-j, Wang QD, Li X-D. Fe Line Diagnostics of Cataclysmic Variables and Galactic Ridge X-Ray Emission. ApJ. 2016;818:136.
- Kimura et al. (2021) Kimura M, Yamada S, Nakaniwa N, et al. On the nature of the anomalous event in 2021 in the dwarf nova SS Cygni and its multi-wavelength transition. PASJ. 2021;73:1262-1279.
- Parmar et al. (1997) Parmar AN, Martin DDE, Bavdaz M, et al. The low-energy concentrator spectrometer on-board the BeppoSAX X-ray astronomy satellite. A&AS. 1997;122:309-326.
- Boella et al. (1997) Boella G, Chiappetti L, Conti G, et al. The medium-energy concentrator spectrometer on board the BeppoSAX X-ray astronomy satellite. A&AS. 1997;122:327-340.
- Frontera et al. (1997) Frontera F, Costa E, dal Fiume D, et al. PDS experiment on board the BeppoSAX satellite: design and in-flight performance results. SPIE. 1997;3114:206-215.
- Tanaka et al. (1994) Tanaka Y, Inoue H, Holt SS. The Fluorescence-Dominated X-Ray Spectrum of the Spiral Galaxy NGC 6552. PASJ. 1994;46:L141-L146.
- Mitsuda et al. (2007) Mitsuda K, Bautz M, Inoue H. et al. The X-Ray Observatory Suzaku. PASJ. 2007;59:S1-S7.
- (95) Koyama K, Tsunemi H, Dotani T, et al. X-Ray Imaging Spectrometer (XIS) on Board Suzaku. PASJ. 2007;59:23-33.
- Gaia Collaboration, Brown et al. (2018) Gaia Collaboration, Brown AGA, Vallenari A, Prusti T, et al. Gaia Data Release 2. Summary of the contents and survey properties. A&A. 2018;616:A1.