Antonio García Hernández et al. \righttitleThe PL diagram for Sct stars
17 \jnlDoiYr2021 \doival10.1017/xxxxx
Proceedings IAU Symposium
The PL diagram for Sct stars: back in business as distance estimators
Abstract
In this work, we focus on the period-luminosity relation (PLR) of Sct stars, in which mode excitation and selection mechanisms are still poorly constrained, and whose structure and oscillations are affected by rotation. We review the PLRs in the recent literature, and add a new inference from a large sample of Sct. We highlight the difficulty in identifying the fundamental mode and show that rotation-induced surface effects can impact the measured luminosities, explaining the broadening of the PLR. We derive a tight relation between the low-order large separation and the fundamental radial mode frequency (F0) that holds for rotating stars, thus paving the way towards mode identification. We show that the PLRs we obtain for different samples are compatible with each other and with the recent literature, and with most observed Sct stars when taking rotation effects into account. We also find that the highest-amplitude peak in the frequency spectrum corresponds to the fundamental mode in most Sct, thus shedding some light on their elusive mode selection mechanism.
keywords:
Period-luminosity relations, Sct stars, Stellar pulsations, Stellar rotation, Mode identification1 Introduction
Period-luminosity relations (PLRs) have been studied since the early twentieth century. The discovery of such a relation for classical Cepheids (Leavitt, 1908) allowed to estimate distances to other galaxies and changed our vision of the scale of the Universe. Inspired by this success, complementary PLRs have been searched for other pulsating stars, mainly those in the Cepheid instability strip (see, e.g., Balona, 2010; Owens et al., 2022, and references therein). In particular, a PLR for Sct stars has been established since Fernie (1964).
Sct stars offer several observational advantages compared to Cepheids. One is their shorter periods, which arise from their smaller radii. Furthermore, as pointed out by Breger (1979), Sct stars constitute the second most abundant group of pulsators in the Galaxy, following the pulsating white dwarfs. Having a tight PLR, along with these favourable characteristics, would enable us to compare between observations and pulsation theory. Additionally, it would facilitate the determination of stellar luminosities and distances to stars, open and globular clusters, nearby galaxies, and the Galactic centre.
However, there are several difficulties in the interpretation of the pulsation spectra of Sct stars. They have spectral types from late A to early F, with masses in the range 1.5 to 2.5 , and can be found either on the main sequence or at the H-shell burning phase. They show low-order radial and non-radial modes near the fundamental radial mode (whose frequency and period we denote as F0 and P0, respectively), although the latter is not always the highest amplitude peak in the spectrum (Aerts et al., 2010). This is one of the main difficulties to get a proper PLR, which requires the order of the radial mode to be properly identified. Moreover, other difficulties are related to their usually rapid rotation (Royer et al., 2007) and the poor understanding of their excitation and selection mechanisms (Aerts et al., 2010).
1.1 Recent advances in understanding the Sct pulsation spectrum
The pulsation spectrum of solar-like pulsators, including red giants, is easily understood thanks to the periodic patterns they exhibit because their pressure (p) modes appear in the asymptotic regime (, see, for example, Aerts et al., 2010; Corsaro et al., 2012). The most important pattern is known as large separation, , a spacing between consecutive radial orders of the same spherical degree that is a direct measurement of the stellar mean density.
Sct stars do not pulsate in the asymptotic regime but in the low-order regime of p modes. Nonetheless, prior to the launch of space missions dedicated to ultra-precise photometric time-series, several efforts were made to find a large separation structure in the pulsation spectrum of these stars (Handler et al., 1997; Breger et al., 1999). With the advent of space missions like Microvariability and Oscillations of STars (MOST; Walker et al., 2003), Convection, Rotation and planetary Transits (CoRoT; Auvergne et al., 2009), and Kepler (Koch et al., 2010), it became clear that a similar pattern in the low-order regime could be found in the pulsation spectra of Scuti stars (García Hernández et al., 2009, 2013; Zwintz et al., 2011; Paparó et al., 2016; Barceló Forteza et al., 2017; Michel et al., 2017; Bedding et al., 2020; Hasanzadeh et al., 2021).
Theoretical predictions for these patterns were also made (Reese et al., 2008; Ouazzani et al., 2015) and were found to be consistent with a large separation scaling with the mean density of the star ( , Suárez et al., 2014). This scaling relation differs with respect to the solar-like one because of the different regimes where the modes appear in both pulsating classes. Empirical confirmation of this scaling law was subsequently provided by García Hernández et al. (2015, 2017) using eclipsing binary systems with a Scuti component. Interestingly, Mirouh et al. (2019) employed a convolutional neural network to identify island modes in 2D pulsation models, and obtained a similar scaling relation for fast-rotating stars. The most recent theoretical relation was derived by Rodríguez-Martin et al. (2020) using synthetic spectra of 1D rotating models. The independence of the scaling relation with rotation makes a promising seismic index to shed light on the pulsation behaviour of Sct stars.
1.2 Previous PLRs for Sct stars
The PLR of Sct stars has been extensively studied in previous works. McNamara (2011) investigated the PLR using a sample of 26 high-amplitude Scuti (HADS) stars. Cohen & Sarajedini (2012) examined 77 SX Phoenicis (SX Phe) stars, which are generally considered the Population II analogues of Sct stars, to explore the PLR in that class. Ziaali et al. (2019) analysed a larger dataset consisting of 1352 Kepler Sct stars and utilised additional information from Rodríguez & Breger (2001).
Jayasinghe et al. (2020) conducted a study on approximately 4000 Sct stars sourced from the ASAS-SN catalogue (Jayasinghe et al., 2018). Poro et al. (2021) focused on 27 Sct from the Kourovka Planet Search (KPS) project. Barac et al. (2022) investigated 434 Sct stars, comprising 301 from Rodríguez & Breger (2001) and 133 from Chang et al. (2013), using data obtained from the Transiting Exoplanet Survey Satellite (TESS; Ricker et al., 2014).
De Ridder et al. (2022) studied a significant sample size of 6511 Gaia Sct stars and found evidence of a broken PLR within this population. Martínez-Vázquez et al. (2022) examined 3799 extragalactic Sct from various sources, including the Super MAssive Compact Halo Object (SuperMACHO; Garg et al., 2010) and the Optical Gravitational Lensing Experiment-III (OGLE-III; Poleski et al., 2010) projects. They also observed a broken PLR for these extragalactic objects.
Furthermore, Deka et al. (2022) studied 3202 Sct stars in the Galactic bulge from the OGLE-IV catalogue (Soszyński et al., 2021) and the Large Magellanic Cloud (LMC) from OGLE-III. Their analysis revealed a broken PLR for the bulge Sct stars, but not for those in the LMC.
Despite the numerous studies conducted, many unanswered questions persist, and a definitive PLR for Sct stars is yet to be established. This study aims to introduce a novel PLR and utilises rotating equilibrium and pulsation models to demonstrate that rotation (through seismic and gravity darkening effects) contributes to the solution of the unresolved issues affecting the Scuti PLR.
2 The samples
In our study, we utilised various samples of Sct stars to investigate the PLR. We employed approximately 3700 Sct stars from the ASAS-SN catalogue, as described by Jayasinghe et al. (2020). To ensure these objects were Sct, we selected only those stars that fell within the effective temperature range of and surface gravity range of , using the parameters derived from their own analysis. Additionally, we incorporated around 3800 Sct, Dor, and hybrid stars from Sódor et al. (in prep.), obtained from the Kepler mission. We ended up discarding the pure Dor stars because they are not relevant for this work.
We also considered a sample of 17 HADS stars with Gaia luminosities from data release 3 (DR3, Fouesneau et al., 2023) based on the work of McNamara (2011). We added a new sample of HADS composed of 11 HADS stars with non-distorted lightcurves from Lares-Martiz (2022) and 36 HADS stars introduced in this work for the first time, collectively forming what we refer to as Lares-Martiz’s HADS sample. These 47 lightcurves were acquired from the TESS satellite. The Best Parent Method (Lares-Martiz et al., 2020) was employed to determine their F0 frequency, which is usually that of the dominant peak for HADS. By fitting not only the main peaks but also their possible combinations, this method ensures a robust and more precise determination of F0. The list and F0 values of the stars in this sample are shown in Table 1.
| TIC ID | F0 [d-1] | TIC ID | F0 [d-1] | TIC ID | F0 [d-1] | ||
|---|---|---|---|---|---|---|---|
| 17153995 | 8.54481 | 181087723 | 7.72287 | 334436767 | 7.47803 | ||
| 35920894 | 5.64856 | 183532876 | 5.98212 | 339675323 | 7.44527 | ||
| 43173526 | 11.93649 | 200624064 | 5.2087 | 342500794 | 6.5115 | ||
| 46937596 | 7.88982 | 210548440 | 5.42033 | 355547586 | 10.51244 | ||
| 78850814 | 9.11811 | 224285325 | 18.19356 | 355687188 | 8.19196 | ||
| 51991595 | 10.91561 | 231632224 | 6.91544 | 358502706 | 11.67333 | ||
| 80781425 | 6.5968 | 241787384 | 11.0103 | 362384415 | 7.21626 | ||
| 118080601 | 7.54064 | 241843363 | 5.98816 | 374753270 | 7.24599 | ||
| 121731704 | 14.22167 | 242302902 | 7.63725 | 383604347 | 9.49098 | ||
| 139845816 | 6.80218 | 262652067 | 5.63467 | 393420032 | 6.01012 | ||
| 144309524 | 8.97501 | 293110952 | 14.20631 | 396424970 | 7.1762 | ||
| 145372195 | 7.74984 | 298112357 | 9.84591 | 447363101 | 5.22441 | ||
| 166979292 | 17.217331 | 299948201 | 7.07711 | 448892817 | 13.43279 | ||
| 168384036 | 9.25355 | 304196197 | 8.82052 | 454665792 | 8.21272 | ||
| 178463456 | 4.94822 | 308396022 | 13.20399 | 464401254 | 8.33771 | ||
| 178616716 | 9.76366 | 321528595 | 5.57497 |
Finally, we have used 60 young Sct stars identified by Bedding et al. (2020) in our analysis. This sample has the advantage of showing clear periodicities, so was identified.
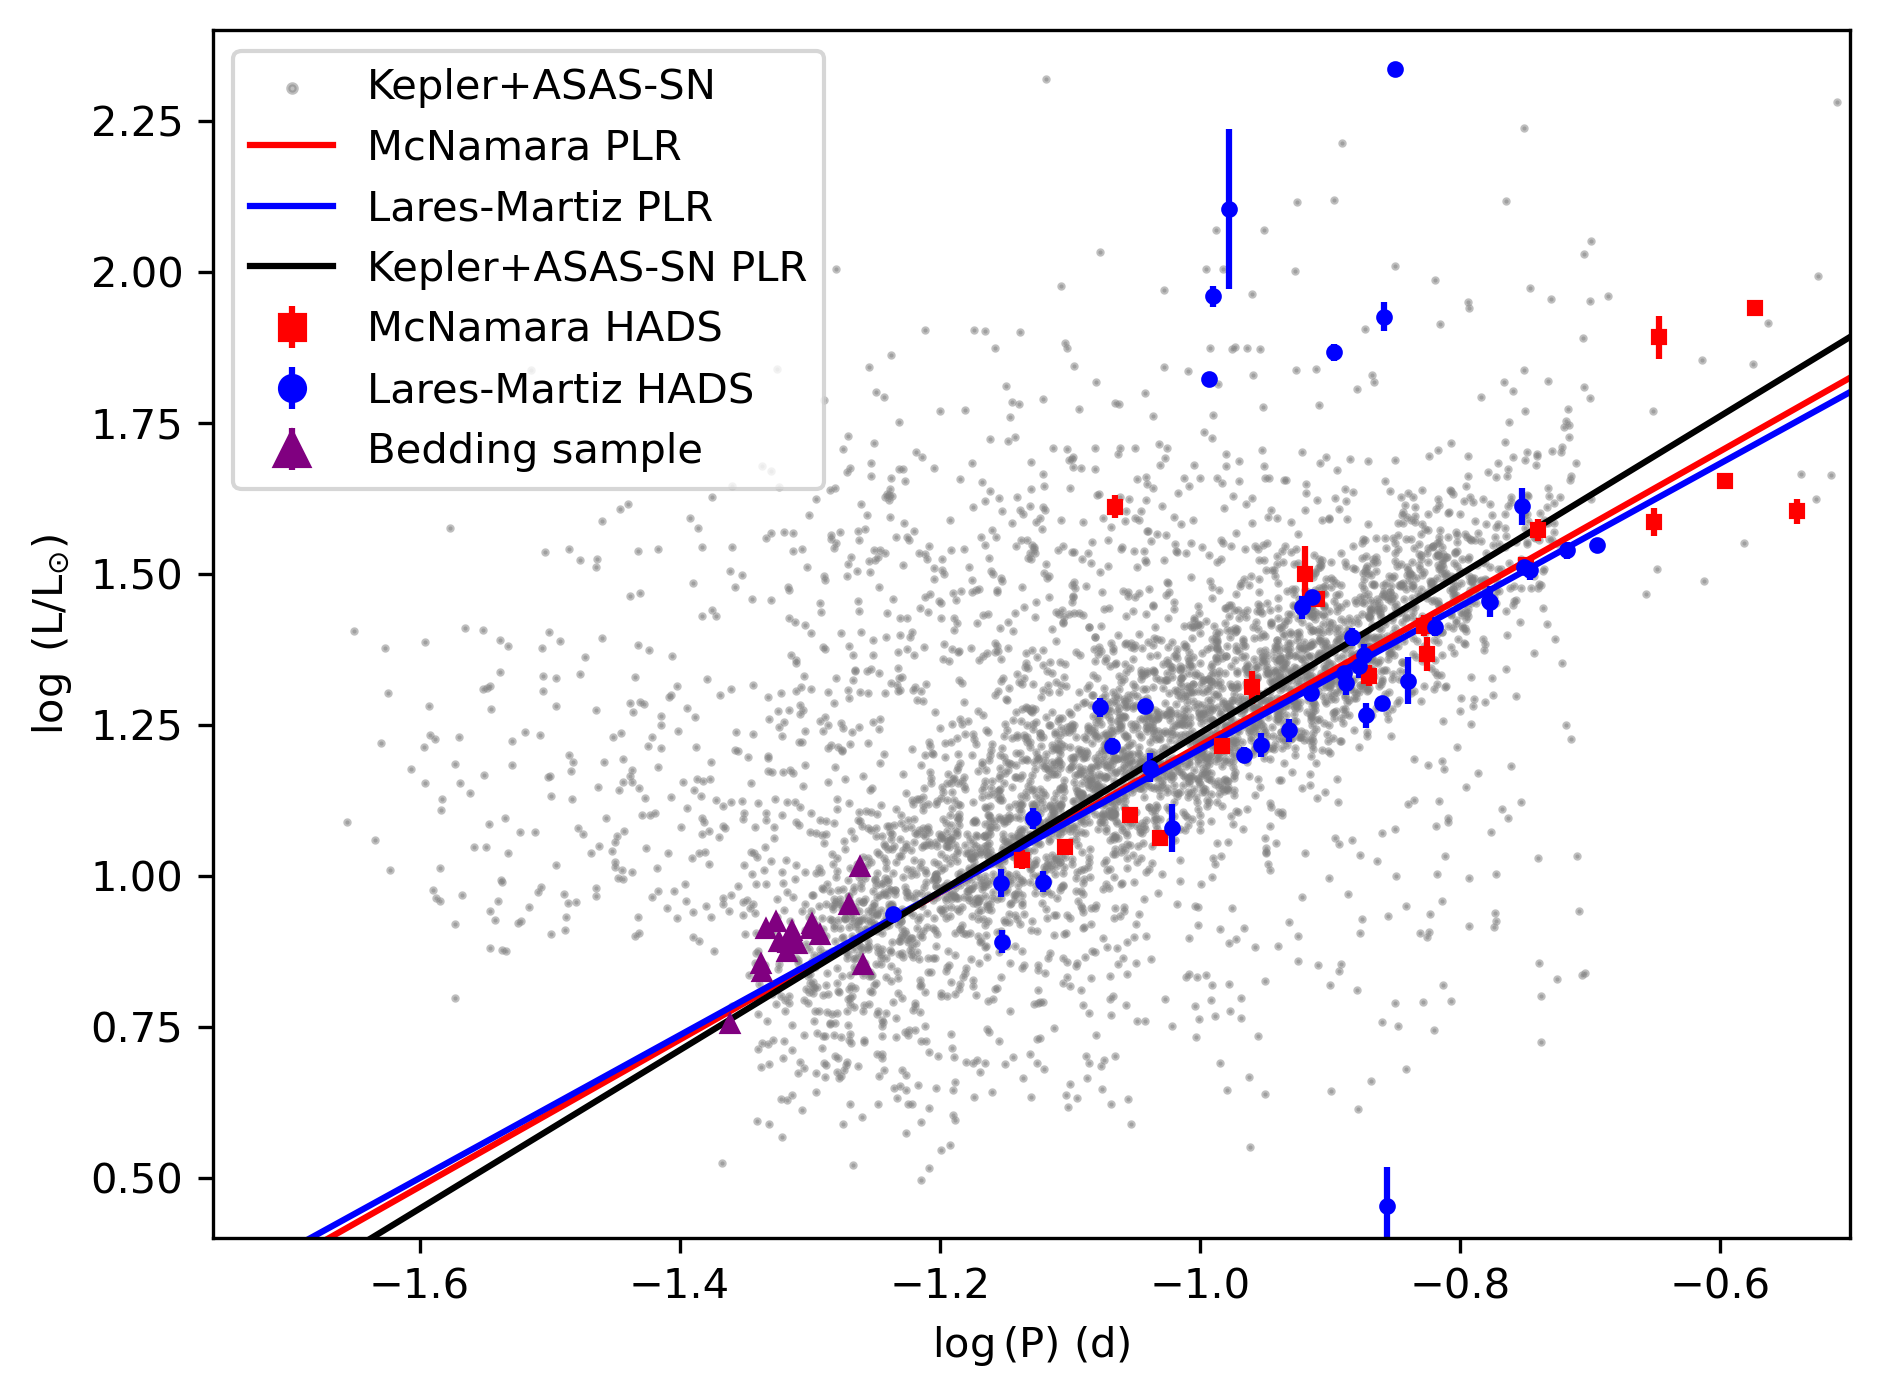
To ensure consistency and obtain luminosity information, we cross-matched all the aforementioned catalogues with Gaia DR3 (Fouesneau et al., 2023). The resulting PL diagram is shown in Figure 1. The combined ASAS-SN and Kepler sample is shown as grey points, whereas McNamara’s, Lares-Martiz’s, and Bedding’s samples are depicted with red squares, blue circles, and purple triangles, respectively. Uncertainties both in luminosity and period are also shown for the smaller sample (for the sake of clarity), but they are usually smaller than the symbol size. The entire Sct sample spans approximately and . Within this region, a denser band was observed, primarily consisting of stars where the fundamental mode (of period P0) also exhibited the highest amplitude (Jayasinghe et al., 2020). This denser band was used to calculate the PLR, as described in Section 3.
3 Getting the PLR
We have obtained three different PLRs with the previous samples that are depicted in Figure 1. We obtain a PLR using Lares-Martiz’s sample of HADS. We avoid outliers in the fit (more than of deviation from the fit). Some outliers seem to be binary systems, for example, TIC 299948201, identified as a double or multiple-star system in Simbad (Wenger et al., 2000). Other outliers suspected to be binaries are TIC 383604347 and TIC 396424970. Initially, these were identified as Sct stars by Chang et al. (2013), but recently Barac et al. (2022) identified them as non- Sct since binary systems without a pulsating component can also look like HADS. This can explain the high luminosity of TIC 383604347 (, see Figure 1) and low luminosity () of TIC 396424970.
We also calculated the PLR for McNamara’s sample of HADS. We did not take into account AE UMa, the star with and , because its luminosity differs from that found by other authors (for example, Xue et al. 2022 find between 1.00 and 1.24).
Finally, to get the PLR from the combined Kepler and ASAS-SN sample, we used the denser band of stars in the PL diagram (see Section 2). We divided the set in equal bins of to get 20 bins. This assured a statistically significant number of stars per bin. Then, we created a histogram in of every bin and calculated the Gaussian kernel density estimator to obtain its maximum value. With that maximum and the centre of the bin, we get the points to be fitted and derive the PLR.
The relations found in the way described above give, respectively:
| (1a) | |||
| (1b) | |||
| (1c) | |||
These relations, in which the period is expressed in days, are all in agreement, within the uncertainties at . The higher deviation comes from the independent term in the case of equation (1a), corresponding to Lares-Martiz’s sample. This is probably due to the fact that most of the stars appear in the lower part of the broad region of the ASAS-SN sample in the PL diagram. For the rest of the work, we will use equation (1b), corresponding to the ASAS-SN sample, because the corresponding PLR is obtained for a larger number of stars. This statistically more robust sample allows avoiding certain problems and errors, such as wrong luminosity values. It is not surprising that this relation has the lowest error bars.
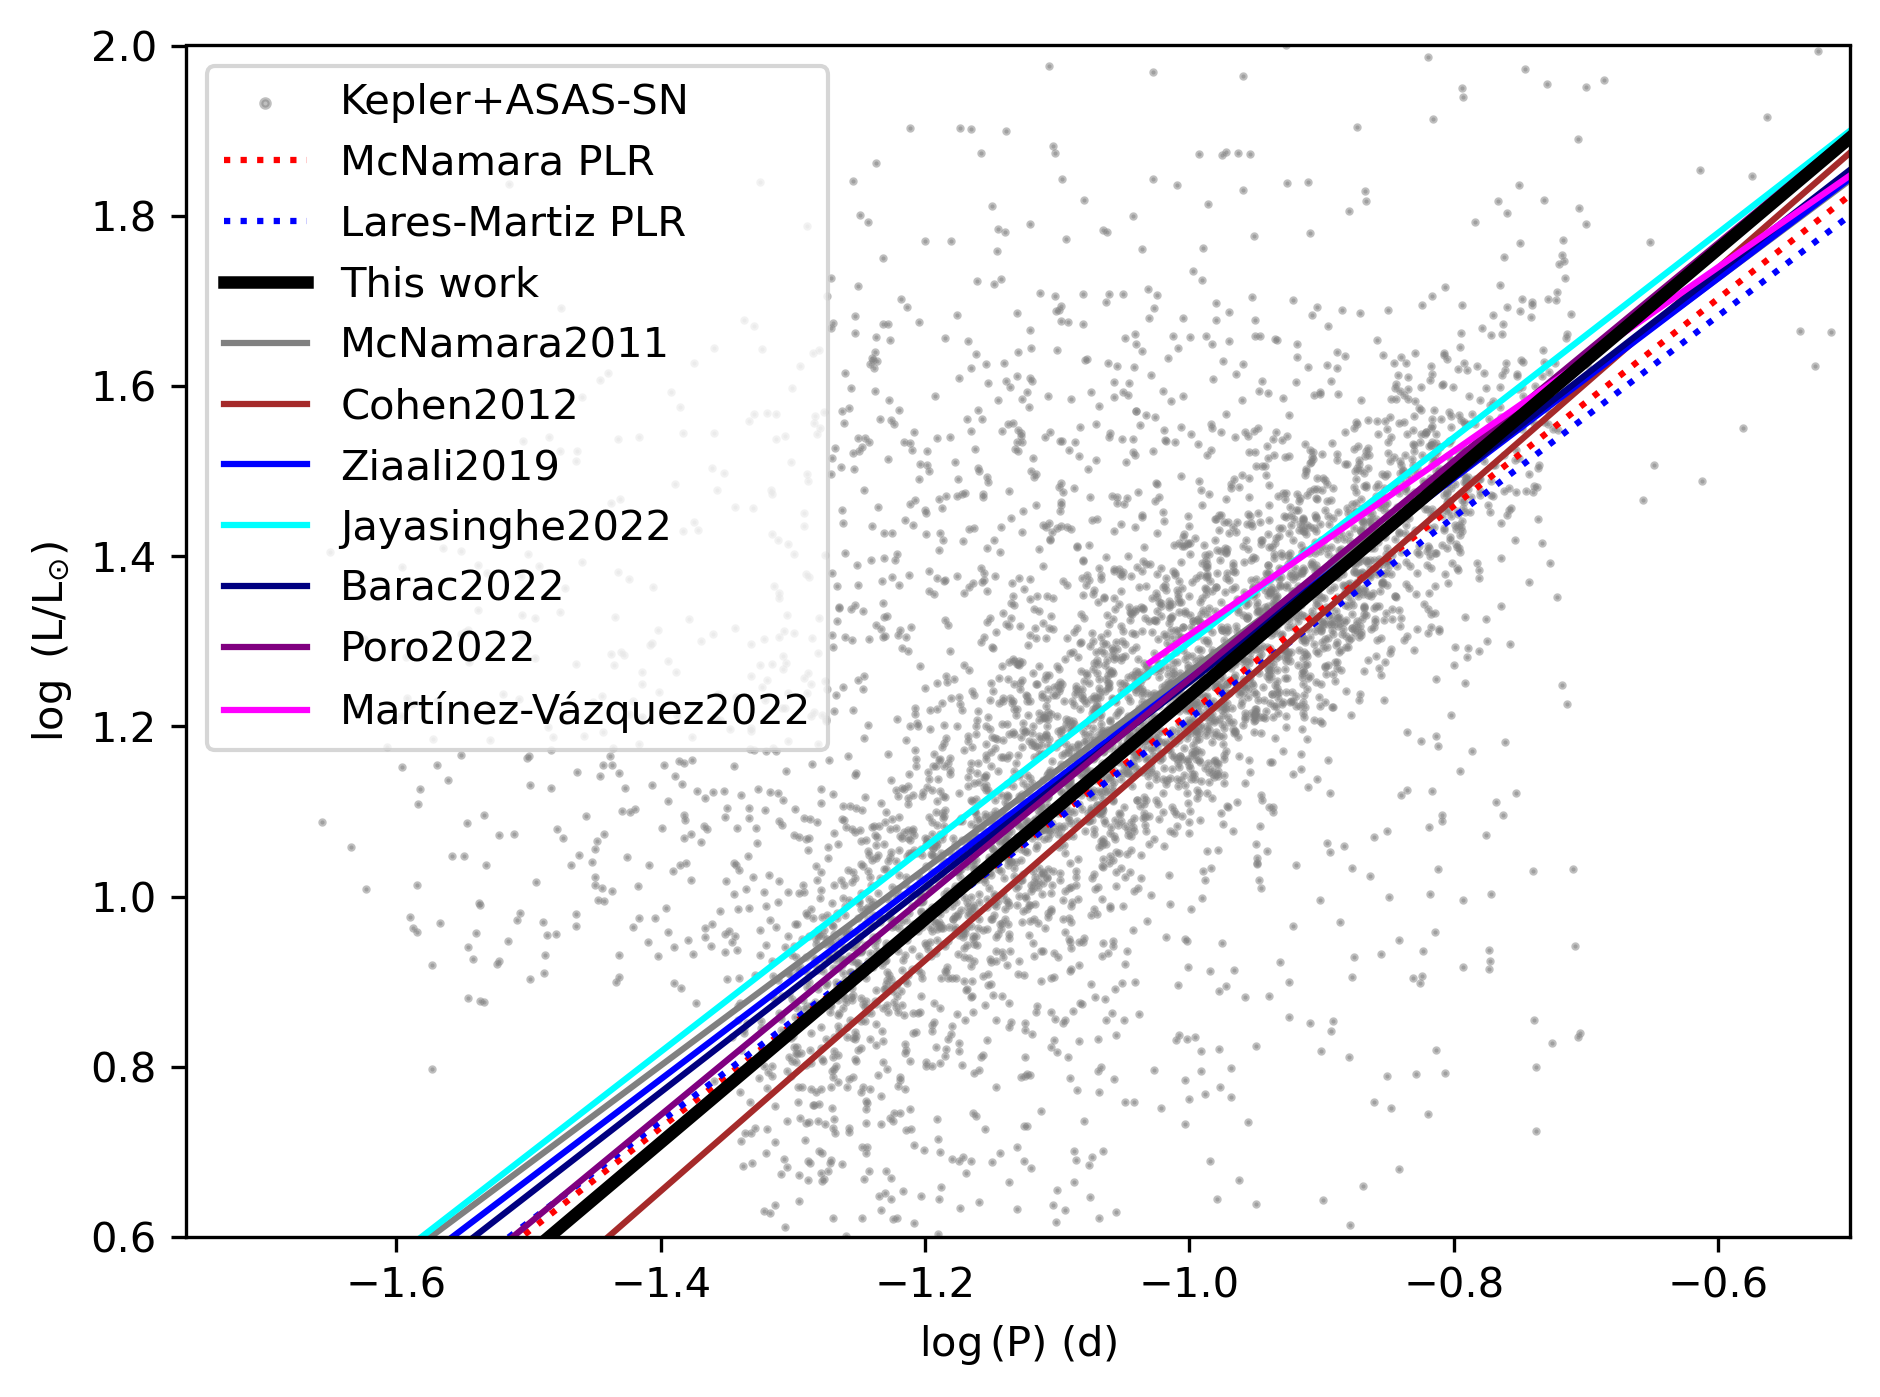
We also compared our findings to previous PLRs. Figure 2 shows several previous studies111Because we just used the previous PLRs for comparison reasons, we transform the visual absolute magnitudes given by the authors into bolometric ones assuming that most Sct are A-type stars for which the bolometric correction is 0. together with our new relations. As can be seen, the relations obtained with the different samples in this work are essentially the same as in previous studies. Small deviations are expected due to differences in the samples used to get them.
4 Gravity darkening effects due to rapid rotation
Sct stars are rapid rotators (see, e.g., Royer et al., 2007). Due to their high rotation speeds, these stars become oblate, deviating from the shape of an ideal sphere. This deformation gives rise to distinct equilibrium conditions on their surfaces, resulting in higher temperatures and brightness at the poles, while the equator experiences lower temperatures and fainter luminosity. This phenomenon is commonly referred to as gravity darkening, and it holds significant importance when considering observed luminosities.
Rotation effects have commonly been incorporated into 1D codes as a correction factor for the stellar equations, as done, for instance, in the Modules for Experiments in Stellar Astrophysics (mesa; Paxton et al., 2019). In this code, after calculating the stellar structure for a specific rotation rate, a gravity darkening model derived from 2D solutions is applied (Espinosa Lara & Rieutord, 2011). Inclination also affects the observed physical parameters in this case, as the relative visibility of the pole versus the equator plays a role. Under extreme conditions, the combined influence of stellar deformation and inclination can lead to a luminosity increase of up to 50% and a temperature variation of 2.5%. Consequently, this effect can significantly impact a PLR.
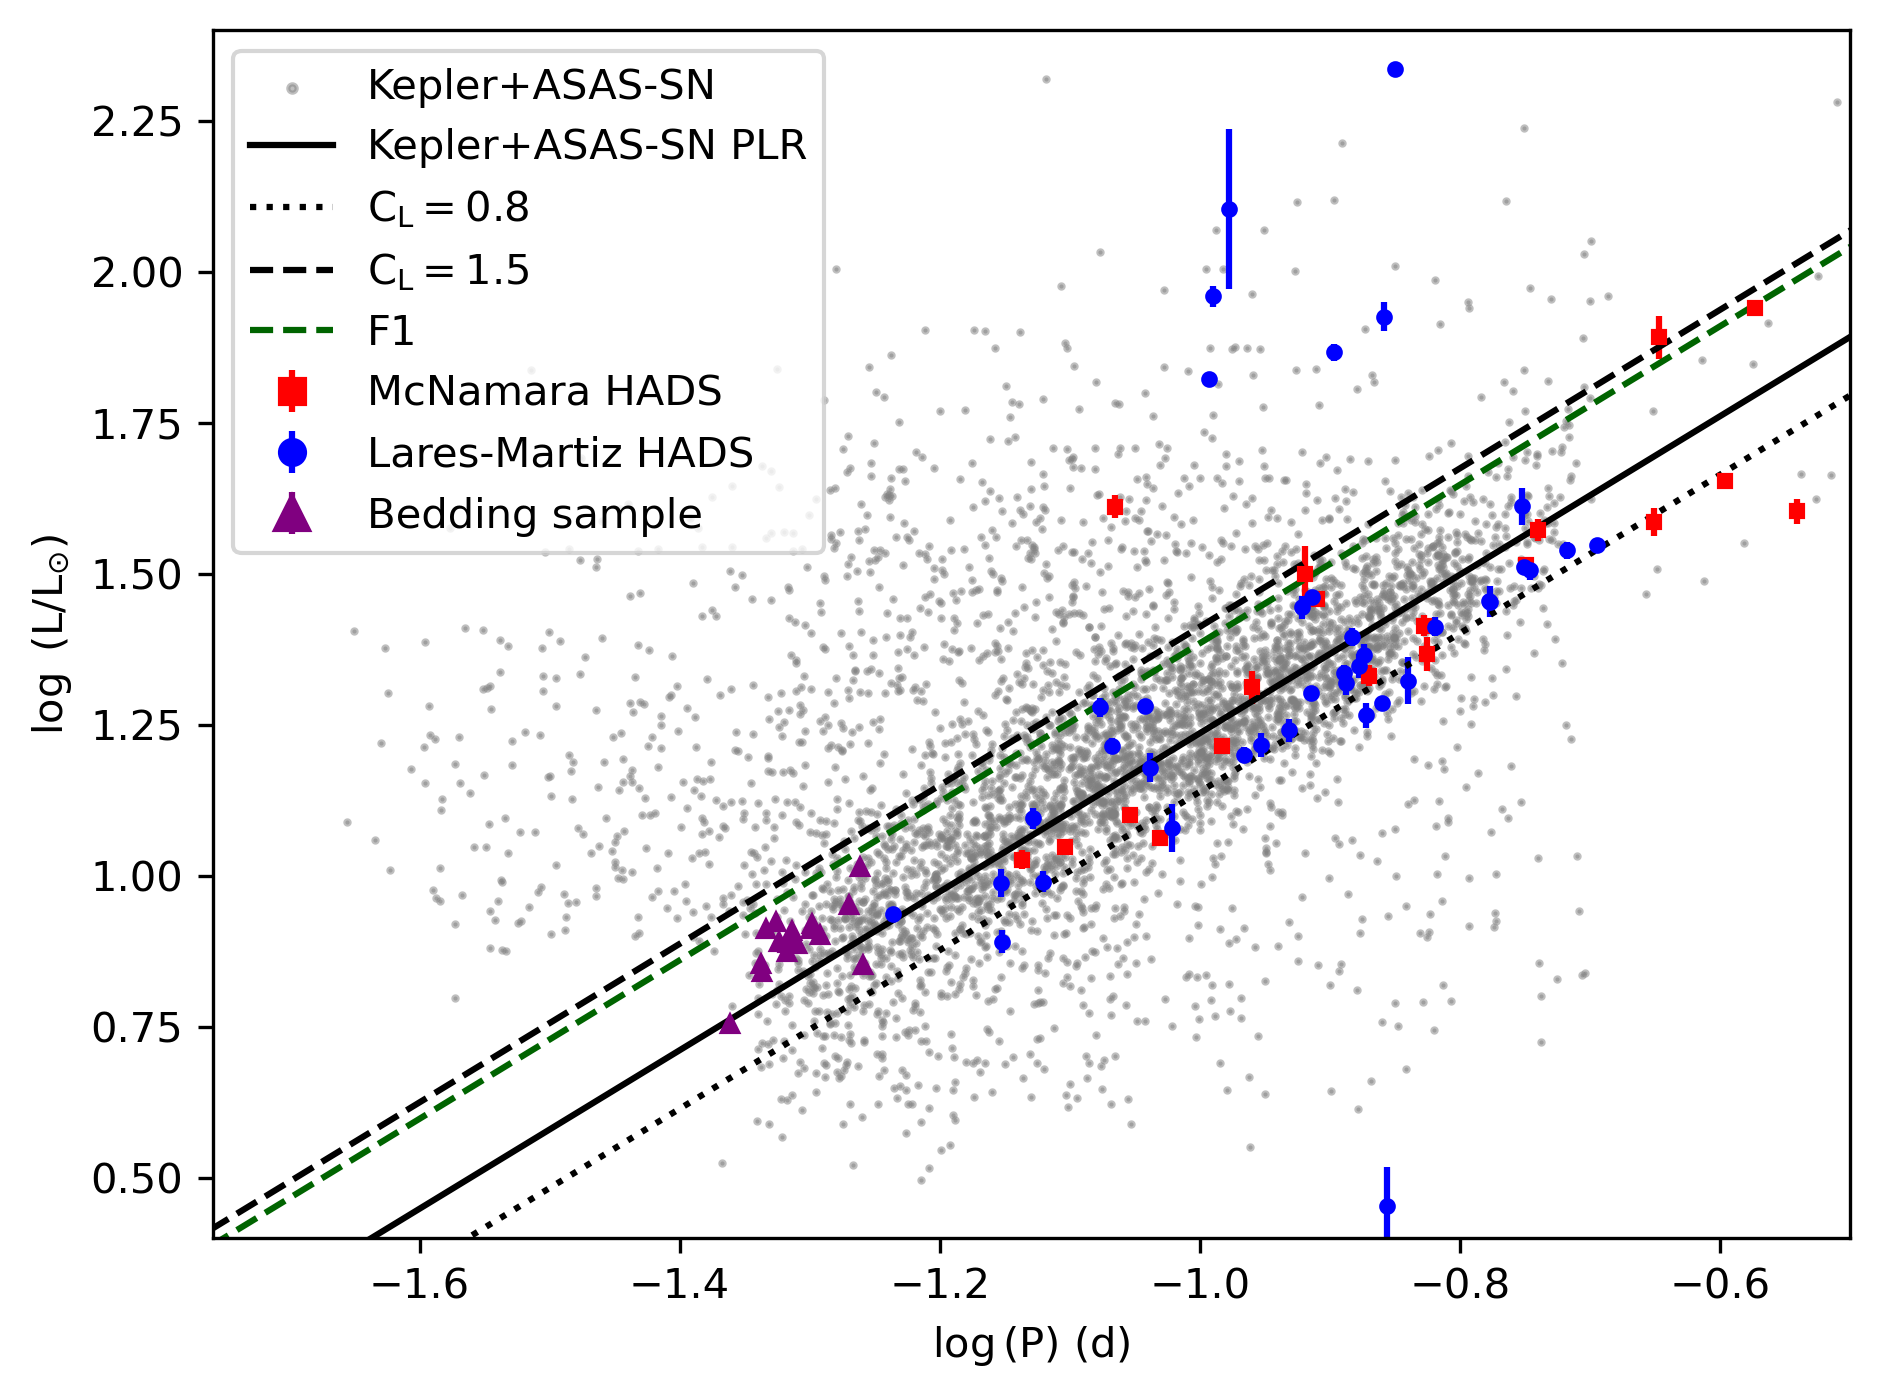
To show the possible impact of not taking into account the gravity darkening, we have used the two limiting cases, i.e., the highest rotation rate possible but with the line of sight at 0∘ (pole-on) or 90∘ (equator-on). In these cases, the luminosity can be higher by up to 50% or lower by up to 20%, respectively (Paxton et al., 2019). The angle at which the projected luminosity is equal to the real luminosity is approximately 55∘, meaning that it is slightly more probable to find a star with higher projected luminosity (supposing randomly distributed inclinations). All this is shown in Figure 3. We plot our PLR and also the limits of the projected luminosity, , over the diagram with the samples. Clearly, the gravity darkening can explain the broader region observed in our large sample of more than 4000 stars. Moreover, if we estimate the first overtone period (P1) based on P1/P0 0.77, then we also see in the figure that there exists overlapping between the pole-on case and that overtone, depicted as a dashed green line. This translates into difficulty in getting a reliable mode identification, even for the fundamental mode. The only way to overcome this problem is to derive the unprojected stellar rotational velocity, something hard to get even with asteroseismology (see, for example, Ramon-Ballesta et al., 2021).
4.1 The relation
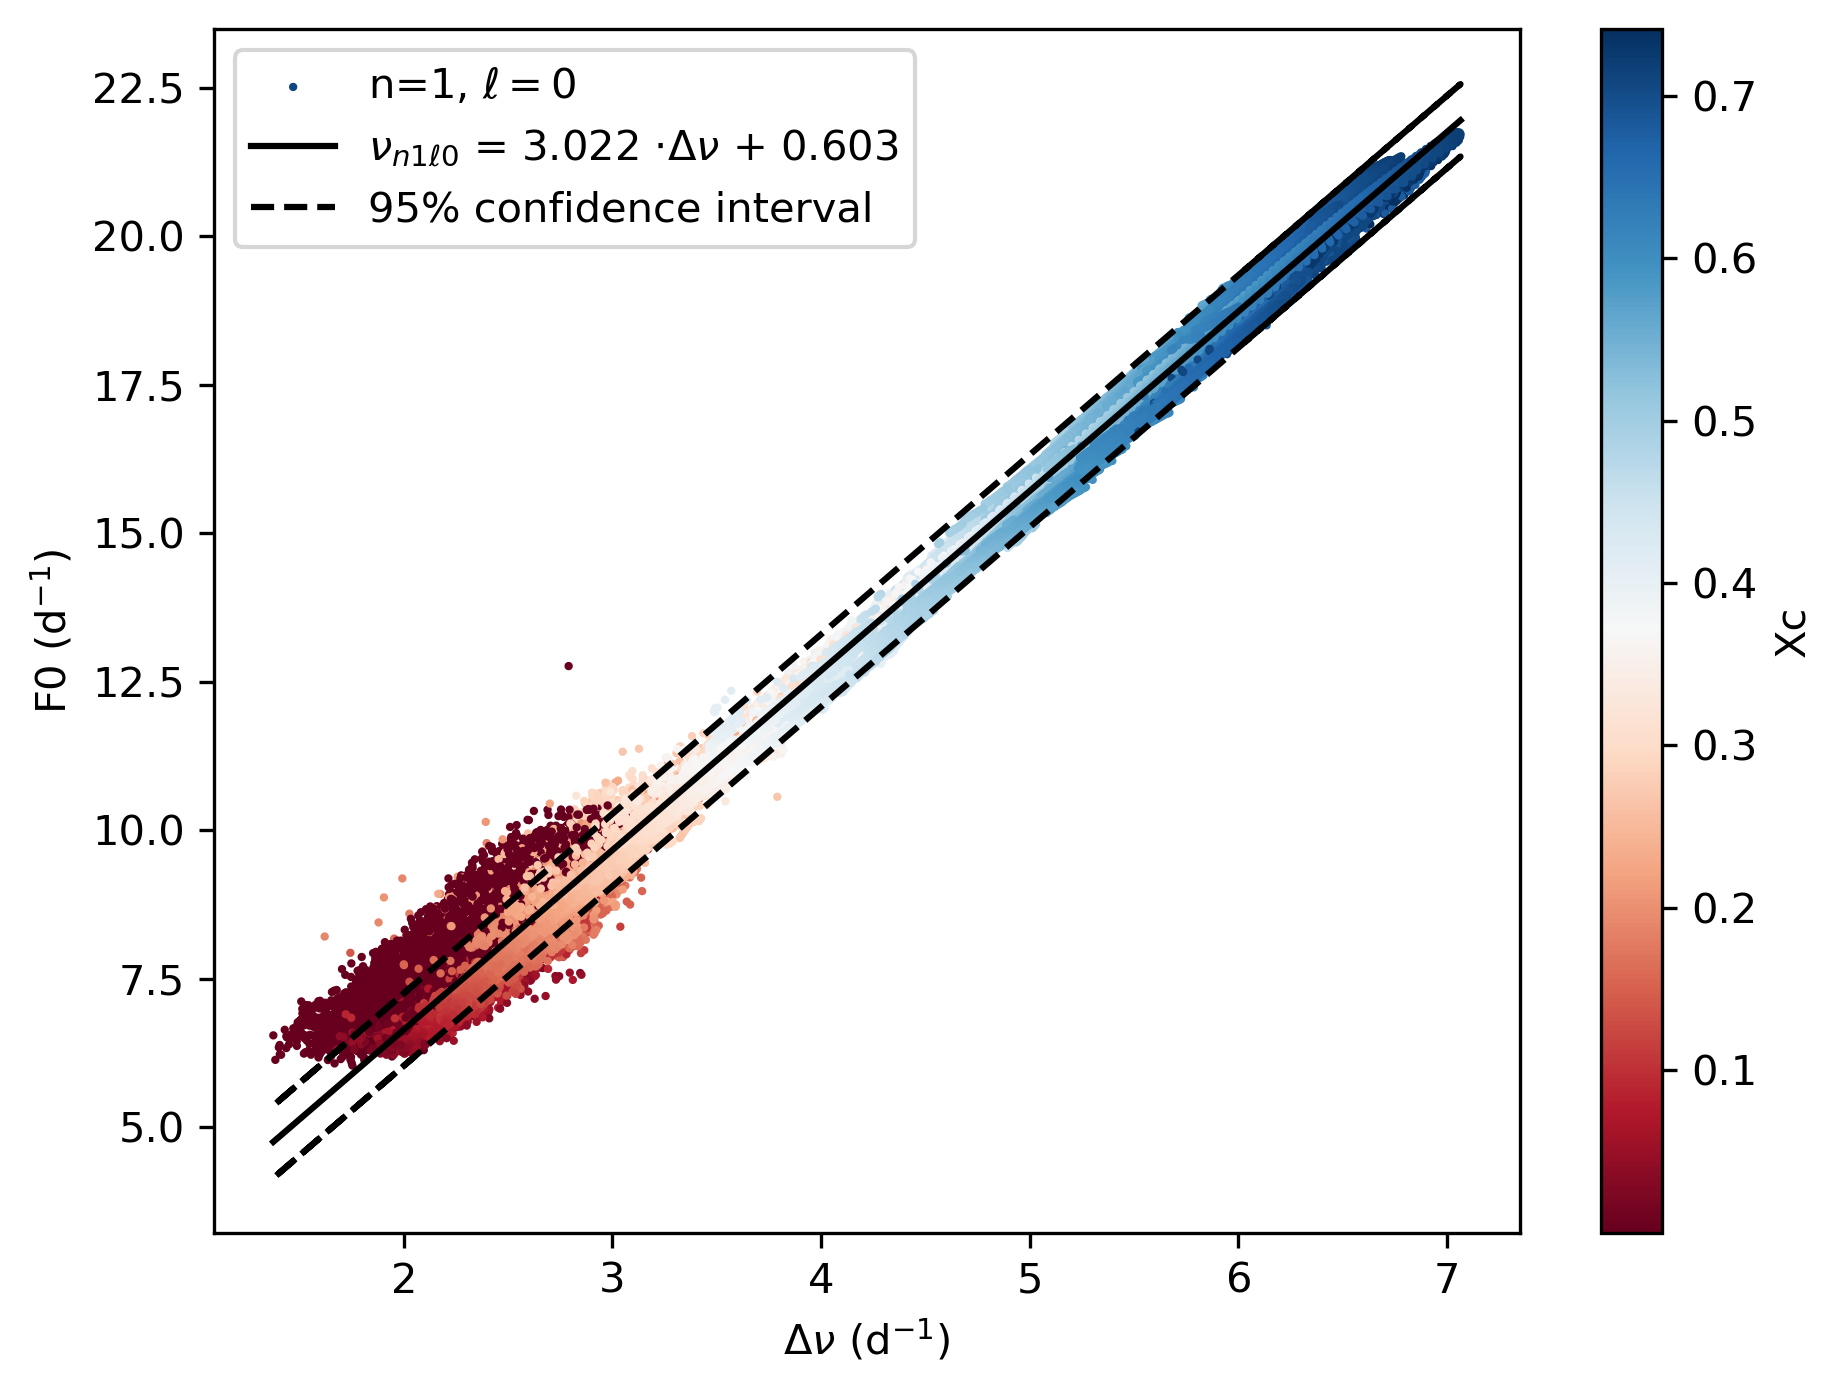
Apart from dealing with gravity darkening, positioning a particular star in the PLR means a correct identification of the fundamental radial mode. Because both the low-order large separation and P0 are directly related to the stellar mean density (García Hernández et al., 2015, 2017), a direct relation between both quantities is also likely. To check that, we have used the rotating equilibrium and pulsation models by Rodríguez-Martin et al. (2020) to look for such a relation. Figure 4 shows the results. In this figure, we have plotted the fundamental mode frequency (F0) as a function of the low-order large separation () for the models in the observational instability strip of Sct stars, as found by Murphy et al. (2019). A tight linear fit is clearly seen, with some scatter in the most evolved stages that correspond to the lowest values of F0 and . The deviation from the relation is somewhat expected in the models since the stars at those stages are quite evolved, probably indicating that they are not even Sct pulsators. A closer inspection of these models with non-adiabatic calculations of the oscillation frequencies would be necessary to confirm their mode stability.
The result of the fit in is:
| (2) |
with and a standard deviation of the residuals equal to . There have been previous experimental determinations of a relation (Jayasinghe et al., 2020; Bedding et al., 2020). Our fit is not very different from others, although it is much more robust. The difficulties in determining the correct fundamental mode and have hampered the use of this relation in the past.
4.2 Towards a fundamental mode identification
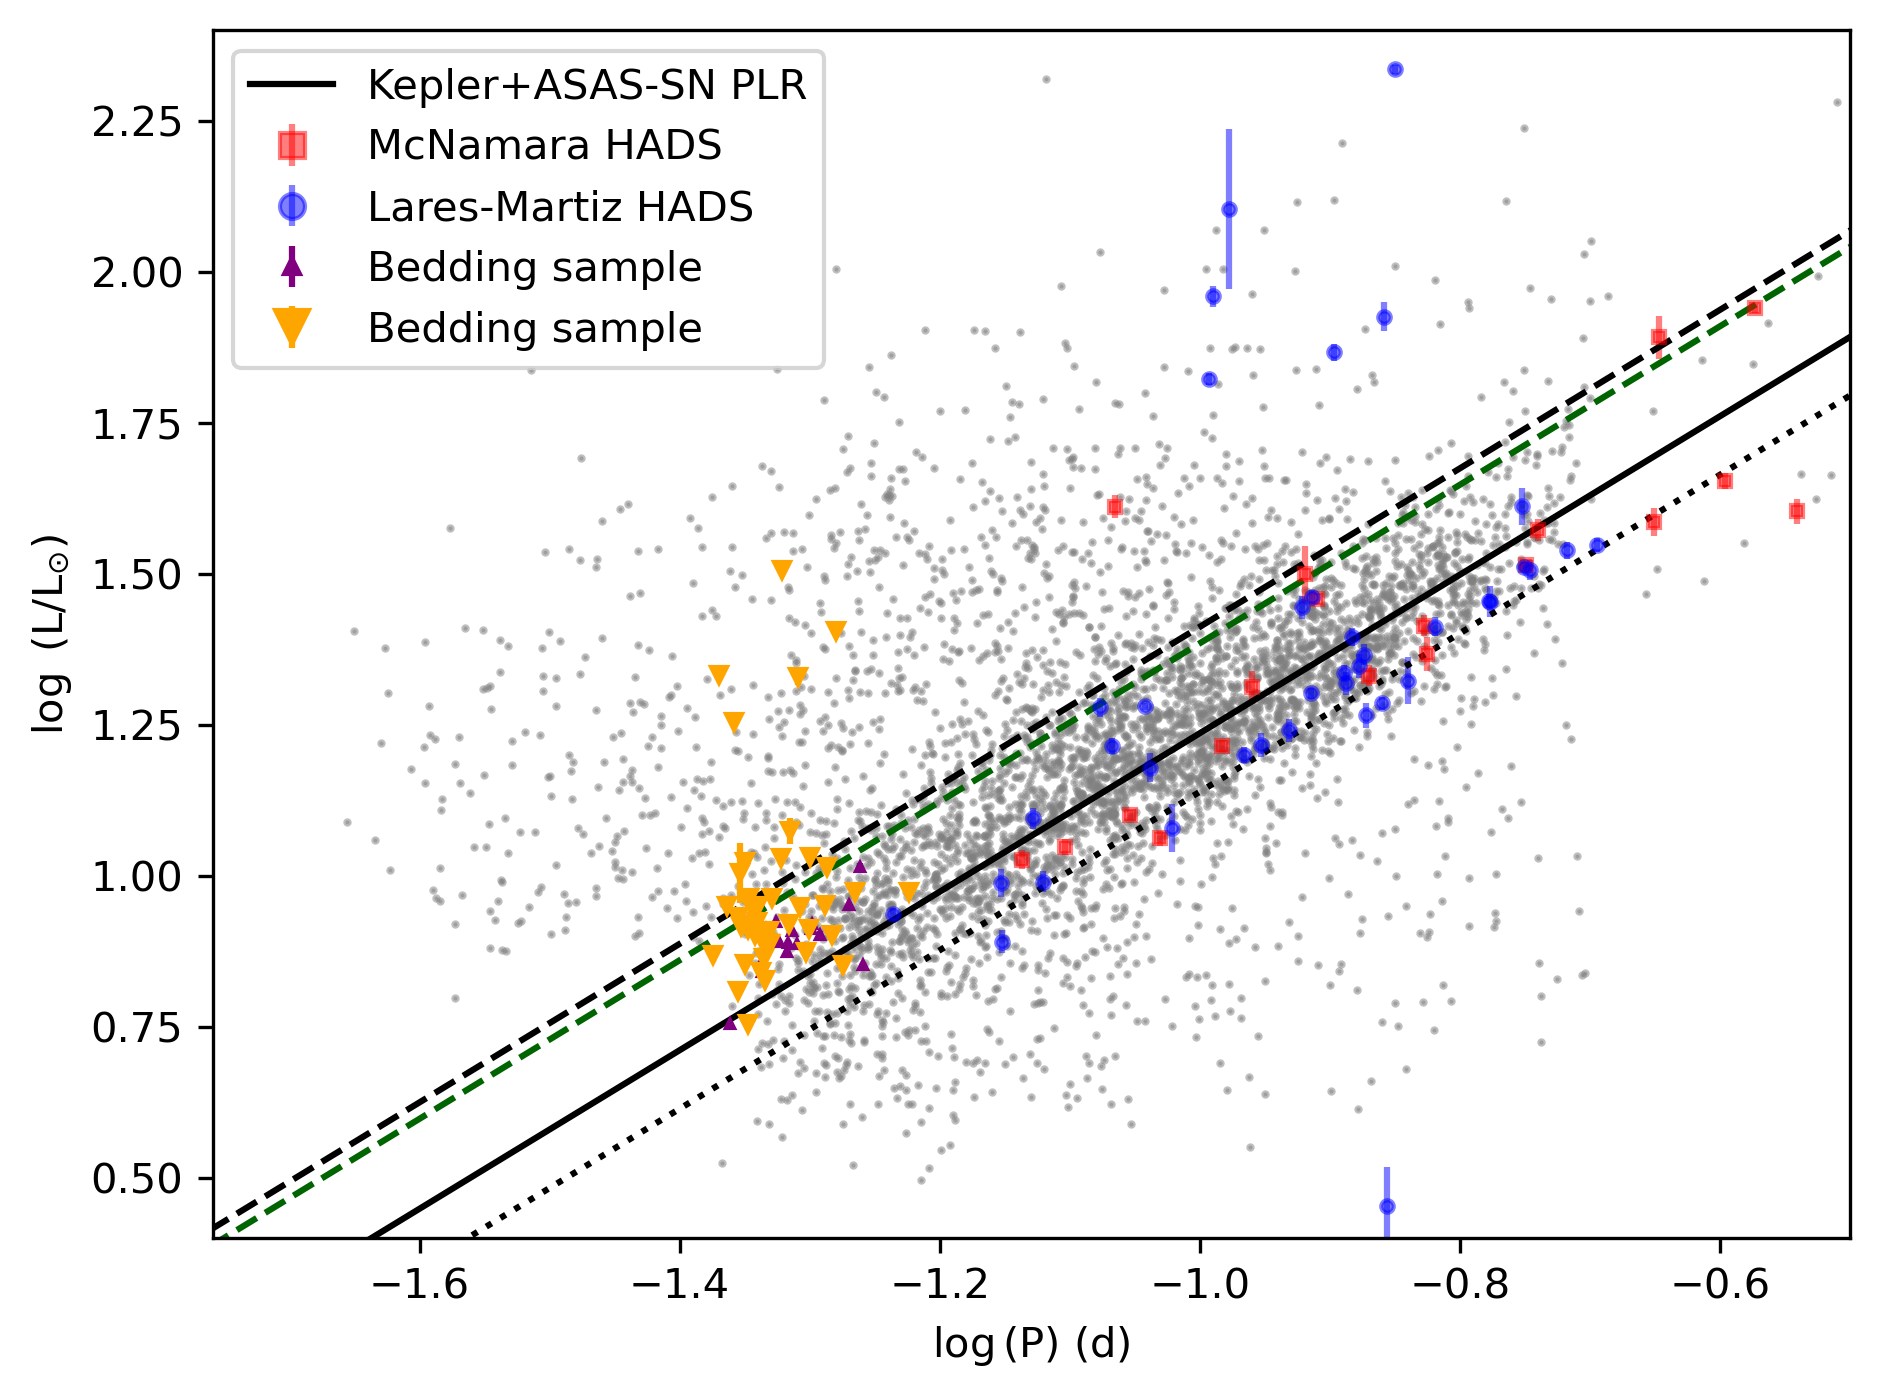
One may consider using the relations we present here to derive P0 knowing , but the large separation has only been determined for a handful of Sct. The larger sample to date is that of Bedding et al. (2020). They were able to find for 60 young Sct stars, for which the pattern of the large separation is clearer. They also identified the fundamental mode for some of them, which are the stars depicted in Figure 1 as purple triangles. We tried to check the validity of their mode identification and complete it for those stars without an F0 determination in Bedding et al. (2020).
Using equation (2), we computed new F0 values based on the provided . Figure 5 shows a similar plot to Figure 3, but with the computed F0 as yellow triangles. Most of our determined fundamental modes are in agreement with those found by Bedding et al. (2020), with some slight differences coming from a non-perfect fit (included in the uncertainties). However, for some stars showing higher luminosities, F0 does not seem to be correctly determined: a complete description thus requires a better understanding of the selection mechanism. While our models predict fundamental modes corresponding to luminosities above and below the PLR, observations only populate the region close to it. These results point to the impossibility of populating the PLR with new, isolated stars using just . However, it appears that only stars in which the fundamental mode is actually excited lie close to the PLR: if this holds true, a detailed study of the stars with a detectable fundamental mode at F0 might be of interest to shed light on the selection mechanism, which has remained evasive even with the advances permitted by recent space missions.
5 Conclusions
We have derived a new PLR for Sct stars by utilizing a sample of around 4000 such stars from ASAS-SN and Kepler data. Our relation is consistent with previous determinations. We have also brought out that gravity darkening plays a significant role in causing the broadening effect within the PLR. This broadening includes the predicted position of the first overtone, hampering the identification of both F0 and F1.
We have derived a theoretical relation that is compatible with previous observations, demonstrating its robustness even in the presence of rotation. Using this relation to guess F0 does not help to get a more constrained PLR. Only in the cases when the fundamental mode is excited (i.e., detected in the frequency spectrum) does it place the pulsator close to the PLR. This observational fact provides valuable insights into the excitation and mode selection processes.
There also seems to be an internal process related to mode selection that favours the high-amplitude peak being associated with the fundamental mode in the majority of Sct stars, as suggested by the broader region of the PL diagram that forms the PLR. This might offer valuable clues for further investigations into their excitation mechanisms and mode selection processes.
Acknowledgements.
The authors acknowledge T. Bedding for allowing the use of the F0 values from his 2020 publication. AGH acknowledges funding support from ‘FEDER/junta de Andalucía-Consejería de Economía y Conocimiento’ under project E-FQM-041-UGR18 by Universidad de Granada. JPG and MLM acknowledge financial support from project PID2019-107061GB-C63 from the ‘Programas Estatales de Generación de Conocimiento y Fortalecimiento Científico y Tecnológico del Sistema de I+D+i y de I+D+i Orientada a los Retos de la Sociedad’ and from the grant CEX2021-001131-S funded by MCIN/AEI/10.13039/501100011033. AGH, JCS, GMM and SBF acknowledge funding support from the Spanish State Research Agency (AEI) project PID2019-107061GB-064. Funding for open access charge: Universidad de Granada.References
- Aerts et al. (2010) Aerts, C., Christensen-Dalsgaard, J., & Kurtz, D. W. 2010, Asteroseismology (Dordrecht: Springer)
- Auvergne et al. (2009) Auvergne, M., Bodin, P., Boisnard, L., et al. 2009, A&A, 506, 411
- Balona (2010) Balona, L. A. 2010, Challenges in Stellar Pulsation (Sharjah: Bentham Science Publishers)
- Barac et al. (2022) Barac, N., Bedding, T. R., Murphy, S. J., & Hey, D. R. 2022, MNRAS, 516, 2080
- Barceló Forteza et al. (2017) Barceló Forteza, S., Roca Cortés, T., García Hernández, A. ,& García, R. A. 2017, A&A, 601, A57
- Barceló Forteza et al. (2018) Barceló Forteza, S., Roca Cortés, T., & García, R. A. 2018, A&A, 614, A46
- Barceló Forteza et al. (2020) Barceló Forteza, S., Moya, A., Barrado, D., et al. 2020, A&A, 638, A59
- Bedding et al. (2020) Bedding, T. R., Murphy, S. J., Hey, D. R., et al. 2020, Nature, 581, 147
- Breger (1979) Breger, M. 1979, PASP, 91, 5
- Breger et al. (1999) Breger, M., Pamyatnykh, A. A., Pikall, H., & Garrido, R. 1999, A&A, 341, 151
- Chang et al. (2013) Chang, S.-W., Protopapas, P., Kim, D.-W., & Byun, Y.-I. 2013, AJ, 145, 132
- Cohen & Sarajedini (2012) Cohen, R. E., & Sarajedini, A. 2012, MNRAS, 419, 342
- Corsaro et al. (2012) Corsaro, E., Stello, D., Huber, D., et al. 2012, ApJ, 757, 190
- Deka et al. (2022) Deka, M., Kanbur, S. M., Deb, S., et al. 2022, MNRAS, 517, 2251
- De Franciscis et al. (2018) De Franciscis, S., Pascual-Granado, J., Suárez, J. C., et al. 2018, MNRAS, 481, 4637
- De Ridder et al. (2022) De Ridder, J., Ripepi, V., Aerts, C., et al. 2022, A&A, 50
- Espinosa Lara & Rieutord (2011) Espinosa Lara, F., & Rieutord, M. 2011, A&A, 533, A43
- Fernie (1964) Fernie, J. D. 1964, ApJ, 140, 1482
- Fouesneau et al. (2023) Fouesneau, M., Frémat, Y., Andrae, R., et al. 2023, A&A, 674, A28
- García Hernández et al. (2009) García Hernández, A., Moya, A., Michel, E., et al. 2009, A&A, 506, 79
- García Hernández et al. (2013) García Hernández, A., Moya, A., Michel, E., et al. 2013, A&A, 559, A63
- García Hernández et al. (2015) García Hernández, A., Martín-Ruiz, S., Monteiro, M. J. P. F. G., et al. 2015, ApJ, 811, L29
- García Hernández et al. (2017) García Hernández, A., Suárez, J. C., Moya, A., et al. 2017, MNRAS, 471, L140
- Garg et al. (2010) Garg, A., Cook, K. H., Nikolaev, S., et al. 2010, AJ, 140, 328
- Handler et al. (1997) Handler, G., Pikall, H., O’Donoghue, D., et al. 1997, MNRAS, 286, 303
- Hasanzadeh et al. (2021) Hasanzadeh, A., Safari, H., & Ghasemi, H. 2021, MNRAS, 505, 1476
- Jayasinghe et al. (2018) Jayasinghe, T., Kochanek, C. S., Stanek, K. Z. , et al. 2018, MNRAS, 477, 3145
- Jayasinghe et al. (2020) Jayasinghe, T., Stanek, K. Z., Kochanek, C. S., et al. 2020, MNRAS, 493, 4186
- Koch et al. (2010) Koch, D. G., Borucki, W. J., Basri, G., et al. 2010, ApJ, 713, L79
- Leavitt (1908) Leavitt, H. 1908, Annals of Harvard College Observatory, 60, 87
- Lares-Martiz et al. (2020) Lares-Martiz, M., Garrido, R., & Pascual-Granado, J. 2020, MNRAS, 498, 1194
- Lares-Martiz (2022) Lares-Martiz, M. 2022, Frontiers in Astronomy and Space Sciences, 9, 301
- Martínez-Vázquez et al. (2022) Martínez-Vázquez, C. E., Salinas, R., Vivas, A. K., & Catelan, M. 2022, ApJ, 940, L25
- McNamara (2011) McNamara, D. H. 2011, AJ, 142, 110
- Michel et al. (2017) Michel, E., Dupret, M.-A., Reese, D. R., et al. 2017, EPJ Web of Conferences, 160, 03001
- Mirouh et al. (2019) Mirouh, G. M., Angelou, G. C., Reese, D. R., & Costa, G. 2019, MNRAS, 483, L28
- Moya et al. (2017) Moya, A., Suárez, J. C., García Hernández, A., & Mendoza, M. A. 2017, MNRAS, 471, 2491
- Murphy et al. (2019) Murphy, S. J., Hey, D. R., Van Reeth, T., & Bedding, T. R. 2019, MNRAS, 485, 2380
- Ouazzani et al. (2015) Ouazzani, R.-M., Roxburgh, I. W., & Dupret, M.-A. 2015, A&A, 579, A116
- Owens et al. (2022) Owens, K. A., Freedman, W. L., Madore, B. F., & Lee, A. J. 2022, ApJ, 927, 8
- Paparó et al. (2016) Paparó, M., Benkő, J. M., Hareter, M., & Guzik, J. A. 2016, ApJS, 224, 41
- Pascual-Granado et al. (2015) Pascual-Granado, J., Garrido, R., & Suárez, J. C. 2015, A&A, 581, A89
- Pascual-Granado et al. (2018) Pascual-Granado, J., Suárez, J. C., Garrido, R., et al. 2018, A&A, 614, A40
- Paxton et al. (2019) Paxton, B., Smolec, R., Schwab, J., et al. 2019, ApJS, 243, 10
- Poleski et al. (2010) Poleski, R., Soszyński, I., Udalski, A., et al. 2010, AcA, 60, 179
- Poro et al. (2021) Poro, A., Paki, E., Mazhari, G., et al. 2021, PASP, 133, 084201
- Ramon-Ballesta et al. (2021) Ramón-Ballesta, A., García Hernández, A., Suárez, J. C., et al., 2021 MNRAS, 505, 6217
- Reese et al. (2008) Reese, D. R., Lignières, F., & Rieutord, M. 2008, A&A, 481, 449
- Ricker et al. (2014) Ricker, G. R., Winn, J. N., Vanderspek, R., et al. 2014, Journal of Astronomical Telescopes, Instruments, and Systems, 1, 014003
- Rodríguez & Breger (2001) Rodríguez, E., & Breger, M. 2001, A&A, 366, 178
- Rodríguez-Martin et al. (2020) Rodríguez-Martín, J. E., García Hernández, A., Suárez, J. C. & Rodón, J. R. 2020, MNRAS, 498, 1700
- Royer et al. (2007) Royer, F., Zorec, J., & Gómez, A. E. 2007, A&A, 463, 671
- Soszyński et al. (2021) Soszyński, I., Pietrukowicz, P., Skowron, J., et al. 2021, AcA, 71, 189
- Suárez et al. (2014) Suárez, J. C., García Hernández, A., Moya, A., et al. 2014, A&A, 563, A7
- Walker et al. (2003) Walker, G., Matthews, J., Kuschnig, R., et al. 2003, PASP, 115, 1023
- Wenger et al. (2000) Wenger, M., Ochsenbein, F., Egret, D., et al. 2000, A&AS, 143, 9
- Xue et al. (2022) Xue, H.-F., Niu, J.-S., & Fu J.-N. 2022, Research in Astronomy and Astrophysics, 22, 105006
- Ziaali et al. (2019) Ziaali, E., Bedding, T. R., Murphy, S. J., et al. 2019, MNRAS, 486, 4348
- Zwintz et al. (2011) Zwintz, K., Lenz, P., Breger, M., et al. 2011, A&A, 533, A133