RRAT J19131330: an extremely variable and puzzling pulsar
Abstract
Rotating Radio Transients (RRATs) are neutron stars that emit sporadic radio bursts. We detected 1955 single pulses from RRAT J19131330 using the 19-beam receiver of the Five-hundred-meter Aperture Spherical Radio Telescope (FAST). These pulses were detected in 19 distinct clusters, with 49.4% of them occurring sequentially with a waiting time of one rotation period. The energy distribution of these individual pulses exhibited a wide range, spanning three orders of magnitude, reminiscent of repeating fast radio bursts (FRBs). Furthermore, we observed abrupt variations in pulse profile, width, peak flux, and fluence between adjacent sequential pulses. These findings suggest that this RRAT could be interpreted as pulsars with extreme pulse-to-pulse modulation. The presence of sequential pulse trains during active phases, along with significant pulse variations in profile, fluence, flux, and width, should be intrinsic to a subset of RRATs. Our results indicate that J1913+1330 represents a peculiar source that shares certain properties with populations of nulling pulsars, giant pulses, and FRBs from different perspectives. The dramatic pulse-to-pulse variation observed in J1913+1330 could be attributed to unstable pair creation above the polar cap region and the variation of the site where streaming pairs emit coherently. Exploring a larger sample of RRATs exhibiting similar properties to J1913+1330 has the potential to significantly advance our understanding of pulsars, RRATs, and FRBs.
1 Introduction
Since McLaughlin et al. (2006) reported the discovery of 11 Rotating Radio Transients (RRATs), only around 100 such events are known until now 111See http://astro.phys.wvu.edu/rratalog.. RRATs were identified by their sporadic radio bursts. Unlike the repeating Fast Radio Bursts(FRBs), which have been localized to extragalactic sources, RRATs are believed to originate from within the Milky Way based on their dispersion measures (DMs). By assuming the existence of underlying periodicities, periods can be derived by calculating the greatest common divisor of the time intervals between burst arrivals. Most RRATs are expected to have periods of around one second, which aligns with typical rotation periods of neutron stars.
Reynolds et al. (2006) reported the identification of a soft X-ray counterpart exhibiting thermal emission at 140 eV for RRAT J18191458. This finding suggested a cooling neutron star as the central engine of the RRAT. Furthermore, the high inferred brightness temperatures and plausible period increases (McLaughlin et al., 2009) have led to the general belief that RRATs are a special type of pulsar. It is worth noting that some regular pulsars affected by intense radio frequency interference (RFI) or severe scintillation could be identified as RRATs if the initial observations do not have a sufficiently long search duration (Burke-Spolaor & Bailes, 2010).
However, the sporadic emission behaviour of the majority of RRATs require new theories to explain. While some researchers have proposed that RRATs constitute a new population of pulsars (McLaughlin et al., 2006; Keane & Kramer, 2008; McLaughlin et al., 2009), RRATs can be more readily interpreted as extreme nulling pulsars that are only active for less than a single pulse period (Burke-Spolaor & Bailes, 2010; Burke-Spolaor, 2013), or as pulsars with extreme pulse-to-pulse modulation, with their normal emissions falling below the sensitivity thresholds of current telescopes (Weltevrede et al., 2006).
RRAT J19131330, originally known as J19131333, is one of the initial RRAT discoveries (McLaughlin et al., 2006). The period () and spin-down properties of J1913+1330 resemble those of typical radio pulsars, with s, a surface magnetic field of 2.8 G, and a spin-down energy loss rate of 4.2 erg s-1 (McLaughlin et al., 2009; Bhattacharyya et al., 2018). Over the decade following its discovery, only sporadic individual pulses were detected, with an event rate of only a few per hour (McLaughlin et al., 2006, 2009; Palliyaguru et al., 2011; Shapiro-Albert et al., 2018; Caleb et al., 2019), which is a typical RRAT behaviour. However, recent observations have revealed a weak persistent emission mode followed by a prolonged nulling phase for this source (Bhattacharyya et al., 2018; Lu et al., 2019). The average pulses rate of the weak persistent mode is , with an average flux roughly 50 times fainter than the strong RRAT pulses. Interestingly, no strong RRAT pulses were detected during the weak persistent mode, suggesting the presence of two distinct emission modes in J19131330: a weak persistent mode similar to that of normal pulsars, and a typical RRAT pulse mode. This behaviour has never been found in other RRATs (Bhattacharyya et al., 2018), but resembles that of certain pulsars known to undergo mode change (Young et al., 2015) or exhibit giant pulses (Kuzmin, 2007).
In this paper, we present the detection and analysis of numerous individual pulses from J19131330 using the Five-hundred-meter Aperture Spherical radio Telescope (FAST) (Jiang et al., 2019), currently the most sensitive radio instrument operating at L band. The observation details and data analysis are described in Section 2. Section 3 presents the properties of the detected pulses, while Section 4 offers a discussion of our findings. Finally, we conclude in Section 5.
2 Observation and Data Analysis
To investigate the detailed emission properties of J19131330, we conducted a series of five observations using the FAST telescope (Jiang et al., 2019) on August 17, December 16 and 25 of 2019, September 27 of 2021, and January 14 of 2022, totalling 8.9 hr. We used the 19-beam receiver, which covers a frequency range of 10001500 MHz with 4096 channels. The channelized signals were recorded using the Reconfigurable Open Architecture Computing Hardware generation 2 (ROACH 2, Hickish et al., 2016) and sampled at 8-bit, stored in the PSRFITS search mode formatHotan et al. (2004). The sample time was set to 49.153s. During the observations, on August 17, we observed J19131330 for 0.9 hr using all 19 beams and two polarizations. For the remaining observations, signals were recorded only from the central beam of the multibeam receiver, but with four polarizations. The observation durations for December 16 and 25 of 2019, September 27 of 2021, and January 14 of 2022 were 3.0, 1.5, 1.6, and 1.9 hr, respectively. Prior to each observation, a 10K equivalent noise switched calibration signal was recorded to enable calibration of the results.
The data collected from the FAST radio telescope were processed using two individual search pipelines based on two pulsar/FRB single pulse searching packages: presto222http://www.cv.nrao.edu/~sransom/presto/ (Ransom, 2001) and heimdall333https://sourceforge.net/projects/heimdall-astro/. In both pipelines, the data sets were dedispersed in a range of DM values from 165 to 185 cmpc, with a step size of cm-3. Single pulse candidates with signal-to-noise ratio (S/N) greater than seven were recorded and visually inspected. A candidate was identified as a detected pulse if it had an S/N above seven in presto or heimdall and showed a plausible sweep in the de-dispersed frequency-time plane.
To scale our data to units, we utilized the 10K equivalent noise switched calibration signal prior to each observation. We calibrated the flux density () of single pulses from Kelvin units to mJy by considering the zenith angle-dependent gain of the FAST telescope. This gain can be estimated using a function derived from observations of stable radio sources (Jiang et al., 2020). The standard deviation of the applied gains consistently remains around 3% for all detections, with a maximum variation of approximately 14%. For the majority of clusters, the pulses were calibrated using gains of around . This is because nearly 90% of our pulses were detected at zenith angles below 26.4 degrees, corresponding to a stable gain. To compute the fluence (), we integrated the pulse flux above the baseline, while the effective width () was determined by dividing the fluence by the pulse peak flux ().
Our polarization data collected on MJD 58833, 58842, 59484 and 59593 were calibrated using the psrchive software package (van Straten et al., 2012). The differential gain and phase between the receivers were corrected using the noise diode signal injected prior to each observation. We measure the rotation measures (RMs) for pulses with S/N using the rmfit program to search for a peak in the linearly polarized flux (), in the range of RM values from to 1000 rad m2, with a step size of rad m2.
3 Results
3.1 Single pulses detection
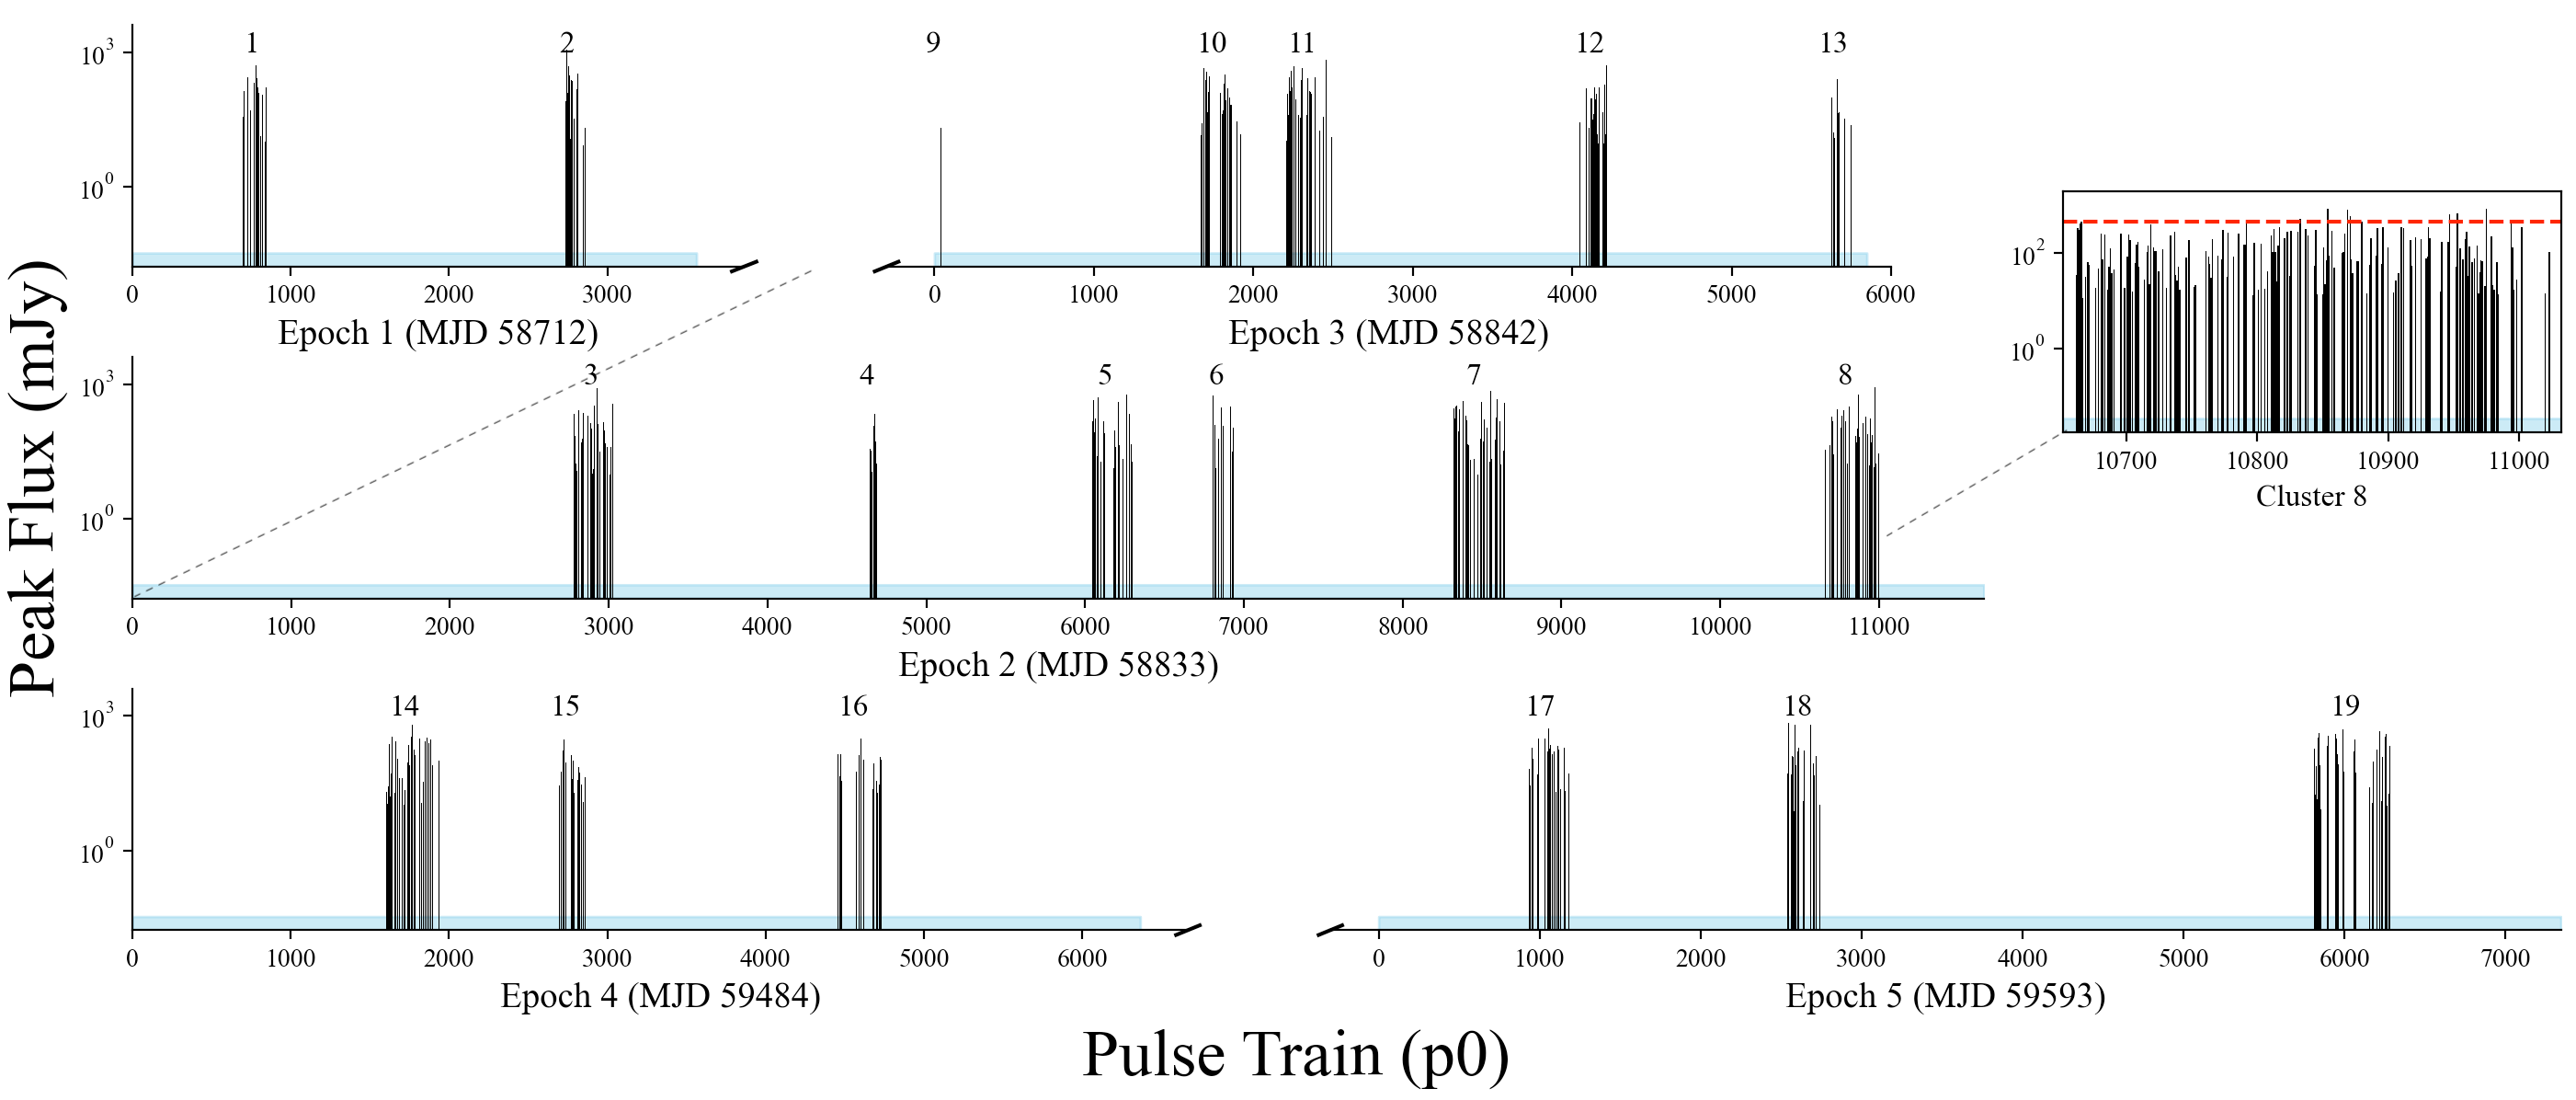
During a total of 8.9 hr of observations, we detected 1955 individual pulses, corresponding to a pulse rate of . Hereinafter we refer to the observation segment containing pulse clusters as the active phase. The pulses detected during the active phases formed 19 pulse clusters, as illustrated in Figure 1. These active phases lasted from to min (equivalent to ), with nulling phases between them ranging from to min (equivalent to ). Cluster 9 was detected 37 s after the start of the observation, so our observation may only cover the end of this active phase, resulting in the detection of only one burst in this cluster. For other clusters, whose active phases were fully covered, the number of pulses varied from 23 to 211.
Among the detected pulses, 49.4% were sequential with a waiting time of . We estimated the pulse-on fraction of the active phase to be . The effective width, peak flux and fluence of the single pulses ranged from 0.15 to 17.29 ms, 0.006 to 1.84 Jy and 0.004 to 5.13 Jy ms, respectively. The brightest pulse reached a peak flux close to the previously observed maximum of 2.04 Jy (McLaughlin et al., 2009). Out of the 1955 detected pulses, 103 pulses had peak fluxes above the reported average peak flux of 460 mJy from J19131330 (McLaughlin et al., 2009), and we will refer to these as “strong pulse” hereafter. The duration, number of detected pulses, number of strong pulses, minimum fluence (), maximum fluence () and the maximum fluence contrast (/) are listed in Table 1.
| Cluster/Epoch | Duration | Number of | Strong pulses | Maximum contrast | ||
| number | (a ) | pulses | ( 460 mJy) | (Jy ms) | (Jy ms) | / |
| Cluster 1 | 228 | 80 | 7 | 0.0223 | 3.2548 | 145.8 |
| Cluster 2 | 123 | 61 | 6 | 0.0088 | 2.1179 | 240.5 |
| Epoch 1 | 351 | 141 | 13 | 0.0088 | 3.2548 | 368.6 |
| Cluster 3 | 331 | 144 | 7 | 0.0143 | 5.1147 | 357.9 |
| Cluster 4 | 68 | 23 | 3 | 0.0159 | 3.4496 | 216.1 |
| Cluster 5 | 270 | 110 | 7 | 0.0154 | 2.6569 | 172.2 |
| Cluster 6 | 153 | 77 | 7 | 0.0164 | 2.8707 | 175.1 |
| Cluster 7 | 360 | 170 | 7 | 0.0046 | 4.0148 | 878.8 |
| Cluster 8 | 362 | 161 | 7 | 0.0274 | 2.5016 | 91.3 |
| Epoch 2 | 1544 | 685 | 38 | 0.0046 | 5.1147 | 1119.9 |
| Cluster 9 | - | 1 | - | 0.0836 | 0.0836 | - |
| Cluster 10 | 254 | 103 | 8 | 0.0260 | 3.6239 | 139.5 |
| Cluster 11 | 313 | 138 | 4 | 0.0162 | 2.1370 | 132.1 |
| Cluster 12 | 232 | 108 | 8 | 0.0093 | 3.0279 | 326.2 |
| Cluster 13 | 123 | 45 | 4 | 0.0206 | 2.5151 | 122.2 |
| Epoch 3 | 922 | 395 | 24 | 0.0093 | 3.6239 | 390.4 |
| Cluster 14 | 335 | 152 | 3 | 0.0039 | 1.4696 | 370.4 |
| Cluster 15 | 219 | 88 | 0 | 0.0056 | 1.4948 | 267.0 |
| Cluster 16 | 316 | 88 | 1 | 0.0111 | 2.4326 | 219.3 |
| Epoch 4 | 870 | 328 | 4 | 0.0039 | 2.4326 | 613.2 |
| Cluster 17 | 251 | 106 | 7 | 0.0131 | 2.4368 | 186.1 |
| Cluster 18 | 229 | 89 | 8 | 0.0135 | 3.3578 | 248.0 |
| Cluster 19 | 495 | 211 | 9 | 0.0076 | 3.5474 | 467.0 |
| Epoch 5 | 975 | 406 | 24 | 0.0076 | 3.5474 | 467.0 |
| Full sample | 4662 | 1955 | 103 | 0.0039 | 5.1147 | 1289.3 |
-
a
The duration lengths presented here are given in units of the rotating period () of J1913+1330 during each observation.
3.2 Nulling phase limit
Between the active phases, there are quiescent nulling phases, as shown in Figure 1. We added the nulling phases of each observation to obtain the integrated pulse. However, no convincing candidate with an S/N greater than seven was detected. Limits on the phase-average flux density can be estimated as:
| (1) |
where is the system temperature, is the telescope antenna gain, MHz is the observing bandwidth, is the sum of polarizations, is the integration time, is the pulse duty cycle (defined as the ratio of the pulse width to the period, and estimated by the pulse-on segments integrated profile to be 6 ms/923 ms 0.006), and is set to 7.0.
For the longest observation in our dataset (Epoch 2), which encompassed a total nulling phase time of approximately 9343 s, we obtained limits on the mean flux density, peak flux density, and fluence of approximately Jy, Jy and Jy ms, respectively. The peak flux and fluence are approximately 194 and 20 times fainter than the smallest values of the detected pulses, indicating the absence of pulses during the nulling phases.
3.3 DM & RM
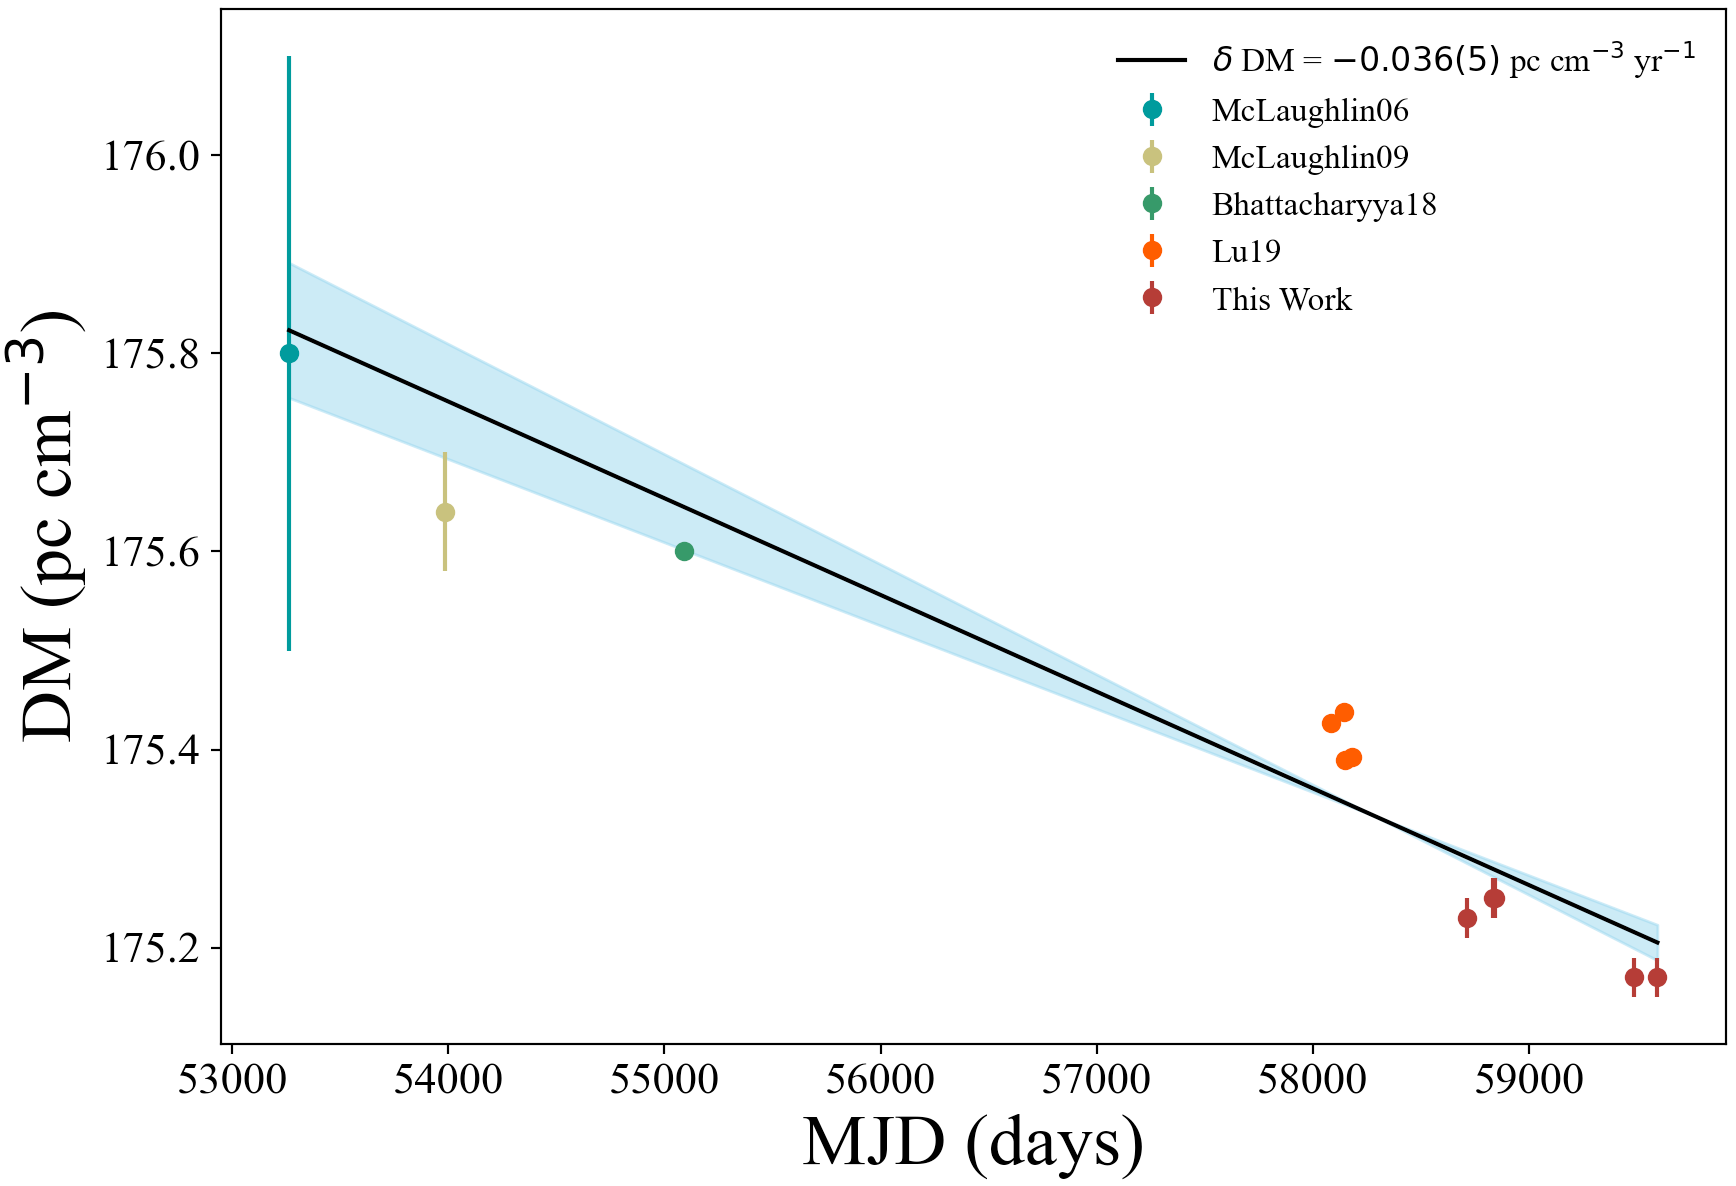
The DM of each single pulse from J19131330 was derived by maximizing the S/N of its integrated pulse profile. Since there was no significant DM variation identified within each observation, we analysed the optimal DM value for all single pulses detected in each observation to obtain the best-fit value. Our analysis resulted in best-fit DM values of 175.23(2), 175.25(2), 175.25(2), 175.17(2) and 175.17(2) on MJD 58712, 58833, 58842, 59484 and 59593, respectively. The DM values for the last two observations were slightly smaller than those for the first three. As shown in Figure 2, our DM values are smaller than those reported in previous studies (McLaughlin et al., 2006, 2009; Bhattacharyya et al., 2018; Lu et al., 2019), suggesting a possible decrease of .
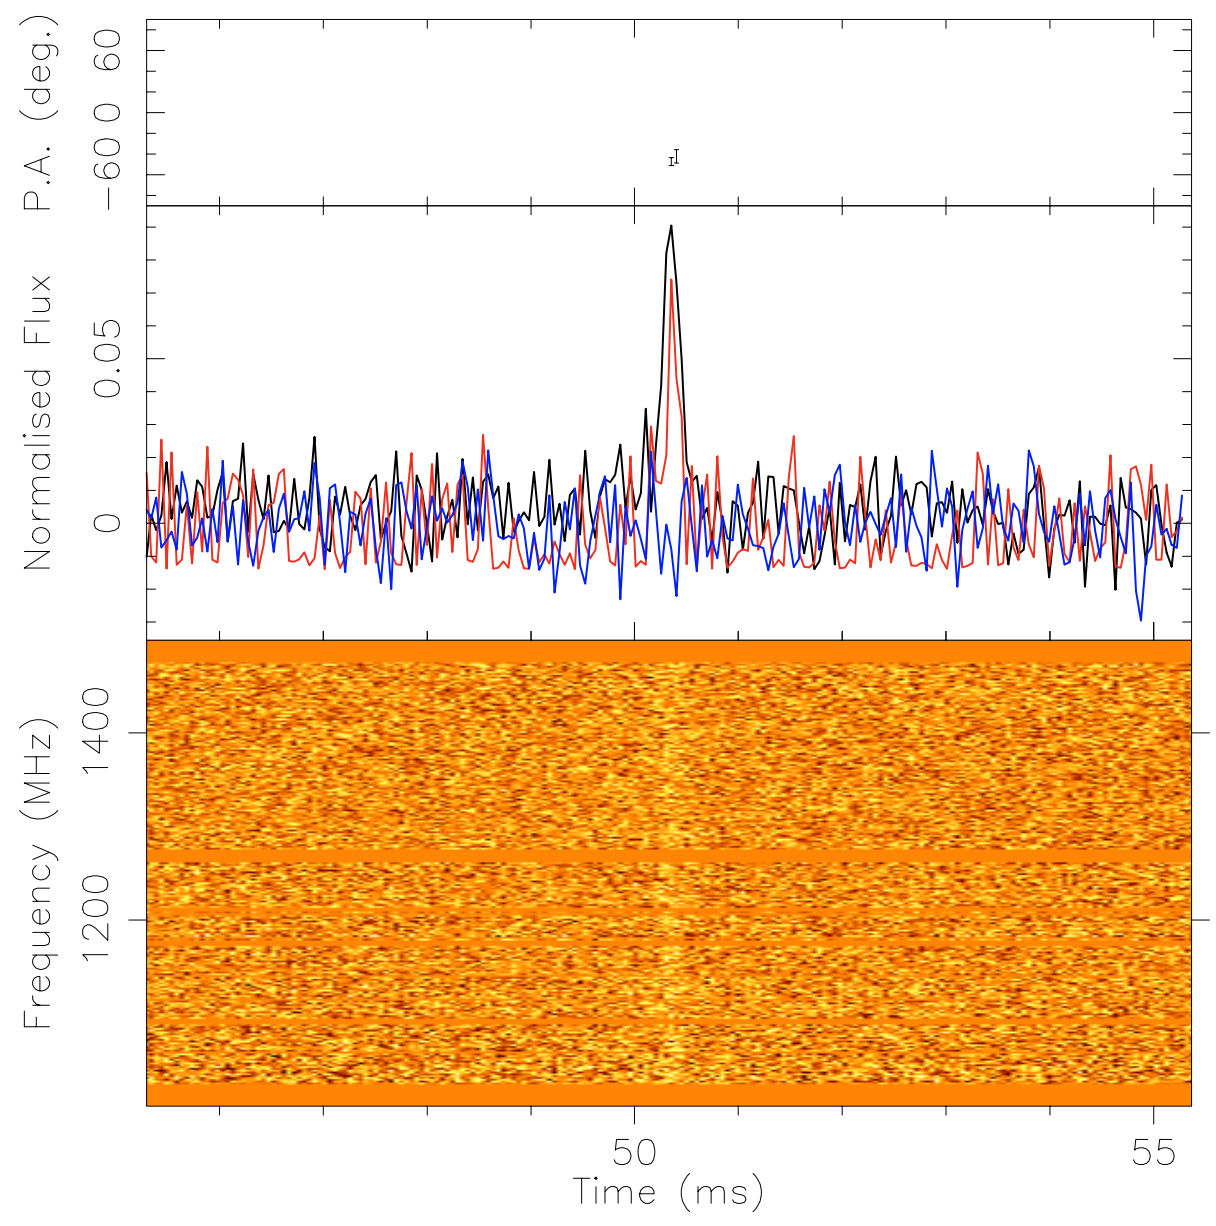
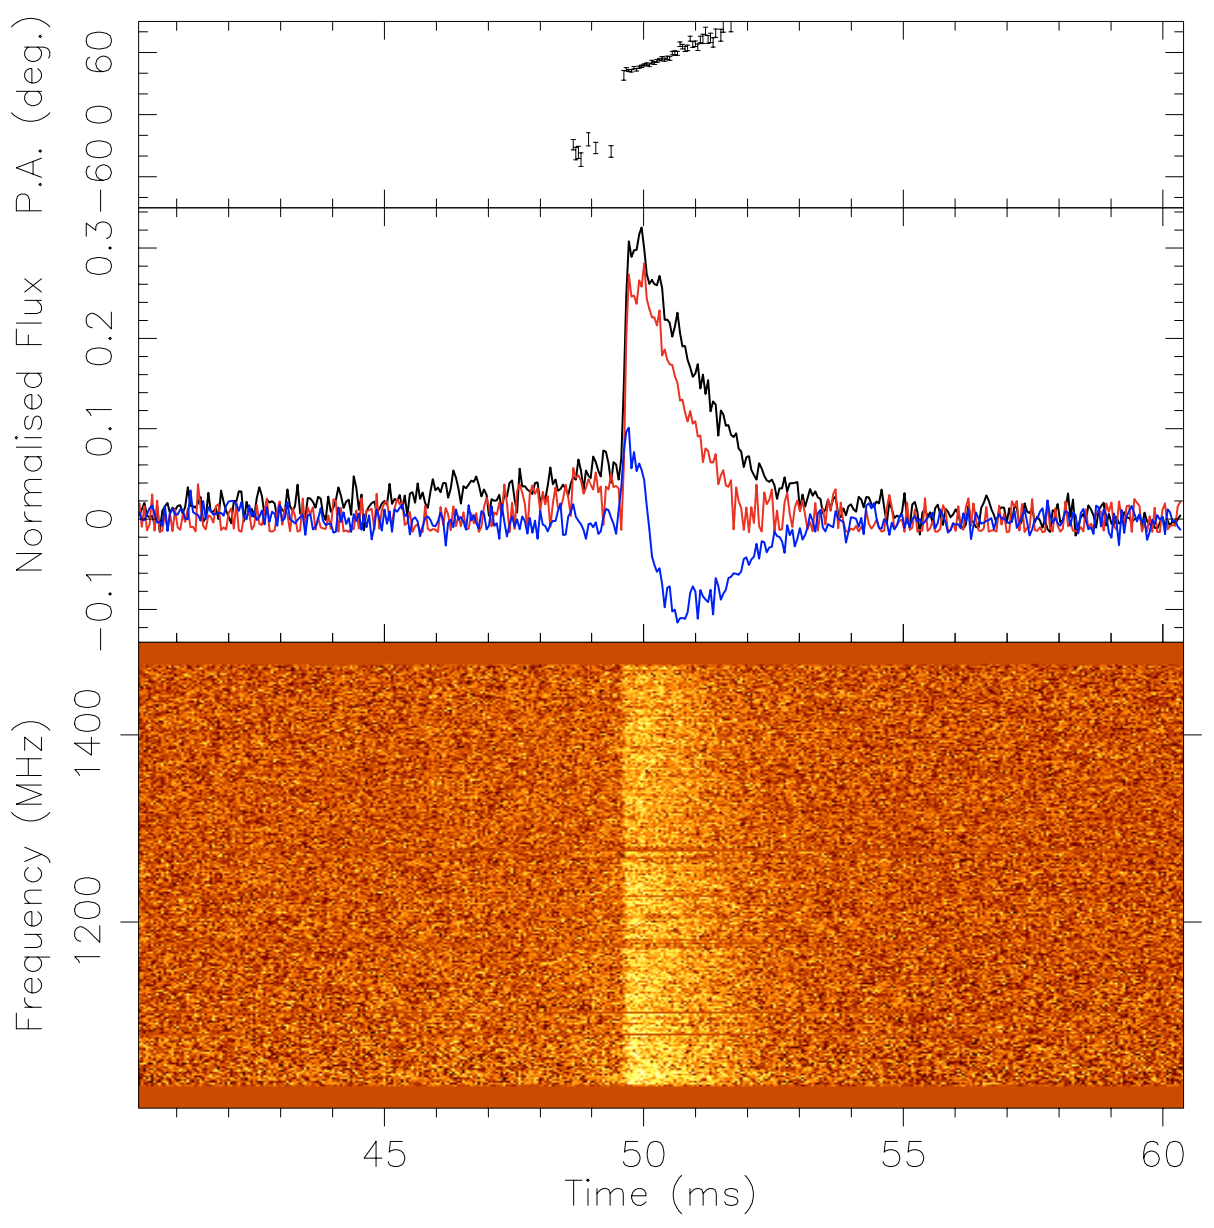
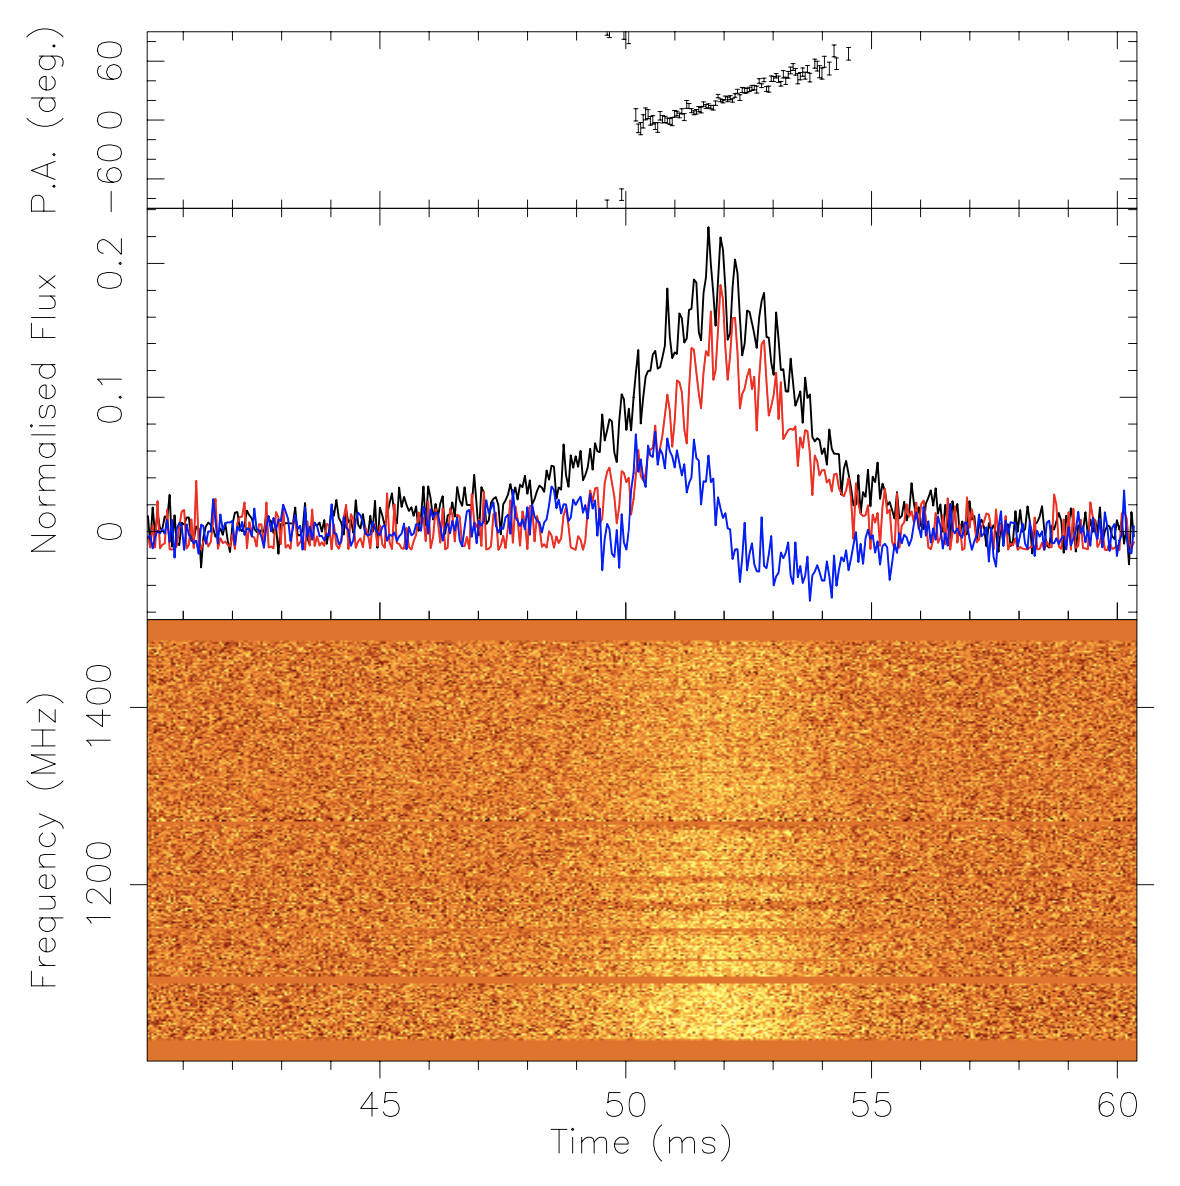
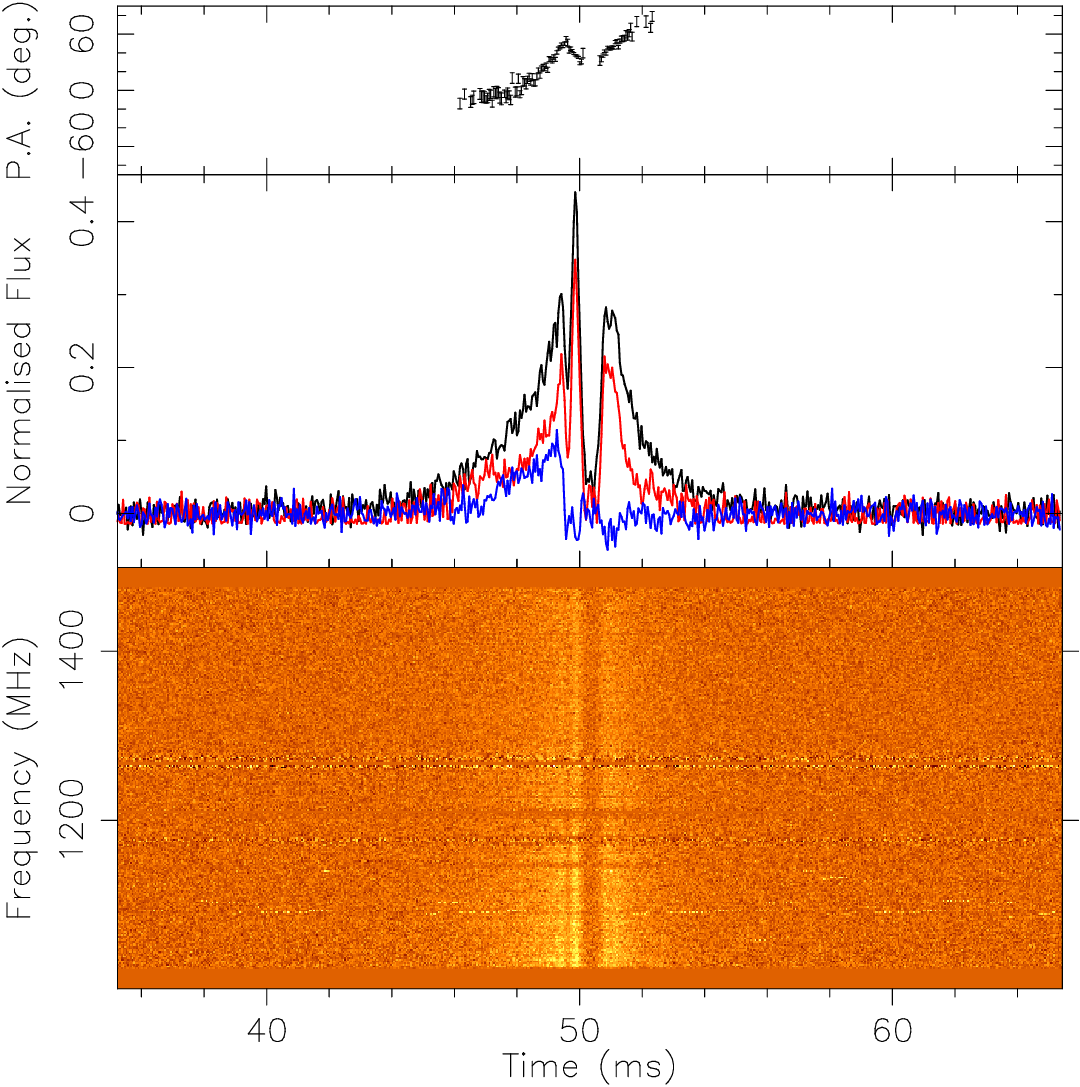
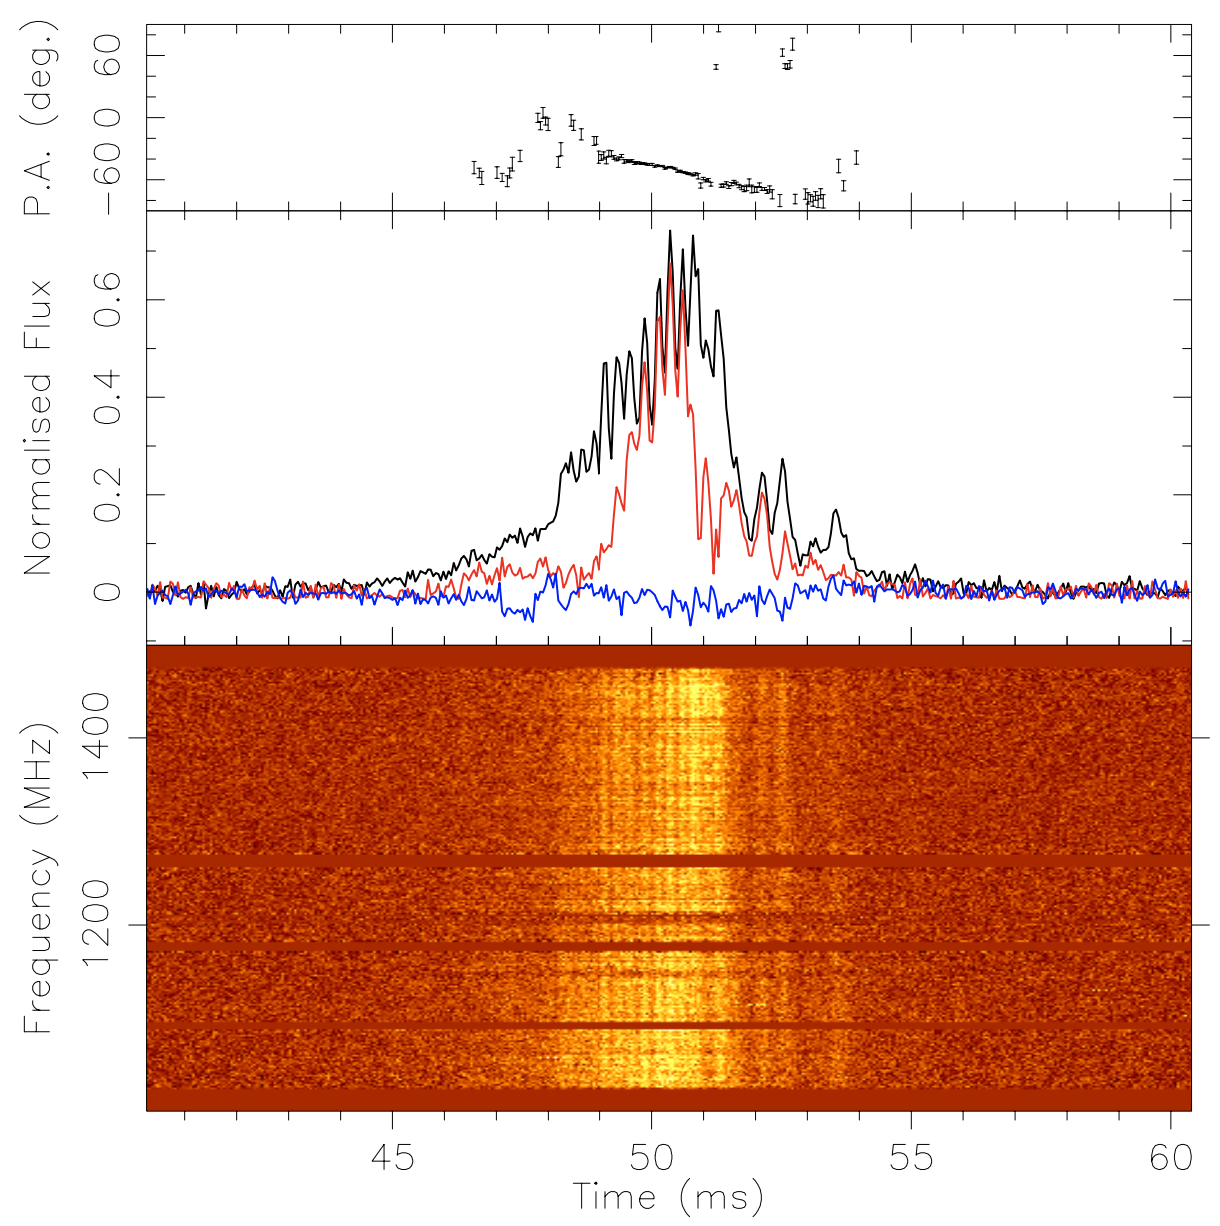
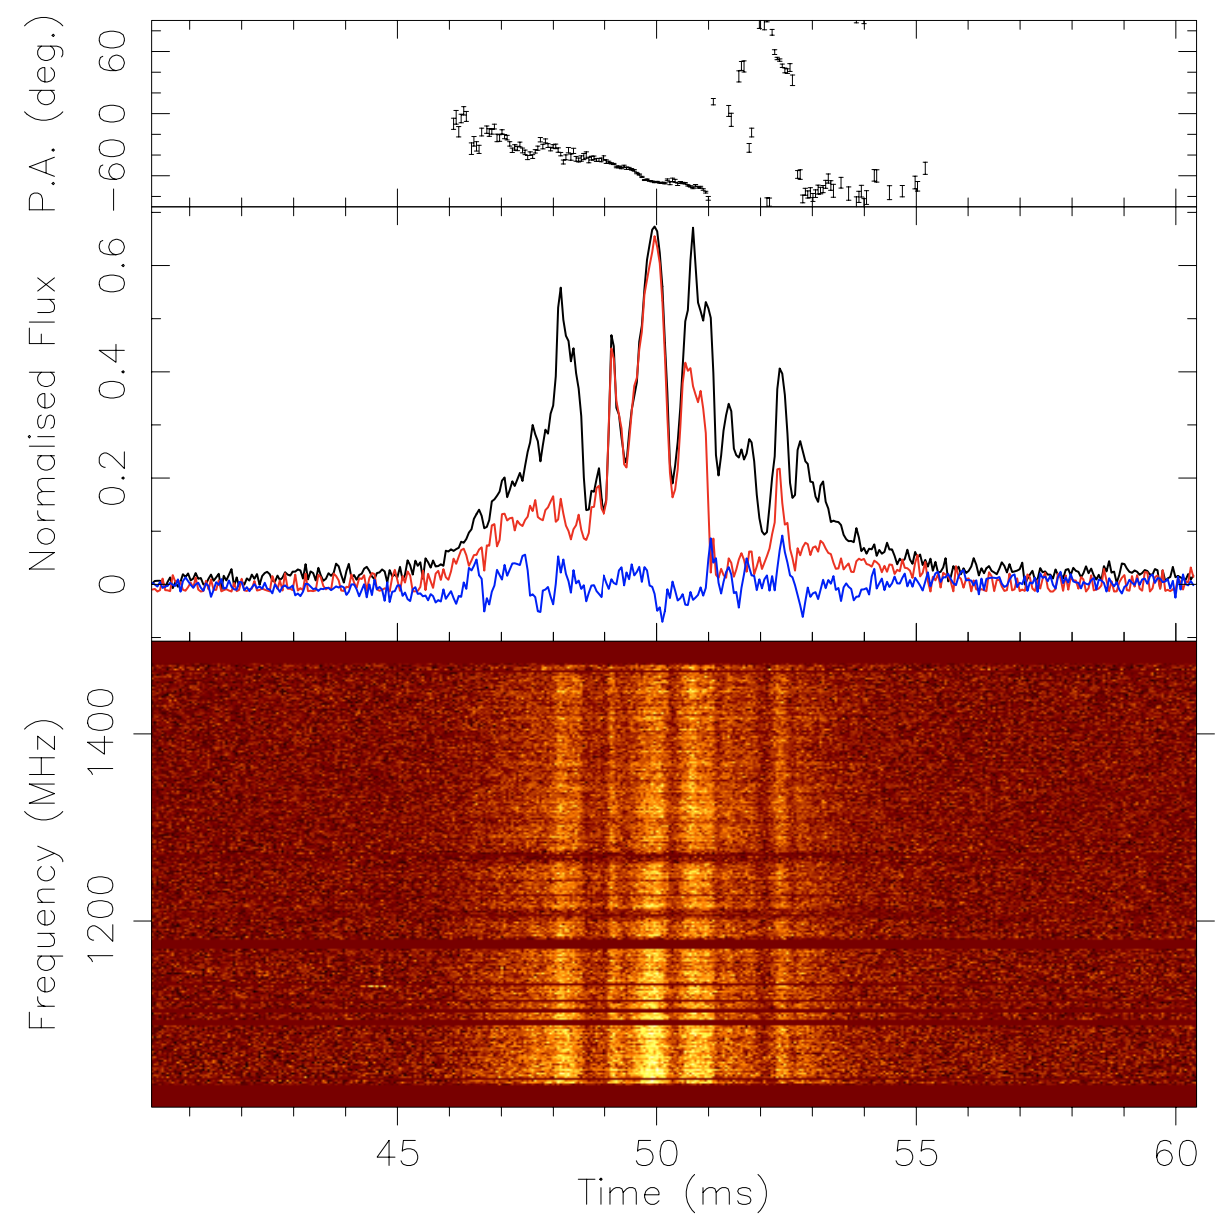
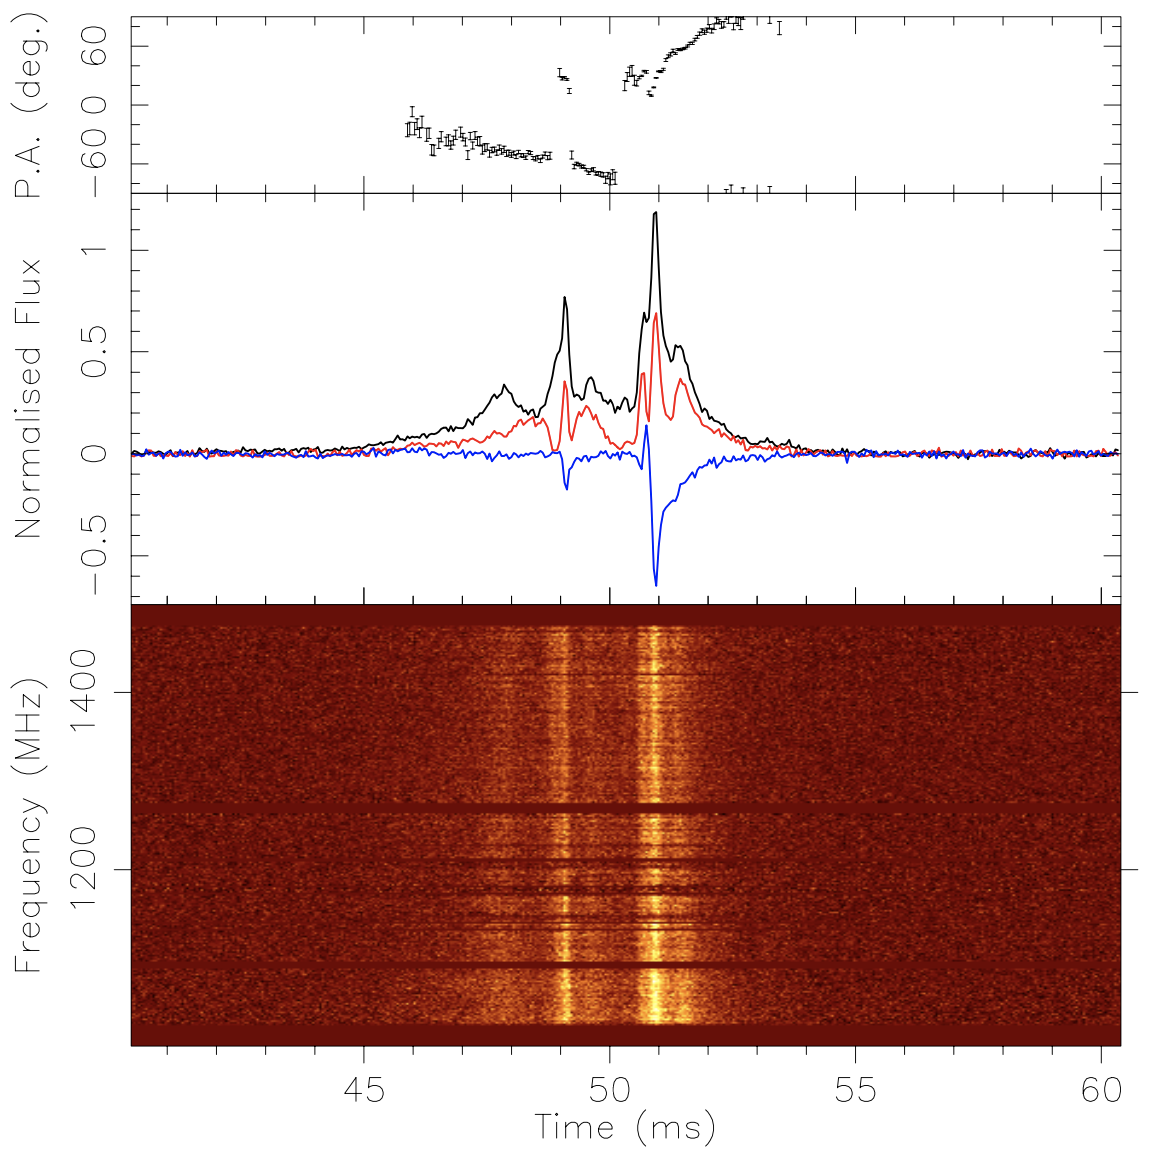
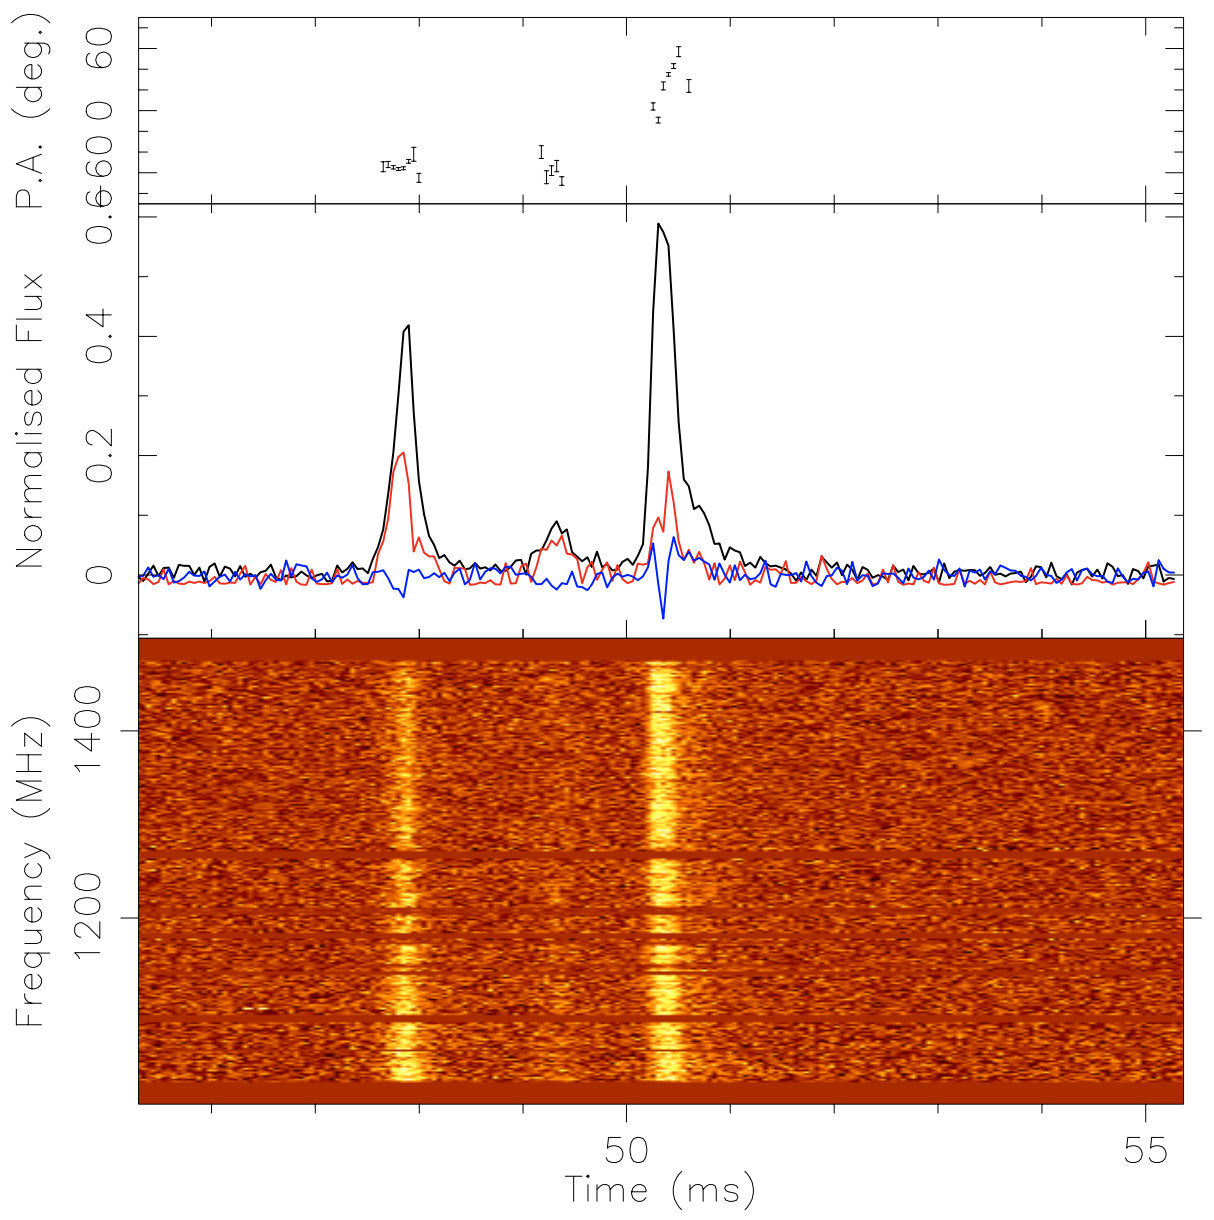
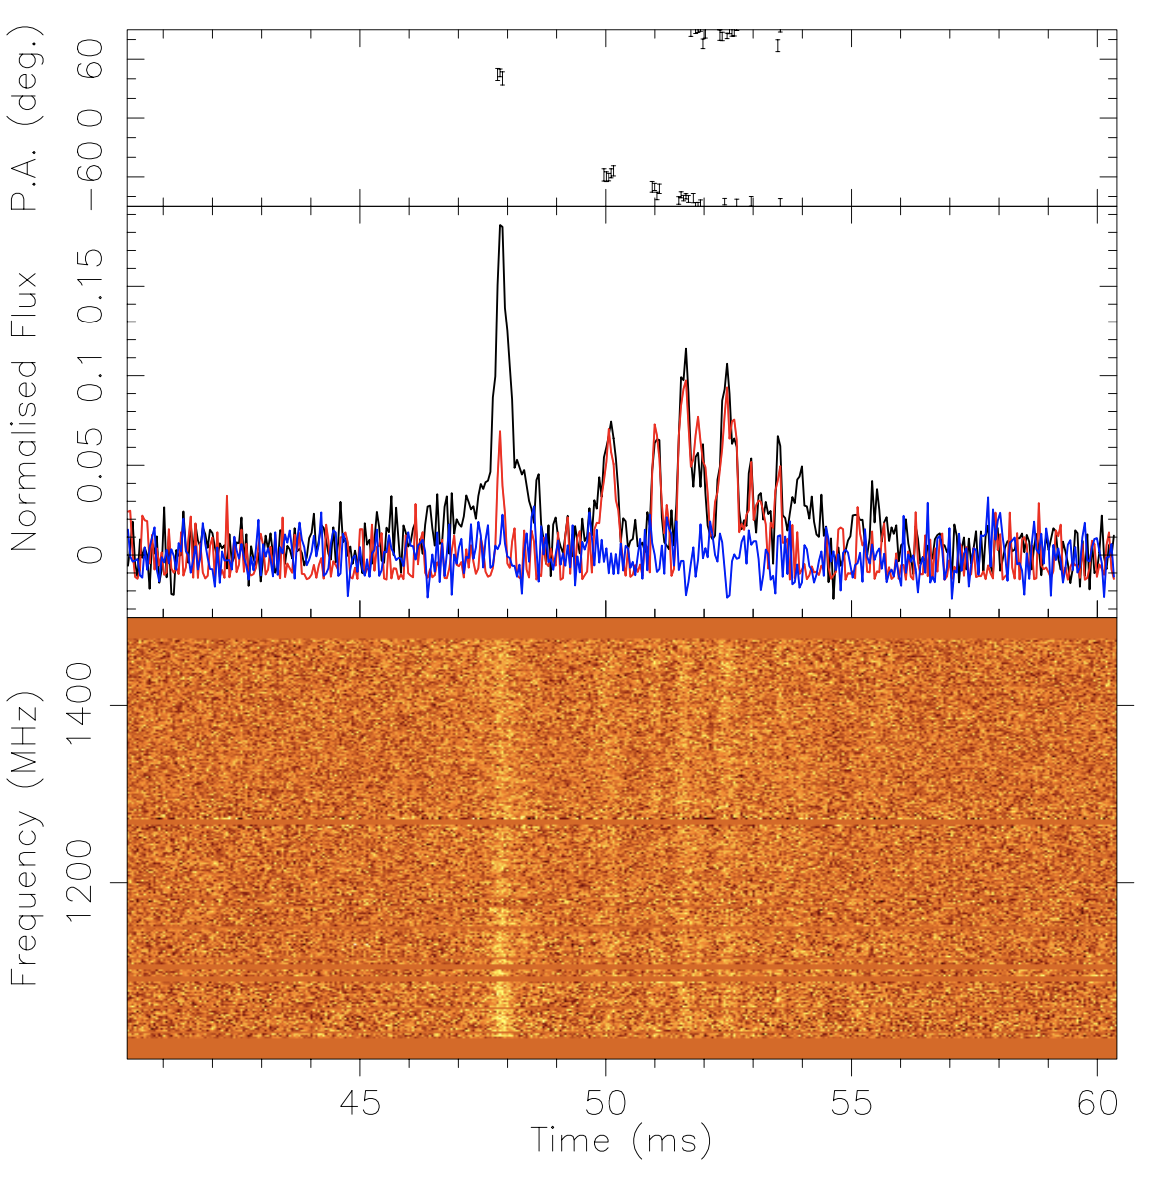
The best estimate of RM for the detected bursts yielded a value of 932.86.6 rad m2, slightly smaller than the previously reported value of 94511 rad m2 (Caleb et al., 2019). All detected pulses in the four-polarization observations were RM corrected using the average RM value. Figure 3 presents polarization profiles of a sample of single pulses from J19131330. The source exhibits a wide range of polarization angles (PA) and degrees of linear polarization, with a small fraction of pulses showing a high degree of circular polarization.
 |
 |
 |
 |
 |
 |
 |
 |
 |
3.4 Single pulse profile & Microstructure
The profiles of single pulses from J19131330, as shown in Figure 3, exhibit significant variations. During certain active periods, we detected only single-peak pulses with ranging from 0.15 to 3.63 ms. The effective time resolution of our observations could be estimated by Cordes & McLaughlin (2003):
| (2) |
where represents the dispersion smearing ( s at frequency of MHz), accounts for the dedispersion error (negligible in our observation), s is the sample time, and represents the scattering smearing (s at frequency of MHz). Our observation has an effective time resolution ranging from approximately 73 to 201 s for frequencies from 1.0 to 1.5 GHz. It is worth noting that the width of the narrowest burst we detected is similar to the effective time resolution of our observation, indicating the possible existence of even narrower pulses from this source. More than 95% of the detected pulses exhibit diverse microstructures, limited only by our effective time resolution. In approximately 10% of these pulses, multiple distinct individual pulses can be distinguished. The largest effective width of the pulses we detected is 17.29 ms.
4 Discussion
4.1 Distribution of fluence, peak flux and width
 |
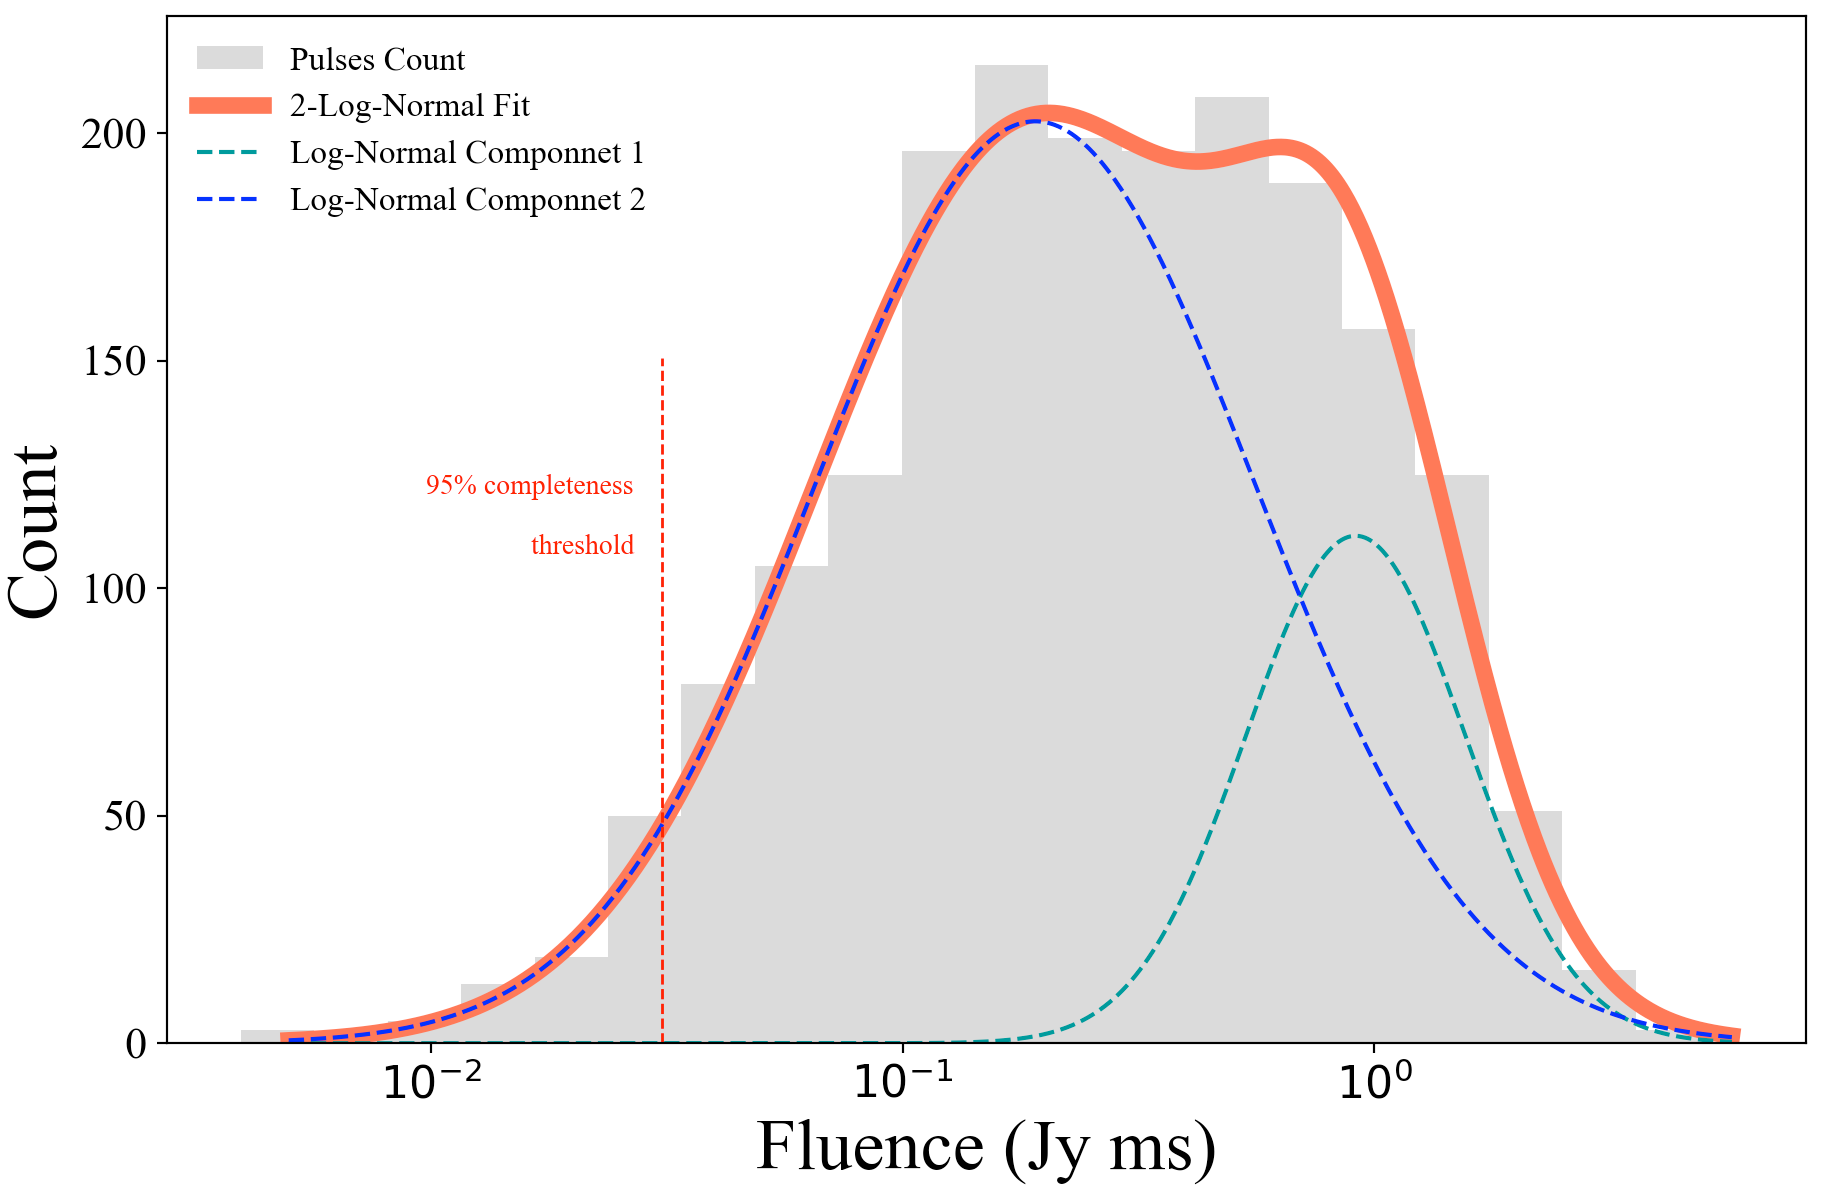 |
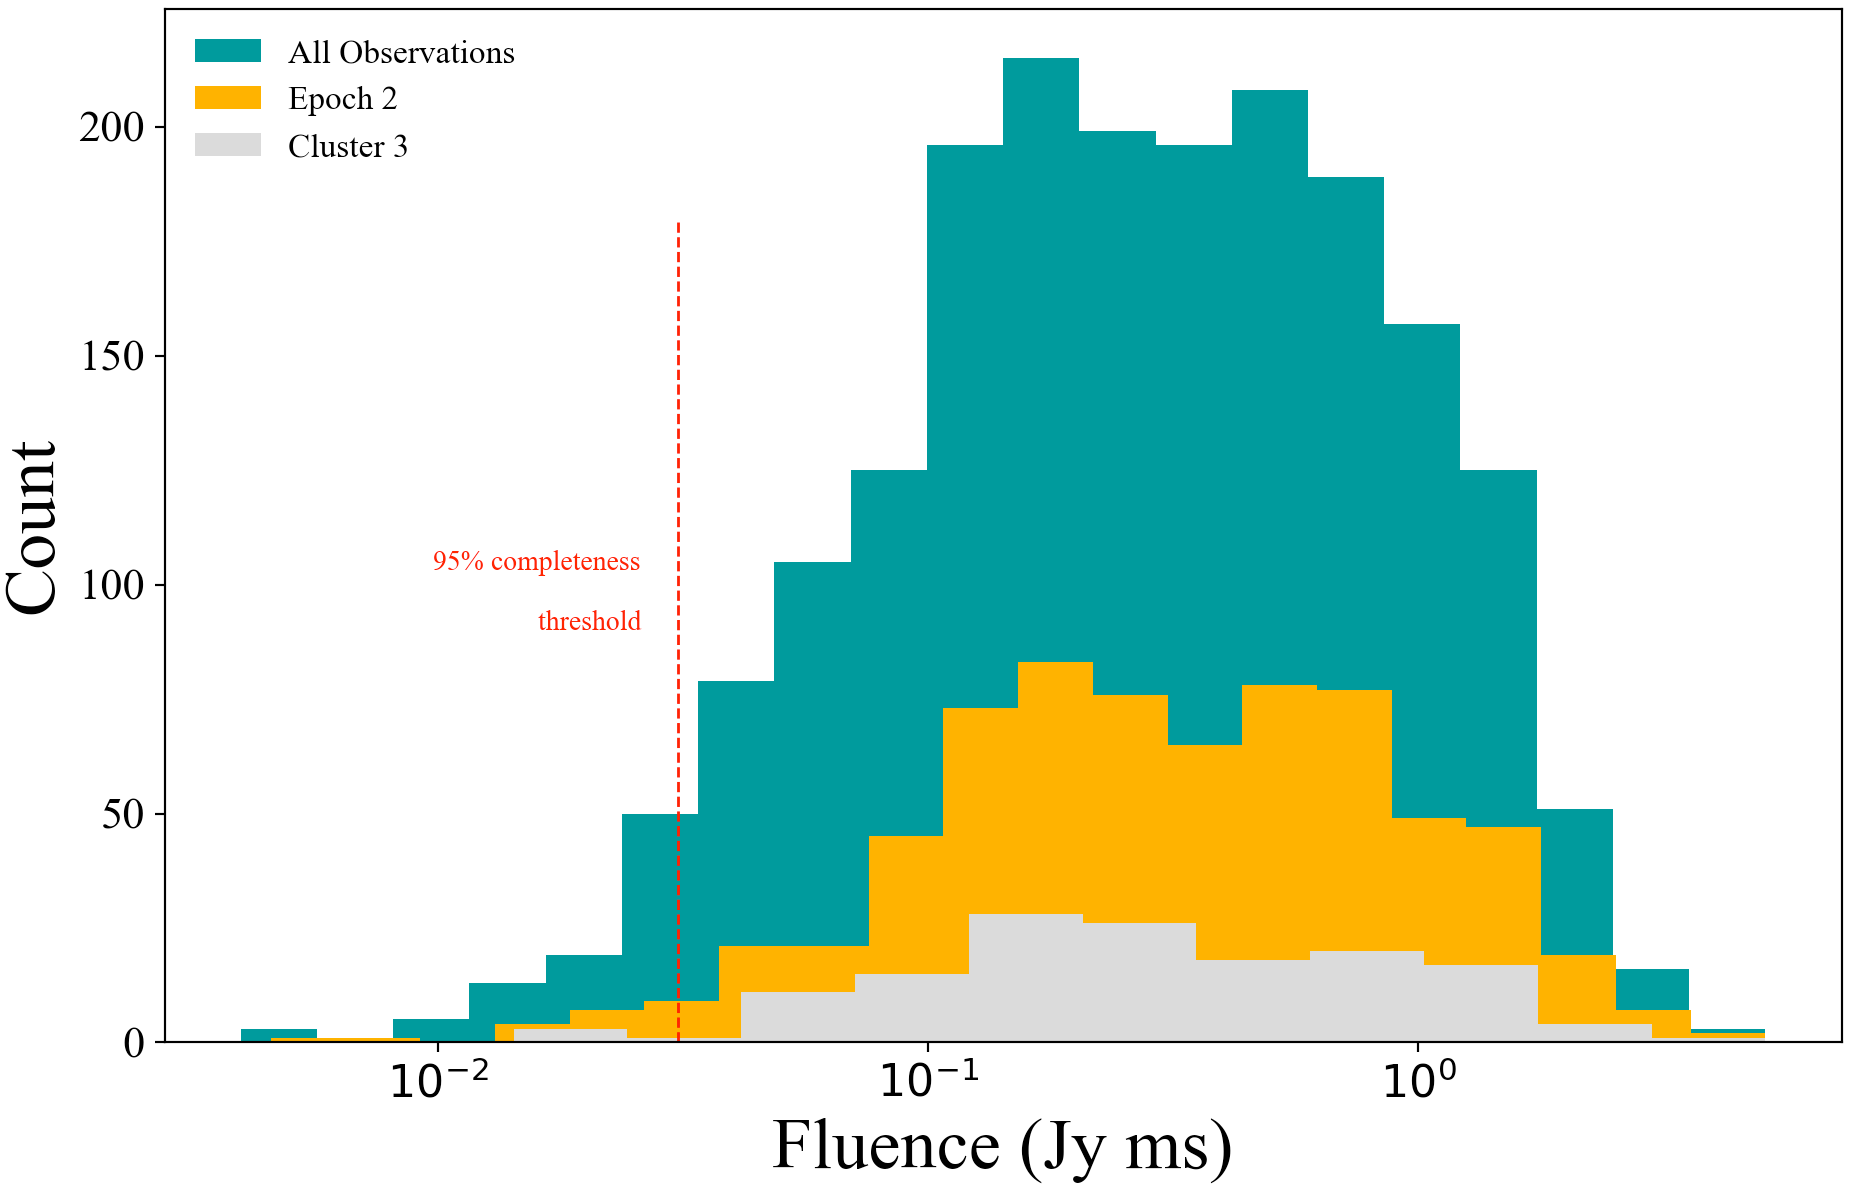
The fluence distribution of the detected pulses from J19131330 is illustrated in Figure 4. Notably, the fluence exhibits significant variations spanning over three orders of magnitude. This is noteworthy because broad energy distributions are atypical for regular pulsar single pulses (Burke-Spolaor et al., 2012), and intensity variations of more than one decade have typically been attributed to the phenomenon of “giant pulses” (Kuzmin, 2007). However, in our observations, we have detected the majority of pulses from this source, and there is no evidence supporting the presence of two distinct emissions, namely “giant pulses” and “normal pulses”.
To account for the uncertainty introduced by flux calibration, we compared the fluence distribution of pulses in all observations with that of our longest observation (Epoch 2, lasting approximately 3 hr) and Cluster 3 (lasting approximately 5 min) within this observation. It was expected that the variation in system temperature would be relatively small in these cases. The distributions of a single epoch and a cluster were found to be consistent with the overall sample. The maximum fluence contrast (/) of the detected pulses in all observations, Epoch 2 and Cluster 3 were 1289, 1120, and 358, respectively. It should be noted that similar variations in pulse fluence also exist in other individual clusters, as shown in Table 1. We utilized two log-normal functions to fit the fluence distribution of all the detected single pulses, with peaks at 0.19 and 0.91 Jy ms. For convenience, we categorized pulses with fluence values below 0.19 Jy ms as low energy, pulses with fluence values ranging from 0.19 to 0.91 Jy ms as middle energy, and pulses with fluence values above 0.91 Jy ms as high energy.
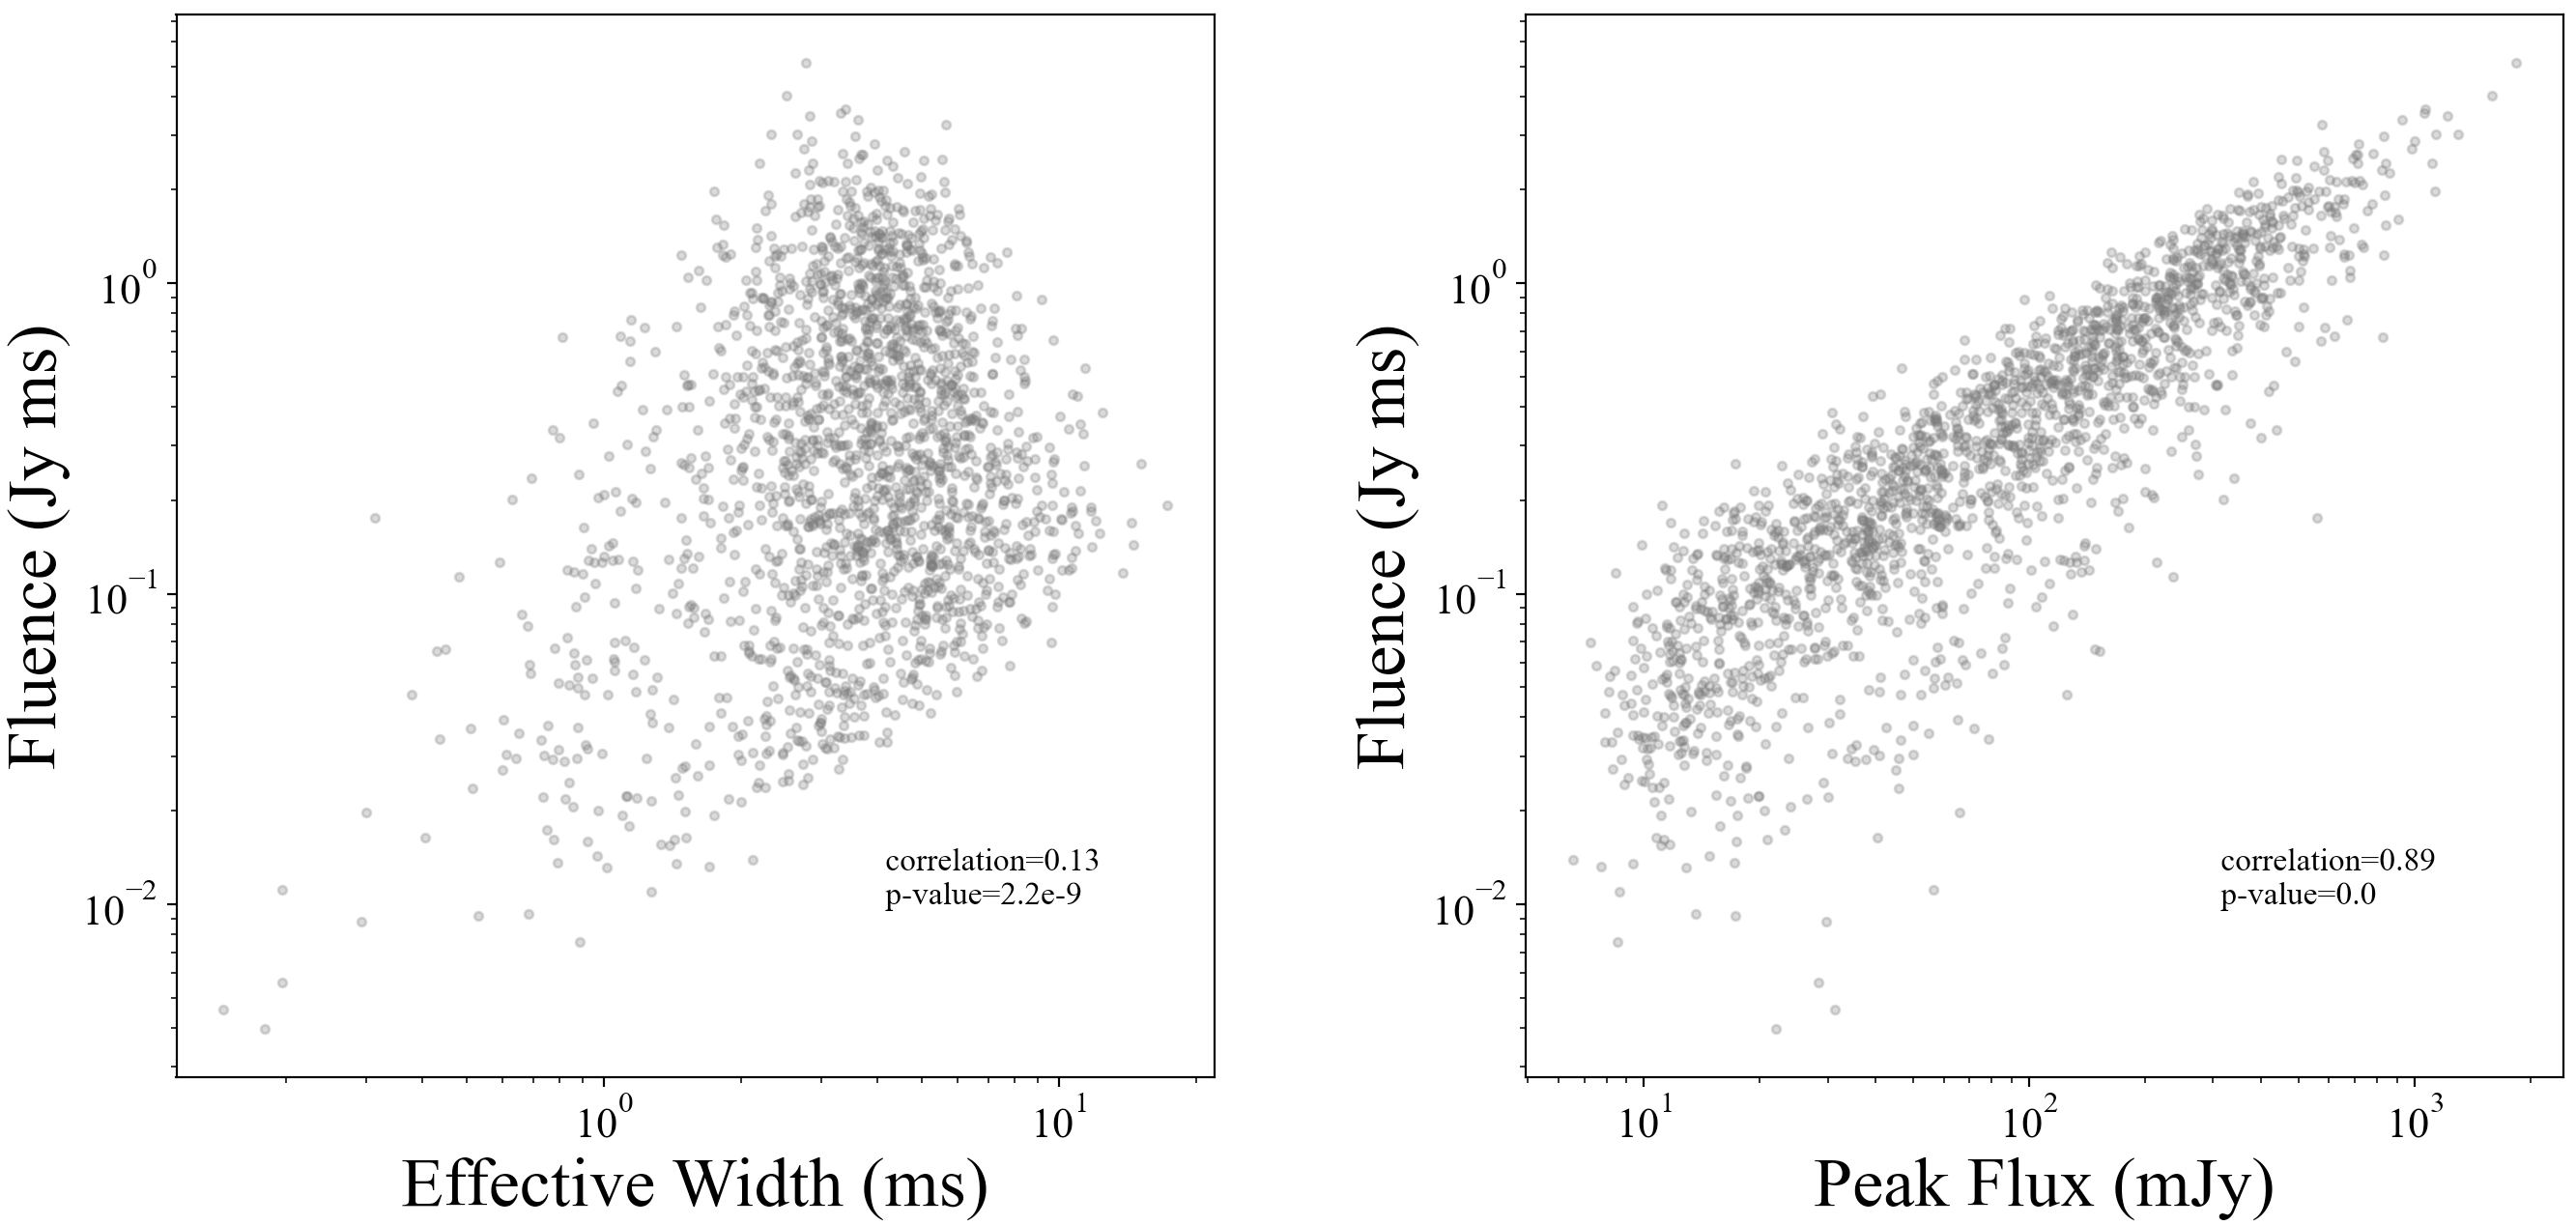 |
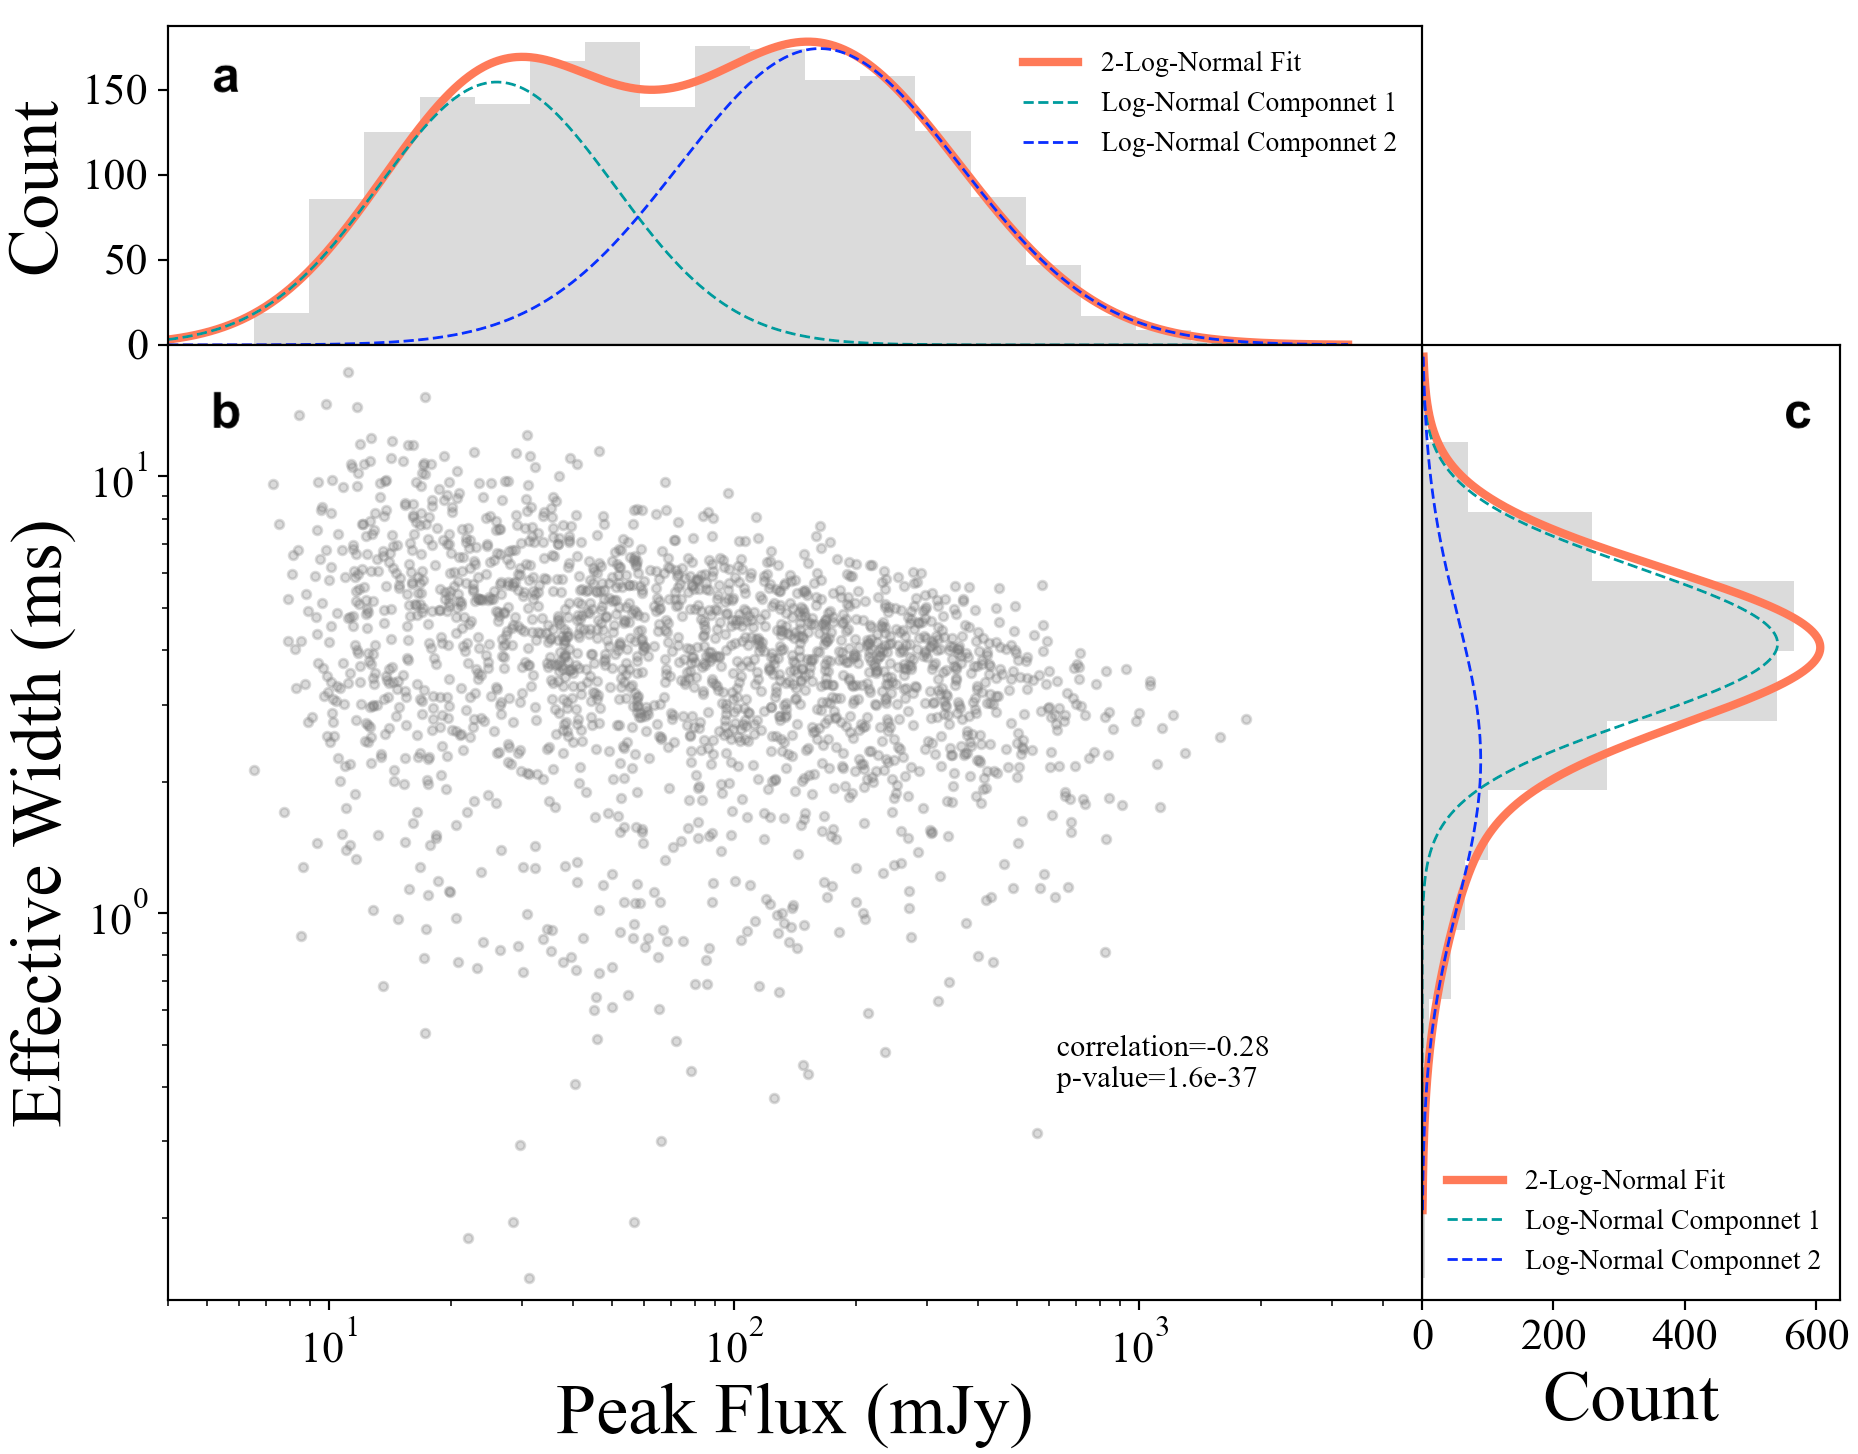
The effective width and peak flux distributions of the 1955 single pulses of J19131330 are presented in Figure 5. We also fitted these distributions using two log-normal functions, with maximum contrasts in flux and width (i.e., and ) being 281 and 118, respectively. As shown in Figure 6, a strong positive correlation between fluence and flux is observed, indicated by a Spearman’s correlation coefficient of 0.89, while the correlation between fluence and effective width is insignificant.
4.2 Pulse-to-pulse variation
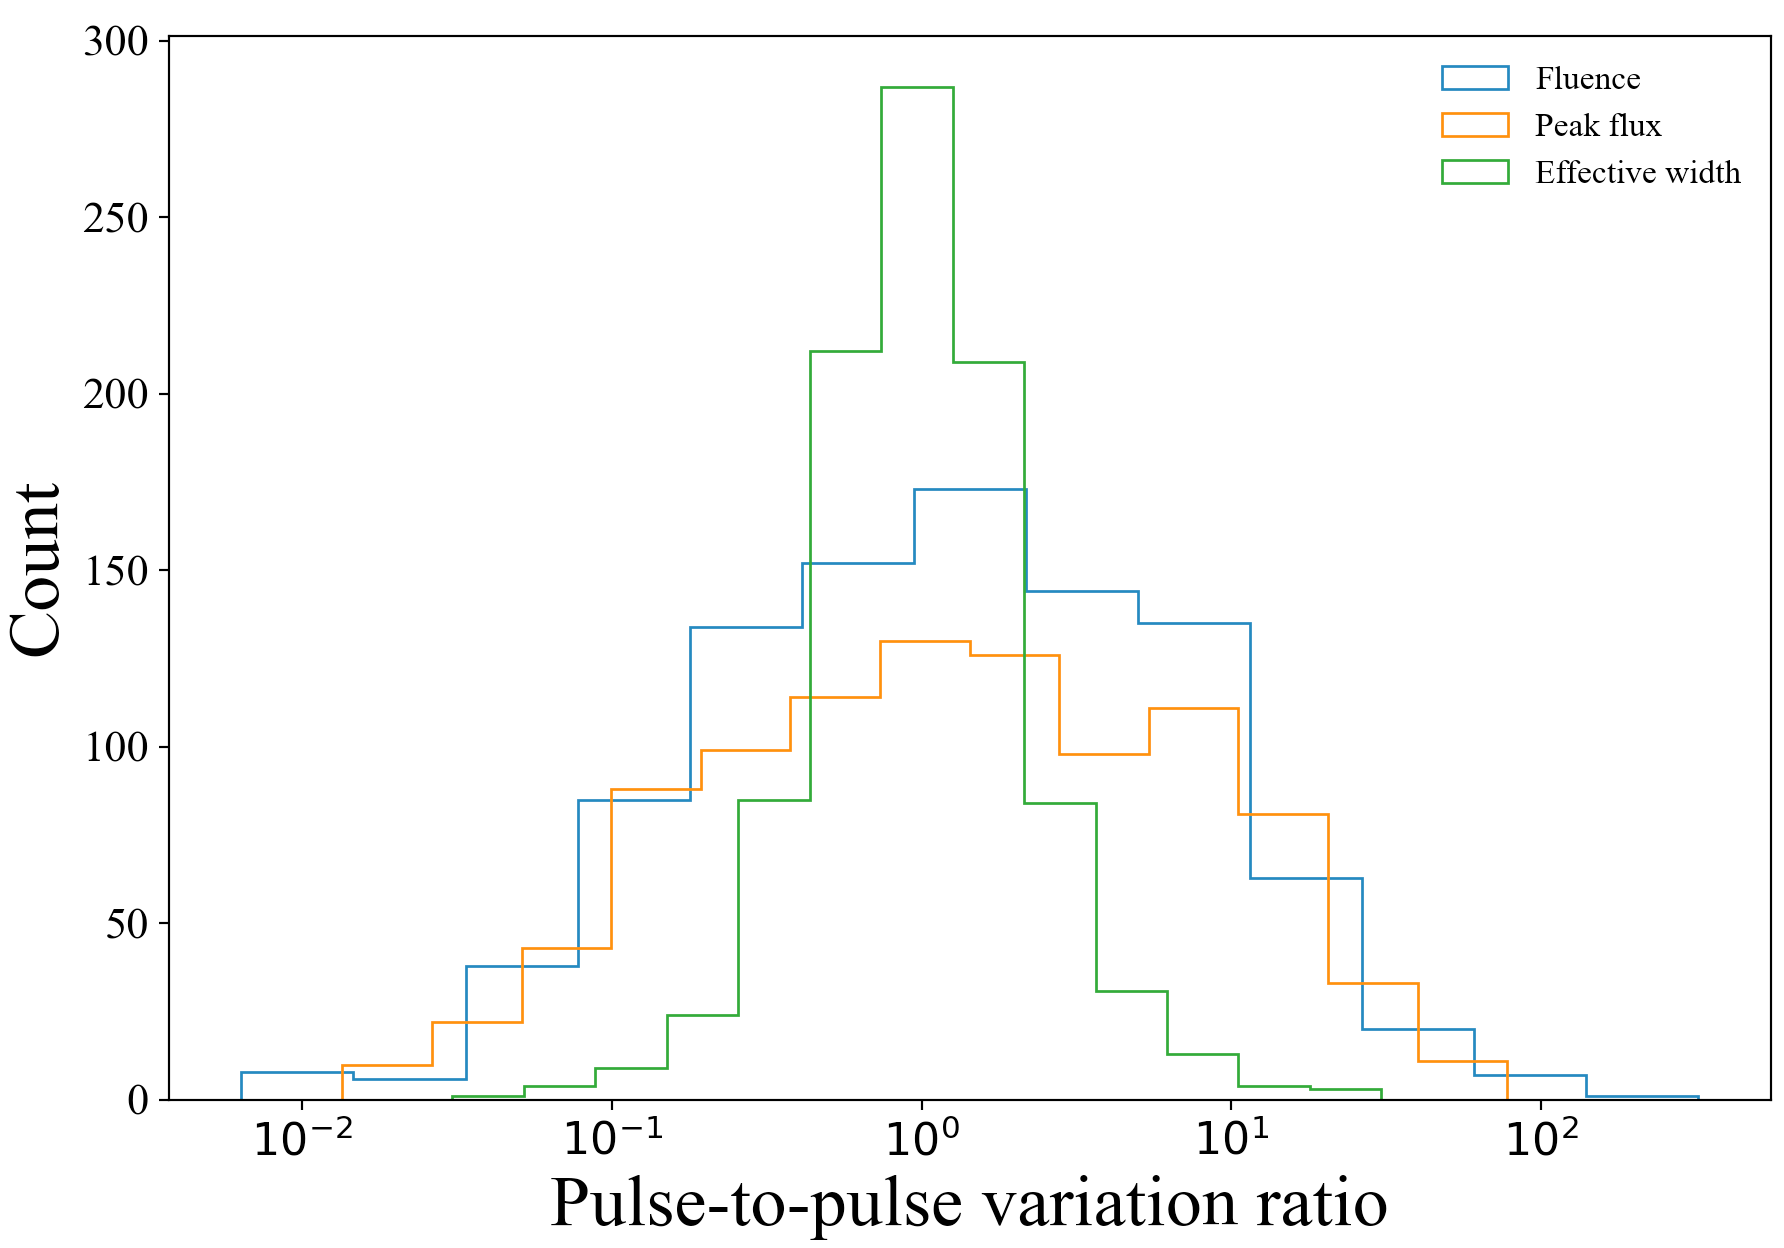
To further quantify the pulse variation of J19131330, we selected a sample of 966 pulses that have a sequential pulse with a waiting time of . We defined a pulse-to-pulse variation ratio as the ratio of fluence, peak flux, and effective width between the pulse and its immediate sequential pulse. The distributions of these variation ratios are shown in Figure 7. They can be well-fitted by log-normal distributions, with the mean value and standard deviation of log10(), log10() and log10() being 0.091 and 0.75, 0.099 and 0.76, -0.008 and 0.35, respectively. The narrow distribution of the effective width ratio indicates that the change in pulse width is relatively small. However, the fluence and the peak flux variation ratio distributions show that they can change by more than two orders of magnitude between adjacent pulses.
4.3 RRAT J19131330, pulsar and FRB
Thanks to the high sensitivity of FAST, we have been able to resolve the individual pulses in the so-called “weak persistent emission mode” of J19131330. However, contrast to previous observations that showed two distinct emission modes (Bhattacharyya et al., 2018), our observations demonstrate that strong pulses are always detected together with the weak persistent emission mode within the pulse clusters. The event rate of strong pulses during our observation is , which is consistent with the results of other observations with shallower sensitivity (McLaughlin et al., 2009; Bhattacharyya et al., 2018), and approximately one-twentieth of our detected rate of all pulses, which is . Around 49.4% of the detected pulses were sequential, but the analysis of adjacent pulses shows changes of more than two orders of magnitude. These broad intensity distribution and strong pulse-to-pulse variation of J1913+1330 clearly illustrate that observation with insufficient sensitivity can only detect sporadic pulses with a much lower event rate from such sources.
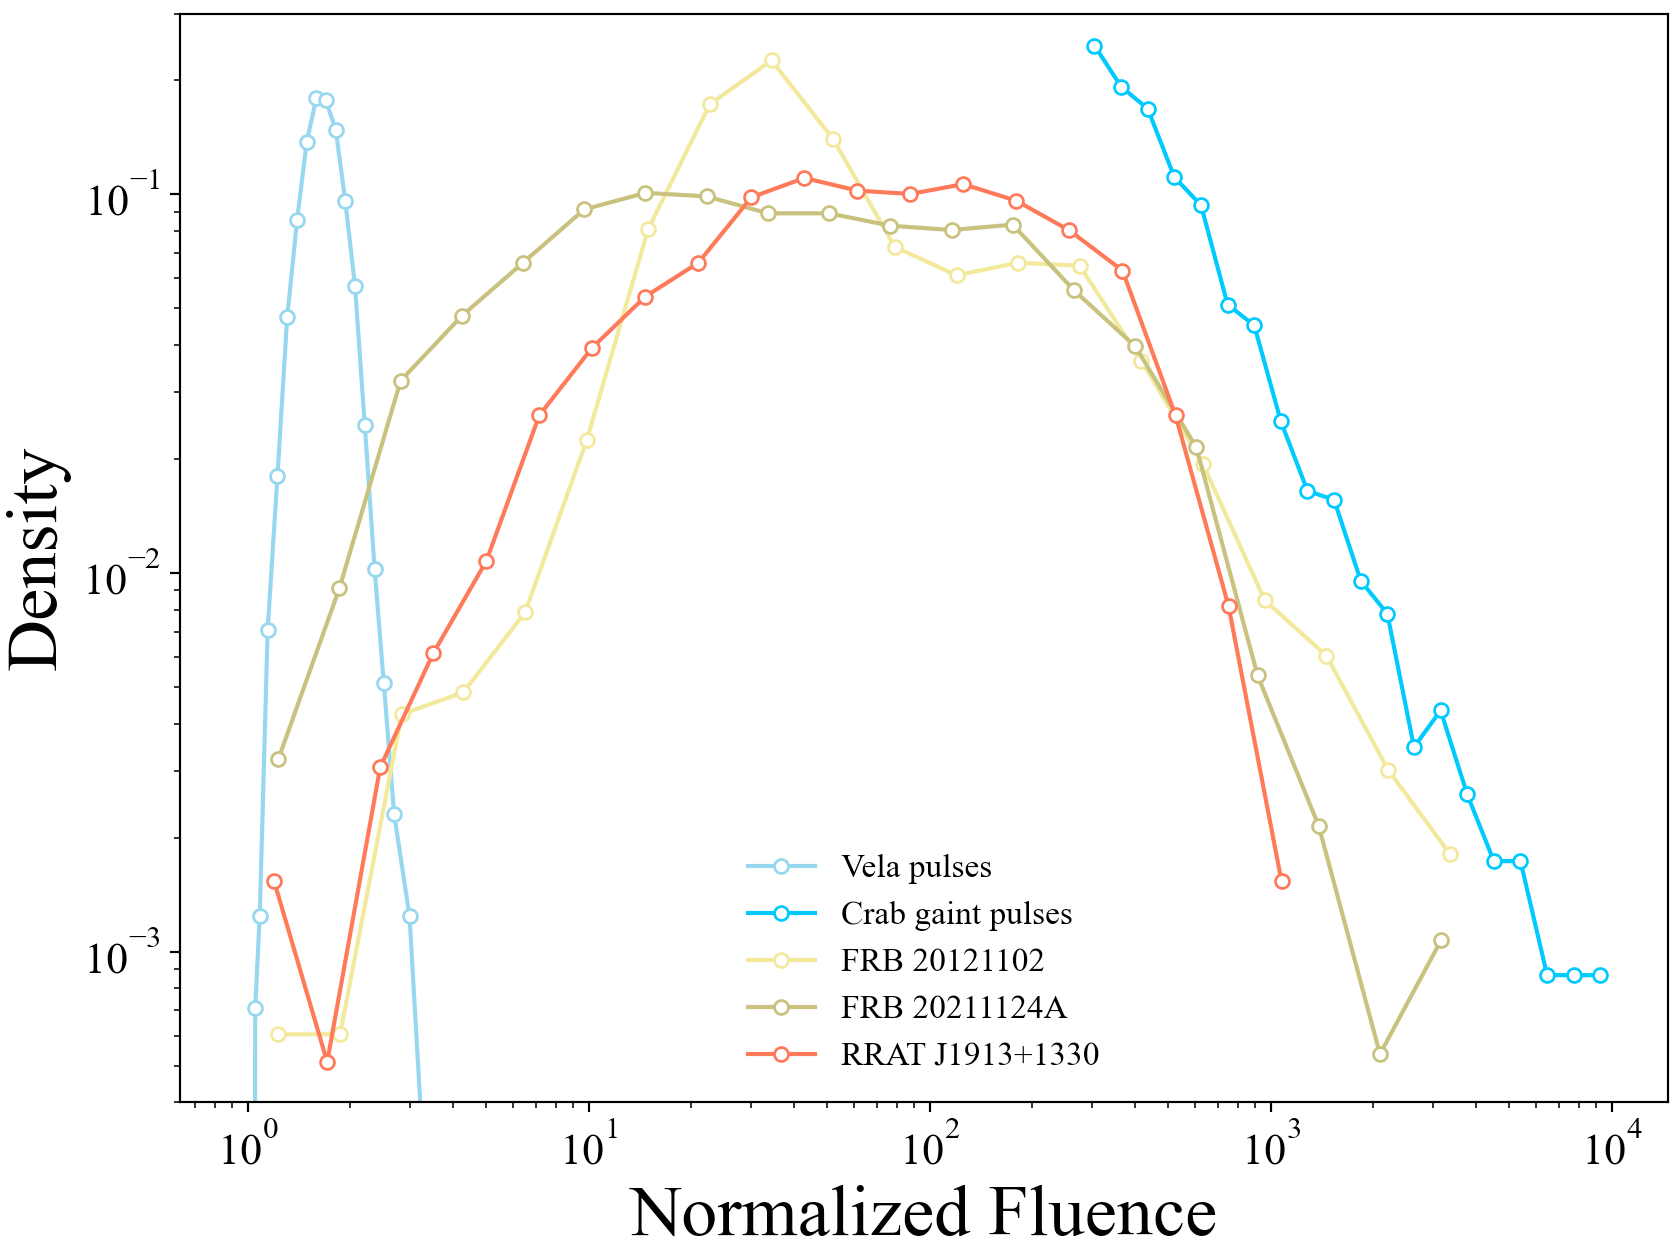 |
In observations with sufficient sensitivity, J19131330 would exhibit an emission mode similar to the pulsars with nulling phases (Biggs, 1992; Wang et al., 2007; Burke-Spolaor et al., 2012). We have obtained numerous individual pulses of J19131330, revealing: (1) a gradual increase at low energy, (2) a distribution spanning three orders of magnitude, and (3) a power-law-like tail at high energy. We compared the normalized fluence distribution of the single pulses from RRAT J19131330, bursts from the repeating FRB 20121102 (Li et al., 2021) and FRB 20201124A (Xu et al., 2022), giant pulses from the crab pulsar (Bera & Chengalur, 2019), and single pulses from one of the brightest pulsars, the Vela pulsar (Johnston et al., 2001) in Figure 8. The power-law tail is similar to giant pulses. Surprisingly, we found that the overall normalized distribution of J19131330 looks more like the distributions of repeating FRBs instead of pulsars. It is notable that strong pulse-to-pulse variations in fluence, pulse profile and polarization properties of J1913+1330 suggest an emission that is extremely variable. Such extreme variations in behaviour are common in the observations detecting large samples of bursts for repeating FRBs (Li et al., 2021; Xu et al., 2022). These results suggest that J1913+1330 shares certain properties with populations of nulling pulsars, giant pulses and FRBs from different perspectives.
4.4 An unstable sparking pulsar


Coherent radio emissions from pulsars or RRATs are speculated to come from discharges of the polar cap (with an edge angle of ) named sparks, which inject ultrarelativistic pairs into the magnetosphere and curvature radiation are subsequently released via (Ruderman & Sutherland, 1975). The condition for the failure of pair production defines the pulsar radio emission “death line” in the diagram of pulsars (Chen & Ruderman, 1993; Zhang et al., 2000). When a pulsar is getting slightly below its emission death line, it may become occasionally active only if the pair production condition is temporarily satisfied, or nulling otherwise (Zhang et al., 2007). The pulse profile and peak flux vary abruptly from pulse to pulse, indicating the dramatic variation of the sparks and relevant emission processes in RRAT J19131330. We suppose that this old pulsar is in a transition state near its death line so that the pair production is unstable (Zhang et al., 2000, 2007). In such a state, the potential drop across the polar cap may be inhomogeneous (van Leeuwen & Timokhin, 2012) so that the accelerated pairs would form several sub-beams in the flux tube spanned by open field lines (Gil & Sendyk, 2000). Even for a homogeneous primary pairs distribution left from the cap, the spatial distribution of the secondary pairs by the pair production turns into Gaussian-like along the latitude of field lines intersecting the star surface (Beskin & Litvinov, 2022). Therefore, we assume that the polar cap of RRAT J19131330 is populated with a number of equivalent two-dimensional sparking spots with a characteristic radius of . The secondary pairs may release the emission coherently at a range of several tens to hundreds times of , depending on where solitons are formed. As the emission direction is along the tangent of the curved field line, the variation of the emission radius then leads to the oscillation of sparking spots along the latitudes to the line of sight. On the other hand, the well-known circumferential drift (Ruderman & Sutherland, 1975; Deshpande & Rankin, 2001) or other local magnetospheric evolutions could make the spot oscillate in the azimuthal direction. The line-of-sight cut on the emission beam of wandering spots would sample diverse pulse profiles, and hence accounts for the energy distribution of pulses of RRAT J19131330 as shown below.
The spatial distribution of the number density of secondary pairs from the -th spot is assumed to be Gaussian-like centered at polar angles () on the NS surface, i.e.,
| (3) |
where is the local Goldreich–Julian number density (Goldreich & Julian, 1969), is the surface magnetic field, is the rotation period, is the inclination angle between the magnetic pole and the spin axis, is the multiplicity factor, and is the distance from the spot center. When the secondary pairs stream along the dipole magnetic field, the radial dependence of the density writes as . For the -th soliton moving with a field line tangent of , the received radiation intensity by the observer in the direction of is (see Appendix for detailed formulation), where is the bulk Lorentz factor of the pairs, is the angle between the line of sight and the soliton’s motion direction. At any instance, the observed flux density is the sum of the contribution of solitons formed along open field lines, i.e.,
| (4) |
The stacked pulse profile of RRAT J19131330 shows two main emission components. As a simplified but representative case, we adopt two wandering spots to mimic its pulse profile, in which the center of two Guassian-like spots changed along the NS rotates once (see Figure 9). More specifically, is fixed while varies randomly between each rotation, within a range of [, ] and [, ] respectively. Due to a poor understanding of instabilities that drive the coherence, the possibility that solitons are generated at by pairs injected from each spot is assumed to be uniform in a range of . In one spin period, we draw a random distribution of sub-sources in a radial range of to , and density from Equation 3 to calculate one mock pulse profile. We perform this calculation repeatedly and obtained a cluster of mock profiles, from which the simulated pulse energy distribution is derived. Taking an impact angle of , , , , , , rad, rad, , , we get a simulated energy distribution in good agreement with that of RRAT J19131330, with a Kolmogorov-Smirnov test value of 0.5 (Figure 10).
5 Conclusion
RRATs like J19131330 are known to exhibit sporadic bursts in observations with insufficient sensitivity (McLaughlin et al., 2009; Bhattacharyya et al., 2018). However, in our observation of RRAT J19131330 using the highly sensitive FAST telescope, we found that its emission consists of clustered and sequential pulses, with significant variations of more than two orders of magnitude between adjacent sequential pulses. The energy distribution of the detected individual pulses exhibited a range spanning three orders of magnitude. Our results prove that RRATs can be explained as pulsars with extreme pulse-to-pulse modulation (Weltevrede et al., 2006). This emission pattern could be phenomenologically understood by the cut of the line of sight on the emission beams from wandering sparking spots above the polar cap region. Further efforts are invoked to unveil the physics that drives the sparking fluctuation. The presence of sequential pulse trains during active phases, along with significant pulse variations in profile, fluence, flux, and width, should be intrinsic to a subset of RRATs. However, radio telescopes with limited sensitivity can only detect brighter and infrequent pulses from this kind of RRATs.
Our analysis of the properties of individual pulses from J19131330 indicates that J1913+1330 represents a peculiar source that shares certain properties with populations of nulling pulsars, giant pulses and FRBs from different perspectives. A sample of RRATs exhibiting similar properties to J1913+1330 has the potential to significantly enhance our understanding of pulsars, RRATs, and FRBs. Therefore, further detailed classification and monitoring of RRATs is encouraged to determine if they share similar properties with J19131330. Telescopes with larger collection areas (such as SKA or FASTA) or wider bandwidths have the potential to unveil the “true energy distribution” of more RRATs by detecting their “weak pulses” from currently known RRATs.
Acknowledgments
We would like to express our gratitude to Apurba Bera for providing the Crab pulsar data, which was invaluable for our research. This work is partially supported by the National Key Research and Development Program of China (2022SKA0130100,2020SKA0120300), the National Natural Science Foundation of China (grant Nos. 12041306, 12273113,12233002,12003028), the international Partnership Program of Chinese Academy of Sciences for Grand Challenges (114332KYSB20210018), the National Key R&D Program of China (2021YFA0718500), the ACAMAR Postdoctoral Fellow, China Postdoctoral Science Foundation (grant No. 2020M681758), and the Natural Science Foundation of Jiangsu Province (grant Nos. BK20210998). JJG acknowledges the support from the Youth Innovation Promotion Association (2023331). JSW acknowledges the support from the Alexander von Humboldt Foundation.
Appendix A Formulation of soliton radiation
Recent kinetic plasma simulations and theoretical studies show growing support on the existence of long-lasting charged solitons that provide coherent radio emission. Considering solitons emerging from an initial white noise field with the dimensionless correlation wavenumber () in the plasma frame, and bunches within each soliton, the corresponding wavenumber of the bunch in the observer frame is (Rahaman et al., 2022)
| (A1) |
and its longitudinal length is , where is the bulk Lorentz factor of the pairs and is average Lorentz factor in the plasma frame. For a perturbation wave with a phase velocity of () in the plasma frame, the observed flux density from each bunch could write as (Buschauer & Benford, 1976)
| (A2) |
where is the charge number of the bunch with a transverse length of , is the curvature radius, is the angle between the line of sight () and the tangent of the local field (), and is related to Bessel functions that determine the radiation pattern, i.e.,
| (A3) | |||||
| (A4) | |||||
| (A5) | |||||
| (A6) |
Finally, the observed flux from the -th soliton is . In our calculations, we choose a to select the wavenumbers being radiated intensely around , which means faint solitons with moderate deviations from are omitted. Also, typical values of and are adopted for all solitons.
References
- Bera & Chengalur (2019) Bera, A., & Chengalur, J. N. 2019, MNRAS, 490, L12, doi: 10.1093/mnrasl/slz140
- Beskin & Litvinov (2022) Beskin, V. S., & Litvinov, P. E. 2022, MNRAS, 510, 2572, doi: 10.1093/mnras/stab3575
- Bhattacharyya et al. (2018) Bhattacharyya, B., Lyne, A. G., Stappers, B. W., et al. 2018, MNRAS, 477, 4090, doi: 10.1093/mnras/sty923
- Biggs (1992) Biggs, J. D. 1992, ApJ, 394, 574, doi: 10.1086/171608
- Burke-Spolaor (2013) Burke-Spolaor, S. 2013, in Neutron Stars and Pulsars: Challenges and Opportunities after 80 years, ed. J. van Leeuwen, Vol. 291, 95–100, doi: 10.1017/S1743921312023277
- Burke-Spolaor & Bailes (2010) Burke-Spolaor, S., & Bailes, M. 2010, MNRAS, 402, 855, doi: 10.1111/j.1365-2966.2009.15965.x
- Burke-Spolaor et al. (2012) Burke-Spolaor, S., Johnston, S., Bailes, M., et al. 2012, MNRAS, 423, 1351, doi: 10.1111/j.1365-2966.2012.20998.x
- Buschauer & Benford (1976) Buschauer, R., & Benford, G. 1976, MNRAS, 177, 109, doi: 10.1093/mnras/177.1.109
- Caleb et al. (2019) Caleb, M., van Straten, W., Keane, E. F., et al. 2019, MNRAS, 487, 1191, doi: 10.1093/mnras/stz1352
- Chen & Ruderman (1993) Chen, K., & Ruderman, M. 1993, ApJ, 402, 264, doi: 10.1086/172129
- Cordes & McLaughlin (2003) Cordes, J. M., & McLaughlin, M. A. 2003, ApJ, 596, 1142, doi: 10.1086/378231
- Deshpande & Rankin (2001) Deshpande, A. A., & Rankin, J. M. 2001, MNRAS, 322, 438, doi: 10.1046/j.1365-8711.2001.04079.x
- Gil & Sendyk (2000) Gil, J. A., & Sendyk, M. 2000, ApJ, 541, 351, doi: 10.1086/309394
- Goldreich & Julian (1969) Goldreich, P., & Julian, W. H. 1969, ApJ, 157, 869, doi: 10.1086/150119
- Hickish et al. (2016) Hickish, J., Abdurashidova, Z., Ali, Z., et al. 2016, Journal of Astronomical Instrumentation, 5, 1641001, doi: 10.1142/S2251171716410014
- Hotan et al. (2004) Hotan, A. W., van Straten, W., & Manchester, R. N. 2004, PASA, 21, 302, doi: 10.1071/AS04022
- Jiang et al. (2019) Jiang, P., Yue, Y., Gan, H., et al. 2019, Science China Physics, Mechanics, and Astronomy, 62, 959502, doi: 10.1007/s11433-018-9376-1
- Jiang et al. (2020) Jiang, P., Tang, N.-Y., Hou, L.-G., et al. 2020, Research in Astronomy and Astrophysics, 20, 064, doi: 10.1088/1674-4527/20/5/64
- Johnston et al. (2001) Johnston, S., van Straten, W., Kramer, M., & Bailes, M. 2001, ApJ, 549, L101, doi: 10.1086/319154
- Keane & Kramer (2008) Keane, E. F., & Kramer, M. 2008, MNRAS, 391, 2009, doi: 10.1111/j.1365-2966.2008.14045.x
- Kuzmin (2007) Kuzmin, A. D. 2007, Ap&SS, 308, 563, doi: 10.1007/s10509-007-9347-5
- Li et al. (2021) Li, D., Wang, P., Zhu, W. W., et al. 2021, Nature, 598, 267, doi: 10.1038/s41586-021-03878-5
- Lu et al. (2019) Lu, J., Peng, B., Liu, K., et al. 2019, Science China Physics, Mechanics, and Astronomy, 62, 959503, doi: 10.1007/s11433-018-9372-7
- McLaughlin et al. (2006) McLaughlin, M. A., Lyne, A. G., Lorimer, D. R., et al. 2006, Nature, 439, 817, doi: 10.1038/nature04440
- McLaughlin et al. (2009) McLaughlin, M. A., Lyne, A. G., Keane, E. F., et al. 2009, MNRAS, 400, 1431, doi: 10.1111/j.1365-2966.2009.15584.x
- Palliyaguru et al. (2011) Palliyaguru, N. T., McLaughlin, M. A., Keane, E. F., et al. 2011, MNRAS, 417, 1871, doi: 10.1111/j.1365-2966.2011.19388.x
- Rahaman et al. (2022) Rahaman, S. M., Mitra, D., Melikidze, G. I., & Lakoba, T. 2022, MNRAS, 516, 3715, doi: 10.1093/mnras/stac2264
- Ransom (2001) Ransom, S. M. 2001, PhD thesis, Harvard University, Massachusetts
- Reynolds et al. (2006) Reynolds, S. P., Borkowski, K. J., Gaensler, B. M., et al. 2006, ApJ, 639, L71, doi: 10.1086/502648
- Ruderman & Sutherland (1975) Ruderman, M. A., & Sutherland, P. G. 1975, ApJ, 196, 51, doi: 10.1086/153393
- Shapiro-Albert et al. (2018) Shapiro-Albert, B. J., McLaughlin, M. A., & Keane, E. F. 2018, ApJ, 866, 152, doi: 10.3847/1538-4357/aae2b2
- van Leeuwen & Timokhin (2012) van Leeuwen, J., & Timokhin, A. N. 2012, ApJ, 752, 155, doi: 10.1088/0004-637X/752/2/155
- van Straten et al. (2012) van Straten, W., Demorest, P., & Oslowski, S. 2012, Astronomical Research and Technology, 9, 237. https://arxiv.org/abs/1205.6276
- Wang et al. (2007) Wang, N., Manchester, R. N., & Johnston, S. 2007, MNRAS, 377, 1383, doi: 10.1111/j.1365-2966.2007.11703.x
- Weltevrede et al. (2006) Weltevrede, P., Stappers, B. W., Rankin, J. M., & Wright, G. A. E. 2006, ApJ, 645, L149, doi: 10.1086/506346
- Xu et al. (2022) Xu, H., Niu, J. R., Chen, P., et al. 2022, Nature, 609, 685, doi: 10.1038/s41586-022-05071-8
- Young et al. (2015) Young, N. J., Weltevrede, P., Stappers, B. W., Lyne, A. G., & Kramer, M. 2015, MNRAS, 449, 1495, doi: 10.1093/mnras/stv392
- Zhang et al. (2007) Zhang, B., Gil, J., & Dyks, J. 2007, MNRAS, 374, 1103, doi: 10.1111/j.1365-2966.2006.11226.x
- Zhang et al. (2000) Zhang, B., Harding, A. K., & Muslimov, A. G. 2000, ApJ, 531, L135, doi: 10.1086/312542