[figure]style=plain,subcapbesideposition=top
Non-equilibrium wet-dry cycling acts as a catalyst for chemical reactions
Abstract
Abstract: Recent experimental studies suggest that wet-dry cycles and coexisting phases can each strongly alter chemical processes. The mechanisms of why and to which degree chemical processes are altered when subject to evaporation and condensation are unclear. To close this gap, we developed a theoretical framework for non-dilute chemical reactions subject to non-equilibrium conditions of evaporation and condensation. We find that such conditions can change the half-time of the product’s yield by more than an order of magnitude, depending on the substrate-solvent interaction. We show that the cycle frequency strongly affects the chemical turnover when maintaining the system out of equilibrium by wet-dry cycles. There exists a resonance behavior in the cycle frequency where the turnover is maximal. This resonance behavior enables wet-dry cycles to select specific chemical reactions suggesting a potential mechanism for chemical evolution in prebiotic soups at early Earth.
The presence of catalysts severely alters the speed of chemical reactions. In contrast to reactants, they are not converted during the turnover of a substrate to a product. Catalysts affect the activation energy without changing the thermodynamic free energies of the substrate and product state Masel (2001). The use of catalysts ensures economic efficiency of most applications in chemical and biomolecular engineering Singh and Tandon (2014); Werner et al. (2010); Blaser and Studer (1999). In living systems, catalytic activity is mediated by enzymes. These enzymes are specialized proteins involved in almost all metabolic processes in the cell Alberty (2003); Srere (1987); Underkofler et al. (1958). Enzymes do not solely maximize the speed of chemical reactions; they are optimal concerning reaction speed and specificity Eigen and Hammes (1963); Eigen (1968), i.e., they catalyze only specific reactions in a mixture of extremely many reacting components. However, this optimal catalytic property for life had to develop during evolution Kauffman (2011); Oparin (1965); Orgel (1994). In other words, there were likely no enzymes at the molecular origin of life. It remains one of the mysteries of the molecular origin of life how functional products such as self-replicating RNA strands could have formed despite activation barriers significantly larger than Hay et al. (2010); Claeyssens et al. (2006).
\sidesubfloat[] \sidesubfloat[]
 \sidesubfloat[]
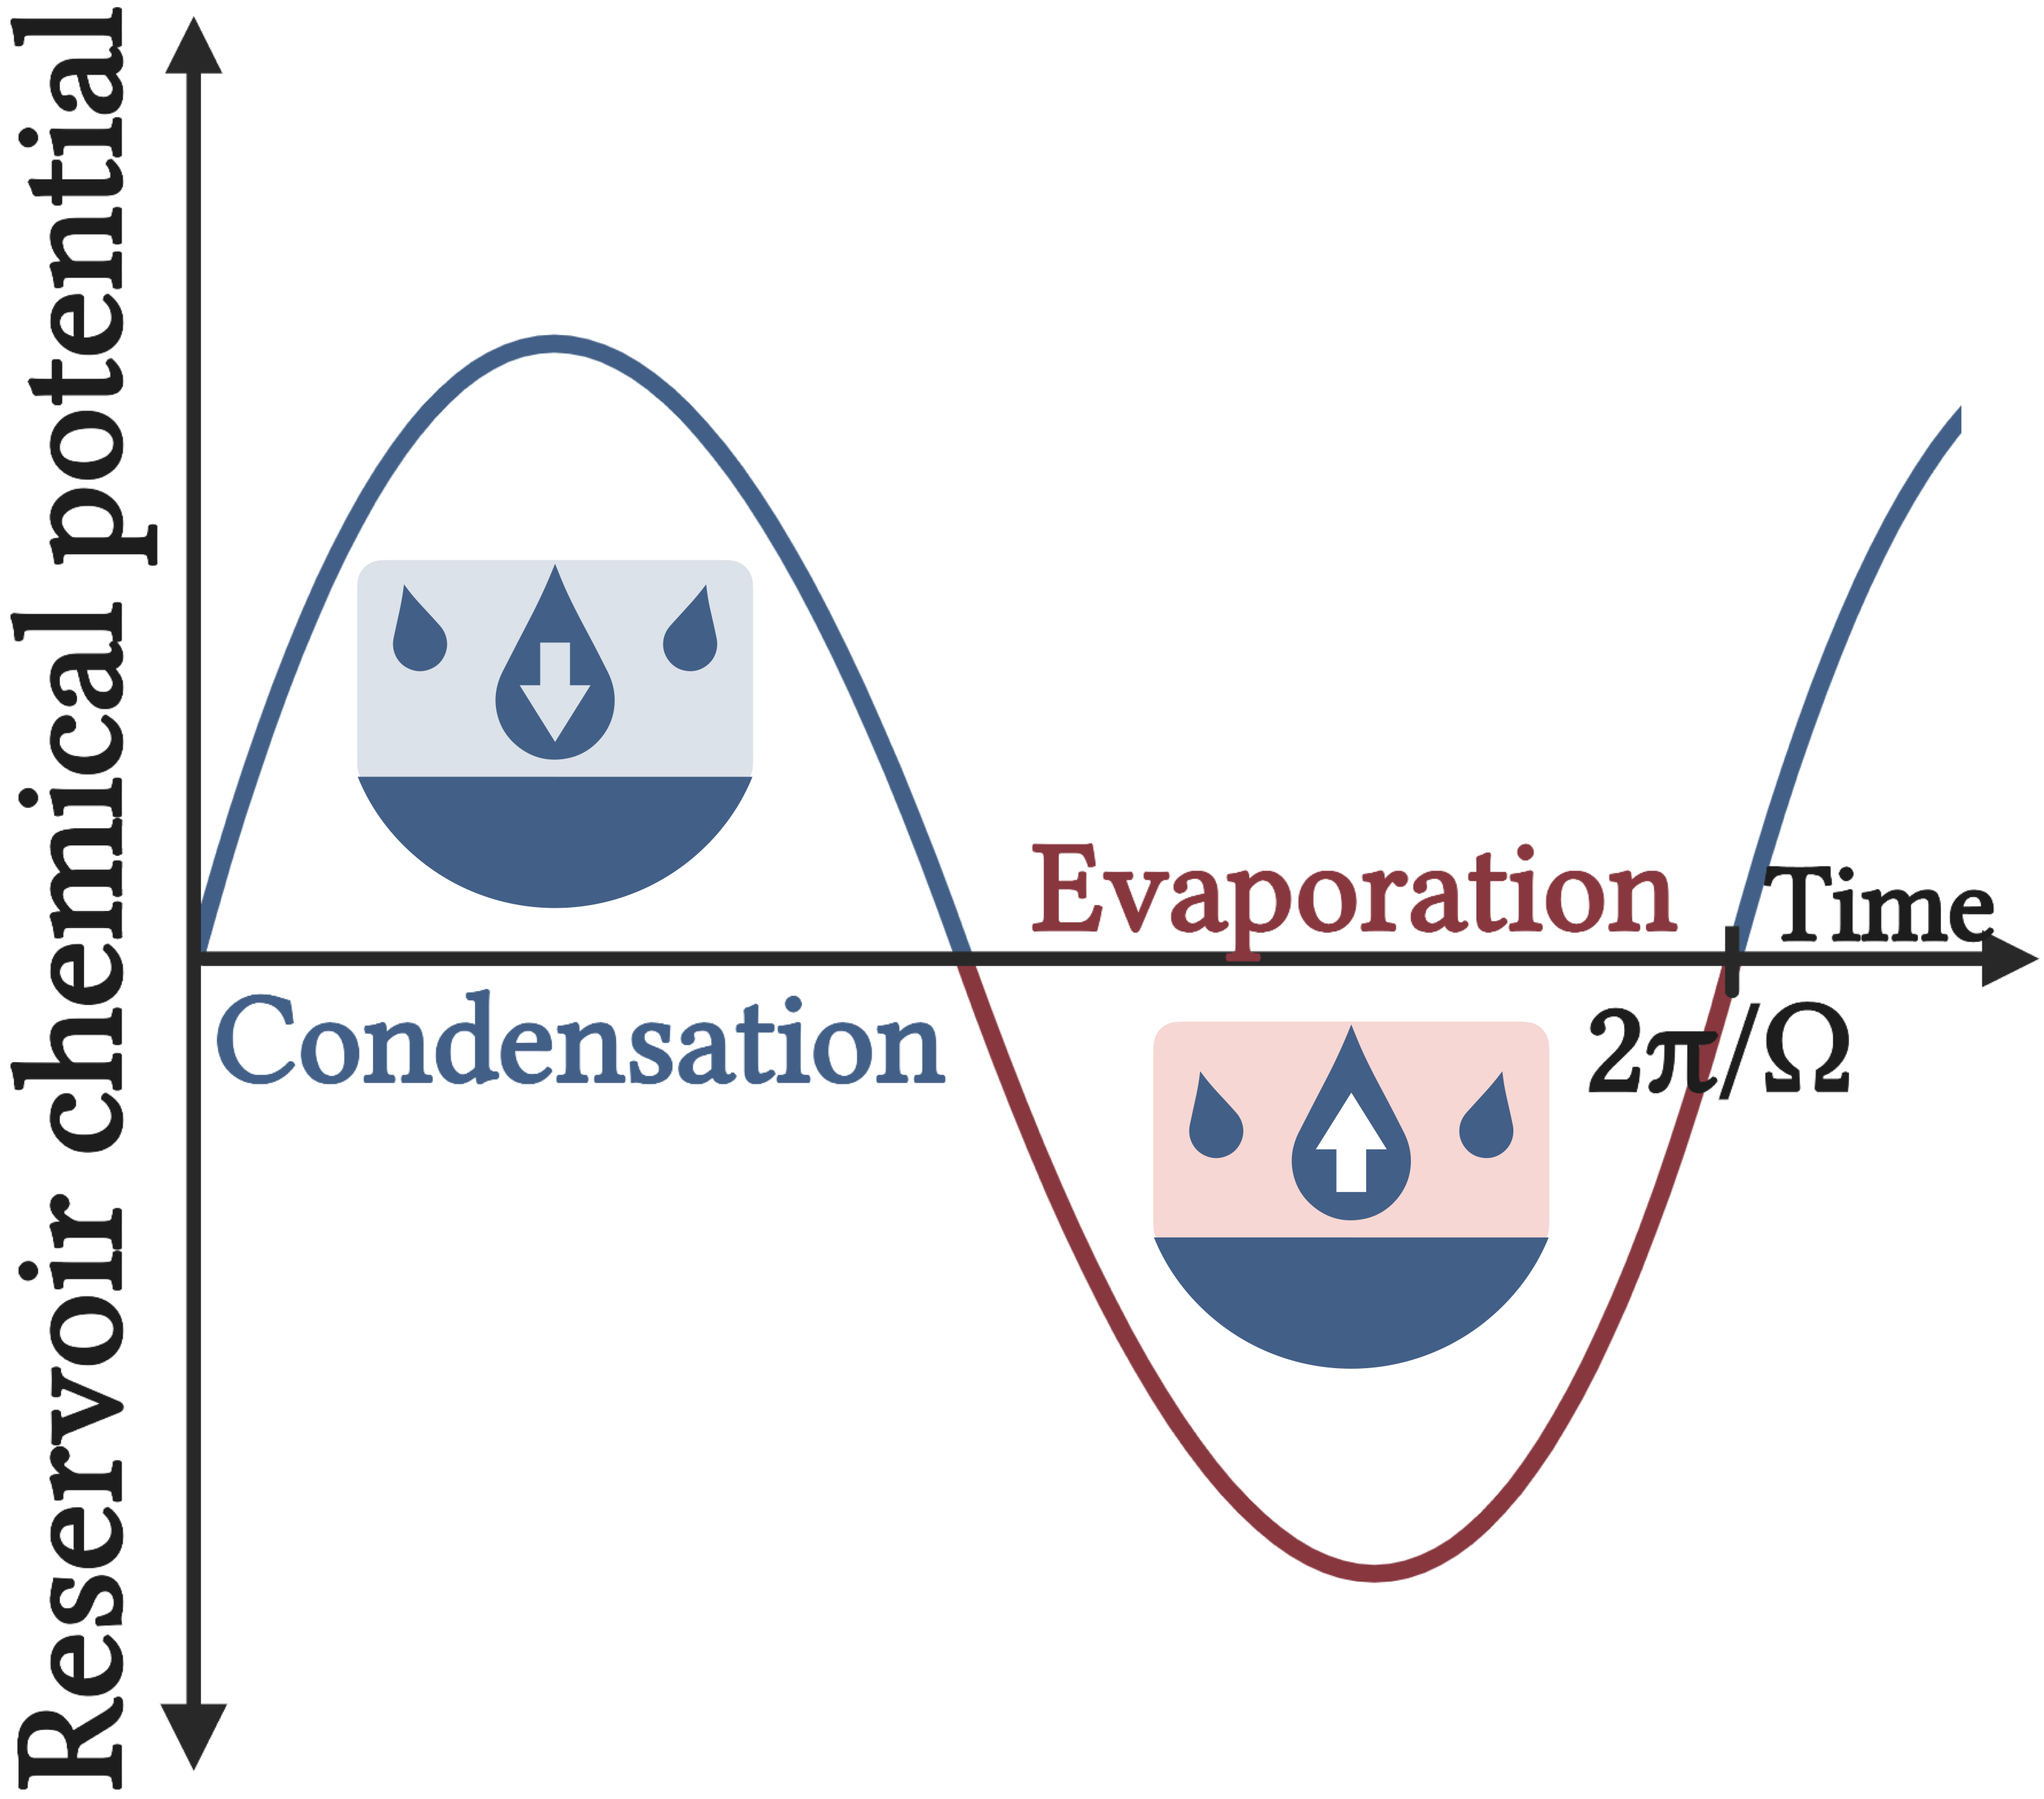
An alternative perspective on how to speed up chemical reactions is through non-equilibrium conditions Mast et al. (2013); Morasch et al. (2019); Baaske et al. (2007); Bartolucci et al. (2023a); Ianeselli et al. (2022); Matreux et al. (2021); Busiello et al. (2021). In fact, non-equilibrium applies to many processes in chemical engineering, almost all processes in living cells and prebiotic soup at early Earth. The reason is that these are all open systems that can exchange matter and entropy with their environment, termed dissipate systems Nicolis (1986); England (2015); Brogliato et al. (2020). Continuous dissipation is often achieved by cycles of the system’s control parameters, such as temperature or chemical potentials. Recently studied cases are wet-dry cycles Maguire et al. (2021); Fares et al. (2020); Becker et al. (2018); Tekin et al. (2022); Dass et al. (2023); Higgs (2016).
The ability of wet-dry cycles to affect the synthesis of compounds that are also relevant for the molecular origin of life is progressively backed by experiments (Forsythe et al., 2015; Mamajanov et al., 2014; Becker et al., 2018). Wet-dry cycles have been applied to catalyze the formation of polyacids (Weber, 1989), esters (Forsythe et al., 2015; Mamajanov et al., 2014), oligopeptides (Lahav et al., 1978; Rodriguez-Garcia et al., 2015; Fox and Harada, 1958), nucleosides (Becker et al., 2018), polynucleotides (Rajamani et al., 2008; Da Silva et al., 2015), polyethersulfone Fang et al. (1994), phosphorylation (Maguire et al., 2021) and lipid structures (Rajamani et al., 2008). Up to now, the mechanisms of how wet-dry cycles affect chemical processes, particularly in comparison to catalysts, remain elusive.
Unraveling such mechanisms is complex since reducing the solvent amount through evaporation generally leads to non-dilute conditions. As a result, non-linear thermodynamic contributions to chemical activities emerge in addition to altered kinetic activation barriers. Additionally, non-dilute systems can induce phase transitions, such as liquid-liquid phase separation Weber et al. (2019); Kato et al. (2021); Hyman et al. (2014), gel formation Blankschtein et al. (1985); Semenov and Rubinstein (1998); Deviri and Safran (2020); Bartolucci et al. (2023b), and solid precipitation Lewis (2010); Agarwal and Peters (2014). Recent experiments show that coacervate formation can be triggered by wet-dry cycles Fares et al. (2020). To interpret the existing experimental studies on the effects of wet-dry cycles on the synthesis of chemical buildings and to decipher the underlying physio-chemical mechanisms, a theoretical framework is lacking.
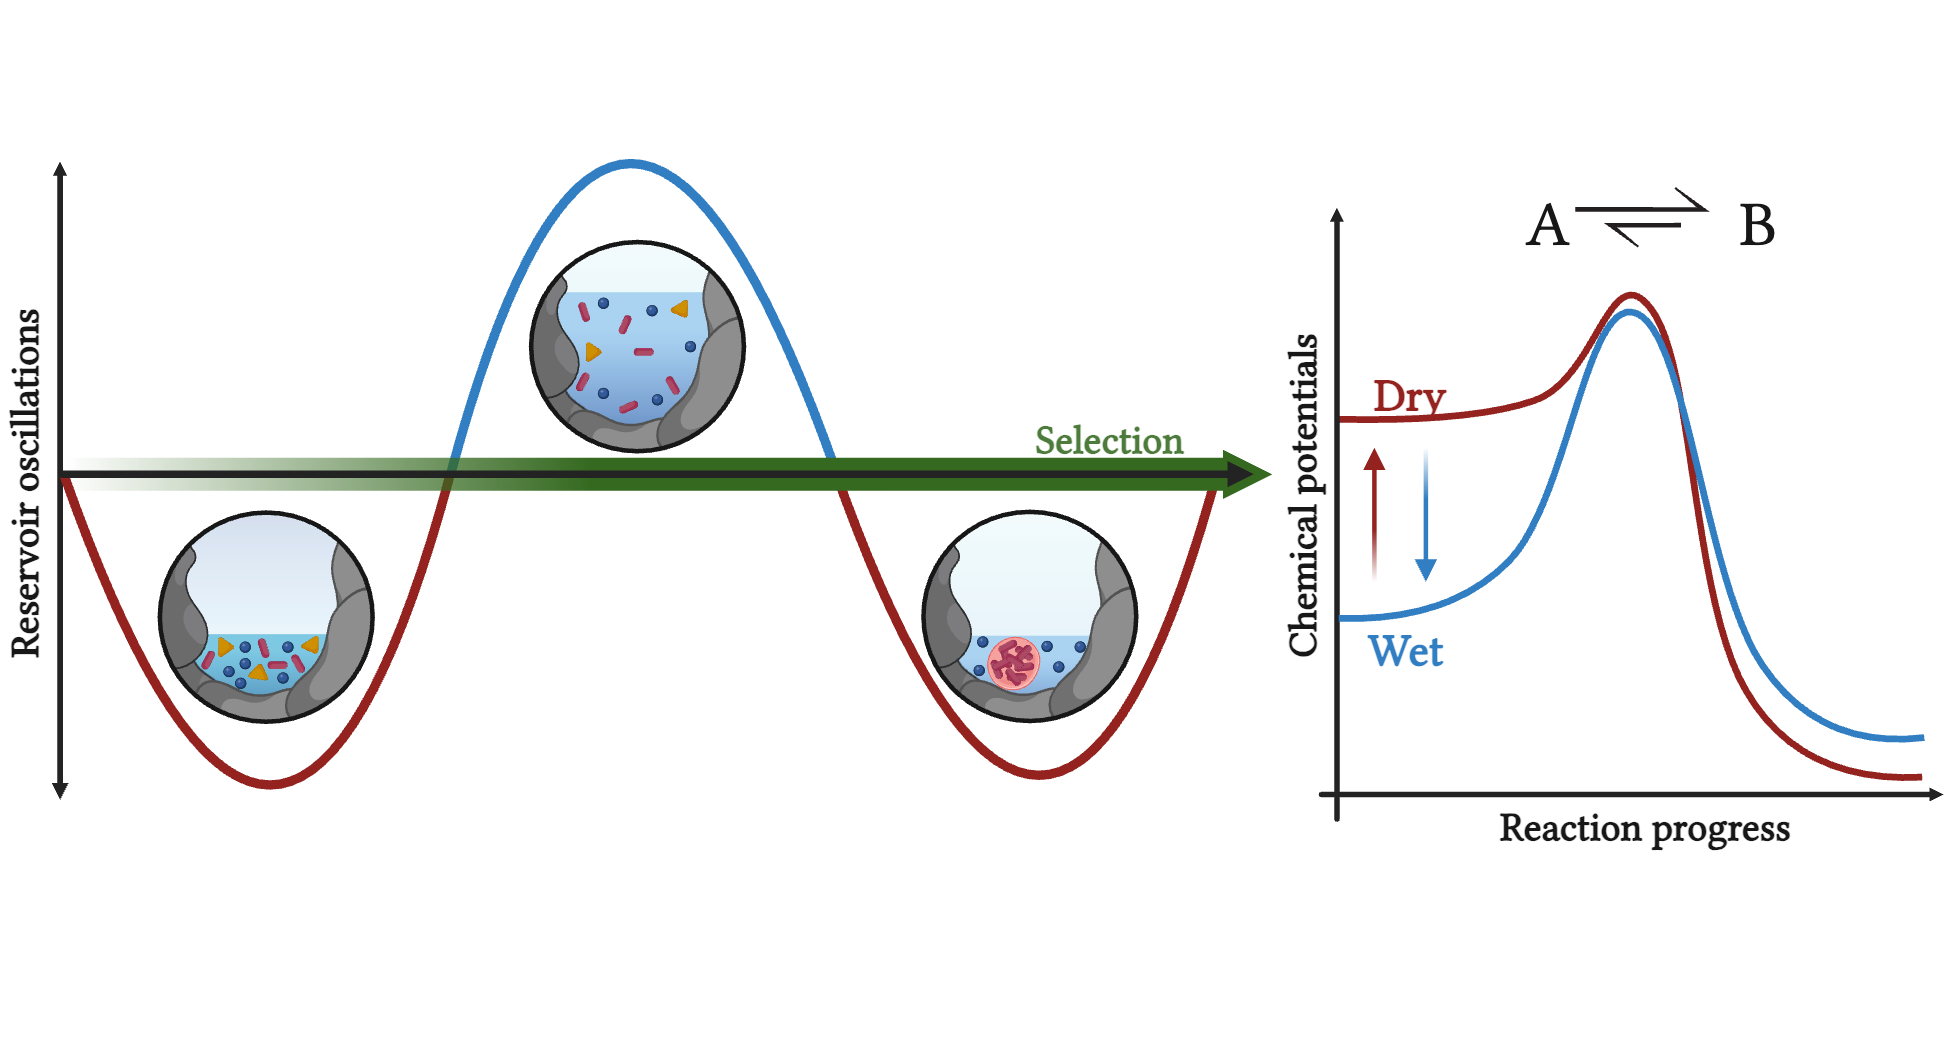
This work proposes a kinetic theory based on thermodynamic principles for a non-dilute chemically reacting mixture coupled to a cyclic wet-dry reservoir that drives the system out of equilibrium; see Fig. 1b,c. We show to what extent and under which conditions both evaporation and condensation of solvent can speed up or slow down rates of chemical reactions. In contrast to catalysts that solely affect activation barriers, we find that solvent evaporation and condensation can significantly alter the chemical potentials of substrate and product once the system is driven toward non-dilute conditions, illustrated in Fig. 1. We also study how wet-dry cycles allow for continuous chemical activity by keeping the system out of equilibrium. For this case, a resonance cycling frequency exists for each evaporation/condensation flux at which the chemical turnover is maximal. This resonance behavior provides a selection pressure for specific chemical reaction networks suggesting wet-dry cycles as potential catalyst supplements to kick-start the molecular evolution of life Carrea et al. (2005); Eijsink et al. (2005); Schulz et al. (2022).
Theory for wet-dry cycles with chemical reactions
We consider a mixture of volume V composed of components, each of particle number () in the Gibbs (--) ensemble with the Gibbs free energy . Evaporation and condensation of molecule is governed by the difference between the bulk chemical potential , and the reservoir chemical potential . In all our studies, the chemical potential of the reservoir is a control parameter that can be constant or vary in time. The evaporation and condensation flux describes the number of molecules passing through the surface area per unit time Weber et al. (2019):
| (1) |
where denotes the thermal energy. Here, is the kinetic evaporation/condensation coefficient for component . Equilibrium is reached when the chemical potentials between the reservoir and the bulk are equal, , implying no exchange between the bulk and the reservoir, . Note that Eq. (1) considers a symmetric form, , of the condensation flux, , and evaporation flux, , without the loss of generality. The key property is that detailed balance of the rates, , is satisfied.
\sidesubfloat[] \sidesubfloat[]
 \sidesubfloat[]
To calculate the chemical potential, we consider the mean field Gibbs free energy per volume Adame-Arana et al. (2020):
| (2) |
where is the interaction parameter characterizing the interaction between component and . Moreover, and denote the internal energy and molecular volume of component , respectively. The chemical potential of component , , thus becomes
| (3) |
where is given by
| (4) |
The volume fraction of a component is defined by the volume it occupies relative to the total system volume, , . The solvent volume fraction is set by all other volume fractions
| (5) |
The total volume change due to evaporation and condensation is equal to the volume of molecules removed from or added to the system per unit of time
| (6) |
Moreover, the volume change alters the volume fractions of all components, even components where , as , and thus affect their chemical potentials and chemical reactions. A reaction is written as
| (7) |
where denoted a chemical component and are the are stoichiometric matrix elements Bauermann et al. (2022a). For the forward and backward chemical reactions rates Weber et al. (2019) we choose a symmetric form:
| (8) |
From the chemical potential (3), we see that the forward and backward reaction rates are proportional to the product of their volume fractions . This implies that once a component gets depleted, reactions slow down and arrest when reaching zero volume fractions. The ratio between the forward and backward reaction rates satisfies detailed balance of the rates Jülicher et al. (1997):
| (9) |
where we have defined . The difference between the forward and backward reaction pathways, for different reactions, drives the net reaction rate
| (10) |
If the interaction strengths cross a certain threshold value, the system will phase separate into two phases (denoted I and with different composition , but same chemical potential
| (11) |
The time evolution of the non-solvent volume fraction of a phase-separated system follows Bauermann et al. (2022a); Weber et al. (2019); Bartolucci et al. (2023a, 2021):
| (12) |
where gives the diffusive flux between the phases. The volume change of each phase for volume-conserving chemical reactions is given by
| (13) |
To determine the diffusive flux , we use the constraints from phase equilibria (Eq. (11)). See appendix C for further discussion. For a homogeneous system, the governing equations are retrieved by setting , and dropping the phase specifying superscript. Accounting for transition states in the theory leads to the same kinetic equations, as long as the transition state is short-lived; see appendix D for a detailed discussion.
For a phase-separated system, the chemical reactions concomitantly occur in both phases, while the fluxes related to evaporation/condensation are considered to occur at a surface area enclosing the dilute phase. As the two phases are at phase equilibrium, the choice of which phase is in contact with the reservoir becomes irrelevant. Furthermore, we will assume that the reaction rate coefficient does not depend on the phase . We consider that evaporation/condensation of macromolecules is negligible compared to the solvent Loche et al. (2022), such that . When only the solvent is evaporating/condensing, and no chemical reactions occur, the ratio of each non-solvent volume fraction, , is conserved. To reduce dimensionality and the number of free parameters, we will consider a single mono-molecular reaction , such that , , and . The kinetic algorithm to evolve the system according to Eq. (12) builds on a method derived by Bauermann and Laha Bauermann et al. (2022a); see Appendix C for how the theory accounts for the phase equilibrium constraint, and Appendix A for the properties a system should have for phase equilibrium to hold well at each time during the kinetics.
Results
Thermodynamics of evaporation/condensation mixtures without chemical reactions
\sidesubfloat[] \sidesubfloat[]
 \sidesubfloat[]
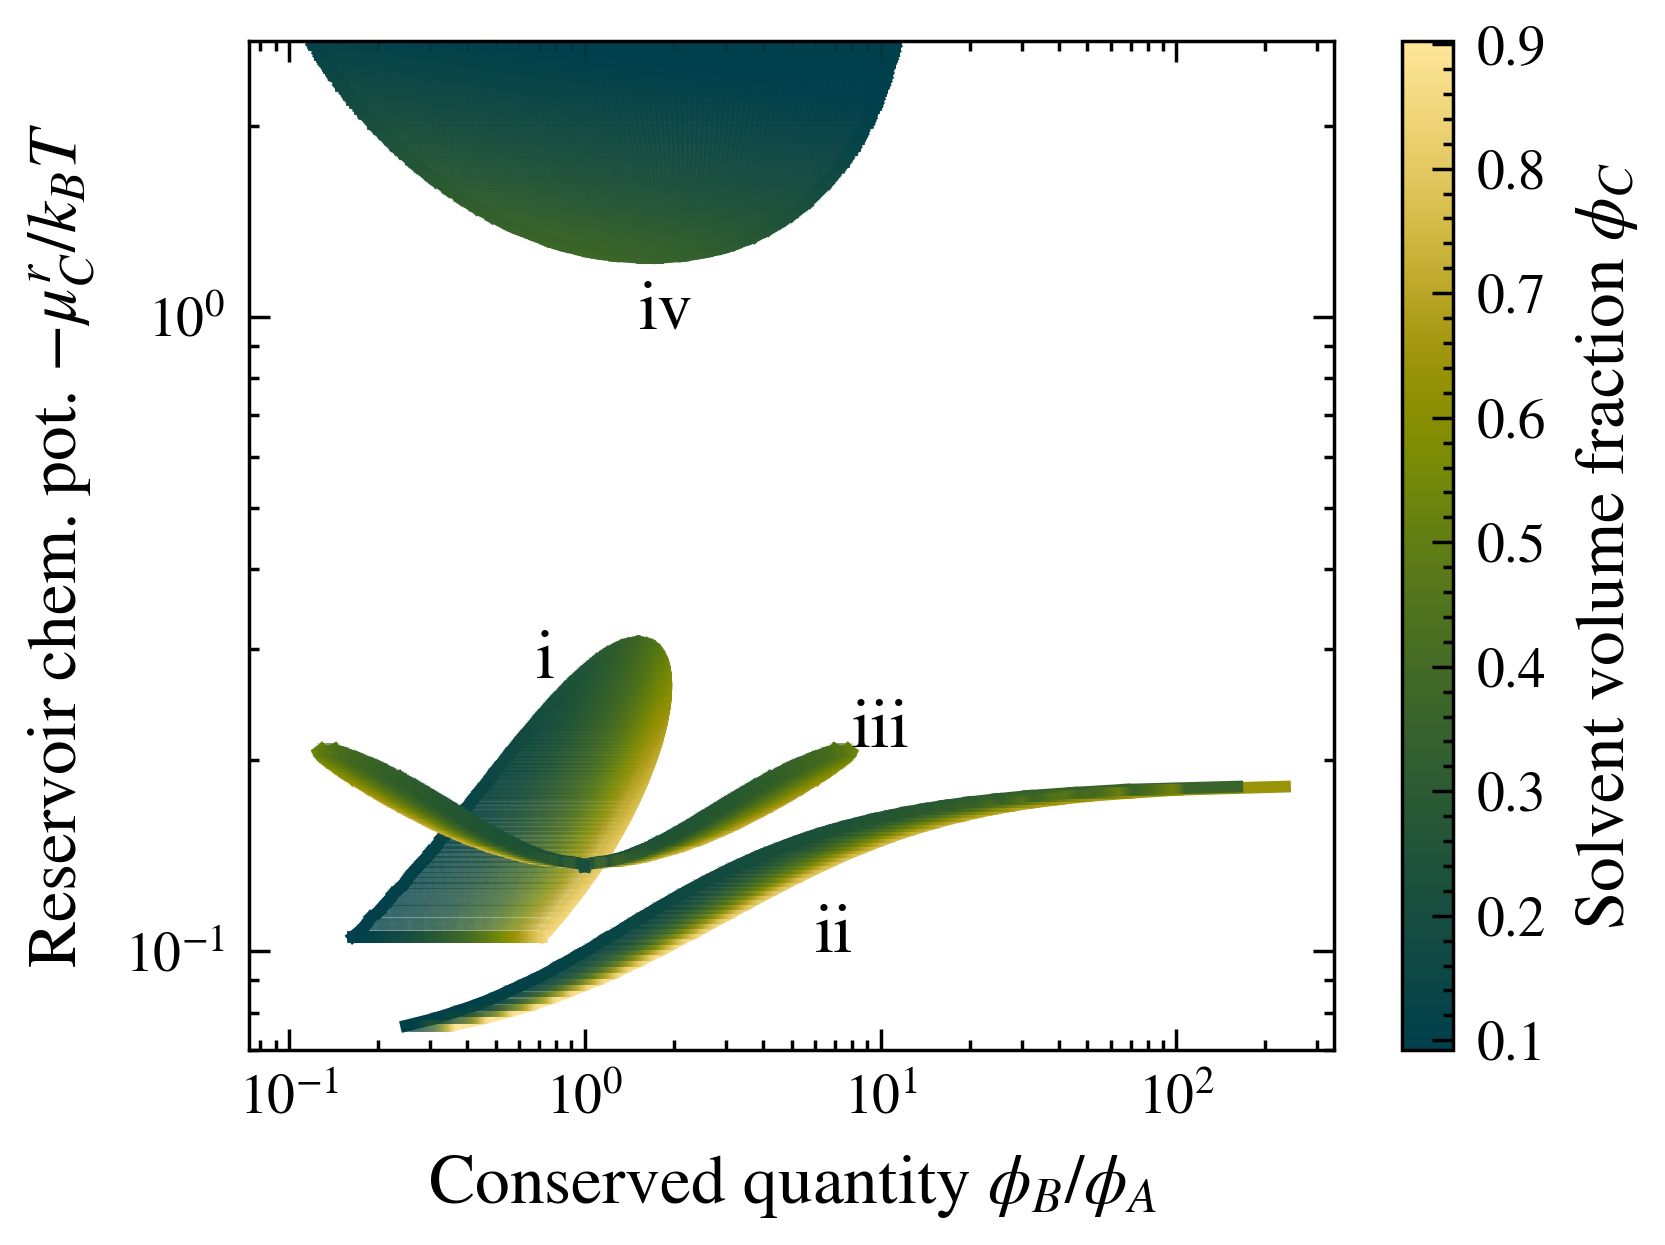
To understand chemical kinetics in systems that can phase separate and undergo wet-dry cycles, it is instrumental first to understand equilibrium states in the absence of chemical reactions. Equilibrium states composed of coexisting phases form through evaporation/condensation if the equilibria are compatible. Compatible equilibria refer to the case where the phase equilibrium condition (11) is concomitantly satisfied together with one or more other equilibrium conditions Bauermann et al. (2022a). In absence of chemical processes, this other condition corresponds to evaporation-condensation equilibrium. Graphically, such compatible equilibria correspond to the intersections in Fig. 2 between the binodal and the mononodal line that is set by the reservoir chemical potential (orange dashed line). During evaporation and condensation is conserved. Thus, the domain of compatible equilibria is cone-shaped and is spanned by two distinct conservation lines of constant (orange domains in Fig. 2). Any initial state will move during its evaporation/condensation kinetics and settle in a compatible equilibrium with coexisting phases. The number and the area of domain with compatible equilibria depend on the interactions among the molecules. The area of compatible domains increases when and interact more differently with the solvent (case i in contrast to ii and iii), or when and phase separate independently of the solvent (case iv).
\sidesubfloat[]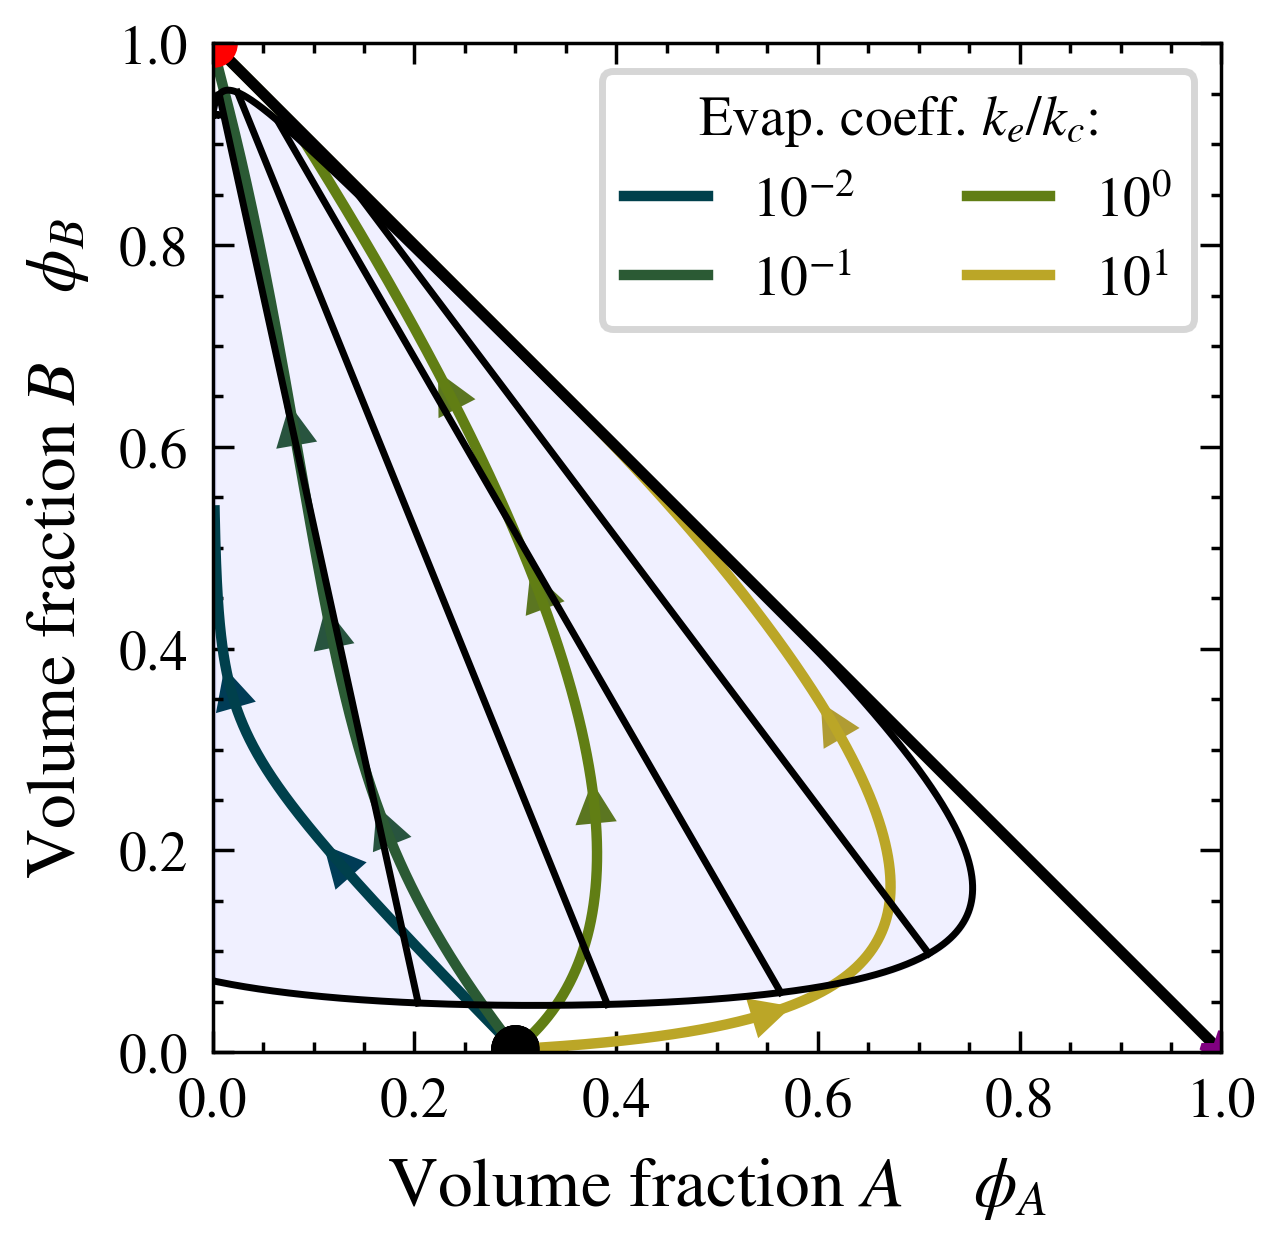 \sidesubfloat[]
 \sidesubfloat[]
\sidesubfloat[]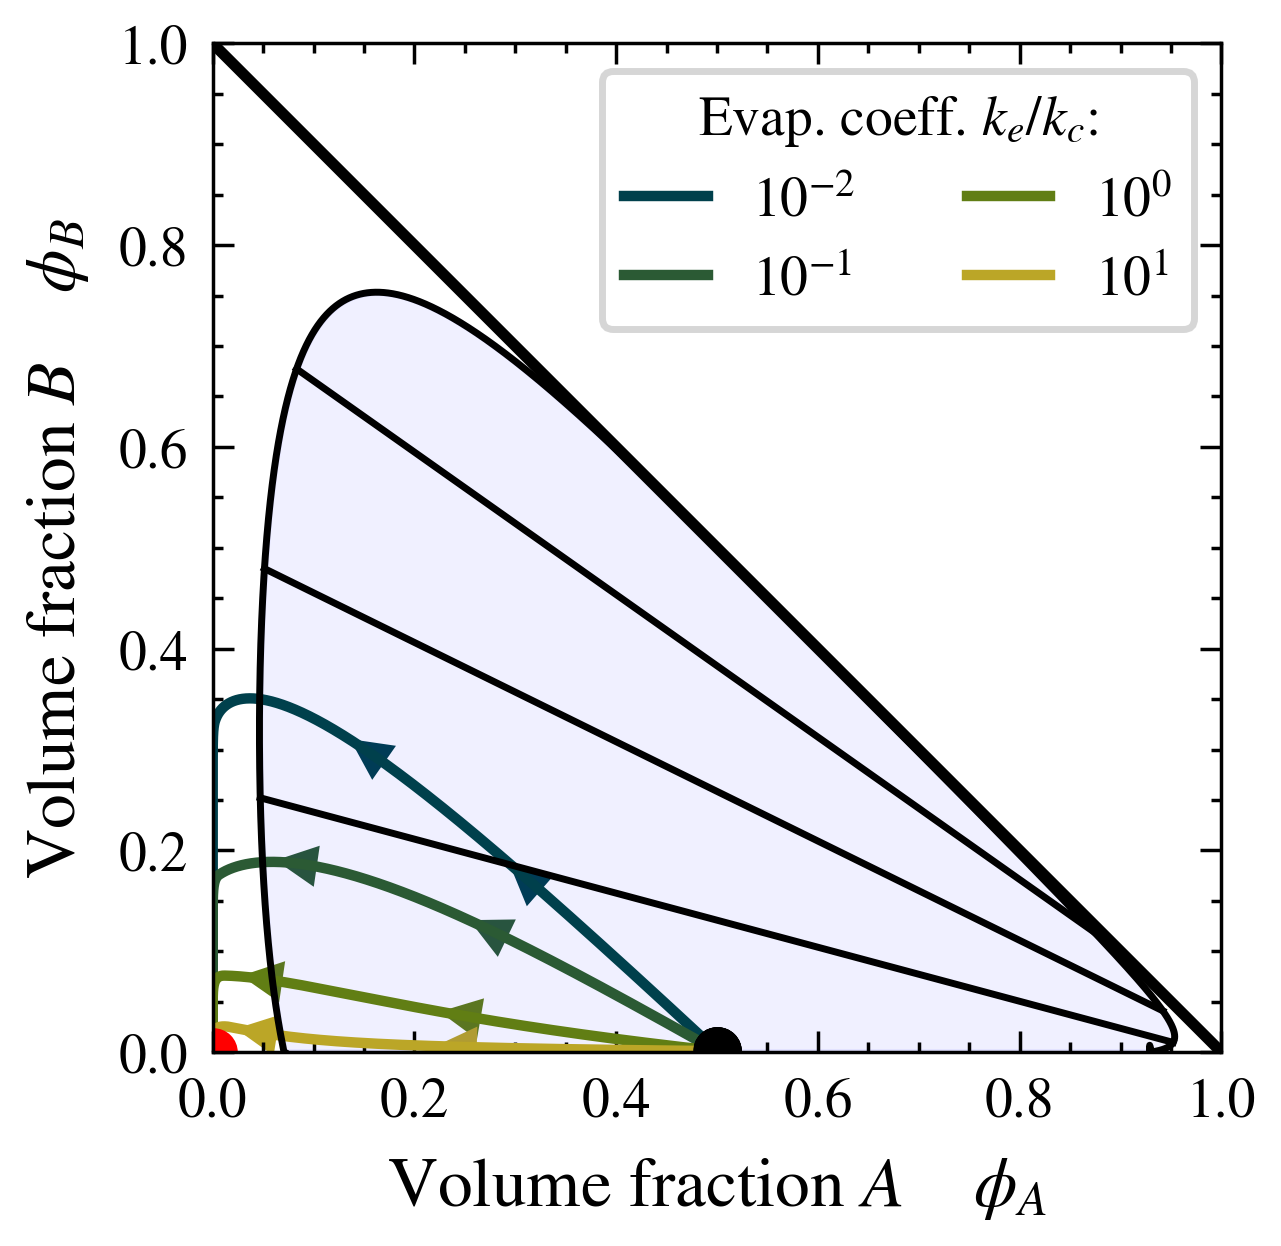 \sidesubfloat[]
 \sidesubfloat[]
The equilibrium states are homogeneous when evaporation-condensation and phase equilibrium are incompatible. Such incompatible states graphically correspond to the complement of the orange shaded domains in Fig. 2, i.e., the values of that lie outside of the binodal. Incompatible equilibria are favoured when the and interact similarly with the solvent, and when neither or phase separates with the solvent, as discussed for compatible equilibria. All equilibria are incompatible for some values of the reservoir chemical potential (green and yellow lines in Fig. 2).
The phase behavior of the evaporating/condensing mixtures (i-iv) without chemical reactions can be summarized by the thermodynamic phase diagram spanned by the reservoir chemical potential and the conserved variable . The different interactions (i-iv) lead to very different shapes where two phases can coexist with very different values of the conserved variable , as shown in Fig. 2. For case iv, where the coexisting phases have a similar solvent volume fraction, the non-solvent components phase separates independently of the solvent. As a result, each phase has a large difference in , creating a significant phase-separated domain.
Thermodynamics of evaporation/condensation mixtures with chemical reactions
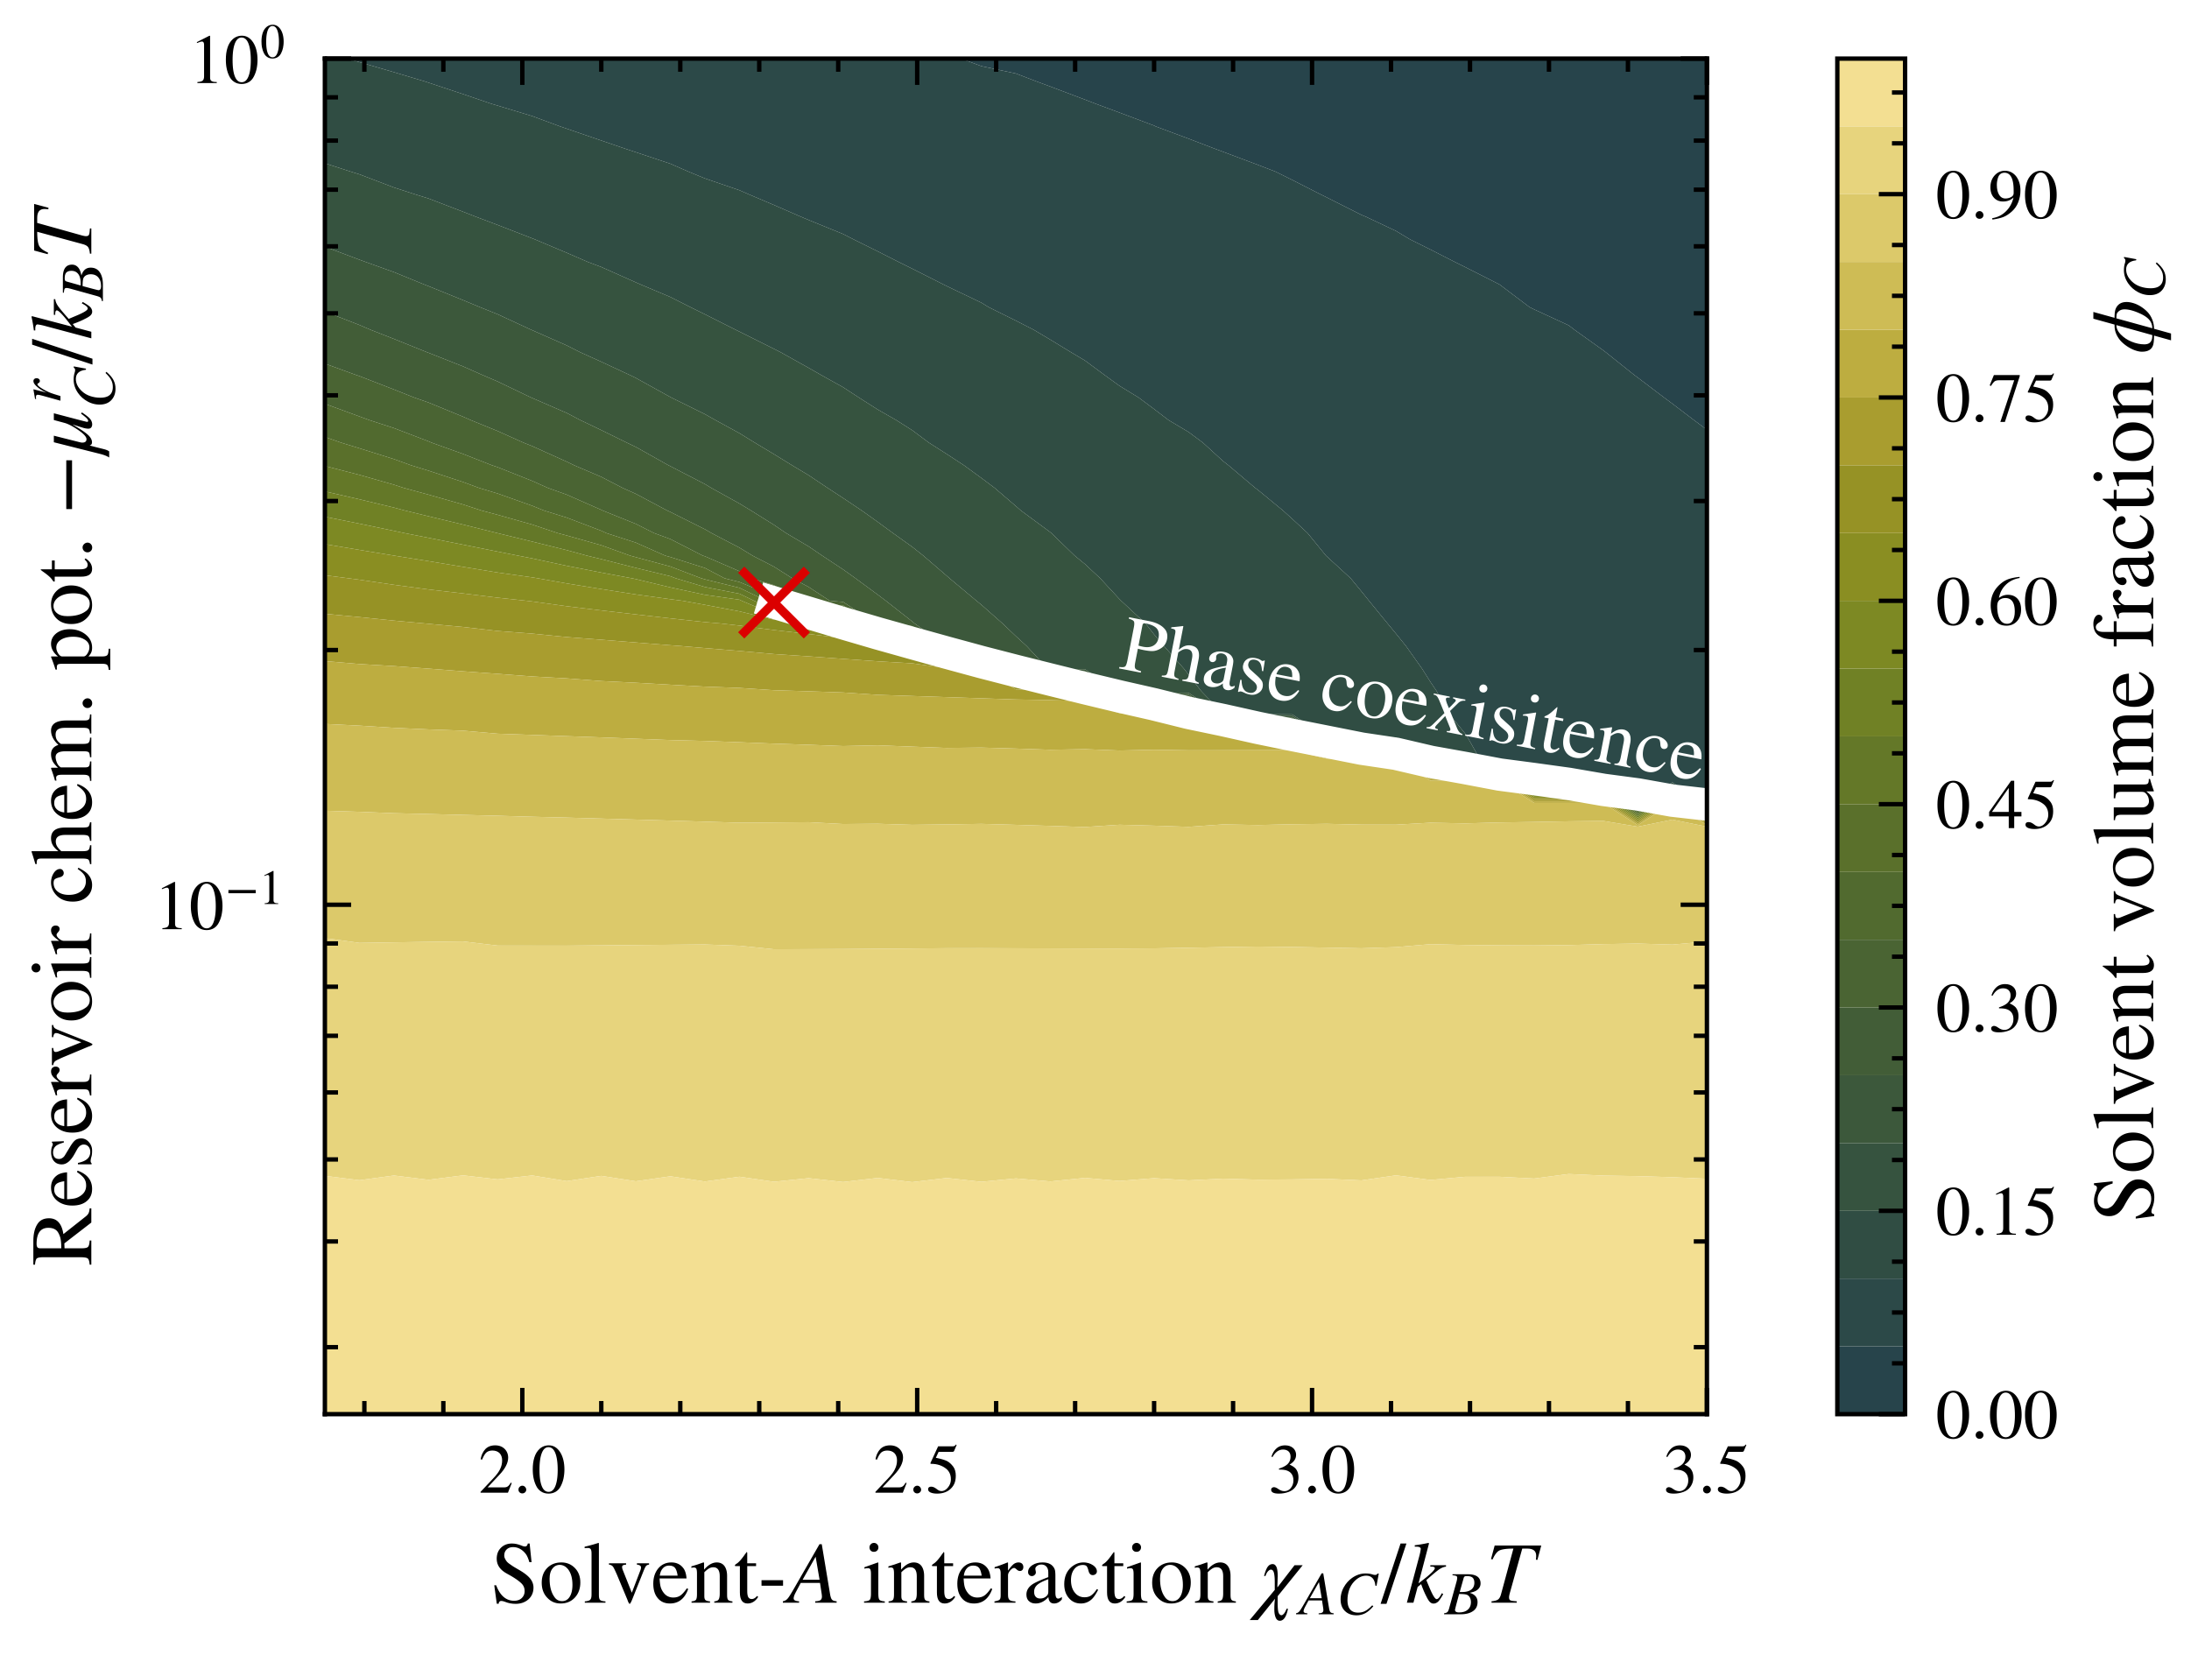
In the presence of chemical reactions, is not conserved, and compatible equilibria are no longer achievable. Thermodynamic equilibrium, therefore, always corresponds to a homogeneous state where the conditions of chemical equilibrium () and evaporation-condensation equilibrium () are fulfilled; see the intersection between the red and green line in Fig. 3. Any initial state will evolve following a flow field in the phase diagram toward the fixed point of thermodynamic equilibrium; see Fig. 3. Each point in this flow diagram has two independent directions that characterize the rates of change in the average volume fractions, which correspond to the chemical turnover flux of constant and evaporation-condensation flux of constant ; see vectors shown in Fig. 3. Such fluxes of strength visualized by the length of each vector are set by and . Gibbs’ phase rule (discussed in appendix E) makes the domain of coexisting states inaccessible at thermodynamic equilibrium, such that small changes in reservoir chemical potential close to the binodal line pronounces significant changes in the equilibrium compositions. This behavior is shown in Fig. 3, where solvent-rich and solvent-poor equilibrium states are separated by the phase coexistence line ending up at the critical point (red cross) in Fig. 3.
\sidesubfloat[]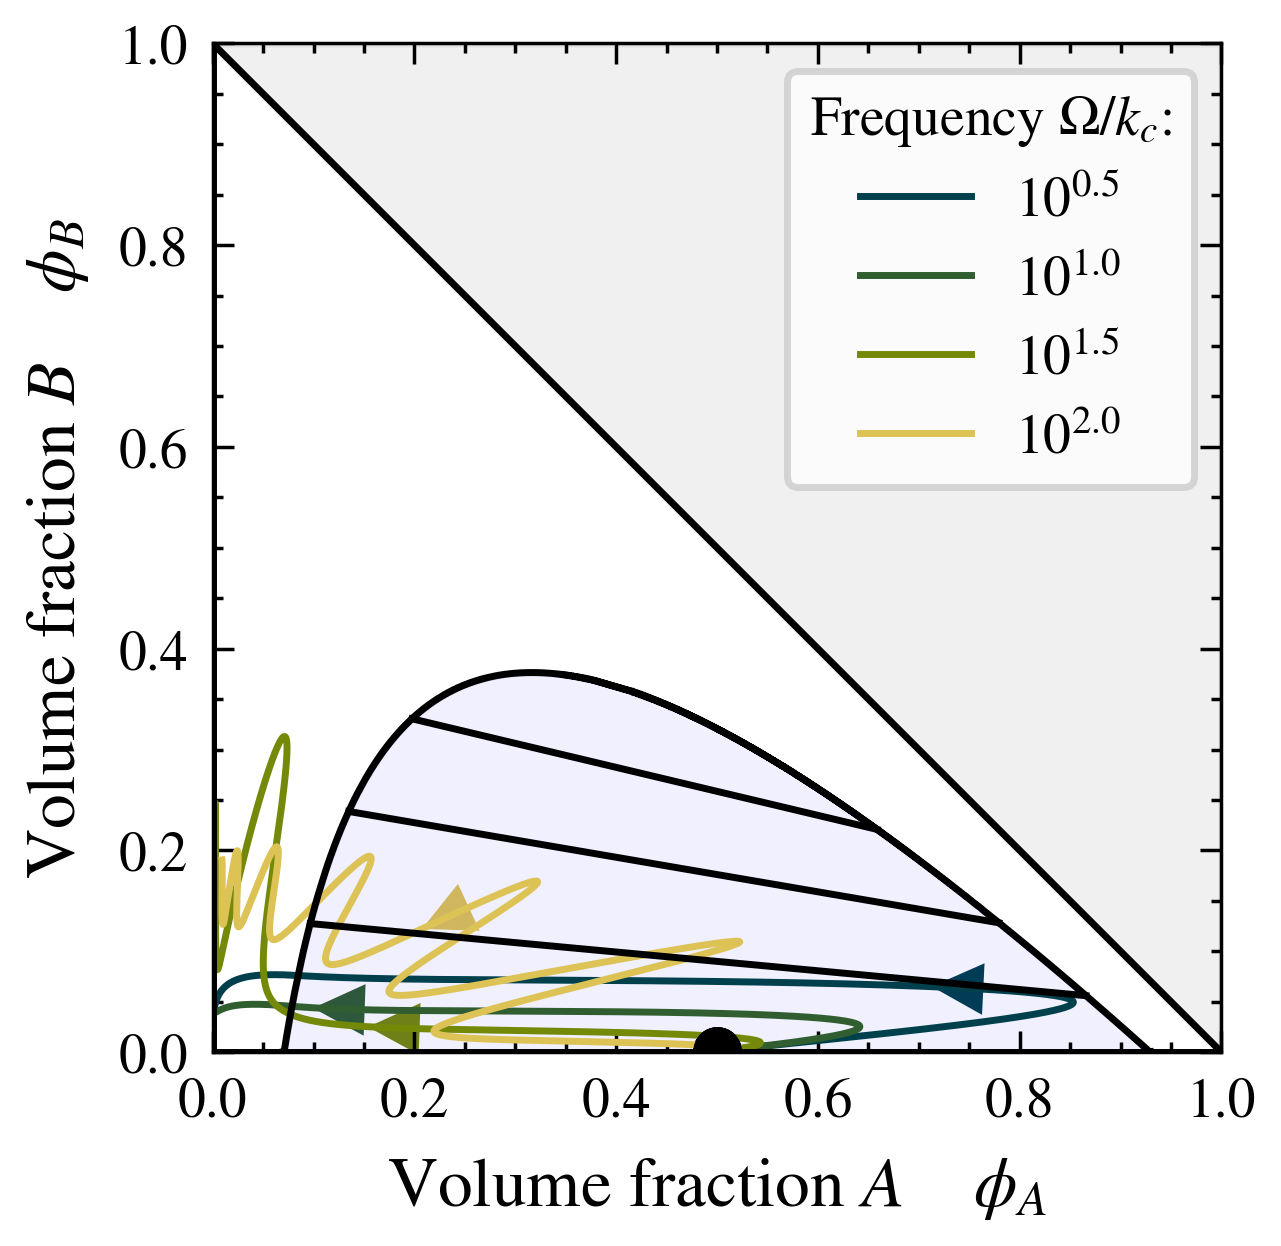 \sidesubfloat[]
 \sidesubfloat[]
\sidesubfloat[]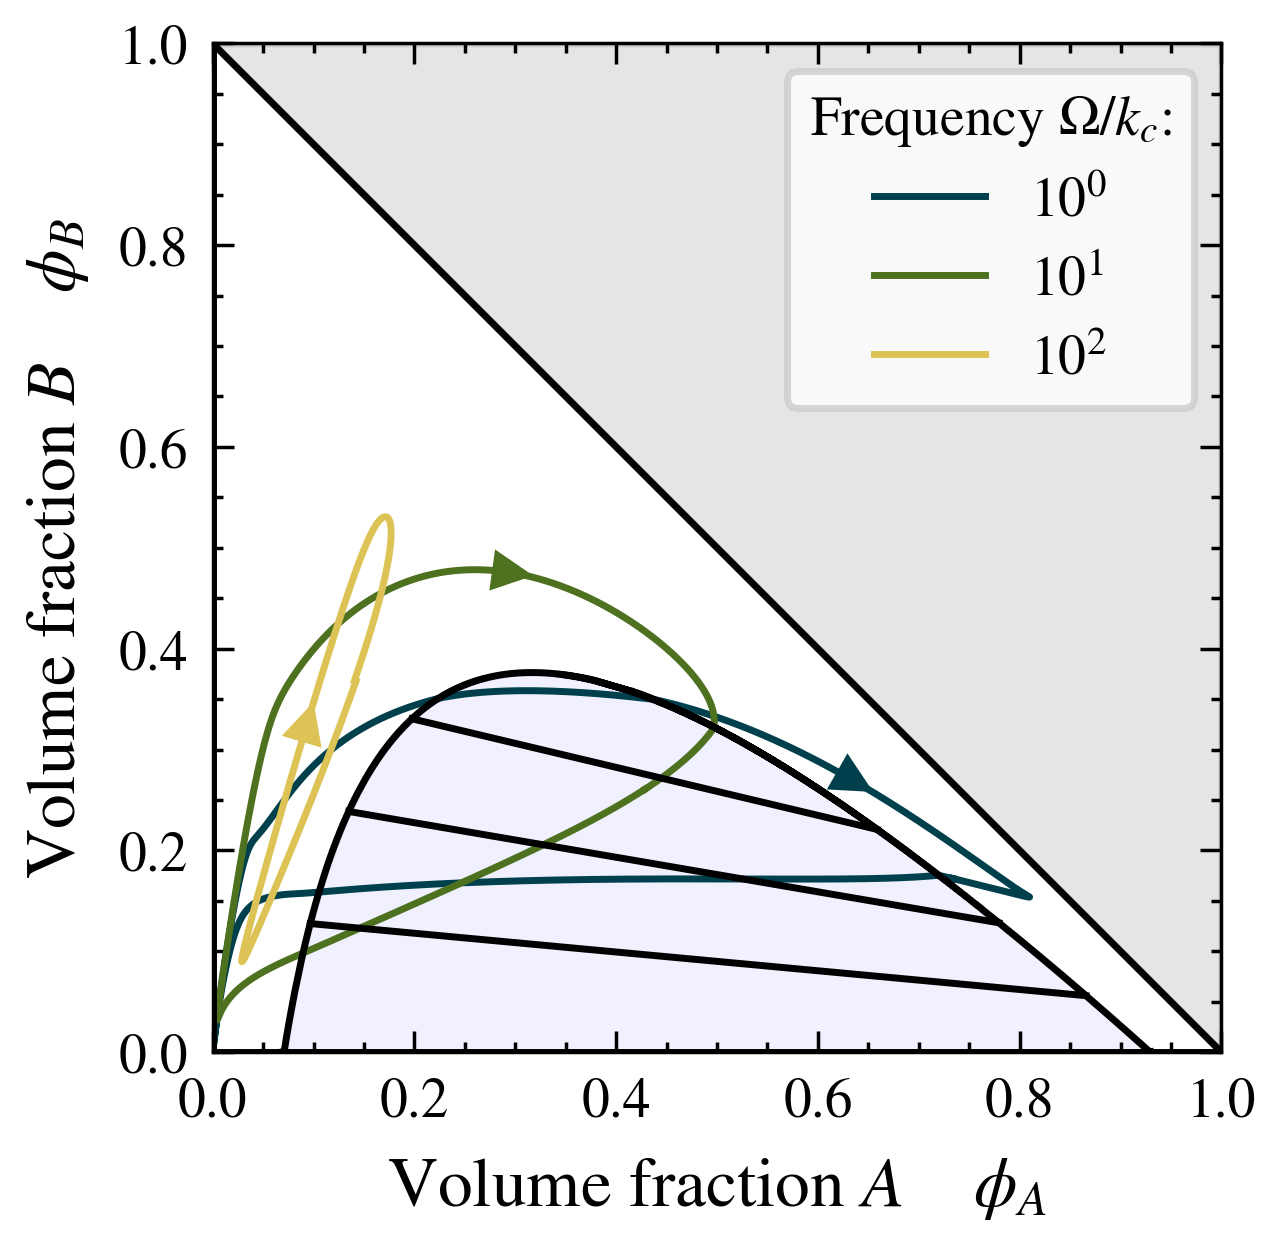 \sidesubfloat[]
 \sidesubfloat[]
Speed-up and slow-down of chemical reactions through evaporation and condensation
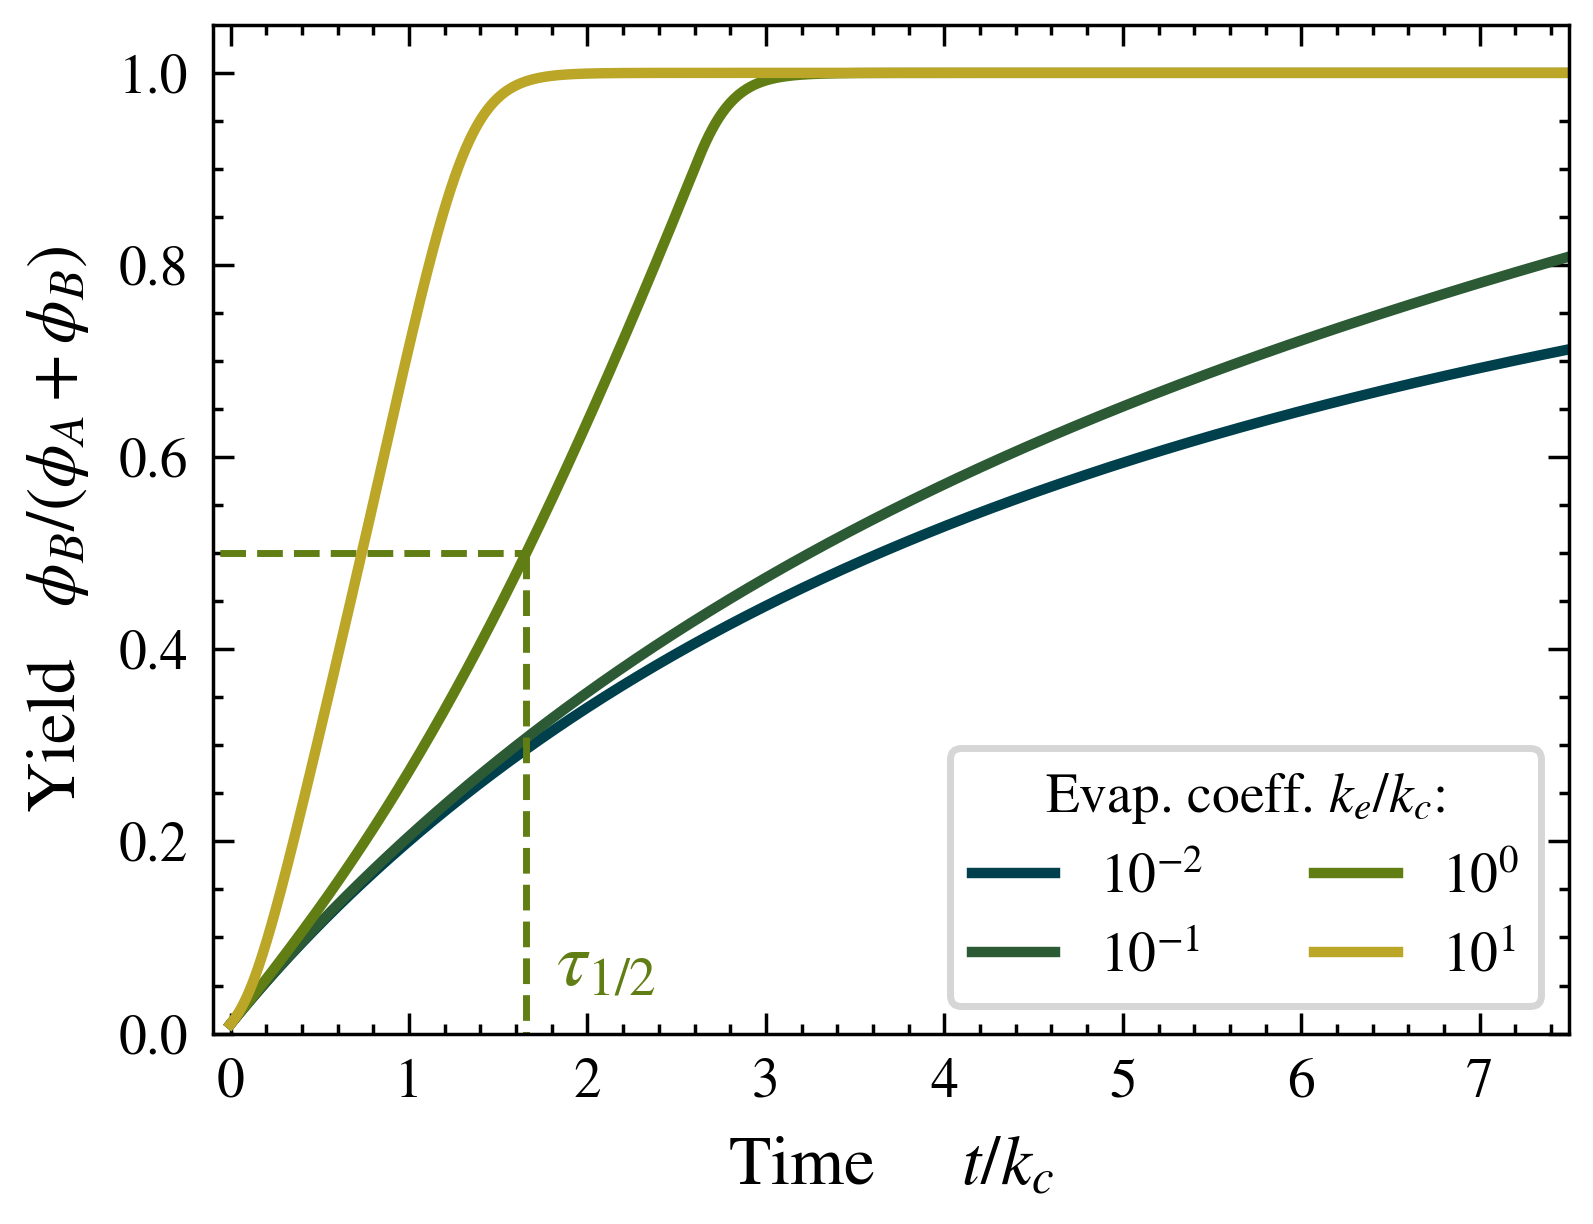
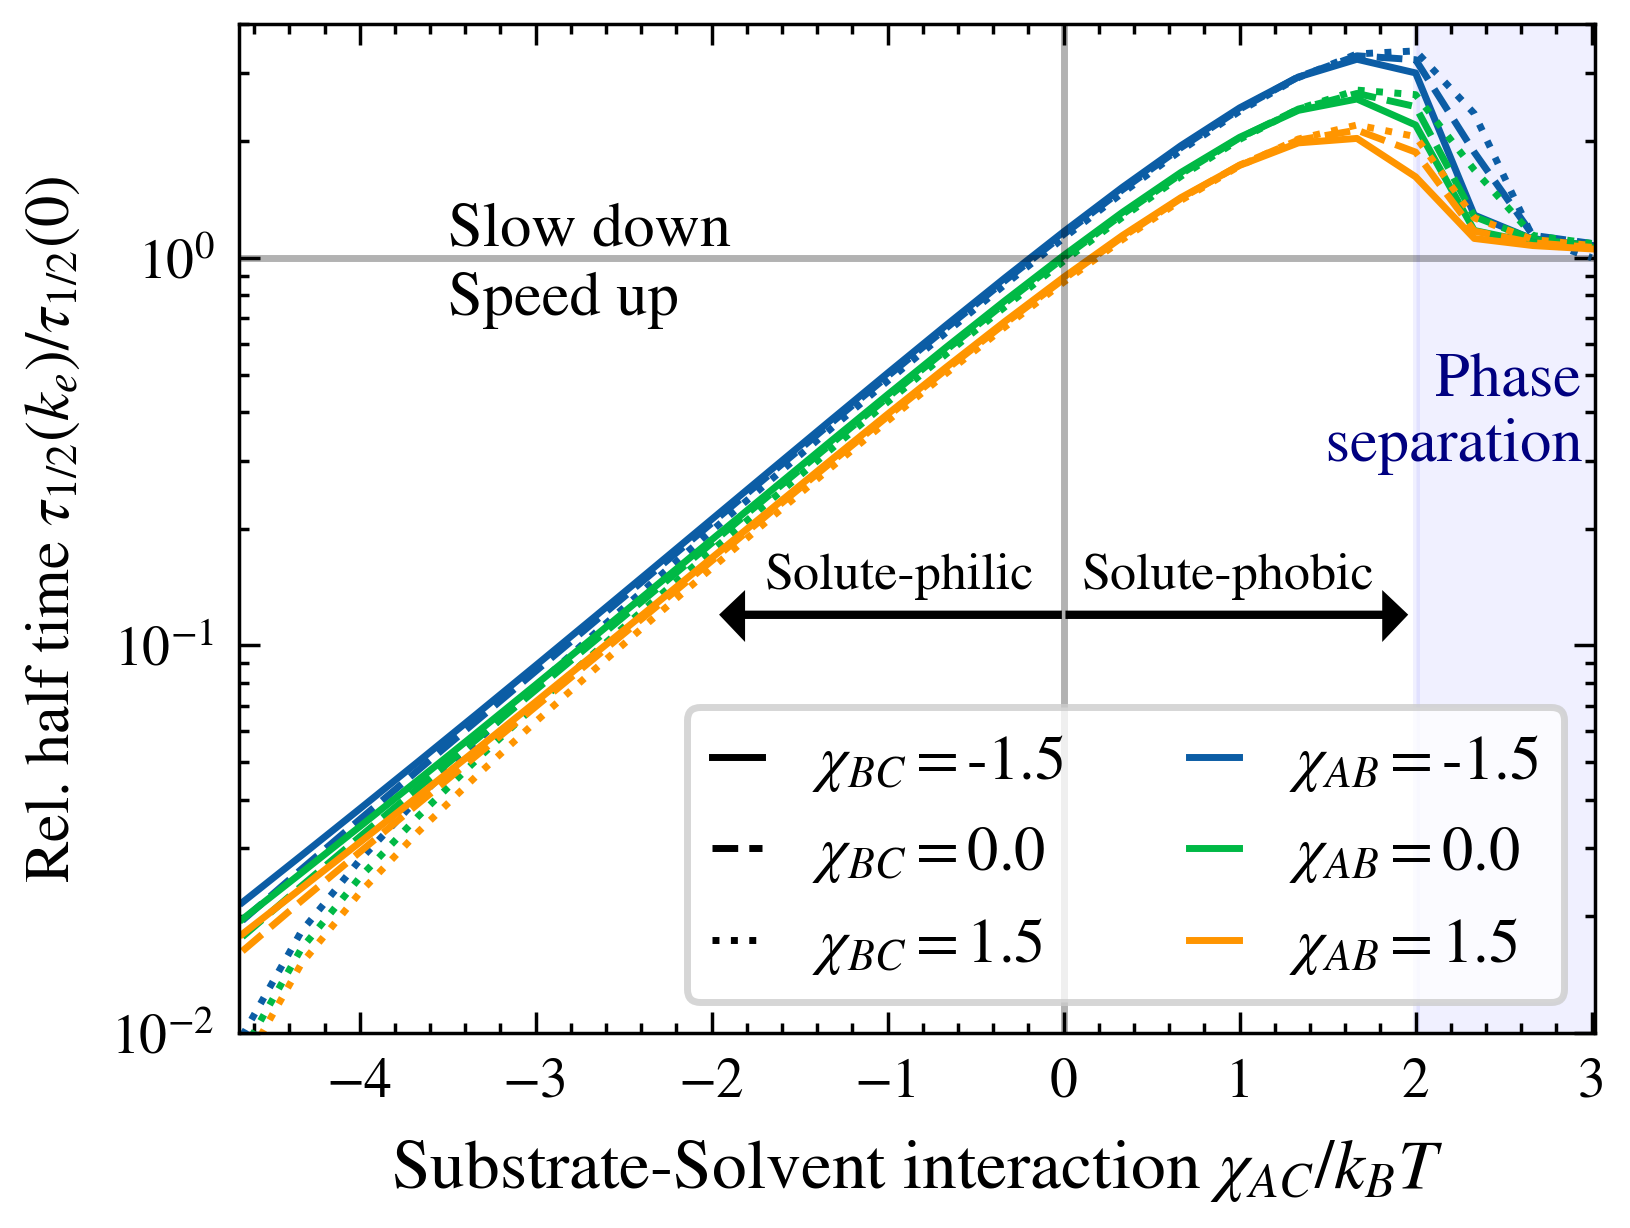
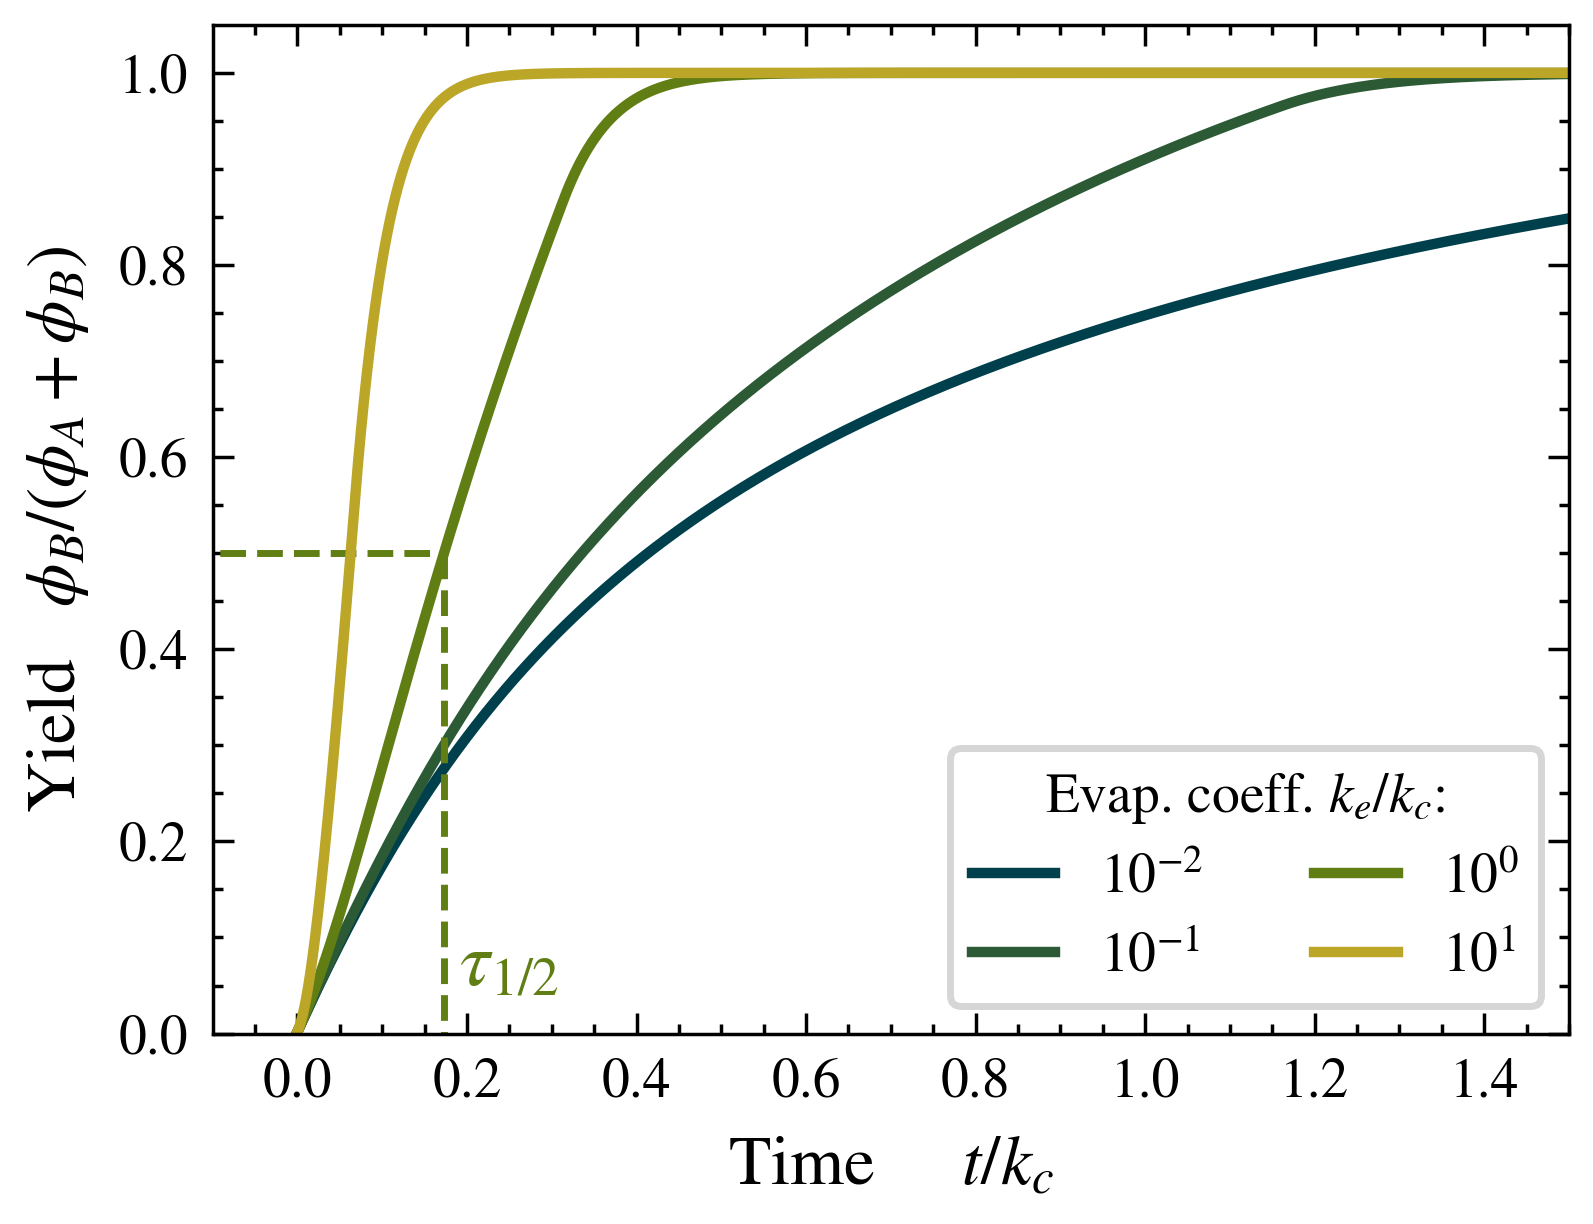
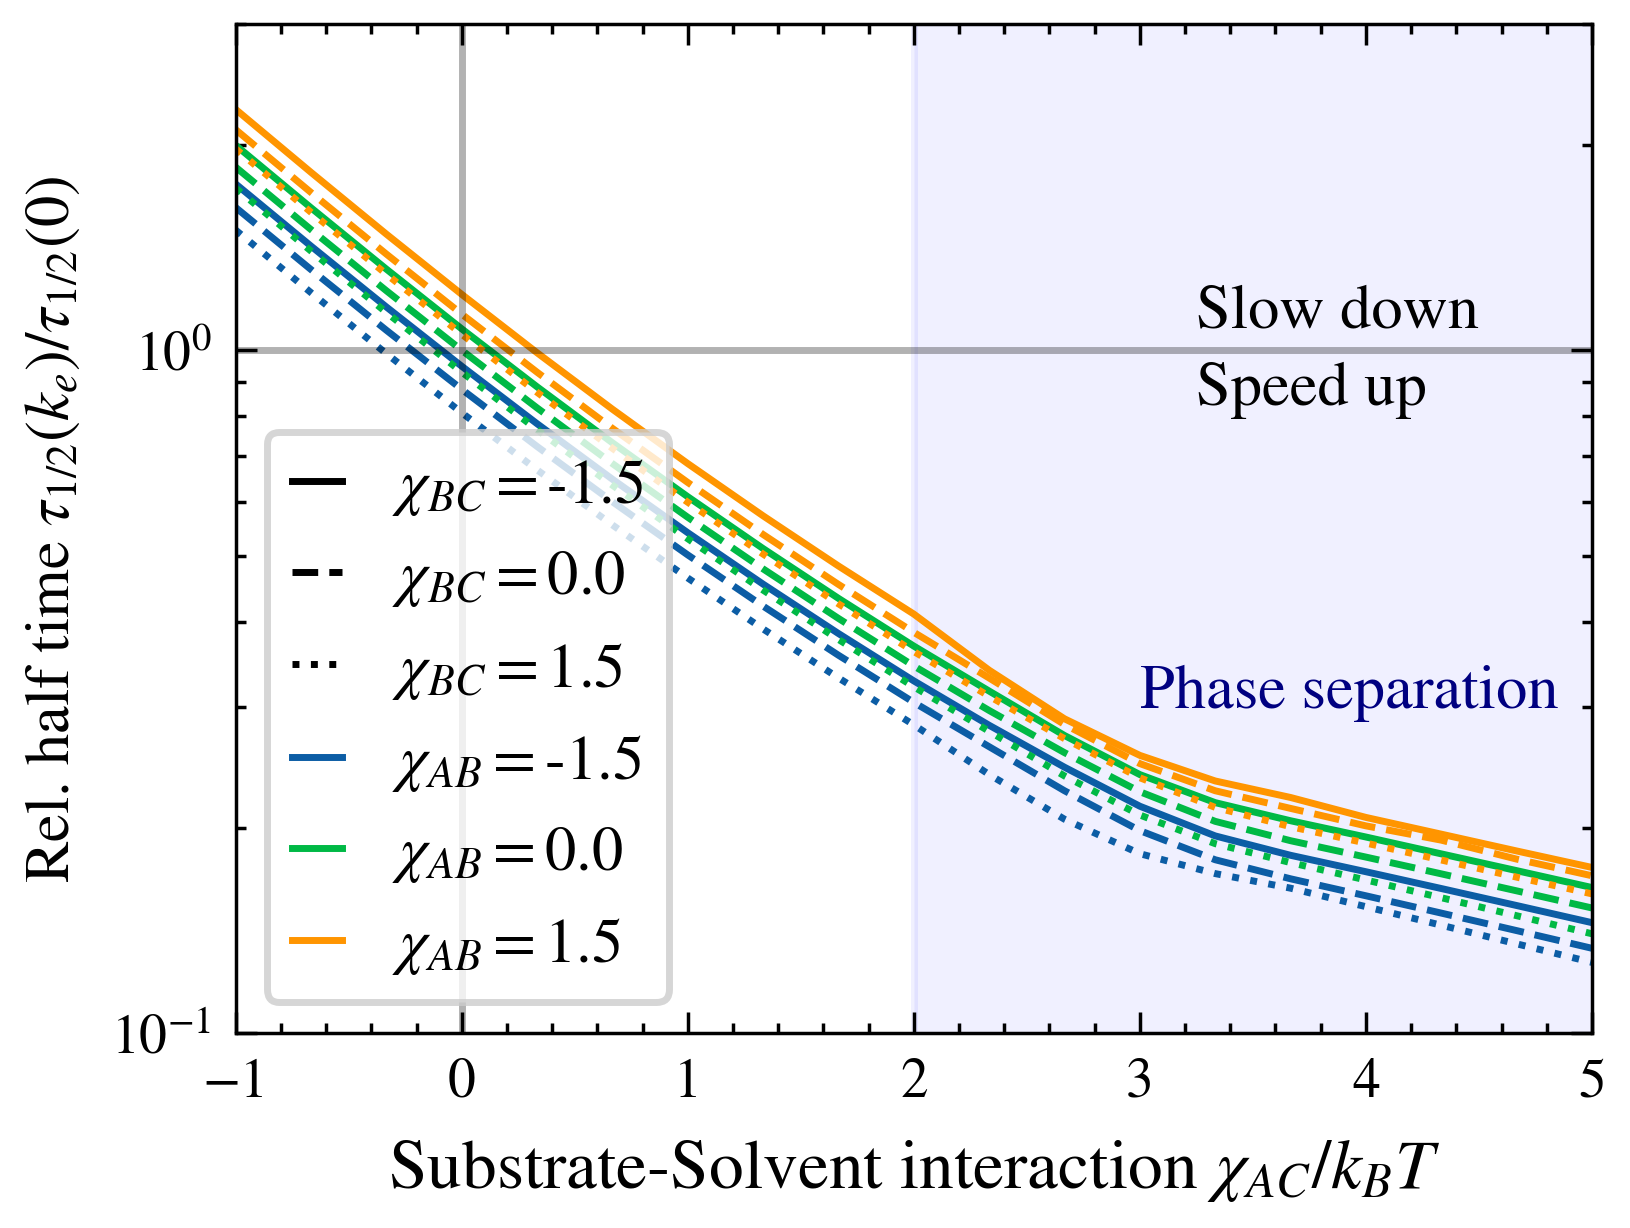
Evaporation and condensation can speed up chemical reactions by driving the system along different phase diagram trajectories. For unidirectional chemical reactions, where , these trajectories are characterized by solvent-poor or solvent-rich conditions during the relaxation to thermodynamic equilibrium (Fig. 4(a,d)). These different solvent conditions have a dramatic impact on the time it takes to turn over of to , seen as the half-time of the yield in Fig. 4(b,e). For the depicted molecular interactions, i.e., favors the solvent while does not, a quick removal of the solvent (large ) causes an increase in the chemical potential of . This increase in the substrate’s chemical potential, visualized in Fig. 1, speeds up the turnover from to .
The threshold between slow-down and speed-up of chemical reactions corresponds to no interactions between the components , as seen in Fig. 4 and 4. Thus, solely up-concentrating the components does not affect the speed-up, whose origin is a pure consequence of non-dilute conditions and the interactions among reacting components. The leading term to quantify the effect is the substrate-solvent interaction, which enters exponentially as in the reaction rate in Eq. (19). The sign of determines whether evaporation or condensation aids the chemical turnover, while the magnitude determines the speed-up. In other words, reactions of solvophilic substrates are sped up through evaporation, and solvophobic substrates under condensation. Though other interactions also affect the speed-up, they are less relevant than the substrate-solvent interaction , as seen in figure 4c and 4f. All statements about interaction strengths are qualitatively reversed once we switch from evaporation (Figs. 4(a-c)) to condensation (Figs. 4(d-f)).
Chemical reactions subject to wet-dry cycles
Now we discuss the effects on chemical reactions when the system is subject to cycles of the reservoir chemical potential
| (14) |
Here, denotes the cycling frequency, the average reservoir value and the oscillation amplitude. We now discuss two cases of cycles: (i) the chemical path toward the orbit, and (ii) the continuous movement among this chemical orbit. For case (i), we are interested in the chemical turnover for a unidirectional chemical reaction, as before, and how it is affected by cycles. After the initial phase, the trajectory becomes periodic. In case (ii), we are interested in the chemical turnover rate during such an orbit.
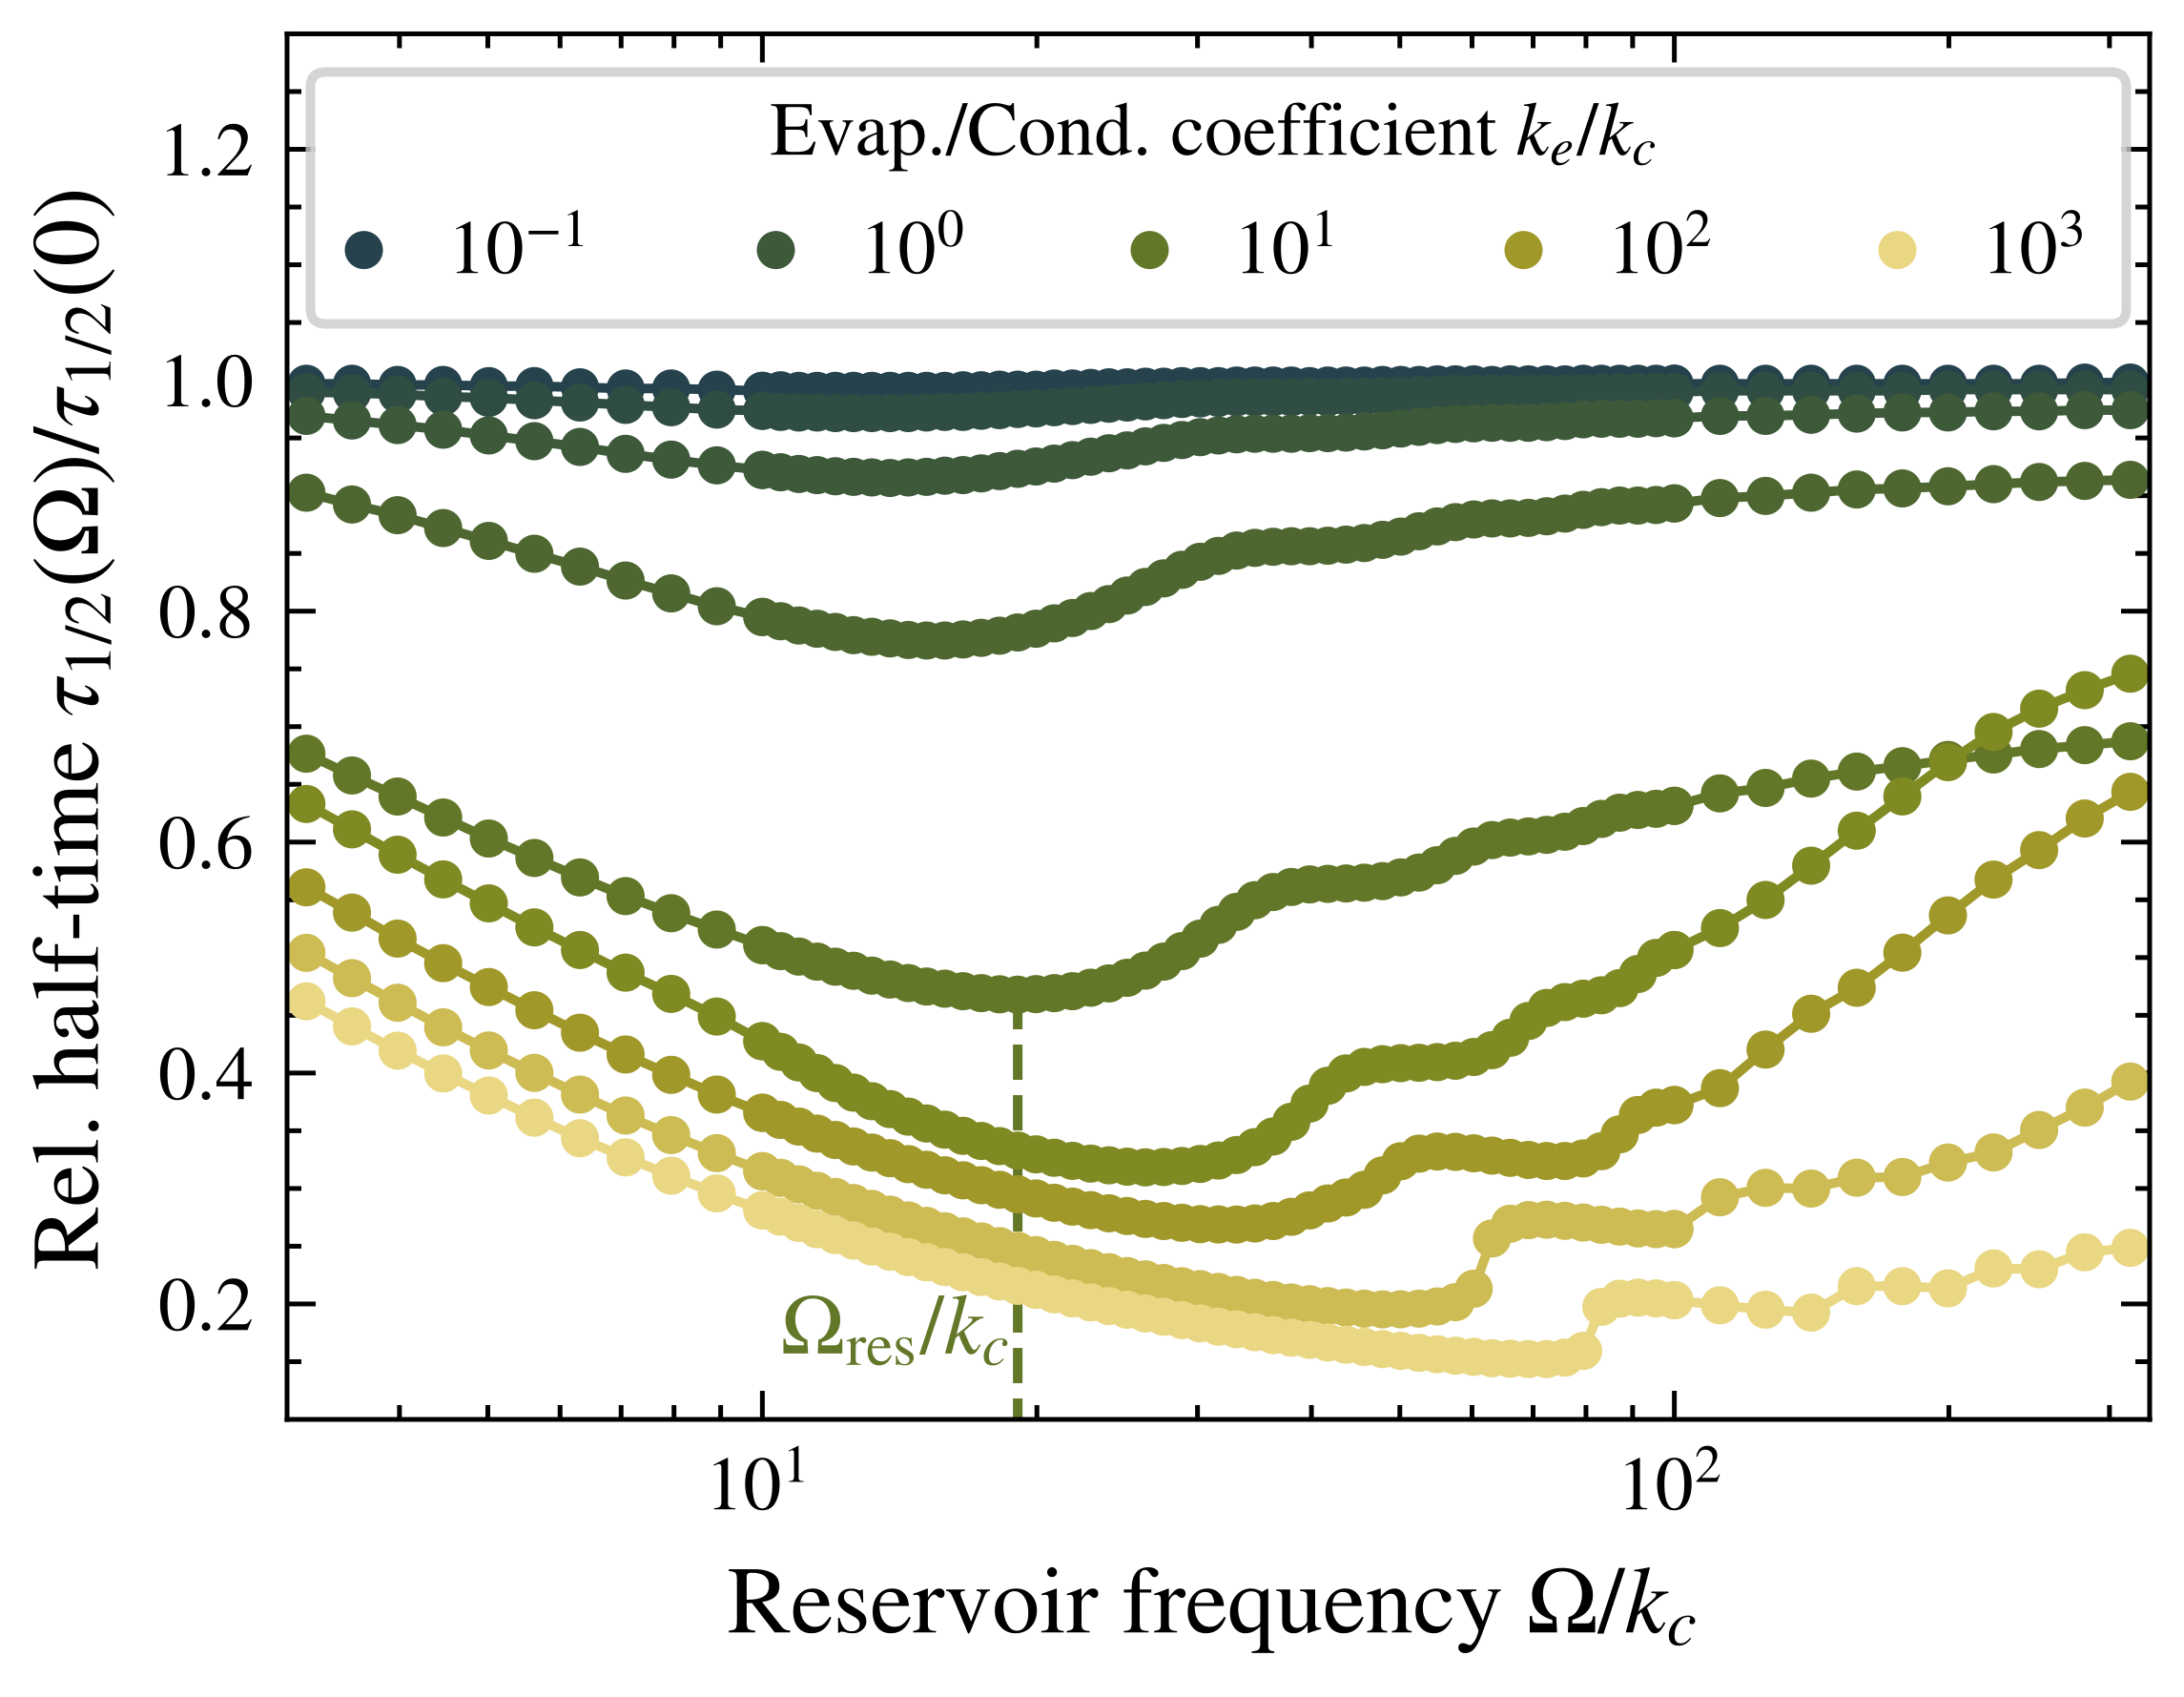
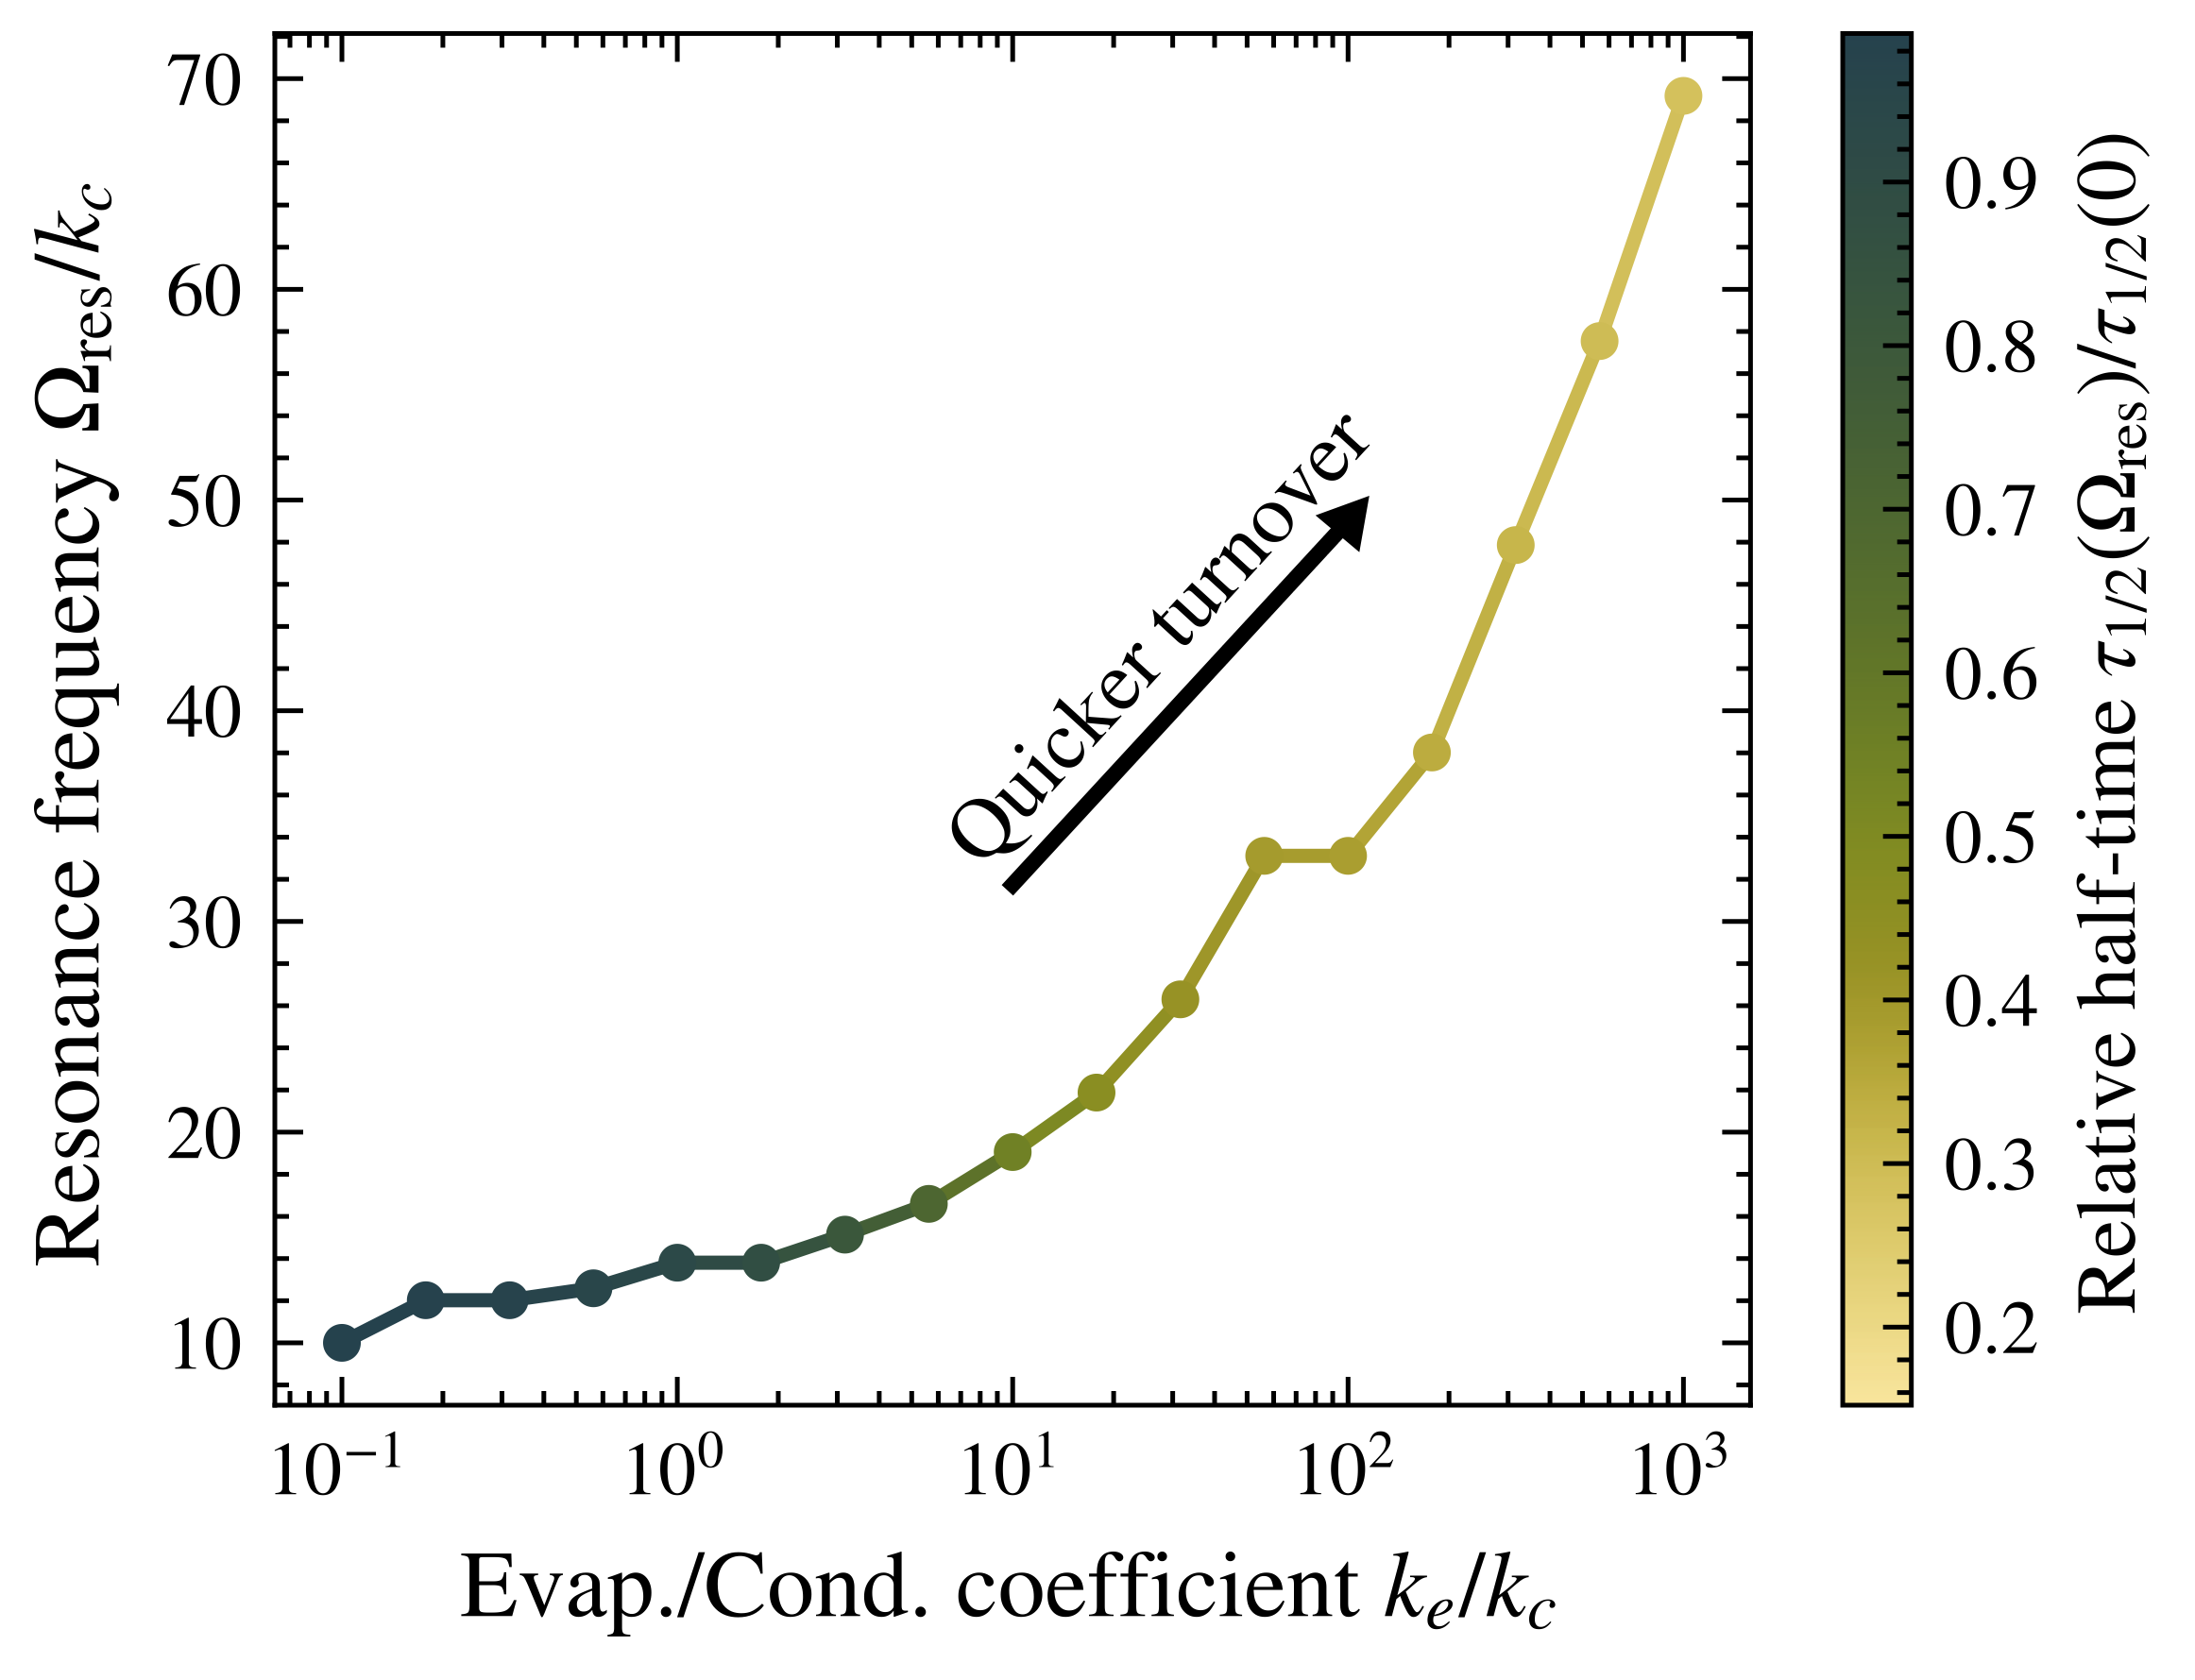
(i) We find that wet-dry cycles can speed up chemical turnover relative to no cycling, with a resonance peak at a specific cycling frequency. Different cycling frequencies result in the different pathways displayed in Fig. 5, with different conversion half-times. Oscillating reservoirs decrease the conversion half-time relative to no oscillations, , by up to a factor of for the parameters used in Fig. 5. The resonance cycling frequency is stable, changing less than a decade when varying over four decades, displayed in Fig. 5. Slow chemical reactions have the largest speed-up due to wet-dry cycles.
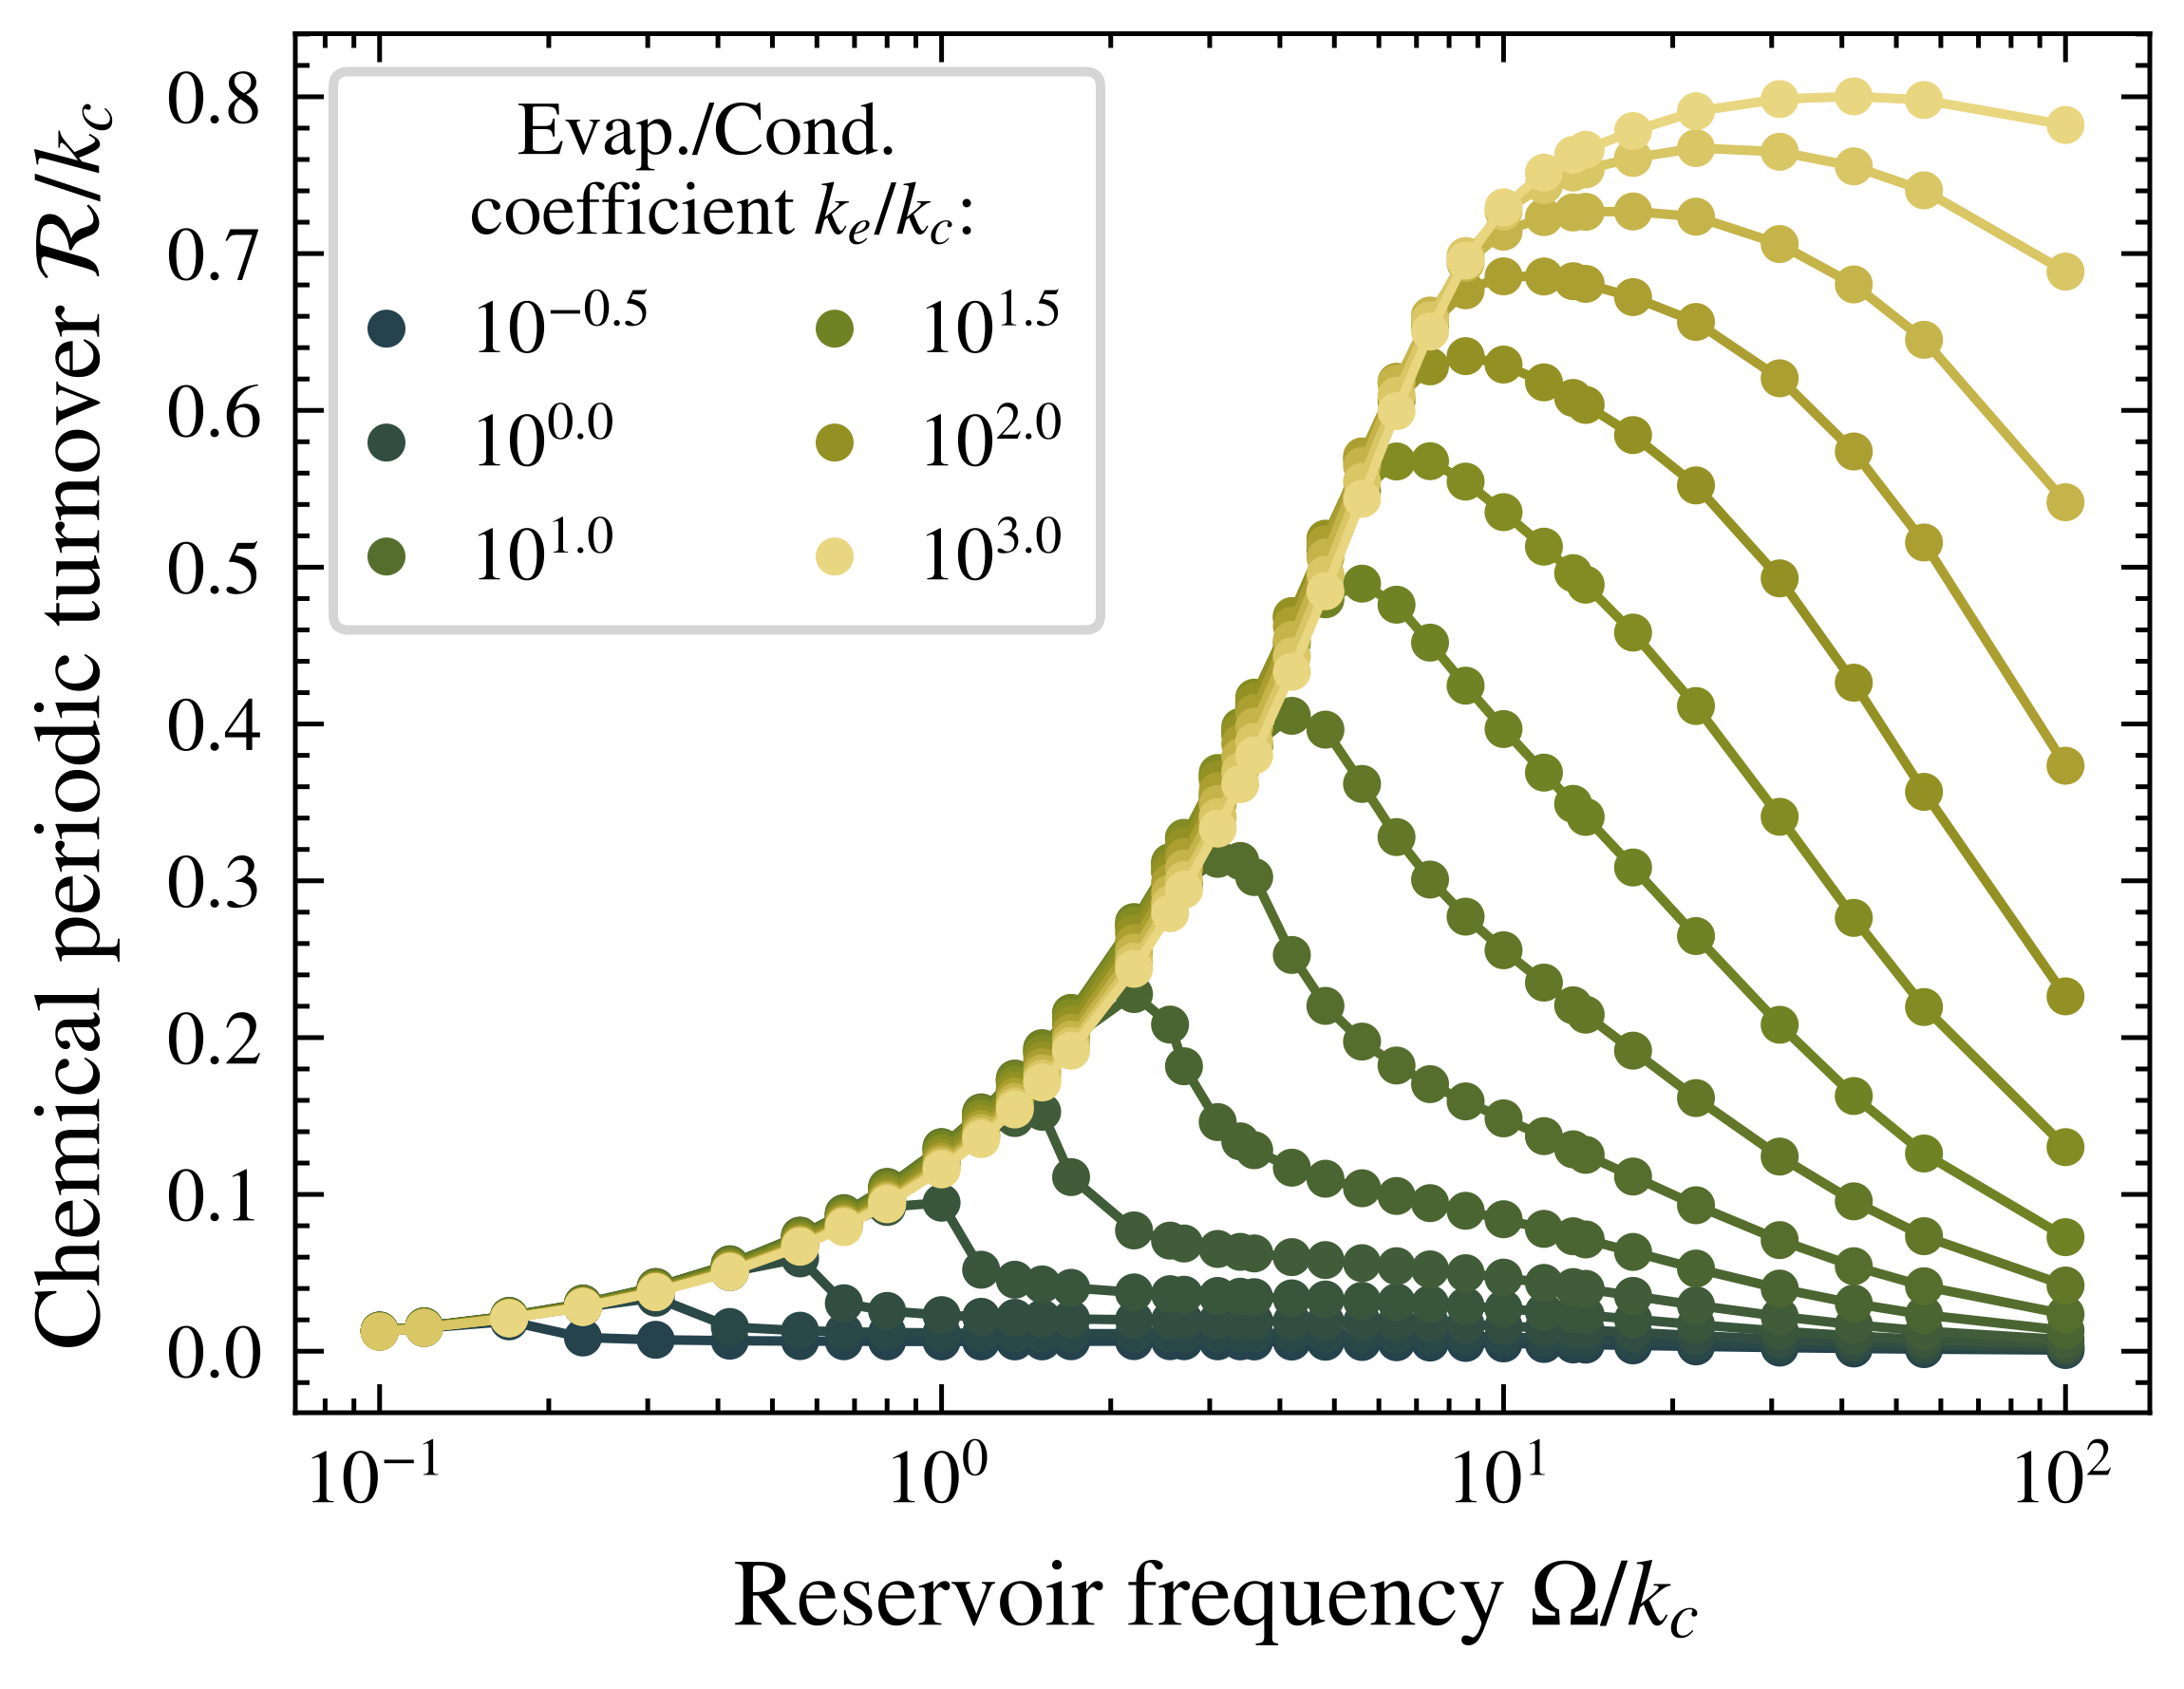
(ii) With repeated cycling, the system will eventually enter an oribt, where the path in the phase diagram is a closed loop (Fig. 5). To quantify the chemical activity per period, we define the relative chemical turnover per cycle,
| (15) |
This quantity is at its minimal if no chemical reactions take place during the cycle, and maximal if all molecules undergo both the forward and backward reaction per cycle.
Different cycling frequencies produce different orbits in the phase diagram, as shown in Fig. 5. Small allows the system to remain close to chemical equilibrium, while large values do not allow the system to respond to the change in the reservoir. In between, there exists a frequency where the system has time to react to the reservoir and be driven away from the chemical equilibrium line, maximizing . For larger values of , the ability of the system to respond to the reservoir increases, making larger as well. With increasing , the system is able to follow the reservoir equilibrium, saturating . Without interactions , the chemical equilibrium is set by . As the equilibrium condition is identical to the evaporation/condensation constraint, reservoir oscillations cannot drive the system away from chemical equilibrium. Thus, again, changes in the solvent composition can only affect chemical reactions when non-dilute interactions and interactions among reacting components are considered.
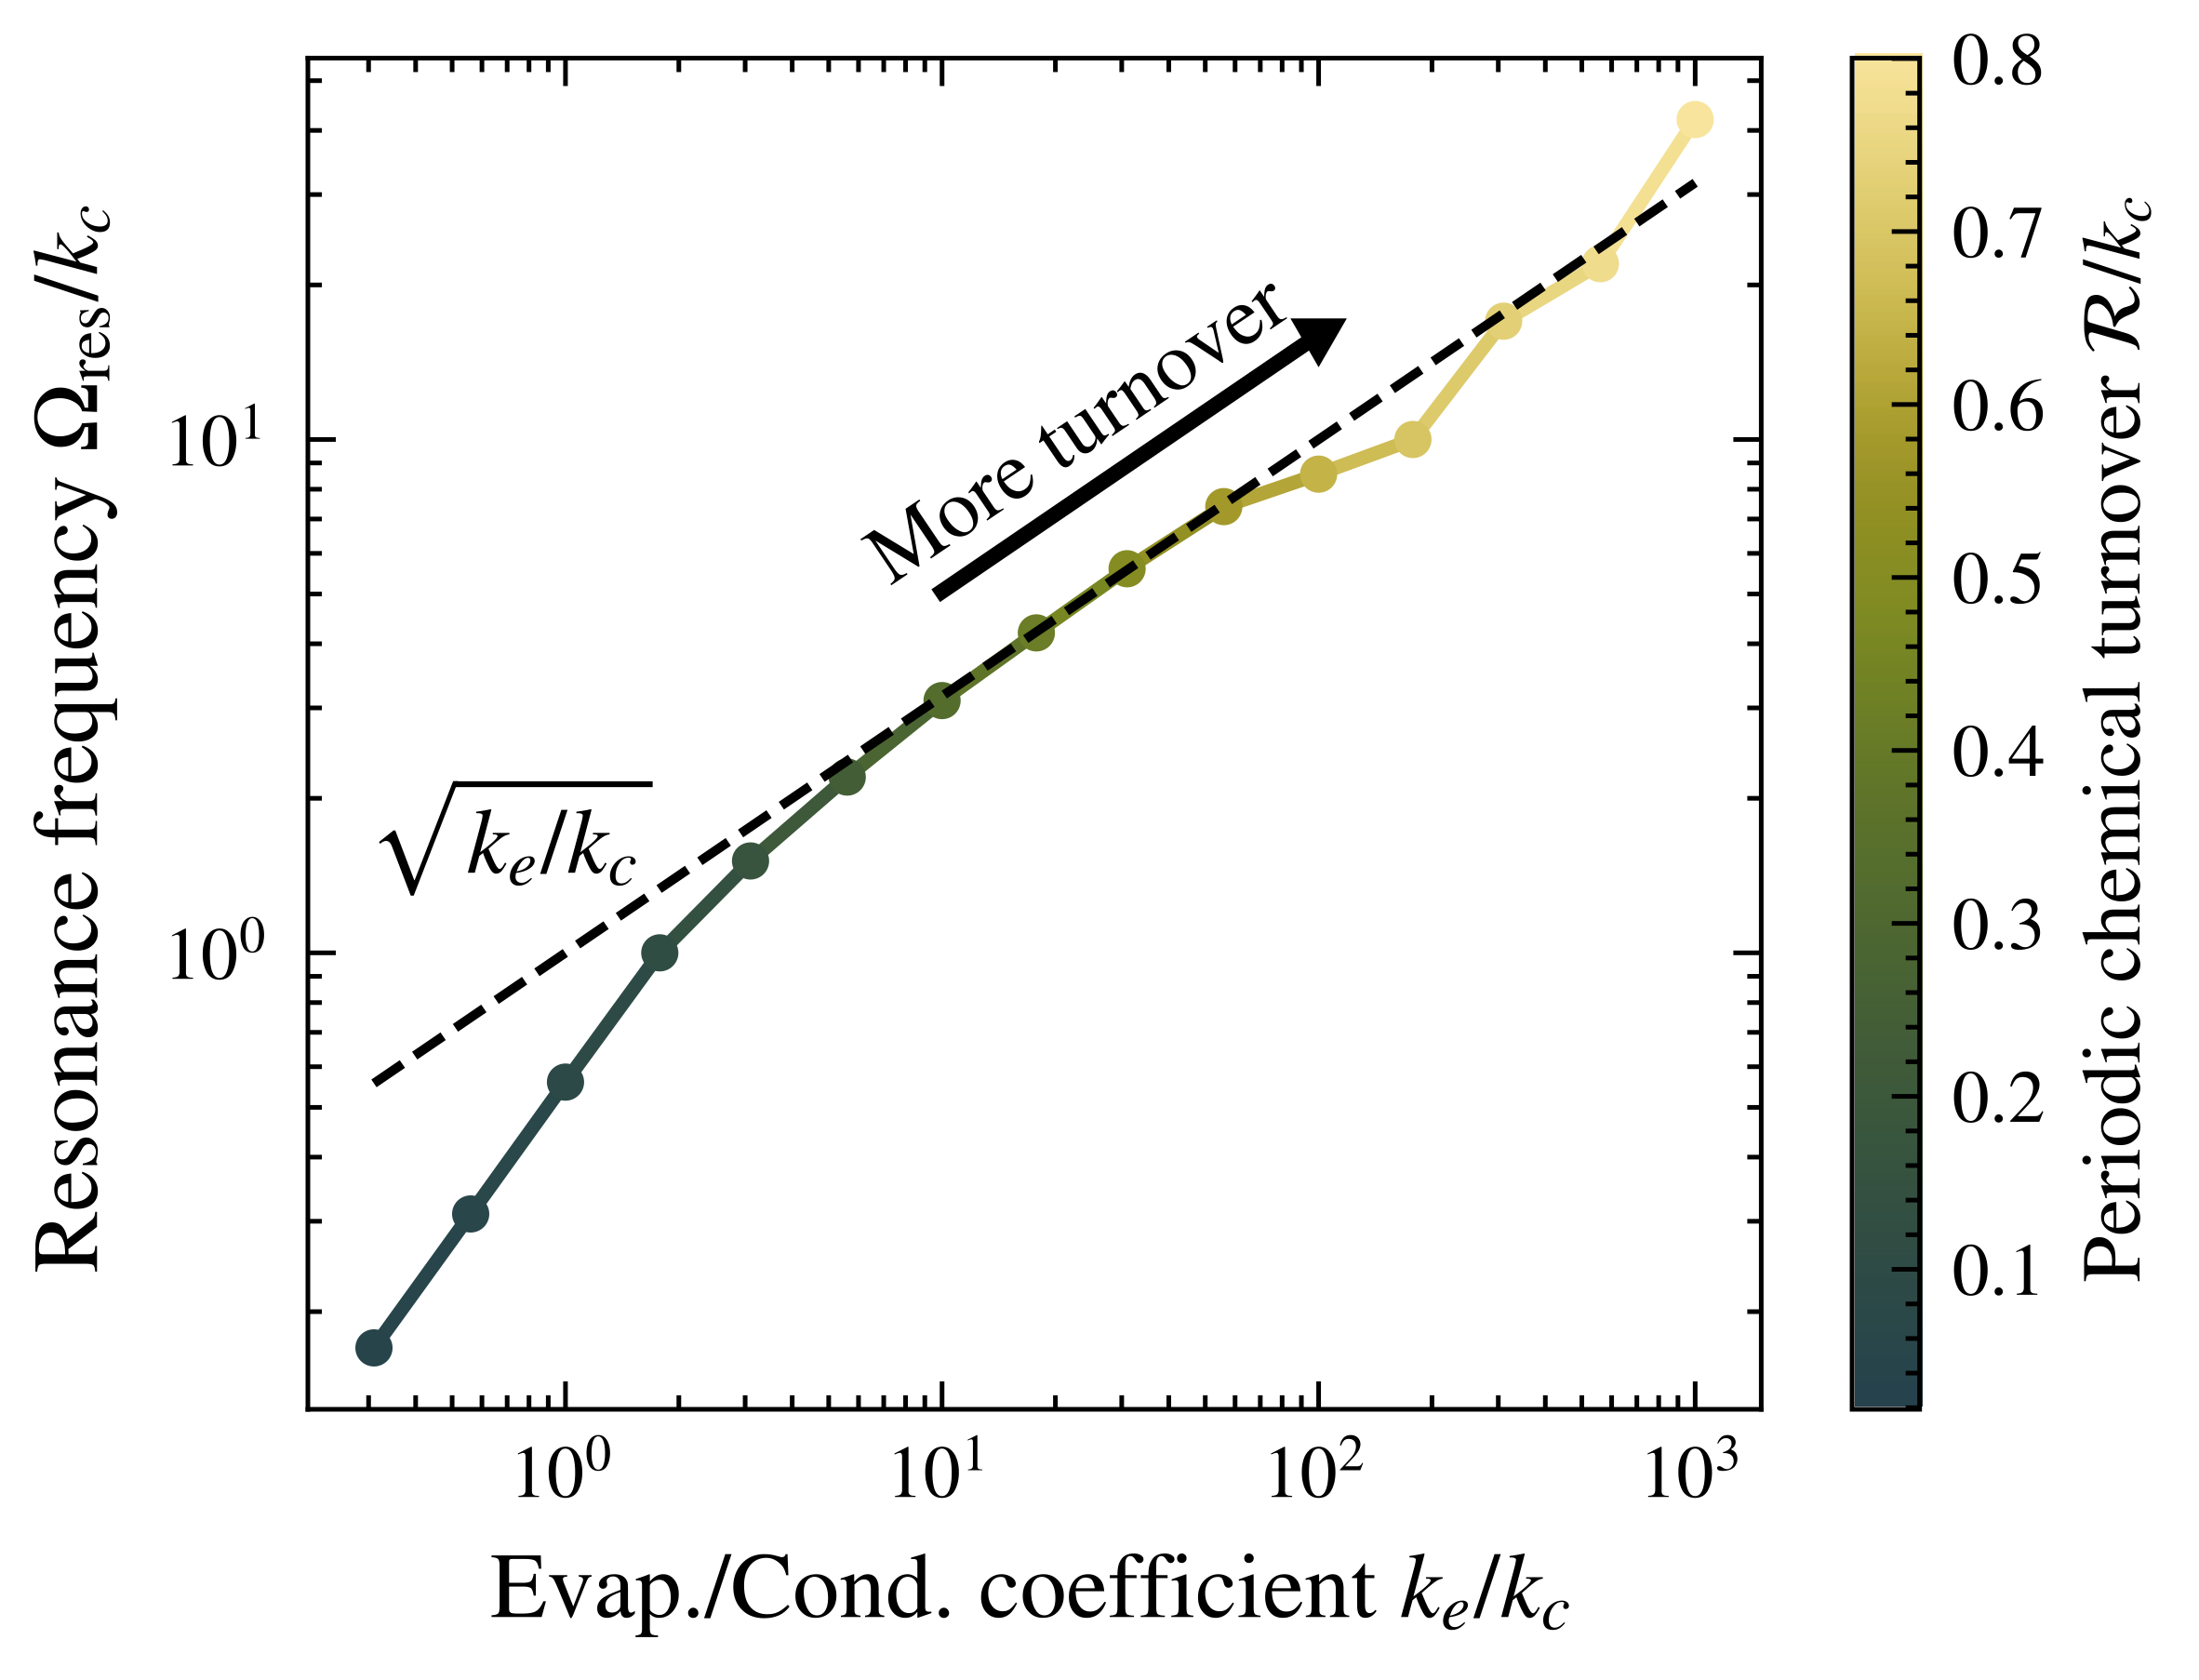
The resonance behavior provides a selection mechanism for specific chemical reactions. This selection is achieved by the speed-up of specific chemical reactions, while other reactions do not benefit from the wet-dry cycles. The selection conditions depend on the value of the evaporation flux coefficient , which, however, does not change much for water for typical temperature and pressure oscillation on Earth Hisatake et al. (1993); Heinen and Vrabec (2019); Xiong and Yuen (1991). A specific resonance frequency, and thus the selection of specific chemical reactions, can however be realized by varying the system’s geometry, i.e., surface-to-volume ratio of the system (Fig. 6). Increasing the surface area to volume ratio from a puddle to a thin film increases the resonance frequency, selecting for faster chemical processes.

Conclusion
In this work, we develop a thermodynamic description for evaporation and condensation of non-dilute reacting mixtures and study the effect on chemical reactions. We find that kinetics of evaporation and condensation can significantly speed up chemical reactions. This speed-up stems from evaporation and condensation driving the system away from equilibrium. For wet-dry cycles, the turnover from substrate to product can be sped up even further. We found that the cycling frequency strongly affects the rate of chemical reactions per cycle. A key finding of our work is the existence of a resonance cycling frequency where turnover is maximal. This resonance behavior can act as a selection mechanism to only speed up specific reactions.
The mechanism for how evaporation and condensation for constant and cycling reservoirs affect chemical reactions relies on effectively lowering the free energy barrier for a reaction to occur (Fig. 7(a), and Eq. (28), (29)). By reducing the amount of solvent through evaporation, a solvophilic component will interact less with the solvent and more with the other components, making it less energetically favorable to be solvophilic. Likewise, solvophobic substrates interacting more with the solvent makes it less energetically favorable to be solvophobic. In both cases, the substrate chemical potential increases, thereby reducing the free energy barrier . For realistic thermodynamic and kinetic parameters of chemical compounds in aqueous solutions Clary (1990); Kok and Rudin (1982); Russell et al. (2015); Zwicker et al. (2017); Hisatake et al. (1993); Xiong and Yuen (1991), speed-ups of chemical reactions by more than a factor 10 are possible through wet-dry cycles. Importantly, if assuming dilute chemistry , no speed-up or resonance would appear; the effect of wet-dry cycles results from dense chemistry interactions. This pronounced effect on chemical reactions suggests a strong contender as a naturally occurring process analogous to enzymes. However, while enzymes speed up reactions by lowering the kinetic contributions of the energetic barrier between the substrate and the product, evaporation/condensation can increase the chemical potential of the substrate and lower the chemical potential of the product. As a result, the speed of reactions can get enhanced (Fig. 1).
Most chemical reactions in biology or chemical engineering involve enzymes or catalysts to enhance the speed of reactions Singh and Tandon (2014); Werner et al. (2010); Blaser and Studer (1999); Alberty (2003); Srere (1987); Underkofler et al. (1958). Subjecting such catalyzed reactions to wet-dry cycles could speed up the reactions even further. In particular, active sites of enzymes are typically solvent-depleted Zaks and Klibanov (1988); Brogan et al. (2014); Helms and Wade (1998); Klibanov (1997) implying that enzymatic activity is enhanced in the dry state of the cycle. Pronounced enhancement is expected when changing the time-dependent reservoir chemical potential from symmetric wet-dry cycles (Eq. (14)) to strongly asymmetric cycles with long dry and short wet periods.
In our work, the change in chemical reactions stems from the non-dilute conditions and the interactions among reacting components. Interestingly, phase separation did not qualitatively alter the speed-up or resonance phenomena observed. This might arise from our choice of equal kinetic coefficients in each phase. By including phase-dependent reaction coefficients or explicitly accounting for reactions on the interface between the two phases, we expect that phase separation can alter the resonance behavior.
In our work, we have focused on how chemical reactions are affected by wet-dry cycles in ternary mixtures. However, the theoretical framework provided can be applied to an arbitrary number of components with higher-order chemical reactions or reaction networks, as outlined in the theory section. For such complex reaction schemes, we expect that the speed up of chemical reactions gets even more pronounced as the reaction rates become proportional to a product of all the substrate volume fractions (Eq. (8)). This allows wet-dry cycles to affect chemical reaction rates even when assuming dilute chemistry Higgs (2016). Moreover, the resonance behavior should persist as it arises from a generic coupling between reservoir driving and reaction rates. Exploiting this resonance behavior in reacting mixtures with many components poses challenges at the interface between theory and experiments, which include the proper characterization of interaction parameters and kinetic rates.
Our findings suggest that wet-dry cycles could have played a vital role in speeding up prebiotic chemistry on the early Earth, where biological enzymes were absent. During early Earth settings, systems were likely exposed to repeated wet-dry cycles. The reservoir oscillations can originate from weather changes such as temperature, humidity, or pressure (Mulkidjanian et al., 2012; Damer and Deamer, 2015), or other phenomena such as salt deliquescence (Campbell et al., 2019), or freeze-thaw cycles (Vlassov et al., 2004; Le Vay et al., 2021; Mutschler et al., 2015). Alternatively, oscillations in the solvent can be found in foams Tekin et al. (2022), or porous rock containing trapped gas-bubbles Ianeselli et al. (2022); Matreux et al. (2021).
An important implication of our work is that the resonance behavior in the frequency of wet-dry cycles provides a selection mechanism for chemical reactions. Since the system’s geometry determines the resonance frequency, different chemical reactions are selected in a puddle versus a mesoscopic aqueous droplet. This suggests that pores of different sizes subject to wet-dry cycles can provide a setting for chemical selection and evolution at the molecular origin of life.
Acknowledgement
We thank Evan Spruijt and Iris Smokers for discussions on the experimentally observed effects of wet-dry cycles on chemical reactions and acknowledge their feedback on the manuscript. We also thank Sudarshana Laha for stimulating discussions and Hidde Vuijk, Samuel Gomez, and Gaetano Granatelli for feedback on the manuscript. Figure 1 b,c was created using BioRender bio (2023). C. Weber acknowledges the European Research Council (ERC) under the European Union’s Horizon 2020 research and innovation program (Fuelled Life, Grant Number 949021) for financial support.
Appendix A Validity of phase equilibrium and parameter choices
Our work is valid for systems for which phase equilibrium approximately holds at each time during the kinetics. Note that at phase equilibrium, the volume fractions in each phase are spatially homogeneous. For phase equilibrium to hold in the presence of other kinetic processes such as evaporation/condensation with a rate coefficients and chemical reactions with a rate coefficient , such processes have to be slow compared to diffusion:
| (16) |
where is the characteristic system length, and is the smallest diffusion coefficient out of all the components. Assuming phase equilibrium at each time of the kinetics also implies that the nucleation of coexisting phases is not a rate limiting step and the effects of having a single droplet or an emulsion of the same total condensed volume are negligible. And indeed, nucleation for many phase separating polymeric systems shows for fast (often seconds or less) formation of mesoscopically sized condensed phases Bergmann et al. (2022) and the effect of droplet number on composition is typically only relevant for droplets around the critical nucleation radius Weber et al. (2019).
To see whether the condition in Eq. (16) can be fulfilled for chemical systems we consider typical physico-chemical values for diffusion coefficients and chemical reaction rates. In water, small reacting molecules often have a diffusion coefficient around . When considering chemical reaction occurring with rates around , the condition for phase equilibrium (16) is satisfied for system sizes of mm or smaller. For larger system sizes, gradients in the system should be taken into account by using a sharp interface model to calculate diffusive fluxes driven spatial inhomogeneities (Bauermann et al., 2022b).
We have considered parameters consistent with the validity of the phase equilibrium condition (16) during the wet-dry cycles and the reaction kinetics. The parameters used are listed in Table 1. In Fig. 3, we span different interaction parameters to understand what class of interactions results in a kinetic speed-up. Our finding that turnover of solvophilic substrates is enhanced during drying agrees with the interactions of substrates used in phosphorylation reactions Maguire et al. (2021); Morasch et al. (2019), where speed-up through wet-dry cycles also have been observed. The parameters in interactions used for Fig. 2, 3, 4 are motivated by systems with similar phase behaviour Fares et al. (2020); Fritsch et al. (2021); Maguire et al. (2021); Bergmann et al. (2023). Moreover, also purified proteins show similar interactions Alberti et al. (2018); Arnold and Linke (2007).
We note that evaporating a major fraction of the solvent can strongly decrease the diffusion coefficient , potentially violating the condition (16) as reacting compounds can become more crowded. However, removing the solvent also decreases the system’s size , potentially maintaining the validity of the condition above throughout the evaporation process.
| Fig. | ||||||
|---|---|---|---|---|---|---|
| 2 | 3.0 | 0.6 | -0.6 | -0.2 | 0.1 | (-0.2, -0.5, -0.9) |
| 2 i | 3.0 | 0.6 | -0.6 | -0.2 | 0.1 | -0.2 |
| 2 ii | 2.84 | 2.04 | -0.6 | -0.2 | 0.1 | -0.15 |
| 2 iii | 1.72 | 1.72 | -2.19 | -0.1 | 0.4 | -0.2 |
| 2 iv | -0.60 | 0.60 | 3.0 | -0.2 | 0.1 | -1.40 |
| 3 a,b | 3.0 | 0.6 | -0.6 | -0.2 | 0.1 | -0.5 |
| 4 a,b | 3 | -3 | 2 | -10 | 0.0 | -10 |
| 4c | – | – | – | 0.0 | -6.0 | |
| 4 d,e | 2 | 3.5 | -2 | -10 | 0.0 | |
| 4f | – | – | – | -6.0 | 0.0 | |
| 5 a,b,c | 3 | -0.6 | 0.6 | 0 | -6.0 | |
| 5 d,e,f | 3 | -0.6 | 0.6 | 0.4 | 1.8 |
Appendix B Unidirectional chemical reactions and analytic scaling relation
Unidirectional chemical reactions are achieved by choosing a large difference in the internal energies between the product and substrate
| (17) |
In turn, the chemical reaction becomes dominated by the direction from substrate to product, where the backward pathway is exponentially damped by the factor . The chemical reaction in equation (10) can, under these conditions, be approximately written as
| (18) |
when is acting as the substrate and as the product. We have defined , and represents the non-entropic contribution to the chemical potential of component , defined as
| (19) |
To speed up the chemical reaction, this quantity should be maximized. During evaporation, we reduce , increasing and . A negative value of increases the substrate’s internal energy. While for condensation, is increased relative to , such that the chemical potential is increased for positive values of . Though the interaction between might appear as important as , the volume fraction of the product will generally vary less during evaporation/condensation. However, it will become important towards the later part of the turnover process. Importantly, , defined in Eq. (4), also depends on the volume fractions and will vary during evaporation/condensation. The changes in through evaporation/condensation will still contribute less to the overall speed-up as its interaction terms contribute only as second order in the ’s.
The reaction coefficients can generally depend on the volume fractions and differ in each phase. However, for simplicity, we treat it as constant and equal in the two phases.
Appendix C Phase equilibrium constraint during reaction and wet-dry cycle kinetics
In our work, we consider the kinetics of chemical reactions and wet-dry cycles, where we focus on spatially homogeneous chemical potential. Either the system is spatially homogeneous in terms of composition, or phase-separated with phase equilibrium between phase I and II. Below we review how the constraint of phase equilibrium is accounted for in the numerical solutions; more details can be found in Ref. Bauermann et al. (2022a).
To evolve the phase equilibrium constraint, , and thereby calculate the volume fractions in the two phases (Eq. (12)), we use
| (20) |
Using the product rule, this can be rewritten to
| (21) |
Inserting the time-derivative of from Eq. (12), Eq. (20) becomes
| (22) | ||||
where , , and are the reaction, diffusive and evaporation/condensation fluxes. The conservation of particle number through the interphase implies
| (23) |
and can be plugged into Eq. (22). Thus, our unknown can be calculated by solving the coupled algebraic equation in Eq. (22).
Appendix D Role of transition states

In this section, we discuss the role of transition states in the kinetics of chemical reactions when subject to wet-dry cycles. To this end, we introduce the transition state , which is associated with energetic barriers, typically referred to as activation energies, relative to the states and , and , respectively (Fig. 7(a)). For the sake of illustration, we restrict ourselves to homogeneous mixtures but allow the system to be non-dilute. Due to the change in composition during wet-dry cycles, the activation energies, in general, vary during the chemical kinetics. Here, we show that the effects of transition state on the kinetics are negligible if the activation energies heights are in the order of a few or larger. Such large energetic barriers will lead to a dilution of the transition state corresponding to low volume fractions .
The chemical reaction rates for a chemical system with the substrate , transition state (Fig. 7), and a product are given as:
| (24) | ||||
| (25) |
In a homogeneous system, they govern the rate of change of the volume fraction of the three components:
| (26) | ||||
Solving these equations, we find that for large enough barriers, and , the transition state quickly relaxes to quasi-static conditions (). To understand this analytically, we consider an initial state , , and , and consider that is at excess at early times. Thus, one can write the time-derivative of (24-26) as
| (27) |
To achieve these expressions, we have rewritten the chemical potentials, , where
| (28) | ||||
| (29) |
Here, are the activity coefficients, including the effects of interactions, and are the reference chemical potentials. The chemical potential describes the energy landscape that a molecule experiences while reacting between and . It allows us to define activation energies for non-dilute systems, and . (Fig. 7(a)). Note that such activation energies, in general, depend on composition and are only constant for dilute mixtures.
The solution to Eq. (27) at early times reads:
| (30) |
with the characteristic relaxation time
| (31) |
and the early-time plateau value of the transition state
| (32) |
where is the activation energy between and as depicted in Fig. 7.
From the expression, we observe that the occupation of the transition state decreases exponentially with a characteristic time-scale . This time scale has an exponential dependence on the activation energy . Thus, for larger barriers, the relaxation of the transition state occurs on a time scale much faster and . After this relaxation, the kinetics of the transition state is quasi-statically slaved to the slow changes of and . Thus, the transition state satisfies . On such time scales, i.e, , and change concomitantly in time leading to the population of the state.
We note that large activation energies and also imply that the transition state gets diluted, which is reflected in the exponential dependence of on the barrier height (Eq. (32)). In other words, transition states with large energetic barriers lead to a separation of time scales and a dilution of the transition evolving accordingly to a quasi-static kinetics Van Kampen (1985); Janssen (1989). This statement is confirmed by the excellent agreement between the approximate analytic expression (30) and the full numerical solution of equation (26) (Fig. 8). At later time scales when is converted to , the plateau value of is slowly changing and thus deviates from the analytic value Eq. (32). However, solving Eq. (26) using a quasi-static approximation () agree extremely well with the full numerical solution of Eq. (26) at later times.

We conclude that for large barriers and large times , the quasi-static condition is well satisfied. Using Equations (24-26), we find that the chemical potential of the transition state corresponds to a weighted average of the chemical potentials of and :
| (33) |
This equation can be solved for at any time point of the later-time kinetics.
By substituting Eq. (33) into Eq. (24), we find
| (34) |
and . Comparing to Eq. (10) and Eq. (8), we see that the expression is equivalent to a system with a single mono-molecular chemical reaction , , and . Thus, we introduce an effective modified chemical reaction rate coefficient
| (35) |
We conclude that for large barrier heights, the kinetics of and separated by a transition state can be mapped on a reduced chemical system without a transition state with an effective reaction rate (Eq (35)).

This reduction is also valid when the system is subject to evaporation if the time scales of evaporation/condensation , reaction and are slow compared to the time scale of the transition state relaxation (31):
| (36) |
This statement is supported by Fig. 9, where the integrated relative difference between the substrate volume fraction for the kinetics with and without the transition state decreases exponentially with the barrier height.
The elimination of the kinetic equation for the transition state does not imply that the effective rate (Eq. (35)) was independent of the transition state. Using Kramer’s transition state theory Gardiner (1985), the kinetic rate coefficient and exponentially depends on the respective activation energies:
| (37) | ||||
| (38) |
The above relationships not only encodes the effects of transition state for large activation energies, it also implies that such effects in general depend on the composition of all components due to the interaction among each other. Yet, as long as the reference chemical potentials dominate the activation energies, i.e., they exceed the contribution related to the activity coefficients,
| (39) |
the kinetic rates and (Eq. (37)) are approximately composition-independent. In this case, the effective reaction coefficient (Eq. (35)) is approximately composition-independent, too.
Appendix E Gibbs’ phase rule
For a system of non-solvent components, external thermodynamic parameters, and number of phases, the number of degrees of freedom can be calculated from
| (40) |
The number of degrees of freedom gives the number of independent intensive variables uniquely defining the thermodynamic equilibrium. The number of components is calculated as the number of components needed to specify the composition of all phases (incompressibility reduces by one) minus the number of constraints between the concentrations (reduced by the number of chemical reactions). Furthermore, the evaporation/condensation equilibrium can be regarded as an external intensive variable defining the system. Such that the set or alternatively , gives
| (41) |
Therefore, two-phase coexistence in a system is defined as a volume in -space and a plane in -space, while the homogeneous system has an additional degree of freedom. For a fixed reservoir and a single chemical reaction, the degree of freedom becomes , such that two-phase coexistence is only achievable for a single point in the phase diagram. This is consistent with the phase diagram in Fig. 3.
References
- Masel (2001) R. I. Masel, Chemical Kinetics and Catalysis (Wiley, 2001).
- Singh and Tandon (2014) S. Singh and P. Tandon, Journal of Energy and Chemical Engineering(JECE) 2, 106 (2014).
- Werner et al. (2010) S. Werner, M. Haumann, and P. Wasserscheid, Annual Review of Chemical and Biomolecular Engineering 1, 203 (2010).
- Blaser and Studer (1999) H.-U. Blaser and M. Studer, Applied Catalysis A: General 189, 191 (1999).
- Alberty (2003) R. A. Alberty, Thermodynamics of Biochemical Reactions (Wiley-Interscience, Hoboken, N.J, 2003).
- Srere (1987) P. A. Srere, Annual Review of Biochemistry 56, 89 (1987).
- Underkofler et al. (1958) L. A. Underkofler, R. R. Barton, and S. S. Rennert, Appl Microbiol 6, 212 (1958).
- Eigen and Hammes (1963) M. Eigen and G. G. Hammes, in Advances in Enzymology and Related Areas of Molecular Biology (John Wiley & Sons, Ltd, 1963) pp. 1–38.
- Eigen (1968) M. Eigen, Quarterly Reviews of Biophysics 1, 3 (1968), publisher: Cambridge University Press.
- Kauffman (2011) S. A. Kauffman, Life 1, 34 (2011), number: 1 Publisher: Molecular Diversity Preservation International.
- Oparin (1965) A. I. Oparin, Advances in enzymology and related areas of molecular biology 27, 347 (1965).
- Orgel (1994) L. E. Orgel, Scientific American 271, 76 (1994), publisher: Scientific American, a division of Nature America, Inc.
- Hay et al. (2010) S. Hay, L. O. Johannissen, M. J. Sutcliffe, and N. S. Scrutton, Biophysical Journal 98, 121 (2010).
- Claeyssens et al. (2006) F. Claeyssens, J. N. Harvey, F. R. Manby, R. A. Mata, A. J. Mulholland, K. E. Ranaghan, M. Schütz, S. Thiel, W. Thiel, and H.-J. Werner, Angewandte Chemie International Edition 45, 6856 (2006).
- Mast et al. (2013) C. B. Mast, S. Schink, U. Gerland, and D. Braun, Proceedings of the National Academy of Sciences 110, 8030 (2013), publisher: Proceedings of the National Academy of Sciences.
- Morasch et al. (2019) M. Morasch, J. Liu, C. F. Dirscherl, A. Ianeselli, A. Kühnlein, K. Le Vay, P. Schwintek, S. Islam, M. K. Corpinot, and S. Bettina, et al., Nat Chem 11, 779 (2019).
- Baaske et al. (2007) P. Baaske, F. M. Weinert, S. Duhr, K. H. Lemke, M. J. Russell, and D. Braun, Proceedings of the National Academy of Sciences 104, 9346 (2007), publisher: Proceedings of the National Academy of Sciences.
- Bartolucci et al. (2023a) G. Bartolucci, A. Calaça Serrão, P. Schwintek, A. Kühnlein, Y. Rana, P. Janto, D. Hofer, C. B. Mast, D. Braun, and C. A. Weber, Proceedings of the National Academy of Sciences 120, e2218876120 (2023a).
- Ianeselli et al. (2022) A. Ianeselli, D. Tetiker, J. Stein, A. Kühnlein, C. B. Mast, D. Braun, and T.-Y. Dora Tang, Nature Chemistry 14, 32 (2022), number: 1 Publisher: Nature Publishing Group.
- Matreux et al. (2021) T. Matreux, K. Le Vay, A. Schmid, P. Aikkila, L. Belohlavek, A. Z. Çalışkanoğlu, E. Salibi, A. Kühnlein, C. Springsklee, and B. Scheu, et al., Nature Chemistry 13, 1038 (2021), number: 11 Publisher: Nature Publishing Group.
- Busiello et al. (2021) D. M. Busiello, S. Liang, F. Piazza, and P. De Los Rios, Communications Chemistry 4, 1 (2021), number: 1 Publisher: Nature Publishing Group.
- Nicolis (1986) G. Nicolis, Rep. Prog. Phys. 49, 873 (1986).
- England (2015) J. L. England, Nature Nanotech 10, 919 (2015), number: 11 Publisher: Nature Publishing Group.
- Brogliato et al. (2020) B. Brogliato, R. Lozano, B. Maschke, and O. Egeland, Dissipative Systems Analysis and Control: Theory and Applications, Communications and Control Engineering (Springer International Publishing, Cham, 2020).
- Maguire et al. (2021) O. R. Maguire, I. B. A. Smokers, and W. T. S. Huck, Nature Communications 12, 5517 (2021), number: 1 Publisher: Nature Publishing Group.
- Fares et al. (2020) H. M. Fares, A. E. Marras, J. M. Ting, M. V. Tirrell, and C. D. Keating, Nature Communications 11, 5423 (2020).
- Becker et al. (2018) S. Becker, C. Schneider, H. Okamura, A. Crisp, T. Amatov, M. Dejmek, and T. Carell, Nature Communications 9, 163 (2018).
- Tekin et al. (2022) E. Tekin, A. Salditt, P. Schwintek, S. Wunnava, J. Langlais, J. Saenz, D. Tang, P. Schwille, C. Mast, and D. Braun, ChemBioChem 23, e202200423 (2022).
- Dass et al. (2023) A. V. Dass, S. Wunnava, J. Langlais, B. von der Esch, M. Krusche, L. Ufer, N. Chrisam, R. C. A. Dubini, F. Gartner, and S. Angerpointner, et al., ChemSystemsChem 5, e202200026 (2023).
- Higgs (2016) P. G. Higgs, Life 6, 24 (2016), number: 2 Publisher: Multidisciplinary Digital Publishing Institute.
- Forsythe et al. (2015) J. G. Forsythe, S.-S. Yu, I. Mamajanov, M. A. Grover, R. Krishnamurthy, F. M. Fernández, and N. V. Hud, Angewandte Chemie International Edition 54, 9871 (2015).
- Mamajanov et al. (2014) I. Mamajanov, P. J. MacDonald, J. Ying, D. M. Duncanson, G. R. Dowdy, C. A. Walker, A. E. Engelhart, F. M. Fernández, M. A. Grover, and V. Hud, Nicholas et al., Macromolecules 47, 1334 (2014).
- Weber (1989) A. L. Weber, Origins of life and evolution of the biosphere 19, 7 (1989).
- Lahav et al. (1978) N. Lahav, D. White, and S. Chang, Science 201, 67 (1978), publisher: American Association for the Advancement of Science.
- Rodriguez-Garcia et al. (2015) M. Rodriguez-Garcia, A. J. Surman, G. J. T. Cooper, I. Suárez-Marina, Z. Hosni, M. P. Lee, and L. Cronin, Nature Communications 6, 8385 (2015), number: 1 Publisher: Nature Publishing Group.
- Fox and Harada (1958) S. W. Fox and K. Harada, Science 128, 1214 (1958).
- Rajamani et al. (2008) S. Rajamani, A. Vlassov, S. Benner, A. Coombs, F. Olasagasti, and D. Deamer, Origins of Life and Evolution of Biospheres 38, 57 (2008).
- Da Silva et al. (2015) L. Da Silva, M.-C. Maurel, and D. Deamer, Journal of Molecular Evolution 80, 86 (2015).
- Fang et al. (1994) Y. Fang, V. A. Pham, T. Matsuura, J. P. Santerre, and R. M. Narbaitz, Journal of Applied Polymer Science 54, 1937 (1994).
- Weber et al. (2019) C. A. Weber, D. Zwicker, F. Jülicher, and C. F. Lee, Reports on Progress in Physics 82, 064601 (2019), publisher: IOP Publishing.
- Kato et al. (2021) S. Kato, D. Garenne, V. Noireaux, and Y. T. Maeda, Biomacromolecules 22, 3451 (2021), publisher: American Chemical Society.
- Hyman et al. (2014) A. A. Hyman, C. A. Weber, and F. Jülicher, Annual Review of Cell and Developmental Biology 30, 39 (2014).
- Blankschtein et al. (1985) D. Blankschtein, G. M. Thurston, and G. B. Benedek, Physical Review Letters 54, 955 (1985).
- Semenov and Rubinstein (1998) A. N. Semenov and M. Rubinstein, Macromolecules 31, 1373 (1998).
- Deviri and Safran (2020) D. Deviri and S. A. Safran, Soft Matter 16, 5458 (2020).
- Bartolucci et al. (2023b) G. Bartolucci, I. S. Haugerud, T. C. T. Michaels, and C. A. Weber, bioRxiv , 2023 (2023b).
- Lewis (2010) A. E. Lewis, Hydrometallurgy 104, 222 (2010).
- Agarwal and Peters (2014) V. Agarwal and B. Peters, Advances in Chemical Physics: Volume 155 , 97 (2014).
- Carrea et al. (2005) G. Carrea, S. Colonna, D. R. Kelly, A. Lazcano, G. Ottolina, and S. M. Roberts, Trends in Biotechnology 23, 507 (2005).
- Eijsink et al. (2005) V. G. H. Eijsink, S. Gåseidnes, T. V. Borchert, and B. van den Burg, Biomolecular Engineering Directed Enzyme Evolution, 22, 21 (2005).
- Schulz et al. (2022) L. Schulz, Z. Guo, J. Zarzycki, W. Steinchen, J. M. Schuller, T. Heimerl, S. Prinz, O. Mueller-Cajar, T. J. Erb, and G. K. A. Hochberg, Science 378, 155 (2022), publisher: American Association for the Advancement of Science.
- Adame-Arana et al. (2020) O. Adame-Arana, C. A. Weber, V. Zaburdaev, J. Prost, and F. Jülicher, Biophysical Journal 119, 1590 (2020).
- Bauermann et al. (2022a) J. Bauermann, S. Laha, P. M. McCall, F. Jülicher, and C. A. Weber, Journal of the American Chemical Society 144, 19294 (2022a), publisher: American Chemical Society.
- Jülicher et al. (1997) F. Jülicher, A. Ajdari, and J. Prost, Reviews of Modern Physics 69, 1269 (1997), publisher: American Physical Society.
- Bartolucci et al. (2021) G. Bartolucci, O. Adame-Arana, X. Zhao, and C. A. Weber, Biophysical Journal 120, 4682 (2021).
- Loche et al. (2022) P. Loche, D. J. Bonthuis, and R. R. Netz, Communications Chemistry 5, 1 (2022), number: 1 Publisher: Nature Publishing Group.
- Hisatake et al. (1993) K. Hisatake, S. Tanaka, and Y. Aizawa, Journal of Applied Physics 73, 7395 (1993).
- Heinen and Vrabec (2019) M. Heinen and J. Vrabec, The Journal of Chemical Physics 151, 044704 (2019).
- Xiong and Yuen (1991) T. Y. Xiong and M. C. Yuen, International Journal of Heat and Mass Transfer 34, 1881 (1991).
- Clary (1990) D. C. Clary, Annual Review of Physical Chemistry 41, 61 (1990).
- Kok and Rudin (1982) C. M. Kok and A. Rudin, Journal of Applied Polymer Science 27, 353 (1982).
- Russell et al. (2015) T. H. Russell, B. J. Edwards, and B. Khomami, EPL 108, 66003 (2015), publisher: EDP Sciences, IOP Publishing and Società Italiana di Fisica.
- Zwicker et al. (2017) D. Zwicker, R. Seyboldt, C. A. Weber, A. A. Hyman, and F. Jülicher, Nature Phys 13, 408 (2017), number: 4 Publisher: Nature Publishing Group.
- Zaks and Klibanov (1988) A. Zaks and A. M. Klibanov, Journal of Biological Chemistry 263, 8017 (1988).
- Brogan et al. (2014) A. P. S. Brogan, K. P. Sharma, A. W. Perriman, and S. Mann, Nature Communications 5, 5058 (2014), number: 1 Publisher: Nature Publishing Group.
- Helms and Wade (1998) V. Helms and R. C. Wade, Proteins: Structure, Function, and Bioinformatics 32, 381 (1998).
- Klibanov (1997) A. M. Klibanov, Trends in Biotechnology 15, 97 (1997).
- Mulkidjanian et al. (2012) A. Y. Mulkidjanian, A. Y. Bychkov, D. V. Dibrova, M. Y. Galperin, and E. V. Koonin, Proceedings of the National Academy of Sciences 109 (2012), 10.1073/pnas.1117774109.
- Damer and Deamer (2015) B. Damer and D. Deamer, Life 5, 872 (2015).
- Campbell et al. (2019) T. D. Campbell, R. Febrian, J. T. McCarthy, H. E. Kleinschmidt, J. G. Forsythe, and P. J. Bracher, Nature Communications 10, 4508 (2019).
- Vlassov et al. (2004) A. V. Vlassov, B. H. Johnston, L. F. Landweber, and S. A. Kazakov, Nucleic Acids Research 32, 2966 (2004).
- Le Vay et al. (2021) K. Le Vay, E. Y. Song, B. Ghosh, T.-Y. D. Tang, and H. Mutschler, Angewandte Chemie International Edition 60, 26096 (2021).
- Mutschler et al. (2015) H. Mutschler, A. Wochner, and P. Holliger, Nature Chemistry 7, 502 (2015), number: 6 Publisher: Nature Publishing Group.
- bio (2023) “Scientific Image and Illustration Software | BioRender,” (01.10.2023), https://www.biorender.com/.
- Bergmann et al. (2022) A. M. Bergmann, C. Donau, F. Späth, K. Jahnke, K. Göpfrich, and J. Boekhoven, Angewandte Chemie 134, e202203928 (2022).
- Bauermann et al. (2022b) J. Bauermann, C. A. Weber, and F. Jülicher, Annalen der Physik 534, 2200132 (2022b).
- Fritsch et al. (2021) A. W. Fritsch, A. F. Diaz-Delgadillo, O. Adame-Arana, C. Hoege, M. Mittasch, M. Kreysing, M. Leaver, A. A. Hyman, F. Jülicher, and C. A. Weber, Proceedings of the National Academy of Sciences 118, e2102772118 (2021), publisher: Proceedings of the National Academy of Sciences.
- Bergmann et al. (2023) A. M. Bergmann, J. Bauermann, G. Bartolucci, C. Donau, M. Stasi, A.-L. Holtmannspötter, F. Jülicher, C. A. Weber, and J. Boekhoven, “Liquid spherical shells are a non-equilibrium steady state,” (2023).
- Alberti et al. (2018) S. Alberti, S. Saha, J. B. Woodruff, T. M. Franzmann, J. Wang, and A. A. Hyman, Journal of Molecular Biology Phase Separation in Biology and Disease, 430, 4806 (2018).
- Arnold and Linke (2007) T. Arnold and D. Linke, BioTechniques 43, 427 (2007), publisher: Future Science.
- Van Kampen (1985) N. G. Van Kampen, Physics Reports 124, 69 (1985).
- Janssen (1989) J. A. M. Janssen, Journal of Statistical Physics 57, 171 (1989).
- Gardiner (1985) C. W. Gardiner, Handbook of stochastic methods, Vol. 3 (springer Berlin, 1985).
