A Large-Scale Comparative Study of Accurate COVID-19 Information versus Misinformation
Abstract
The COVID-19 pandemic led to an infodemic where an overwhelming amount of COVID-19 related content was being disseminated at high velocity through social media. This made it challenging for citizens to differentiate between accurate and inaccurate information about COVID-19. This motivated us to carry out a comparative study of the characteristics of COVID-19 misinformation versus those of accurate COVID-19 information through a large-scale computational analysis of over 242 million tweets. The study makes comparisons alongside four key aspects: 1) the distribution of topics, 2) the live status of tweets, 3) language analysis and 4) the spreading power over time. An added contribution of this study is the creation of a COVID-19 misinformation classification dataset. Finally, we demonstrate that this new dataset helps improve misinformation classification by more than 9% based on average F1 measure.
Introduction
The COVID-19 pandemic was the first pandemic where social networks and mobile devices played a major role as sources of information in a rapidly evolving, dynamic context. Due to the large number of users and posts made daily on social platforms, a COVID-19 infodemic was created (WHO 2020; WHO et al. 2020) where huge volumes of content (both accurate and mis/disinformation) were being published online daily. This made it challenging for citizens to find reliable information, as many fell victim to misinformation and turned to false treatments (Mehrpour and Sadeghi 2020; Caceres et al. 2022; Zhao et al. 2023) instead, or even started attacking medical workers (Orellana 2023; van Stekelenburg et al. 2023).
In order to further our understanding of the infodemic, this paper undertakes a large-scale study of the statistical characteristics of accurate COVID-19 information compared to COVID-19 misinformation on Twitter. The paper aims to answer the following research questions:
-
•
Q1: What are the differences in topics and languages between accurate information and misinformation?
-
•
Q2: What types of misinformation have social media platforms addressed?
-
•
Q3: What is the spreading power of the different types of misinformation?
To help address these research questions, we developed an evidence-based COVID-19 misinformation classifier (Jiang et al. 2021) based on a newly developed training set. Our experiments show that this new training data resulted in a significantly improved model that outperforms a state-of-the-art baseline model (Jiang et al. 2021) by almost 0.2 in F1 measure score (0.51 vs 0.70) under leave-claim-out cross-validation111This evaluation method splits the training and testing sets based on the claim/topic, which is a realistic testing approach for evaluating the model’s performance on unseen misinformation (Jiang et al. 2021).
Next, we collected over 240 million COVID-19 related tweets and applied our best performing classifier to identify the misinformation posts automatically. This then enabled us to analyse the differences between misinformation and accurate posts. The statistical analysis makes comparisons alongside five dimensions: i) topical distribution, ii) spreading power, iii) deletion rate, iv) Bag-of-Words, and v) Linguistic Inquiry and Word Count Analysis.
Related Work
In this section we categorise COVID-19 misinformation statistical characteristic studies into three groups. The first category is the general COVID-19 information characteristic study, which investigates the characteristics of both non-mis- and mis-information but doesn’t split the results along these categories. The second category is the COVID-19 misinformation characteristic study, where machine learning, external knowledge, or manual annotation is used to identify COVID-19 misinformation, and the statistical analysis is based only on misinformation. The third category is the COVID-19 non-mis- and mis-information statistical comparison study, which is the primary focus of this paper. This category investigates the statistical characteristics of both non-mis- and mis-information simultaneously, enabling a direct comparison between them.
General COVID-19 information analysis
Singh et al. (2020) conducted a study on COVID-19 related tweets from January 16 to March 15, 2020. The study reports the volume of tweets over various dimensions, including time, language, and geolocation. Additionally, the study investigates the statistics of word frequency, themes, popular myths, and URLs. Although Singh et al. did not focus specifically on misinformation tweets, the study reports statistics on tweets containing high-quality health sources and low-quality misinformation sources, based on NewsGuard222https://www.newsguardtech.com/. Previous studies (Abdul-Mageed et al. 2020; Photiou, Nicolaides, and Dhillon 2021; Iwendi et al. 2022; Waheeb, Khan, and Shang 2022) have performed sentiment analysis (Medford et al. 2020; Dashtian and Murthy 2021; Chen et al. 2020b; Lamsal 2021; Gupta, Vishwanath, and Yang 2021; Shi et al. 2020), hashtag analysis (Lamsal 2021; Chen et al. 2020a; Suarez-Lledo et al. 2022), engagement (Cinelli et al. 2020), and clustering analysis using topic modelling (Dashtian and Murthy 2021; Gupta, Vishwanath, and Yang 2021; John and Keikhosrokiani 2022) or pre-trained embeddings (Cinelli et al. 2020; Biradar, Saumya, and Chauhan 2022) on general COVID-19 related posts without specifically focusing on COVID-19 misinformation.
COVID-19 misinformation analysis
The statistical analyses on COVID-19 misinformation encompass sentiment (Sharma et al. 2020; Cheng et al. 2021), geolocation (Sharma et al. 2020), topics modelling (Sharma et al. 2020; Shi et al. 2020), sources (Sharma et al. 2020), user analysis (Jain and Sethi 2021), engagement level (Jain and Sethi 2021), and hashtag and word frequency (Sharma et al. 2020; Dharawat et al. 2022; Jain and Sethi 2021; Cheng et al. 2021) have also been conducted in previous studies. In addition, Brennen et al. (2020) conducted a misinformation topic analysis that can be applied to prioritise the fact-check resources to debunk the most harmful kind of misinformation topics. Brennen et al. defined nine different types of misinformation topics and found that the most spread misinformation is related to public authority actions in the early stages of the COVID-19 pandemic. Song et al. (2021) extend this study on a larger scale, and report the topic evolution through different time periods. In this paper, we continue the topic study (Brennen et al. 2020; Song et al. 2021) but in different dimensions which include its spread, live tweet status and sentiment analysis.
Next, we discuss some of the approaches used for identifying misinformation from abundant COVID-19 related information. Some of the previous methods include, 1) Manual annotation (Jiang et al. 2021; Brennen et al. 2020): the most reliable but also the most expensive approach. Therefore, analysis based on this approach is often limited to a small scale. 2) Credibility based classification (Sharma et al. 2020; Cheng et al. 2021): which identifies misinformation based on the credibility of the author and/or the source (e.g. shared URLs). Compared to manual annotation, the credibility approach is a much cheaper alternative to adapt misinformation analysis to a larger scale; however, the major drawback of this approach is identifying misinformation indirectly. Jiang et al. (2021) notice that misinformation is often shared from highly credible sources. 3) Style based machine learning classification (Cheng et al. 2021; Abdelminaam et al. 2021; Kar et al. 2020): style based classifiers identify misinformation based on the writing styles of the text. This approach is effective and often performs well with the misinformation (theme/topics) already covered in the training data. On the other hand, the style-based classifier is less effective in identifying misinformation that is not covered in the training data (Jiang et al. 2021). 4) Evidence-based machine learning classification (Jiang et al. 2021; Hossain et al. 2020a; Pan et al. 2018; Hu et al. 2021): in comparison with the style based classification solely relying on the input text, evidence-based classification also requires external knowledge as evidence to aid the misinformation classification. The external knowledge could be a professional debunked misinformation database (Jiang et al. 2021; Hossain et al. 2020a) or knowledge graph built from true (Pan et al. 2018; Hu et al. 2021) or misinformation (Pan et al. 2018). This approach often provides more reliable misinformation detection results and the evidence is also provided with the results. In this paper, we also apply an evidence-based classification approach for misinformation identification.
Misinformation Comparision Analysis
Cui and Lee (2020) analysed sentiment and hashtag frequency of mis- and non-mis- information and find that COVID-19 misinformation leans more towards negative sentiment compared to non-misinformation, and also hashtag distributions are significantly different. Memon and Carley (2020) studied the Twitter user’s network density, bot ratio and sociolinguistics in the post and demonstrate that misinformed users have a higher bot ratio and a denser network (i.e. accordance opinions are more easily accepted and it is also more difficult to have opposing opinions accepted in a denser network). The study also finds some sociolinguistic differences between mis and non-mis- information, but the results are not significant and are inconclusive. Micallef et al. (2020) conducted a case study to investigate the spread of misinformation and debunks related to some pre-defined COVID-19 topics (e.g., 5G conspiracy theories), which may lead to hesitation towards COVID-19 vaccination (Mu et al. 2023). Burel et al. (2020) did a post-hoc causality analysis to study the spread of COVID-19 misinformation and fact-checks on Twitter, while Recuero et al. (2022) used Crowdtangle to study the spread of COVID-19 disinformation and fact-checks on Facebook. Silva et al. (2020) and Kouzy et al. (2020) both study the engagement level between mis and non-mis- information, however, the conclusions from these two studies are different. Kouzy et al. (2020) observed that there is no difference in the engagement level between the two groups, but Silva et al. (2020) notice that misinformation often has a higher engagement level. The difference is possibly due to the different data collection methods.
Data and Misinformation Classification
The data in this work is collected from Twitter via Twitter Stream API333 https://developer.twitter.com/en/docs/twitter-api using keywords associated with COVID-19 (e.g. covid and covid-19, the complete list is in Table 5). The data was collected from March 2020 to July 2021, and we collected a total of 242,823,999 tweets. However, we only considered the source tweets for analysis and therefore excluded retweets and replies, resulting in 6,691,181 remaining source tweets that were used in this study.
Our approach for detecting misinformation is based on evidence-based classification, adapted from Jiang et al. (2021) 444We used a coarse-grained BERT pairwise classification model. The classifier is trained through a pairwise approach that similar to BERT next sentence prediction Devlin et al. (2019). The input pairs consist: 1) Claim: a verified misinformation claim from a professional fact-checker and 2) Tweet: the text of the tweet to be classified. Please note the classification process solely relies on the tweet text for categorisation, and does not utilise any additional contextual information, such as quoted text, images, or external web pages referenced within the tweet. The classifier predicts whether the tweet text belongs to one of three classes: a) Misinformation, b) Debunk, or c) Irrelevant. We have enhanced the original model by adding two additional steps: 1) Data enrichment and 2) Results filtering to improve classification accuracy. We describe these steps in detail in Section ‘Data Enrichment’ and Section ‘Misinformation Detection’.
Data Enrichment
In addition to the training data outlined in Jiang et al. (2021), we expanded our dataset by collecting training data from three additional sources: 1) the CovidLies (Hossain et al. 2020b) dataset, 2) our own collection of tweets with external knowledge, and 3) the IFCN Poynter website. The process of enriching the dataset with data from these sources will be discussed in this section.
The CovidLies dataset provides a manually annotated evidence-based dataset for misinformation classification. We converted its label set directly into the labels used in Jiang et al. (2021): Misinformation, Debunk, and Irrelevant. However, many tweets were deleted by the time we reconstructed the CovidLies data using Twitter API, leaving us with only 87 Misinformation, 87 Debunk, and 3,142 Irrelevant tweets.
We employed external knowledge to label our in-house tweet collection to create a ‘silver standard’ training dataset. First, select all the source tweets (i.e. excluding replies or retweets) and generate candidate labels for those tweets using the original (Jiang et al. 2021) trained classifier. For the next step, we only keep Misinformation and Debunk tweets based on the output label form classifier with a confidence score (i.e. model’s softmax output) greater than 0.7. The threshold was determined by manually examining a subset of samples.
In the third step, we used Twitter’s COVID-19 misleading information policy to identify deleted tweets likely to be Misinformation. Any candidate Misinformation tweet that had been removed from Twitter was selected as a final Misinformation sample.
For Debunk samples, we noticed that debunking tweets often reference articles published on professional fact-checker websites. We utilised the IFCN Poynter debunking data as a knowledge source to select any remaining Debunk candidate tweets containing URLs linked to the IFCN Poynter debunks as enriched Debunk training samples.
Finally, we selected Irrelevant training samples to correct false positives caused by the classifier. These samples were extracted from the Misinformation candidates but posted from highly credible accounts, such as WHO. The full list of credible accounts is provided in Table 6.
![[Uncaptioned image]](/html/2304.04811/assets/Figures/IFCNweb.png)

The IFCN Poynter website provides a valuable source for enriching our training samples. As shown in Figure 1, each debunk on the website includes a misinformation claim, an explanation of why it is false, and a link to the full debunk article. For example:
To extract training samples from this source, we collect all the explanations and use them as Debunk samples. For Misinformation samples, we need to access the full article of the debunk, as shown in Figure 1. The original source misinformation claims are often referenced in the article (highlighted in blue in Figure 1). We use regular expressions to extract this text and label it as Misinformation in our enriched dataset.
| DataSet | IRRELEVANT | DEBUNK | MISINFO |
|---|---|---|---|
| Jiang et al. | 1066 | 194 | 522 |
| CovidLies | 3142 | 87 | 123 |
| Tweet Collect | 5757 | 3692 | 670 |
| IFCN | 0 | 1892 | 96 |
| Total | 9965 | 5865 | 1411 |
Enrichment Data Cleaning
Since the classifier used in this study is trained on pairwise input (claim and tweet text pair), tweet text can only be accurately labelled as Misinformation if it matches the paired claim. However, in the data enrichment process using in-house and IFCN data, there is no guarantee that the pairing process will be accurate. To improve the quality of the enriched data and reduce the number of mismatches between claim and text pairs, a pair cleaning process is conducted. Specifically, the Stanford OpenIE SVO parser (Angeli, Premkumar, and Manning 2015) is used to extract the Subject and Object in both the claim and the tweet text. Samples are discarded if neither the claim Subject nor the claim Object is mentioned in the tweet text. Table 1 shows the statistics of training samples after the cleaning process.
Model Training and Performance
The training process of the model is based on Jiang et al. (2021), and we will briefly explain the key settings in this section. For more detailed training settings, please refer to the paper.
The classification model is a fine tuned COVID-Twitter Pre-Trained (Müller, Salathé, and Kummervold 2020) BERT Large (Devlin et al. 2019). It contains 24 transformer layers, and in our experiment, only the parameters in the last transformer encoding layer are unlocked for fine-tuning, while the remaining BERT weights remain frozen. Similar to the BERT next sentence prediction task, the input to the model is constructed as ‘[CLS] + Claim + [SEP] + Tweet_Text + [SEP]’, and the Softmax classifier predicts the probability of labels based on the pairwise [CLS] representation.
We conduct five-folds ‘Leave-Claim-Out Cross Validation’ described in Jiang et al. (2021) to compare enrichment performance. Note that the five-folds are only conducted on the original Jiang et al. (2021) annotated dataset. The enriched data is only added as supplemental training data, therefore, the total number of test samples is the same as in the experiment described in Jiang et al. (2021). The purpose of Leave-Claim-Out Cross Validation is to test the classification performance for unseen misinformation. To ensure a fair comparison with the non-enriched model, we manually removed claims from the enriched dataset that were already present in the original annotated dataset in Jiang et al. (2021), so that the test claims were unseen during training.
| Non-enriched | Enriched | |
|---|---|---|
| Accuracy | 0.64 | 0.70 |
| Avg. F1 | 0.57 | 0.66 |
| Debunk F1 | 0.47 | 0.56 |
| IRRELEVANT F1 | 0.72 | 0.72 |
| Misinformation F1 | 0.51 | 0.70 |
Compared to the non-enriched classifier, our enriched classifier yields an overall F1 measure of 0.66, which is more than 9% higher than the non-enriched classifier’s overall F1 measure of 0.57. Furthermore, the F1 measure of the Misinformation class is significantly increased from 0.51 to 0.70 by our enriched classifier.
Misinformation Detection
In the misinformation detection process, we used 12,748 claims collected from the IFCN Poynter website as input for our pairwise classifier. The claim collection process followed the same procedure as in previous studies (Song et al. 2021; Jiang et al. 2021).
However, since our classifier requires pairwise inputs, classifying the 6 million source tweets against the 12,748 IFCN claims would result in 72 billion pairs, which is computationally expensive. To reduce the computational cost and speed up the classification process, we conducted an additional candidate pair selection step. Here’s an overview of our misinformation extraction procedure:
-
1.
We index the 6 million source tweets using Elastic Search.
-
2.
The 12,748 IFCN claims are used as queries to search for relevant tweets in the index. We use the BM25 ranking algorithm (Robertson et al. 1995) to rank the tweets and select the top 20,000 tweets for each query based on their BM25 score.
-
3.
After retrieving the top 20,000 tweets using BM25, we conduct reranking based on the cosine similarity between tinyBERT embeddings of the queries and tweets. This allows us to select the top 1,000 tweets that are semantically similar to the IFCN claim, which serves as candidate pairs for the classification process.
-
4.
Misinformation may also be time-sensitive. The claim may become true or false in different time periods. For example, in early March 2020, there was misinformation claiming that Trump was infected with COVID-19555https://www.poynter.org/?ifcn˙misinformation=trump-faints-is-infected-with-coronavirus, which remained misinformation until October 2020 when the White House COVID-19 outbreak meant Donald Trump actually tested positive for COVID-19666https://www.forbes.com/sites/elanagross/2020/10/02/white-house-outbreak-here-are-the-people-who-have-tested-positive-for-covid-near-president-trump/?sh=43ab1d76799a. Therefore, we only consider tweets that were posted within a date range of ten weeks before and two weeks after the IFCN claim debunk date. Candidate tweets that fall outside of this period will be filtered out.
-
5.
The misinformation classifier (described in Section ‘Model Training and Performance’) is applied to the remaining candidates. A post-process step is conducted to ensure the precision of the misinformation extraction. The final set of misinformation tweets is selected if the classifier predicted label is ‘misinformation’ and satisfies one of the following conditions: 1) the classifier confidence score is greater than, or equal to 0.95, or 2) the tweet text shares the same subject or object with the paired IFCN claim. The subject and object are extracted using the Stanford OpenIE SVO parser. In total, we collected 14,058 misinformation tweets.
Misinformation Analysis
This section presents a statistical analysis of 14,058 source misinformation tweets, including their topical distribution, emotional categories, and distributional statistics. For comparison, we also conduct the same analysis for non-misinformation tweets, which consist of 20,000 randomly selected source tweets that were not classified as ‘misinformation’ by the classifier.
Topical Distribution
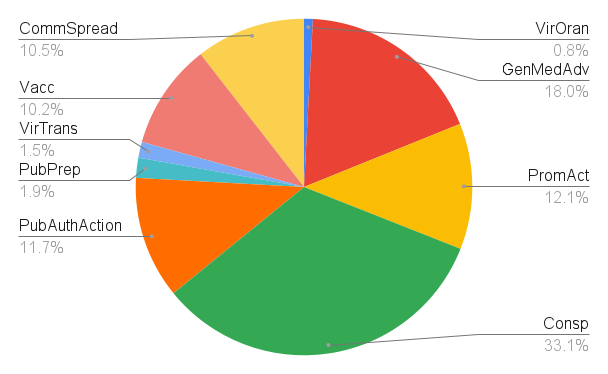
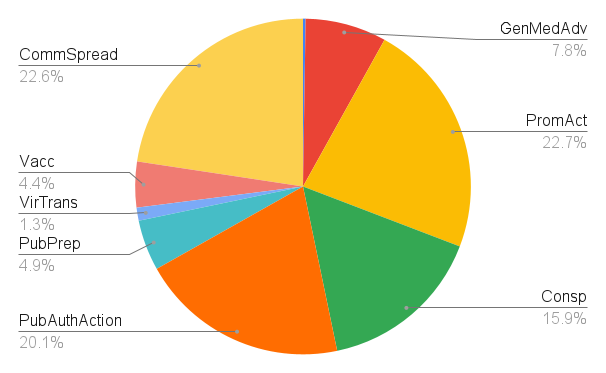
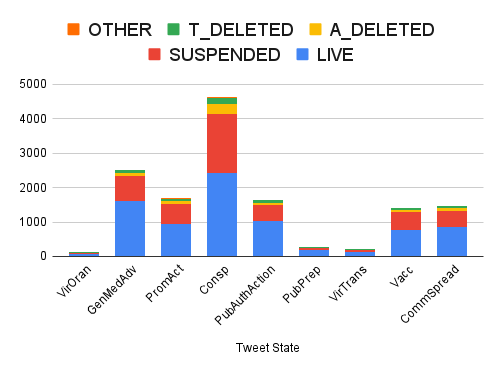
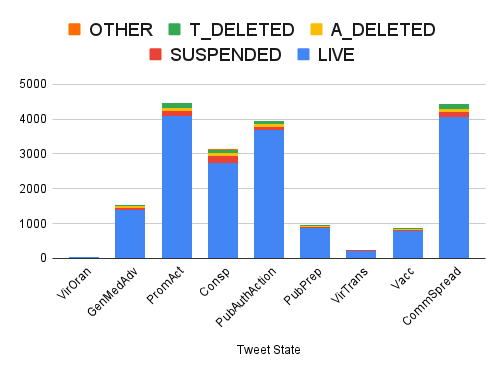
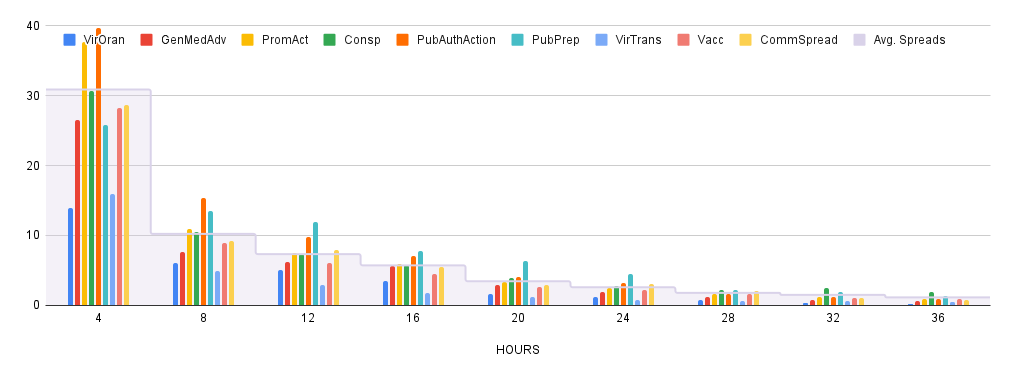
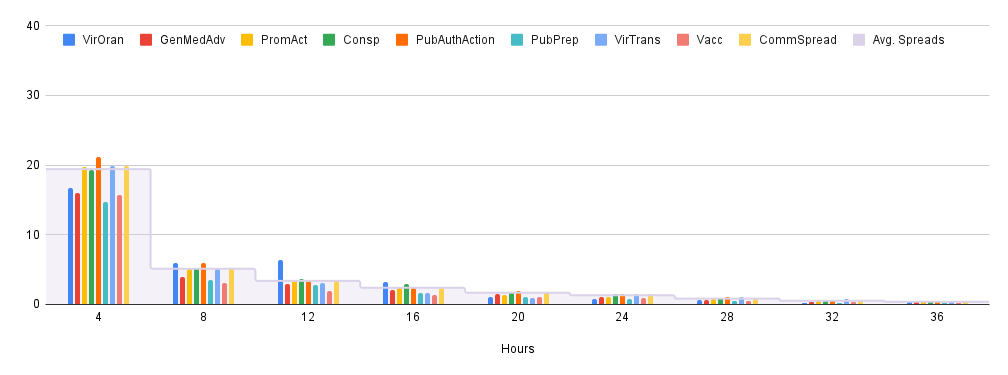
Figure 2 and Figure 3 are the topic distribution of source misinformation and non-misinformation tweets.
The topic distribution of source misinformation tweets is notably different from that of non-misinformation tweets. The most frequently mentioned topic in the misinformation tweets is ‘conspiracy theory’, accounting for almost one third (33.1%) of all the misinformation tweets. The second-largest proportion of the misinformation tweets pertains to ‘general medical advice’ (18%). Conversely, the most commonly mentioned topics in non-misinformation tweets are ‘prominent actors’ (22.7%), ‘community spread and impact’ (22.6%) and ‘public authority action’ (20.1%).
Figure 4 and Figure 5 display bar charts that show the number of tweets in each topic, with colours indicating the live status of the tweet as of October 28, 2021. The live status of the tweets was determined by revisiting them via the Twitter API. The colours used in the charts represent the following live statuses: blue indicates that the tweet was still available on the day of the revisit, red indicates that the account used to post the tweet has been suspended by Twitter, Account deleted indicates that the account used to post the tweet has been deleted for an unknown reason, ‘Tweet deleted’ indicates that the tweet has been deleted for an unknown reason, and ‘Other’ indicates that the tweet was not accessible on the day of the revisit due to privacy settings.
The live statuses of misinformation and non-misinformation tweets exhibit significant differences. More than 40% of the misinformation tweets were not accessible during revisit, and the primary reason was account suspension, with a suspension rate of 33.1%. In contrast, only 8.8% of non-misinformation tweets were inaccessible, and the account suspension rate was much lower at 3.7%.
The spread of conspiracy theory misinformation seems to have garnered significant attention from Twitter, with approximately half of the conspiracy theory misinformation tweets being removed from the platform. In particular, the account suspension rate for tweets about conspiracy theories is 37%. On the other hand, misinformation tweets about the ‘virus origin’ seem to have received the least attention, with almost 70% of such tweets still being available on the platform and the account suspension rate being only 23.7%.
| Bag-Of-Words | |||
|---|---|---|---|
| Non-misinformation | r | Misinformation | r |
| Our | 0.138 | Gates | 0.204 |
| Cases | 0.127 | Bill | 0.177 |
| During | 0.125 | China | 0.172 |
| Today | 0.121 | hydroxychloroquine | 0.171 |
| We | 0.117 | Wuhan | 0.164 |
| At | 0.107 | Coronavirus | 0.159 |
| On | 0.101 | Lab | 0.149 |
| And | 0.098 | Fauci | 0.144 |
| Support | 0.098 | Vitamin | 0.143 |
| Help | 0.093 | Virus | 0.143 |
| LIWC | |||
|---|---|---|---|
| Non-misinformation | r | Misinformation | r |
| Affiliation | 0.200 | Health | 0.164 |
| Time | 0.186 | Biological Processes | 0.142 |
| Emotional Tone | 0.170 | Negative Emotion | 0.131 |
| Relativity | 0.170 | Anger | 0.126 |
| Prepositions | 0.148 | Quotation Marks | 0.123 |
| Authentic | 0.136 | Past Focus | 0.113 |
| Drives | 0.133 | Death | 0.109 |
| Positive Emotion | 0.126 | Semicolons | 0.105 |
| We | 0.126 | Causation | 0.093 |
| Social | 0.124 | Dashes | 0.076 |
Figure 6 and Figure 7 show the average number of spreads (i.e. retweets or quotes) of source misinformation and non-misinformation tweets in 4-hour intervals. Overall, the analysis reveals that misinformation spreads more quickly than non-misinformation. Specifically, the average spread power of a misinformation tweet during the first 36 hours is 64.5, which means that the tweet is retweeted or quoted an average of 64.5 times in that period. By contrast, non-misinformation tweets have a much lower average spread power of 34.8 during the first 36 hours.
During the first 4 hours, the spread power of misinformation tweets is highest, with a value of 30.8. The topics of ‘prominent actor’ and ‘public authority action’ have notably higher spread power than other topics, with values of 37.6 and 39.6 spreads, respectively. In contrast, the spread of non-misinformation is more evenly distributed across different topics, and the average spread power in the first 4 hours is 19.4.
After 4 hours, the number of spreads reduces significantly. In the next 4-hour period, the average spread power of misinformation drops to 10.2, and that of non-misinformation drops to 5.09. During this period, ‘public authority action’ related misinformation still receives significantly higher spreads (15.3 spreads) than other topics. In the period between 12 and 28 hours, ‘public preparation’ misinformation remains a hot topic, where an average tweet on this topic has 32.8 spreads. Moreover, ‘conspiracy theory’ has a longer spreading period than other topics, as it is the only topic that still has more than two spreads even after 32 hours.
Linguistic Analysis
In this section, we compare linguistic features between misinformation and non-misinformation tweets. For that purpose, we follow a similar approach to previous studies by Schwartz et al. (2013) and extract the top 10 correlated features using Bag-Of-Words and Linguistic Inquiry and Word Count (LIWC) (Pennebaker, Francis, and Booth 2001). We conduct the univariate Pearson’s Correlation test to determine which linguistic features, such as individual BOW tokens and LIWC categories, are highly correlated with categorical variables (i.e., misinformation or non-misinformation), in line with recent research in computational misinformation analysis (Mu and Aletras 2020; Mu, Niu, and Aletras 2022). The reported linguistic features are statistically significant and show correlations with both misinformation and non-misinformation categories (with a p-value of less than 0.05).
Bag-Of-Words
We established specific criteria to select the Bag-Of-Words (BOW) features, which are as follows: i) the word’s document frequency must be between three and 40% of the total tweets (i.e. where is the document frequency, is the total number of tweets used for comparison study). ii) The words are then scored based on the TF-IDF score, and we keep the top 5,000 words as the BOW features for this analysis.
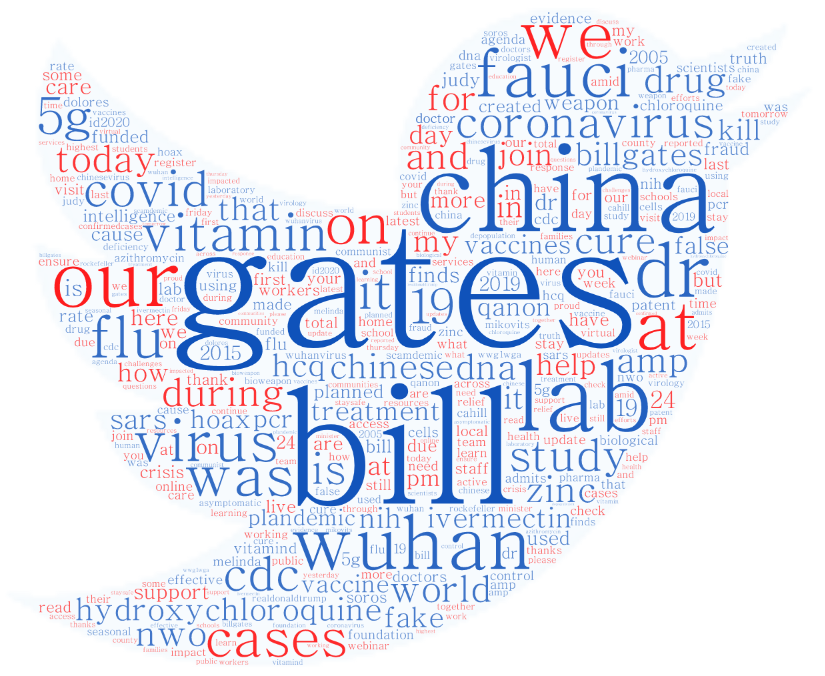
The BOW analysis results are presented in Table 3, where Pearson’s correlations are reported in column r. The top 10 BOWs for misinformation tweets align with the findings from the topical distribution analysis discussed in Section ‘Topical Distribution’. The top 10 BOWs are mainly associated with ‘conspiracy theories’ (e.g. Gates, Bill777https://www.politifact.com/factchecks/2020/may/20/facebook-posts/no-gates-foundation-isnt-pushing-microchips-all-me/, Lab, China 888https://www.poynter.org/?ifcn˙misinformation=coronavirus-has-been-originated-in-a-laboratory-linked-to-chinas-biowarfare-program-2) and ‘general medical advice’ (e.g. hydroxychloroquine999https://www.poynter.org/?ifcn˙misinformation=hydroxychloroquine-completely-cures-people-infected-with-covid-19, Vitamin). Compared to non-misinformation, the top 10 BOWs all related to common words (e.g. Our, We, On, And).
| #blackfungus | #covid19vaccination | #socialdistancing | #chinesebioterrorism | #greatreset |
| #chinesevirus | #covid19vaccine | #stayathome | #chinesevirus | #hydroxichloroquine |
| #corona | #covid2019 | #stayhomestaysafe | #ciavirus | #hydroxychloroquine |
| #corona19 | #covid2019uk | #staysafe | #coronabollocks | #idonotconsent |
| #corona2019 | #covid_19 | #unite2fightcorona | #coronacon | #israelvirus |
| #coronapandemic | #covid_19_uk | #wearamask | #coronafacts | #kungflu |
| #coronasecondwave | #covid_2019_uk | #workfromhome | #coronafakenews | #mildsymptoms |
| #coronaupdate | #covidemergency | #wuhanvirus | #coronafraud | #nwo |
| #coronav | #covidemergency2021 | #5g | #coronahoax | #nwoevilelites |
| #coronavaccine | #covidhelp | #5gcoronavirus | #coronasymptoms | #nwoevilplans |
| #coronavirus | #covidresources | #americavirus | #coronavillains | #nwovirus |
| #coronavirus19 | #covidsecondwave | #astrazeneca | #coronavirus5g | #obamagate |
| #coronavirus2019 | #covidsos | #ccpvirus | #coronaviruscoverup | #oxfordvaccine |
| #coronavirusoutbreak | #coviduk | #chinaliedandpeopledied | #coronavirusfacts | #plandemic |
| #coronaviruspandemic | #covidvaccination | #chinaliedpeopledied | #covid19symptoms | #preventnwo |
| #coronavirustruth | #covidvaccine | #chinaliespeopledied | #covidiots | #remdesivir |
| #coronavirusupdates | #covid?19 | #chinesebioterrorism | #covidsymptoms | #reopenbritain |
| #covid | #lockdown | #chinesevirus | #cronyvirus | #resistthegreatreset |
| #covid-19 | #lockdown2021 | #ciavirus | #deepstatevirus | #scamdemic |
| #covid-19-uk | #pandemic | #chinaliedandpeopledied | #depopulation | #sorosvirus |
| #covid19 | #remotework | #chinaliedpeopledied | #endthelockdown | #wholiedpeopledied |
| #covid19uk | #sarscov2 | #chinaliespeopledied | #endthelockdownuk | #wuhanvirus |
| Account Name | Display Name |
|---|---|
| ANI | ANI |
| GT | Global Times |
| roinnslainte | Department of Health |
| WHO | World Health Organization (WHO) |
| wef | World Economic Forum |
| GHS | Global Health Strategies |
| AFP | AFP News Agency |
| UN | United Nations |
| EMRO | WHO Eastern Mediterranean Regional Office |
LIWC
The Linguistic Inquiry and Word Count (LIWC) (Pennebaker, Francis, and Booth 2001) is a dictionary of around 6,400 words that are mapped to 93 manually created lexical categories. LIWC has been widely used in computational social science. For this study, we used version 2015 of LIWC (Pennebaker, Francis, and Booth 2001). Examples of words for each category can be found in the user manual101010https://repositories.lib.utexas.edu/bitstream/handle/2152/31333/LIWC2015˙LanguageManual.pdf. The top 10 LIWC categories, sorted by Pearson’s Correlation (r) between the normalised frequency and the labels (i.e., Non-mis vs. Misinformation), are shown in Table 4. We observed that LIWC categories such as Health, Biological Processes, and Death are highly correlated with misinformation.
Furthermore, Table 4 displays the top 10 LIWC categories sorted by Pearson’s Correlation (r) between the normalised frequency and the tweet categories (i.e., non-misinformation vs. misinformation). Misinformation is highly correlated with categories such as ‘Anger’, ‘Negative Emotion’, and ‘Death’. In contrast, non-misinformation is more correlated with opposite categories, such as ‘Positive Emotion’, ‘Authentic’, and social categories (‘Social’, ‘We’, ‘Affiliation’).
Conclusion
This paper presents a comprehensive comparison study between non-mis- and mis- COVID-19 information, using a machine learned classifier to extract misinformation. To ensure the accuracy of misinformation classification, we introduced a data enrichment process and post-process steps.
The results of our comparison study show that there are clear differences between COVID-19 misinformation and non-misinformation tweets. Specifically, we found that non-misinformation tweets predominantly focus on prominent actors and community spread, whereas approximately one-third of misinformation source tweets are related to conspiracy theory.
Our linguistic analysis supports the findings from the topical analysis. The top 10 Bag-Of-Words features associated with misinformation are related to conspiracy theory. Moreover, our LIWC analysis indicates that misinformation is frequently associated with ‘negative emotion’, ‘anger’, and ‘death’, while non-misinformation is associated with ‘positive emotion’, ‘authenticity’, and ‘social’ categories.
Addressing misinformation related to conspiracy theory appears to be the primary concern of social media platforms, as evidenced by the removal of over 40% of related misinformation tweets on Twitter. Conversely, tweets related to the topic of virus origin have received the least attention, with nearly 70% of such tweets still accessible.
Misinformation tweets have a spreading power 158% higher than non-misinformation tweets. Notably, tweets related to conspiracy theory have a longer spreading period than other topics, with more than two spreads even after 32 hours.
Acknowledgements
This work has been co-funded by the European Union under the Horizon Europe vera.ai (grant 101070093) and Vigilant (grant 101073921) projects and the UK’s innovation agency (Innovate UK) grants 10039055 and 10039039. We would like to thank all the anonymous reviewers for their valuable feedback.
References
- Abdelminaam et al. (2021) Abdelminaam, D. S.; Ismail, F. H.; Taha, M.; Taha, A.; Houssein, E. H.; and Nabil, A. 2021. Coaid-deep: An optimized intelligent framework for automated detecting covid-19 misleading information on twitter. Ieee Access, 9: 27840–27867.
- Abdul-Mageed et al. (2020) Abdul-Mageed, M.; Elmadany, A.; Pabbi, D.; Verma, K.; and Lin, R. 2020. Mega-cov: A billion-scale dataset of 65 languages for covid-19. arXiv preprint arXiv:2005.06012, 3(1).
- Angeli, Premkumar, and Manning (2015) Angeli, G.; Premkumar, M. J. J.; and Manning, C. D. 2015. Leveraging linguistic structure for open domain information extraction. In Proceedings of the 53rd Annual Meeting of the Association for Computational Linguistics and the 7th International Joint Conference on Natural Language Processing (Volume 1: Long Papers), 344–354.
- Biradar, Saumya, and Chauhan (2022) Biradar, S.; Saumya, S.; and Chauhan, A. 2022. Combating the infodemic: COVID-19 induced fake news recognition in social media networks. Complex & Intelligent Systems, 1–13.
- Brennen et al. (2020) Brennen, J. S.; Simon, F. M.; Howard, P. N.; and Nielsen, R. K. 2020. Types, sources, and claims of COVID-19 misinformation. Ph.D. thesis, University of Oxford.
- Burel et al. (2020) Burel, G.; Farrell, T.; Mensio, M.; Khare, P.; and Alani, H. 2020. Co-spread of misinformation and fact-checking content during the COVID-19 pandemic. In International Conference on Social Informatics, 28–42. Springer.
- Caceres et al. (2022) Caceres, M. M. F.; Sosa, J. P.; Lawrence, J. A.; Sestacovschi, C.; Tidd-Johnson, A.; Rasool, M. H. U.; Gadamidi, V. K.; Ozair, S.; Pandav, K.; Cuevas-Lou, C.; et al. 2022. The impact of misinformation on the COVID-19 pandemic. AIMS public health, 9(2): 262.
- Chen et al. (2020a) Chen, E.; Lerman, K.; Ferrara, E.; et al. 2020a. Tracking social media discourse about the covid-19 pandemic: Development of a public coronavirus twitter data set. JMIR public health and surveillance, 6(2): e19273.
- Chen et al. (2020b) Chen, L.; Lyu, H.; Yang, T.; Wang, Y.; and Luo, J. 2020b. In the eyes of the beholder: analyzing social media use of neutral and controversial terms for COVID-19. arXiv preprint arXiv:2004.10225.
- Cheng et al. (2021) Cheng, M.; Wang, S.; Yan, X.; Yang, T.; Wang, W.; Huang, Z.; Xiao, X.; Nazarian, S.; and Bogdan, P. 2021. A COVID-19 Rumor Dataset. Frontiers in Psychology, 12.
- Cinelli et al. (2020) Cinelli, M.; Quattrociocchi, W.; Galeazzi, A.; Valensise, C. M.; Brugnoli, E.; Schmidt, A. L.; Zola, P.; Zollo, F.; and Scala, A. 2020. The COVID-19 social media infodemic. Scientific Reports, 10(1): 1–10.
- Cui and Lee (2020) Cui, L.; and Lee, D. 2020. CoAID: COVID-19 Healthcare Misinformation Dataset. arXiv:2006.00885.
- Dashtian and Murthy (2021) Dashtian, H.; and Murthy, D. 2021. Cml-covid: A large-scale covid-19 twitter dataset with latent topics, sentiment and location information. arXiv preprint arXiv:2101.12202.
- Devlin et al. (2019) Devlin, J.; Chang, M.-W.; Lee, K.; and Toutanova, K. 2019. BERT: Pre-training of Deep Bidirectional Transformers for Language Understanding. In Proceedings of the 2019 Conference of the North American Chapter of the Association for Computational Linguistics: Human Language Technologies, Volume 1 (Long and Short Papers), 4171–4186.
- Dharawat et al. (2022) Dharawat, A.; Lourentzou, I.; Morales, A.; and Zhai, C. 2022. Drink Bleach or Do What Now? Covid-HeRA: A Study of Risk-Informed Health Decision Making in the Presence of COVID-19 Misinformation. In Proceedings of the International AAAI Conference on Web and Social Media, volume 16, 1218–1227.
- Gupta, Vishwanath, and Yang (2021) Gupta, R.; Vishwanath, A.; and Yang, Y. 2021. Global reactions to COVID-19 on Twitter: a labelled dataset with latent topic, sentiment and emotion attributes.
- Hossain et al. (2020a) Hossain, T.; Logan IV, R. L.; Ugarte, A.; Matsubara, Y.; Young, S.; and Singh, S. 2020a. COVIDLies: Detecting COVID-19 Misinformation on Social Media. In Proceedings of the 1st Workshop on NLP for COVID-19 (Part 2) at EMNLP 2020. Online: Association for Computational Linguistics.
- Hossain et al. (2020b) Hossain, T.; Logan IV, R. L.; Ugarte, A.; Matsubara, Y.; Young, S.; and Singh, S. 2020b. COVIDLIES: Detecting COVID-19 Misinformation on Social Media. In Proceedings of the 1st Workshop on NLP for COVID-19 (Part 2) at EMNLP 2020.
- Hu et al. (2021) Hu, L.; Yang, T.; Zhang, L.; Zhong, W.; Tang, D.; Shi, C.; Duan, N.; and Zhou, M. 2021. Compare to the knowledge: Graph neural fake news detection with external knowledge. In Proceedings of the 59th Annual Meeting of the Association for Computational Linguistics and the 11th International Joint Conference on Natural Language Processing (Volume 1: Long Papers), 754–763.
- Iwendi et al. (2022) Iwendi, C.; Mohan, S.; Ibeke, E.; Ahmadian, A.; Ciano, T.; et al. 2022. Covid-19 fake news sentiment analysis. Computers and electrical engineering, 101: 107967.
- Jain and Sethi (2021) Jain, D.; and Sethi, T. 2021. The State of Infodemic on Twitter. arXiv preprint arXiv:2105.07730.
- Jiang et al. (2021) Jiang, Y.; Song, X.; Scarton, C.; Aker, A.; and Bontcheva, K. 2021. Categorising Fine-to-Coarse Grained Misinformation: An Empirical Study of COVID-19 Infodemic. arXiv preprint arXiv:2106.11702.
- John and Keikhosrokiani (2022) John, S. A.; and Keikhosrokiani, P. 2022. COVID-19 fake news analytics from social media using topic modeling and clustering. In Big Data Analytics for Healthcare, 221–232. Elsevier.
- Kar et al. (2020) Kar, D.; Bhardwaj, M.; Samanta, S.; and Azad, A. P. 2020. No rumours please! A multi-indic-lingual approach for COVID fake-tweet detection. In 2021 Grace Hopper Celebration India (GHCI), 1–5. IEEE.
- Kouzy et al. (2020) Kouzy, R.; Abi Jaoude, J.; Kraitem, A.; El Alam, M. B.; Karam, B.; Adib, E.; Zarka, J.; Traboulsi, C.; Akl, E. W.; and Baddour, K. 2020. Coronavirus goes viral: quantifying the COVID-19 misinformation epidemic on Twitter. Cureus, 12(3).
- Lamsal (2021) Lamsal, R. 2021. Design and analysis of a large-scale COVID-19 tweets dataset. Applied Intelligence, 51(5): 2790–2804.
- Medford et al. (2020) Medford, R. J.; Saleh, S. N.; Sumarsono, A.; Perl, T. M.; and Lehmann, C. U. 2020. An “infodemic”: leveraging high-volume Twitter data to understand early public sentiment for the coronavirus disease 2019 outbreak. In Open Forum Infectious Diseases, volume 7, ofaa258. Oxford University Press US.
- Mehrpour and Sadeghi (2020) Mehrpour, O.; and Sadeghi, M. 2020. Toll of acute methanol poisoning for preventing COVID-19. Archives of toxicology, 94(6): 2259–2260.
- Memon and Carley (2020) Memon, S. A.; and Carley, K. M. 2020. Characterizing covid-19 misinformation communities using a novel twitter dataset. arXiv preprint arXiv:2008.00791.
- Micallef et al. (2020) Micallef, N.; He, B.; Kumar, S.; Ahamad, M.; and Memon, N. 2020. The role of the crowd in countering misinformation: A case study of the COVID-19 infodemic. In 2020 IEEE International Conference on Big Data (Big Data), 748–757. IEEE.
- Mu and Aletras (2020) Mu, Y.; and Aletras, N. 2020. Identifying Twitter users who repost unreliable news sources with linguistic information. PeerJ Computer Science, 6: e325.
- Mu et al. (2023) Mu, Y.; Jin, M.; Grimshaw, C.; Scarton, C.; Bontcheva, K.; and Song, X. 2023. VaxxHesitancy: A Dataset for Studying Hesitancy Towards COVID-19 Vaccination on Twitter. arXiv preprint arXiv:2301.06660.
- Mu, Niu, and Aletras (2022) Mu, Y.; Niu, P.; and Aletras, N. 2022. Identifying and characterizing active citizens who refute misinformation in social media. In 14th ACM Web Science Conference 2022, 401–410.
- Müller, Salathé, and Kummervold (2020) Müller, M.; Salathé, M.; and Kummervold, P. E. 2020. Covid-twitter-bert: A natural language processing model to analyse covid-19 content on twitter. arXiv preprint arXiv:2005.07503.
- Orellana (2023) Orellana, C. I. 2023. Health workers as hate crimes targets during COVID-19 outbreak in the Americas. Revista de Salud Pública, 22: 253–257.
- Pan et al. (2018) Pan, J. Z.; Pavlova, S.; Li, C.; Li, N.; Li, Y.; and Liu, J. 2018. Content based fake news detection using knowledge graphs. In International semantic web conference, 669–683. Springer.
- Pennebaker, Francis, and Booth (2001) Pennebaker, J. W.; Francis, M. E.; and Booth, R. J. 2001. Linguistic inquiry and word count: LIWC 2001. Mahway: Lawrence Erlbaum Associates, 71(2001): 2001.
- Photiou, Nicolaides, and Dhillon (2021) Photiou, A.; Nicolaides, C.; and Dhillon, P. S. 2021. Social status and novelty drove the spread of online information during the early stages of COVID-19. Scientific reports, 11(1): 1–7.
- Recuero et al. (2022) Recuero, R.; Soares, F. B.; Vinhas, O.; Volcan, T.; Hüttner, L. R. G.; and Silva, V. 2022. Bolsonaro and the Far Right: How Disinformation About COVID-19 Circulates on Facebook in Brazil. International Journal of Communication, 16: 24.
- Robertson et al. (1995) Robertson, S. E.; Walker, S.; Jones, S.; Hancock-Beaulieu, M. M.; Gatford, M.; et al. 1995. Okapi at TREC-3. Nist Special Publication Sp, 109: 109.
- Schwartz et al. (2013) Schwartz, H. A.; Eichstaedt, J. C.; Kern, M. L.; Dziurzynski, L.; Ramones, S. M.; Agrawal, M.; Shah, A.; Kosinski, M.; Stillwell, D.; and Seligman, M. E. 2013. Personality, Gender, and Age in the Language of Social Media: The Open-vocabulary Approach. PloS ONE, 8(9).
- Sharma et al. (2020) Sharma, K.; Seo, S.; Meng, C.; Rambhatla, S.; and Liu, Y. 2020. Covid-19 on social media: Analyzing misinformation in twitter conversations. arXiv preprint arXiv:2003.12309.
- Shi et al. (2020) Shi, W.; Liu, D.; Yang, J.; Zhang, J.; Wen, S.; and Su, J. 2020. Social bots’ sentiment engagement in health emergencies: A topic-based analysis of the covid-19 pandemic discussions on twitter. International Journal of Environmental Research and Public Health, 17(22): 8701.
- Silva et al. (2020) Silva, M.; Ceschin, F.; Shrestha, P.; Brant, C.; Fernandes, J.; Silva, C. S.; Grégio, A.; Oliveira, D.; and Giovanini, L. 2020. Predicting misinformation and engagement in covid-19 twitter discourse in the first months of the outbreak. arXiv preprint arXiv:2012.02164.
- Singh et al. (2020) Singh, L.; Bansal, S.; Bode, L.; Budak, C.; Chi, G.; Kawintiranon, K.; Padden, C.; Vanarsdall, R.; Vraga, E.; and Wang, Y. 2020. A first look at COVID-19 information and misinformation sharing on Twitter. arXiv preprint arXiv:2003.13907.
- Song et al. (2021) Song, X.; Petrak, J.; Jiang, Y.; Singh, I.; Maynard, D.; and Bontcheva, K. 2021. Classification aware neural topic model for COVID-19 disinformation categorisation. PloS one, 16(2): e0247086.
- Suarez-Lledo et al. (2022) Suarez-Lledo, V.; Ramos-Fiol, B.; Ortega-Martin, M.; Carretero-Bravo, J.; and Alvarez-Galvez, J. 2022. Use of Hashtags related to Covid-19 infodemics by bot accounts: Victor Suarez-Lledo. European Journal of Public Health, 32(Supplement_3): ckac131–172.
- van Stekelenburg et al. (2023) van Stekelenburg, B. C.; De Cauwer, H.; Barten, D. G.; and Mortelmans, L. J. 2023. Attacks on health care workers in historical pandemics and COVID-19. Disaster medicine and public health preparedness, 17: e309.
- Waheeb, Khan, and Shang (2022) Waheeb, S. A.; Khan, N. A.; and Shang, X. 2022. Topic Modeling and Sentiment Analysis of Online Education in the COVID-19 Era Using Social Networks Based Datasets. Electronics, 11(5): 715.
- WHO (2020) WHO. 2020. Novel Coronavirus(2019-nCoV) Situation Report—13. World Health Organization.
- WHO et al. (2020) WHO; UN; UNICEF; UNDP; UNESCO; UNAIDS; ITU; Pulse, U. G.; and IFRC. 2020. Managing the COVID-19 infodemic: Promoting healthy behaviours and mitigating the harm from misinformation and disinformation. https://www.who.int/news/item/23-09-2020-managing-the-covid-19-infodemic-promoting-healthy-behaviours-and-mitigating-the-harm-from-misinformation-and-disinformation. Accessed: 1 Dec 2020.
- Zhao et al. (2023) Zhao, S.; Hu, S.; Zhou, X.; Song, S.; Wang, Q.; Zheng, H.; Zhang, Y.; Hou, Z.; et al. 2023. The Prevalence, Features, Influencing Factors, and Solutions for COVID-19 Vaccine Misinformation: Systematic Review. JMIR Public Health and Surveillance, 9(1): e40201.