Clumpy Structures within the Turbulent Primordial Cloud
Abstract
The primordial clouds in the mini-halos hatch the first generation stars of the universe, which play a crucial role in cosmic evolution. In this paper, we investigate how the turbulence impacts the structure of primordial star-forming cloud. Previous cosmological simulations of the first star formation predicted a typical mass of around , which conflicts with recent observations of extremely metal-poor stars suggesting a lower mass scale of around . The discrepancy may arise from unresolved turbulence in the star-forming cloud, driven by primordial gas accretion during mini-halo formation in the previous simulation. To quantitatively examine the turbulence effect on the primordial cloud formation, we employ the adaptive mesh refinement code Enzo to model the gas cloud with primordial composition, including artificial-driven turbulence on the cloud scale and relevant gas physics. This artificial-driven turbulence utilizes a stochastic forcing model to mimic the unresolved turbulence inside mini-halos. Our results show that turbulence with high Mach number and compressional mode effectively fragments the cloud into several clumps, each with dense cores of that undergo Jeans instability to form stars. Fragmentation caused by intense and compressive turbulence prevents the runaway collapse of the cloud. The self-bound clumps with smaller masses in turbulent primordial cloud suggest a possible pathway to decrease the theoretical mass scale of first stars, further reconciling the mass discrepancy between simulations and observations.
keywords:
Cosmology – Turbulence – Hydrodynamics – Population III – Shocks – Early universe1 Introduction
Based on the pioneering cosmological simulations, the first generation of stars (Population III stars in Greif & Bromm 2006, Population III.1 stars in O’Shea et al. 2008; hereafter Pop III stars) have brought the early universe out of the “cosmic dark ages” by emitting the first light to the dark cosmos at redshift , roughly 50 million years after the Big Bang (see Larson & Bromm, 2001; Bromm et al., 2009; Bromm, 2013; Greif, 2015; Norman et al., 2018; Yoshida, 2019, for reviews). Furthermore, the Pop III stars synthesize the first heavy elements (metals) through nuclear burning in their stellar interior; later the metals are dispersed to the intergalactic medium (IGM) through supernova explosion, and they chemically enrich the pristine gas for nurturing the next star formation (SF) (Bromm et al., 2003; Yoshida et al., 2004; Iwamoto et al., 2005; Tominaga et al., 2007; Wise & Abel, 2008; Greif et al., 2010; Bromm & Yoshida, 2011; Chen et al., 2017b; Chiaki et al., 2018a; Abe et al., 2021a; Chen et al., 2022). The Pop III stars transform the simple early universe into the ever-increasingly complex status we observe today. Understanding the Pop III SF system in the primordial gas clouds will reveal the true nature of Pop III stars, which is the key to understanding the genesis of our universe and life.
After the Big Bang, small matter perturbations seeded by the inflation start to grow through gravitational instabilities and eventually form into the gravitationally bound structures so-called “dark matter (DM) mini-halos” with a virial mass around and a virial temperature of . Mini-halos amass the primordial gas and nurse the Pop III stars (Tegmark et al., 1997; Bromm et al., 2002; Yoshida et al., 2008). The primordial gas cloud is mainly made of , , and their derivatives (Tegmark et al., 1997; Yoshida et al., 2003, 2006) and likely contain tiny magnetic fields of (Wagstaff et al., 2014; Jedamzik & Saveliev, 2019; Sanati et al., 2020; McKee et al., 2020). Because of the absence of dust and metal inside the mini-halos, molecular hydrogen becomes the major coolant that remains effective at temperature below (see Stiavelli, 2009, chap.2), pre-determining a characteristic mass of the star-forming cloud. For a Pop III star-forming cloud, the mass fraction of could reach with gas density ; this condition allows the cloud to cool down to with a corresponding Jeans mass roughly equal to , and the cloud will undergo runaway collapse if its mass exceeds Jeans mass (Abel et al., 2002; Yoshida et al., 2003).
The direct observation of Pop III stars is far beyond the capability of our large telescopes; thus, the chemical abundance patterns from the observation of extremely metal-poor (EMP) stars, formed right after the first stars and their supernovae, have been used to probe the typical mass of Pop III stars via their supernova yields. The elemental abundance of the EMP stars implies that Pop III stars are of (Umeda & Nomoto, 2002, 2005; Joggerst et al., 2010; Ishigaki et al., 2018; Chen et al., 2017a; Chiaki et al., 2018b). However, the previous cosmological zoom-in simulations of Pop III SF propose that the mass function of the Pop III stars is top-heavy and broadly distributed in (Omukai & Palla, 2001; Norman, 2008; Hirano et al., 2014, 2015; Hosokawa et al., 2016; Stacy et al., 2016). Other researches argue that the fragmentation occurs at circumstellar dick scale and results in multiples or binaries with less massive Pop III stars (Stacy et al., 2010; Clark et al., 2011; Greif et al., 2011b; Susa, 2019; Wollenberg et al., 2020); here, we focus on the fragmentation at the primordial cloud scale induced by turbulence. We suspect that the turbulent flow in the primordial gas cloud at the mini-halo center is a missing piece of the discrepancy between observation and simulation; previous simulations simply treat the star-forming gas inside the halos as subsonic, and they are unable to resolve the cloud-scale turbulence inside the Pop III star-forming cloud. Based on Tseliakhovich & Hirata (2010); Greif et al. (2011a), supersonic flow streams left over from the recombination epoch can produce strong turbulence inside the mini-halos and alter the gas structure of their star-forming clouds. Turbulence provides additional pressure support to prevent the cloud from the catastrophic collapse and creates multiple high-density gas regions. Eventually, these less massive dense regions are likely to form Pop III stars with stellar masses which probably explain the EMP observations.
For the above-mentioned reasons, we believe that properly modelling the subtle turbulent gas structures in the Pop III star-forming cloud should release the tension between simulation and observation. Due to the tremendous dynamical range from the IGM down to the star-forming cloud, resolving the whole energy cascading process of the turbulence in any cosmological simulations is impossible currently. To examine the effect of turbulence in primordial cloud formation, we use a stochastic forcing model to simulate the unresolved turbulence driven by the in-flowing gas during the mini-halo formation. By manipulating the parameters of supersonic turbulence, we investigate the impact of different turbulence behaviors on the gas dynamics inside the mini-halos and discuss the potential consequent SF. Similar artificial turbulence approach has been used in the Smoothed-particle hydrodynamics (SPH) simulations of Pop III binary stellar systems by Riaz et al. (2018).
The structure of this paper is organized as follows. In Section 2, we first introduce the numerical methodology for simulating the turbulent primordial could. We describe the evolution of the clouds in Section 3; then we present their physical properties in Section4. In Section 5, we discuss the applications and limits of our simulations. Finally, we conclude our findings in Section 6.
2 Numerical Method
2.1 Adaptive Mesh Refinement Code Enzo
We use the grid-based, adaptive mesh refinement (AMR) code Enzo (O’Shea et al., 2004; Bryan et al., 2014) to model the formation of primordial gas cloud with turbulence. The AMR technique (Berger & Colella, 1989; Bryan, 1999; Norman & Bryan, 1999; Bryan & Norman, 2000) automatically increase the spatial resolution if the designated physical quantities, such as density and velocity, of the grids satisfy the refinement criteria. Enzo combines the N-body scheme (Hockney & Eastwood, 1988; Couchman, 1991) for the collisionless particles and the Eulerian method for fluid dynamics; it solves the compressible Euler equations by means of MUSCL-based method (Wang et al., 2008) and second-order Runge-Kutta scheme (Shu & Osher, 1988) for time integration. In this work, we use piecewise linear method (PLM; van Leer, 1979; Colella & Glaz, 1985) and Harten-Lax-van Leer solver (HLL solver; Toro, 2013) to solve the Riemann problem.
To modeling the Pop III SF cloud, we include the chemistry network of primordial gas involving nine main species: and (Anninos et al., 1997; Abel et al., 1997; Abel et al., 2002; Ripamonti & Abel, 2004; Turk et al., 2009). The gas cooling network considers collisional excitation and ionization, radiative recombination, free-free transition, etc., for atomic and ; moreover, it includes the cooling due to line, formation, and collision-induced emissions. The chemistry and cooling networks couple with the hydrodynamic equations self-consistently. Furthermore, the gas self-gravity is included by coupling the hydrodynamic equations with the gravitational potential calculated from the Poisson equation.
We utilize the stochastic forcing model developed by Schmidt et al. (2009). It generates the turbulence with a statistically isotropic stochastic force field, which accelerates the fluid on the large scales smoothly. This external force field has been written as stochastic differential equation in Fourier space with a small spread of forcing wave numbers; then the solution in space is included as source terms in the momentum and energy equations of hydrodynamics. The characteristic wave number of the force field is defined as . is the length of the box size, and in our simulations which means the energy injection scale is roughly half of the box size. Besides, the nonlinear subgrid-scale (SGS) model from Grete et al. (2017) is used to deal with the unresolved scales of turbulence.
2.2 Simulation Setup
We perform the 3D Enzo simulations on a Cartesian coordinate grid: , , , and the physical side length of the simulation box is 3 pc comparable to the size of central region of primordial clouds with masses: of and . The box is initially filled with the uniform primordial gas (76% H and 24% He by mass) of densities or and temperature 1000 K based on the previous cosmological simulations of Pop III SF (Greif et al., 2011b; Hirano et al., 2015). The root grid has cells with up to two levels of factor-two refinement (). The refinement criteria are based on the gas overdensity and Jeans length; the grid will be refined if gas density , or the number of the cells covered one Jeans length is less than 16. The finest grids have a spatial resolution of , which is roughly the size of proto-stellar envelope (); therefore, the physical processes of dense core formation () can be well resolved in our simulation.
2.2.1 Physical Scenario of Modelling the Turbulence in Primordial Gas
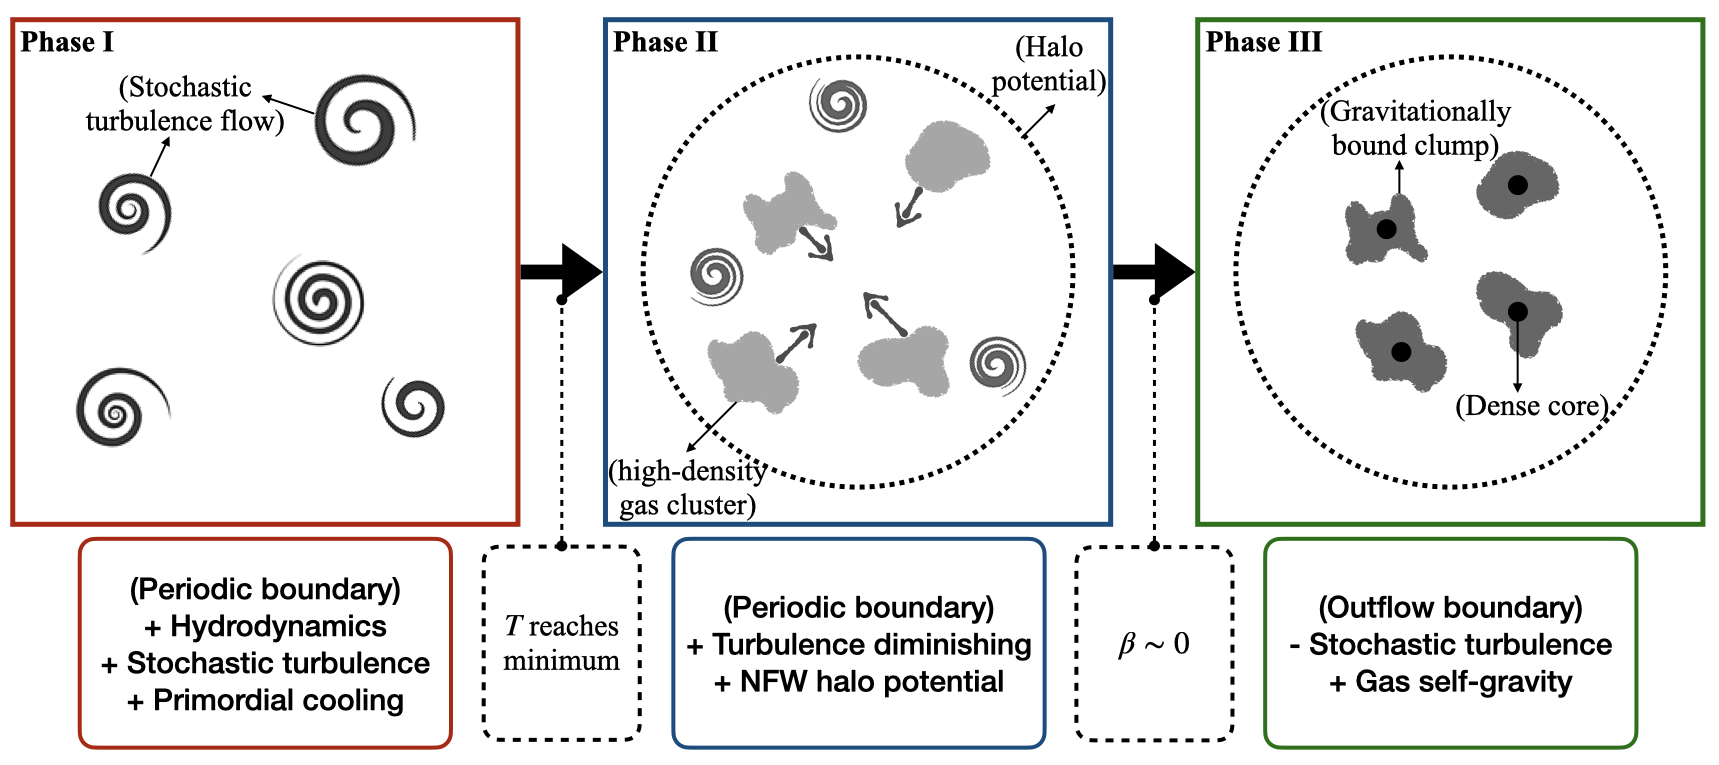
In our scenario, the primordial gas is accreted onto the halo center through the halo gravity during the assembly of DM mini-halos, and this process leads to the gravito-turbulence. The turbulence lasts until the turbulent primordial cloud becomes virialized. Then the cloud stops amassing the primordial gas, and the sub-halo turbulence commences diminishing. Meanwhile, cooling dissipates the thermal energy injected from turbulence so that gas self-gravity becomes dominant. After that, the high-density gas clusters shaped by the turbulence can grow into gravitationally bound structures that will host the Pop III SF. To realize the above scenario, we divide our simulation into three different phases which will be described in the following sections.
2.2.2 Phase I: Stochastic Turbulence Development
Resolving the turbulence of Pop III star-forming region from the galactic scale down to protostellar object is still beyond the envelope of modern cosmological simulations. Since we are interested in the inner region of primordial cloud of several pc, we adopt the stochastic method with periodic boundary on all sides of the simulation box to model the innermost region of mini-halo instead of evolving the turbulence cascade from the scale larger than halo. We define this early stage of simulation as Phase I. The original algorithm of stochastic turbulence in Enzo only considers the isothermal gas. We modify this algorithm applicable for the ideal gas with the primordial chemistry and cooling network. However, self-gravity is not compatible with stochastic force field in the current version of Enzo code. Thus, we assume that self-gravity is negligible under the existence of strong turbulence.
In this phase, stochastic turbulence stirs up the primordial gas in an isotropic way, and the associated gas chemistry and cooling coevolve with the turbulence development. Stochastic force field will shape the gas structure inside the primordial cloud. To explore the impact of turbulence on the primordial star-forming cloud, we select different combinations of two turbulence parameters in accordance with Schmidt et al. (2009) definition. First turbulence parameter is characteristic Mach number , where , is the characteristic velocity, and is the initial sound speed. The second turbulence parameter is which represents the ratio between the compressional and solenoidal components in the force field. The turbulent flow becomes more compressive as increases. The model names and their parameters are summarized in Table 1.
| Model | ||||||
|---|---|---|---|---|---|---|
| 2 | 2 | 3397 | 110 | |||
| 6041 | 97 | |||||
| 3 | 3397 | 100 | ||||
| 6041 | 97 | |||||
| 4 | 3397 | 100 | ||||
| 6041 | 97 | |||||
| 4 | 2 | 3397 | 110 | |||
| 6041 | 97 | |||||
| 3 | 3397 | 100 | ||||
| 6041 | 97 | |||||
| 4 | 3397 | 100 | ||||
| 6041 | 97 | |||||
| 8 | 2 | 3397 | 110 | |||
| 6041 | 97 | |||||
| 3 | 3397 | 100 | ||||
| 6041 | 97 | |||||
| 4 | 3397 | 100 | ||||
| 6041 | 97 |
2.2.3 Phase II: Turbulence Diminishing
Stochastic turbulence becomes dynamical equilibrium when the overall gas temperature reaches its minimum due to gas cooling. Then, we assume that turbulence starts to decay due to the halt of in-flowing gas and energy from the halo scale. Therefore, at this moment, we halve the characteristic Mach number every turnover time of the largest eddy , where and are the largest eddy size (0.5 ) and the root mean square velocity of the gas. We repeat this reduction procedure until drops to 1. Meanwhile, a fixed potential of DM mini-halo is induced; the corresponding virial mass and radius are based on cosmological simulations from Greif et al. (2011b, 2012). The gravitational potential well of mini-halos follows the NFW profile (Navarro et al., 1996, 1997),
| (1) |
where and are virial mass and virial radius of the halo, is the scale radius, and is the concentration parameter, which is 20 in this study. Halo potential is placed at the box center. The halo gravity amass the the turbulent gas into the halo center. The evolution of turbulence reduction with a halo gravity described above is named as Phase II.
2.2.4 Phase III: Dense Core Formation
We decrease the strength of driven turbulence until the dense gas is reaching a slowly collapsing state based on the virialization parameter, defined in (Wise et al., 2008),
| (2) |
where , , , and denote the thermal energy, kinetic energy, surface pressure work, and the gravitational potential energy, respectively. is the adiabatic index, which we adopt for the ideal monatomic gas in the calculation. Self-gravity will gradually become a dominating force in the system as turbulence diminishes at the later part of Phase II. Therefore, we include both the gravitational binding energy within the gas and DM potential energy acting on the gas are included in term to evaluate the instant virialization status of the cloud. When drops to zero, we shut down the stochastic force field and turn on the gas self-gravity, which becomes predominant force in the weakened turbulence and further grows the clumpy structures in the cloud. Besides, the boundary condition is changed from the periodic to outflow for simulating the collapsing cloud. We can call this final phase of simulation as Phase III.
During the Phase III simulation, the high-density gas clusters grow in mass and become gravitationally bound. If the maximum gas density in the simulation exceeds , the three-body reaction will rapidly convert most of the hydrogen atom into molecular form (Turk et al., 2011). Fully molecular gas can cool and condense rapidly; however, due to the limits of spacial resolution and missing small-scale microphysics, we fail to evolve our simulations further. Thus, we have to terminate the simulations when the maximum density reaches . Finally, we summarize the procedure of simulation including three major phases in Figure 1.
3 Evolution of the Turbulent Primordial Cloud
3.1 Chemical and Thermal Evolution
We first demonstrate the time evolution of the mass fraction (hereafter fraction) and mass-weighted temperature in Phase I in the left panel of Figure 2. As shown in the figure, fraction rapidly increases from zero to within the first million years after the simulation begins; then, the molecular hydrogen cooling effect becomes substantial. For models with the same , they have similar growing tracks of fraction. In general, the higher models can produce more fraction since they generate highly compressed flow and create denser gas regions which favor fraction formation. For the fixed models with different , the deviation among evolutionary tracks becomes more significant as increases. Our results suggest that formation is more sensitive to than . However, unlike the growing evolutionary tracks in and 4, those in fluctuate at the late time due to the collisonal dissociation of by free electrons (Abel et al., 1997),
| (3) |
While the stochastic turbulence evolves, the driven eddies inject kinetic energy into the primordial clouds. Then part of gas kinetic energy converts to the thermal energy by compressing the fluid; subsequently, it leads to the increment of gas density, temperature, and . As shown in the right panel of Figure 2, temperatures increase from 1000 to within the first million years after the simulation begins. After the gas temperatures reach their peaks, they start to drop due to the enhanced cooling and finally cool down to an equilibrium ( in models). Similar to the fraction evolutionary tracks, the temperature tracks in the fixed models are similar. However, temperatures in models vary largely at the late time and remain , which is higher than the equilibrium temperatures of other models. Because strong turbulence in models keeps pumping energy into the cloud over the amount that it can dissipate. Despite the temperature fluctuation in models, we select the snapshot of roughly as the starting point of the Phase II simulation.
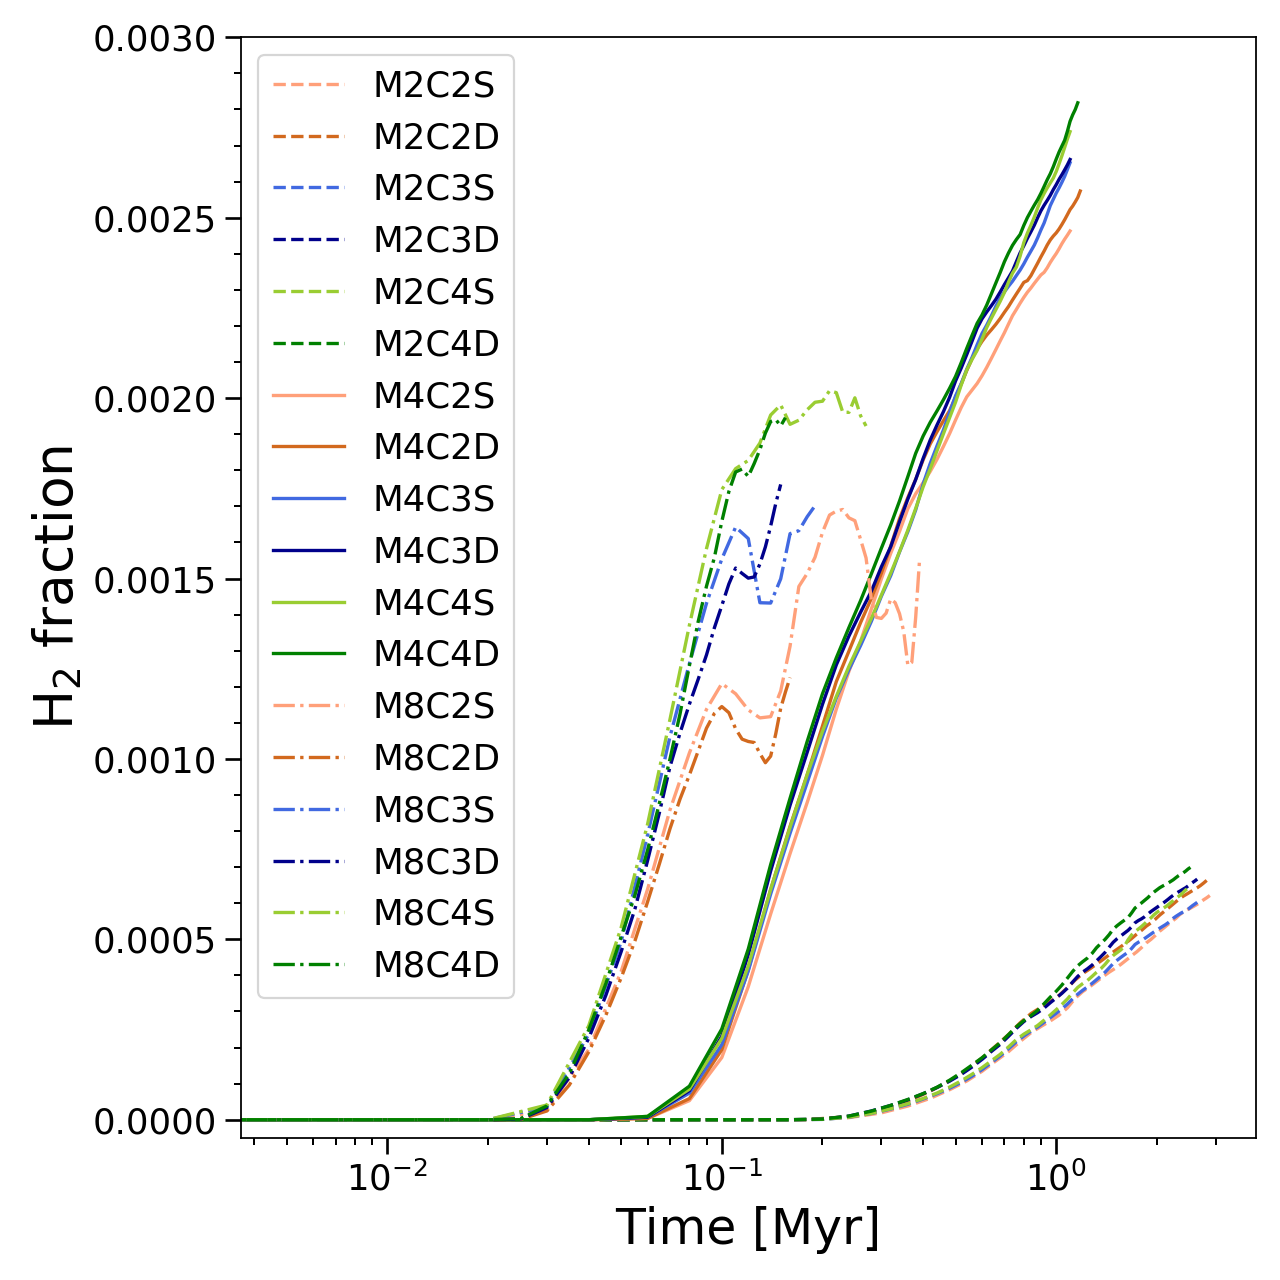
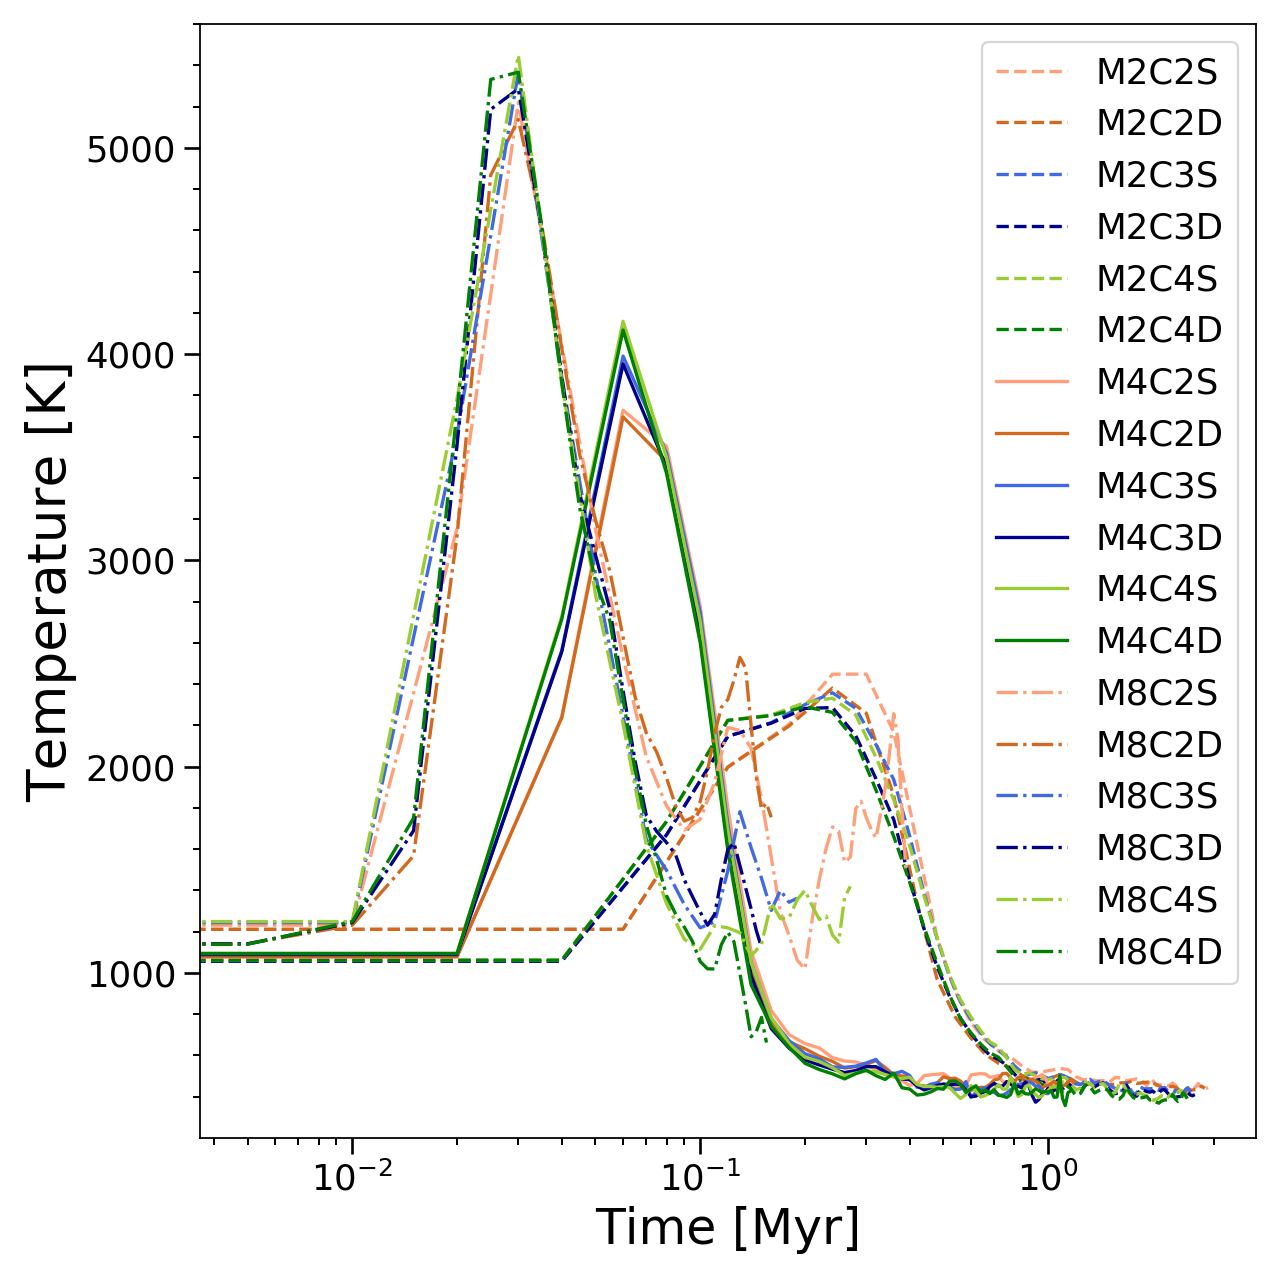
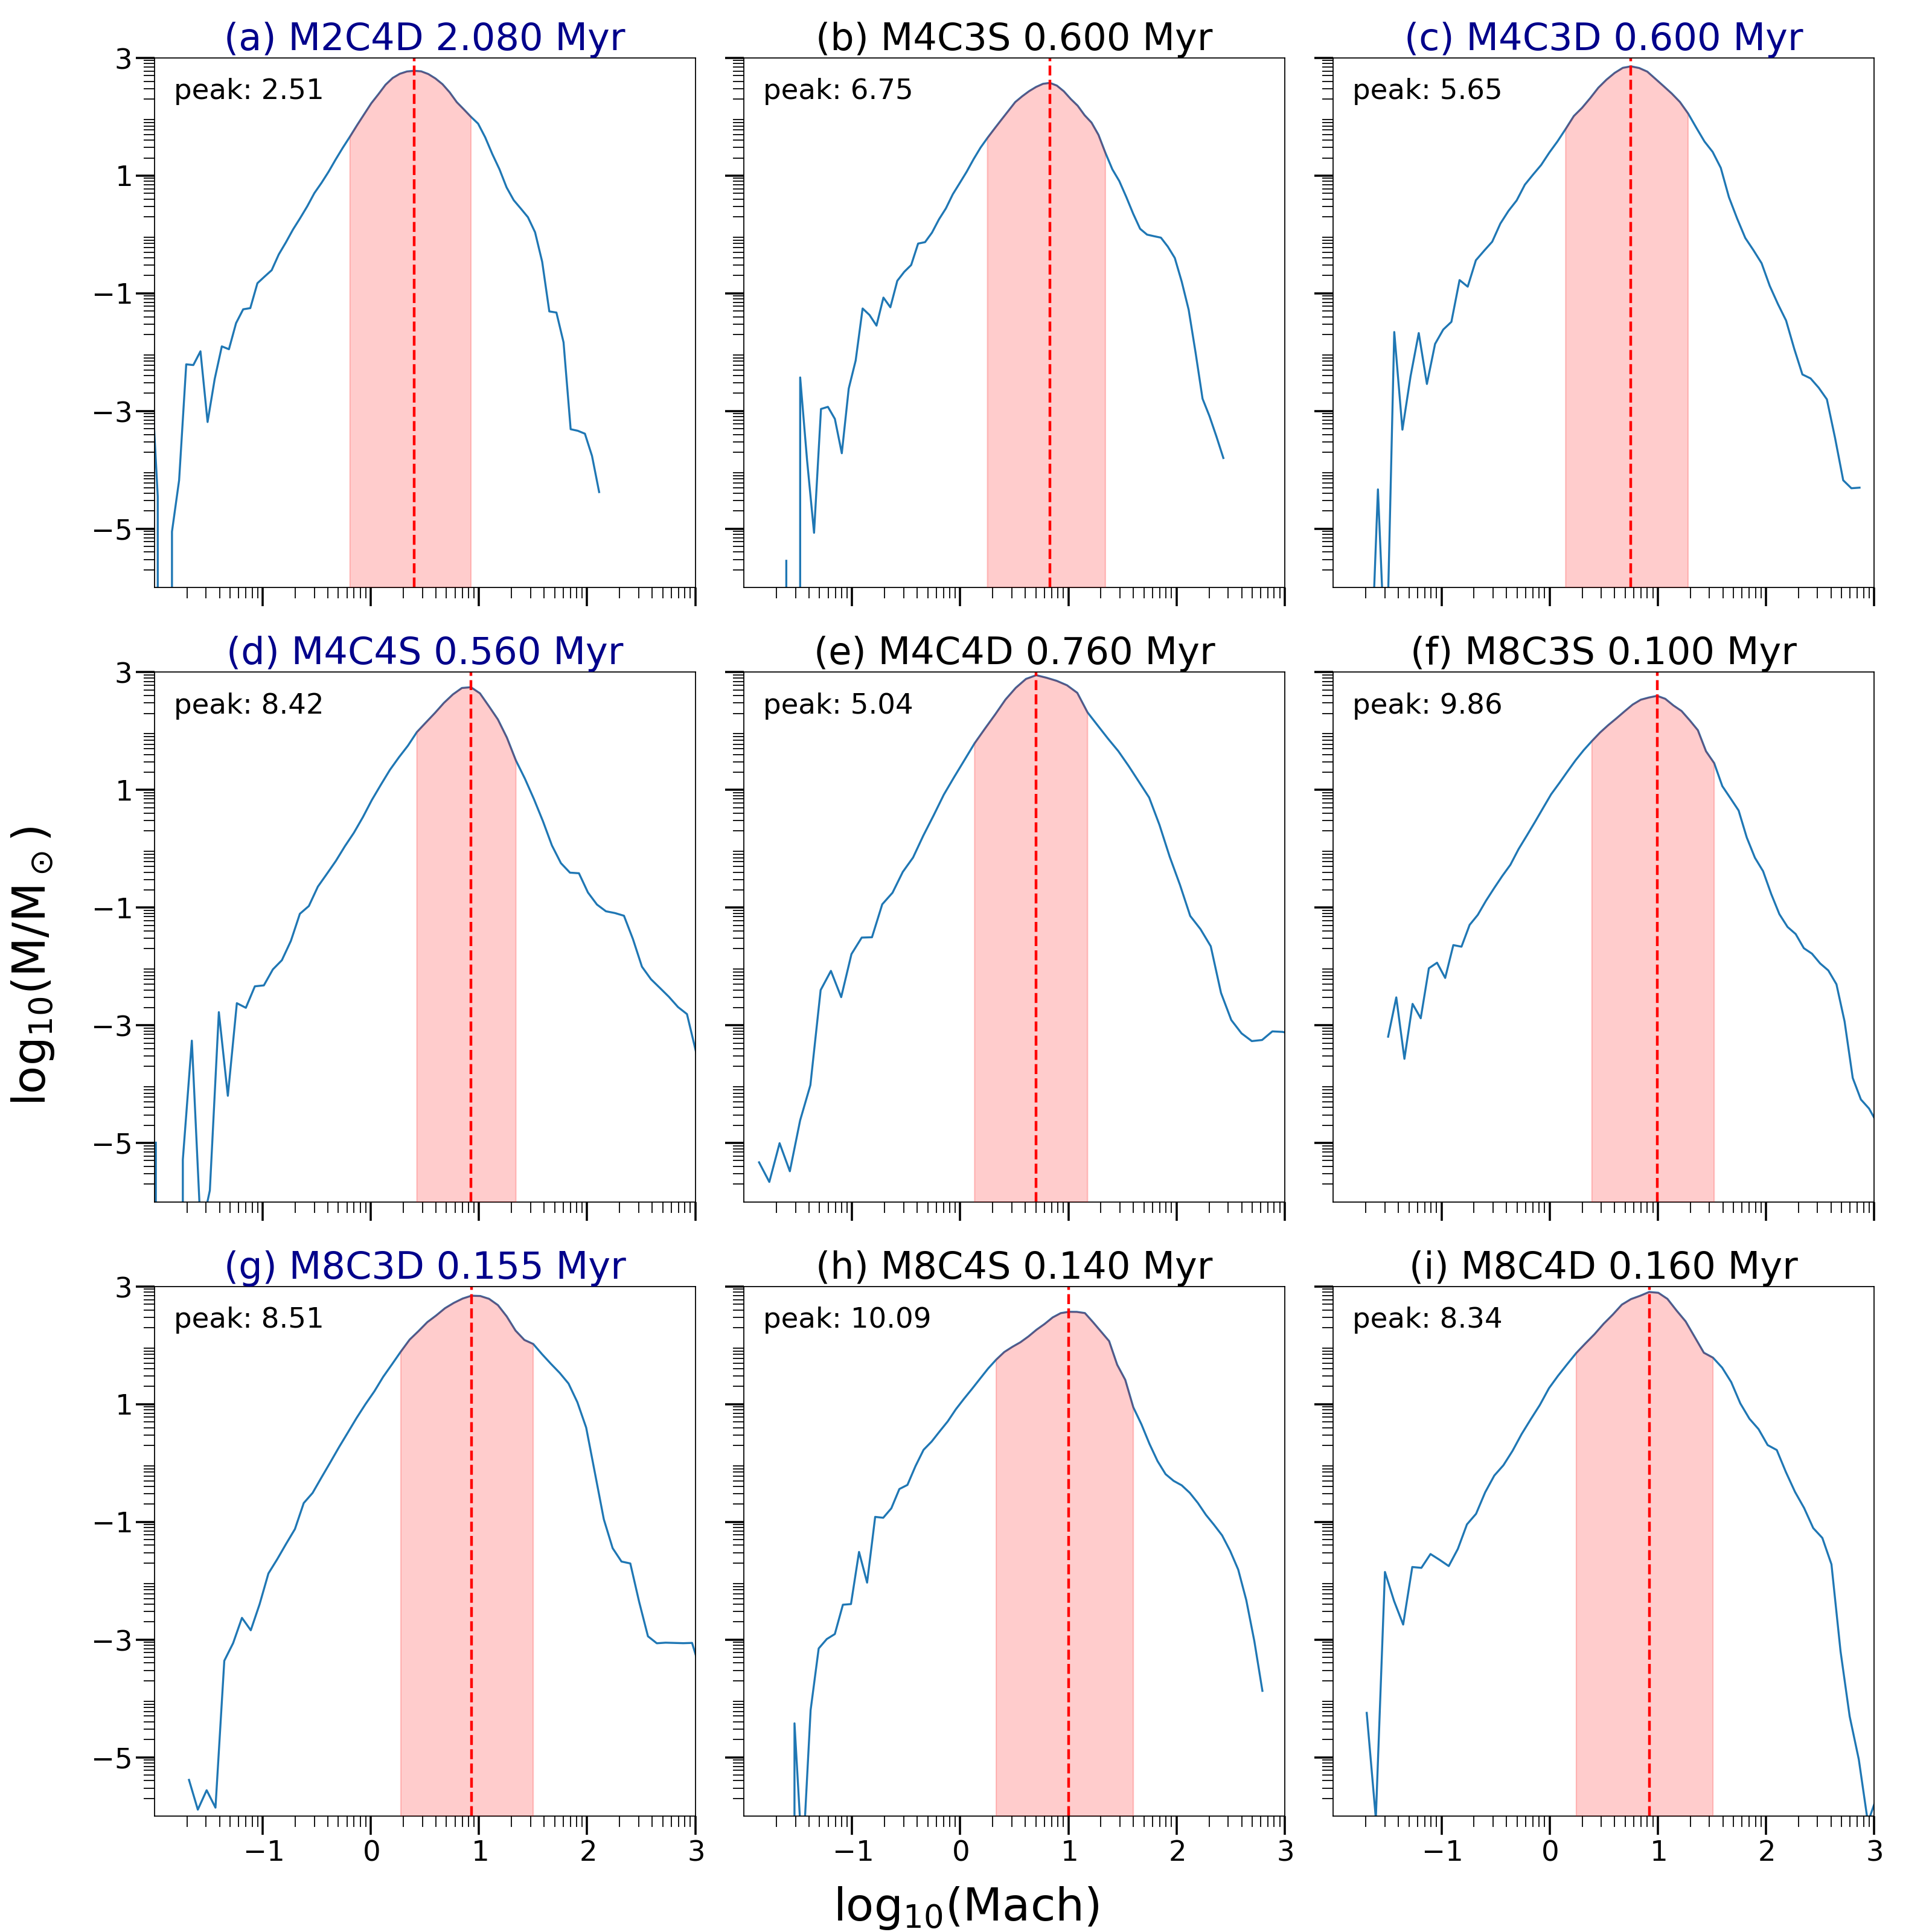
Figure 3 shows the gas mass distribution as a function of Mach number at the end of the Phase I simulation. Since our turbulence system is non-isothermal, the gas temperature in the simulation domain can range from 10 to K and causes the Mach numbers of the gas flow spread from 0.1 (subsonic) to several hundreds (hypersonic). Nevertheless, the Mach number of gas in each model remains close to the characteristic we assign. The gas with extremely high and low Mach numbers is by mass.
3.2 Virialization of the Cloud
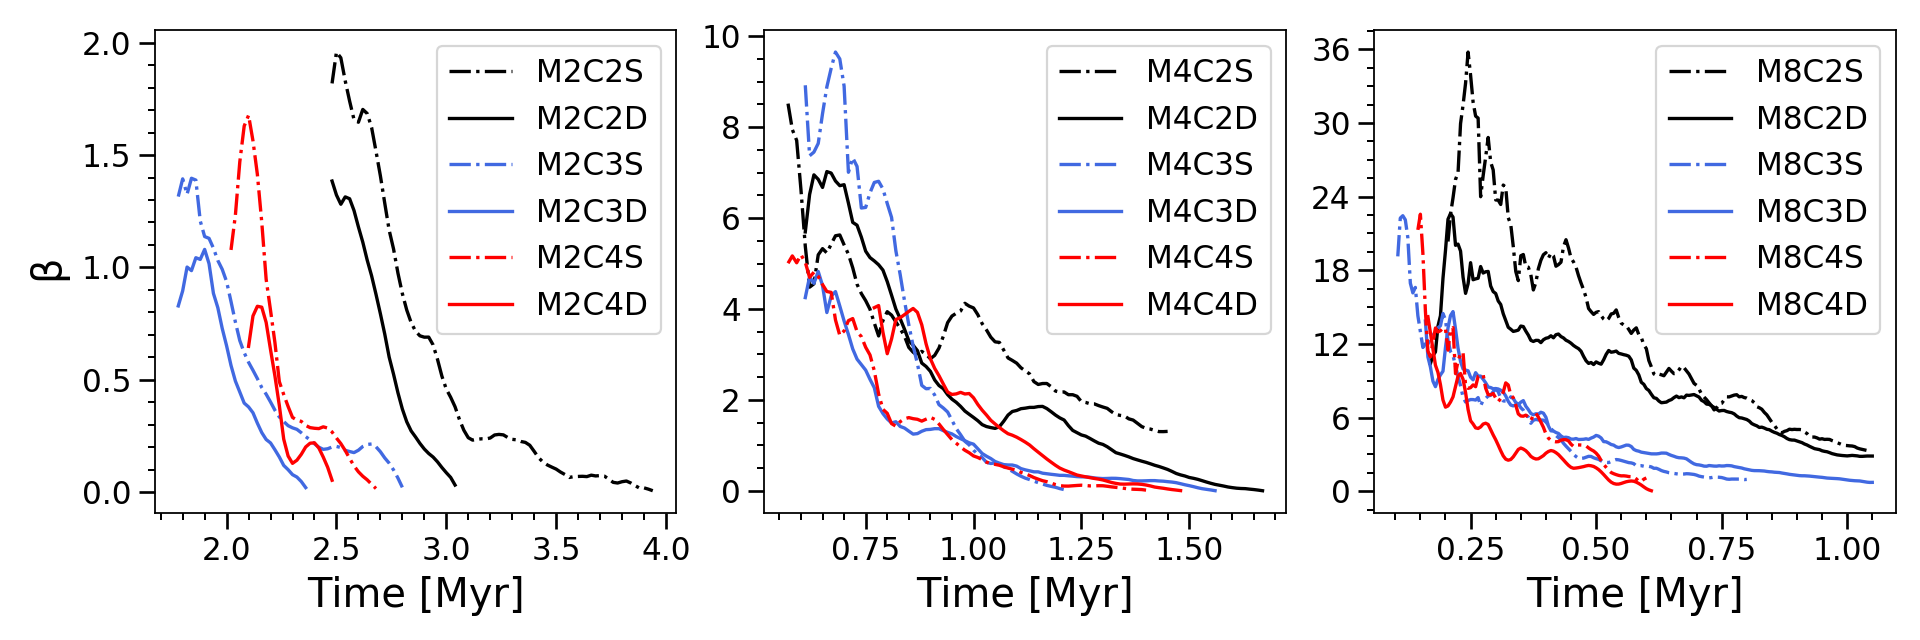
We show the evolution of virialization parameter of Phase II simulationin in Figure 4. Overall, declines as we gradually reduce the strength of the stochastic forcing field. In the beginning of this phase, higher models have larger because of a stronger driving force and energy injection. After forms in the high-density region shaped by the turbulence, part of turbulence then starts to dissipate through cooling, and the drops to zero except for the models with high but low . Higher cloud has more energy injection but a less efficient cooling as we discussed in Section 3, and tends to be against global collapse. The less compressive turbulence in lower models form a relatively sparse gas configuration. As the result, strong turbulence is responsible for the larger and in , and weak compression causes a smaller and inefficient cooling. Therefore, in these models fails to drop below 0.
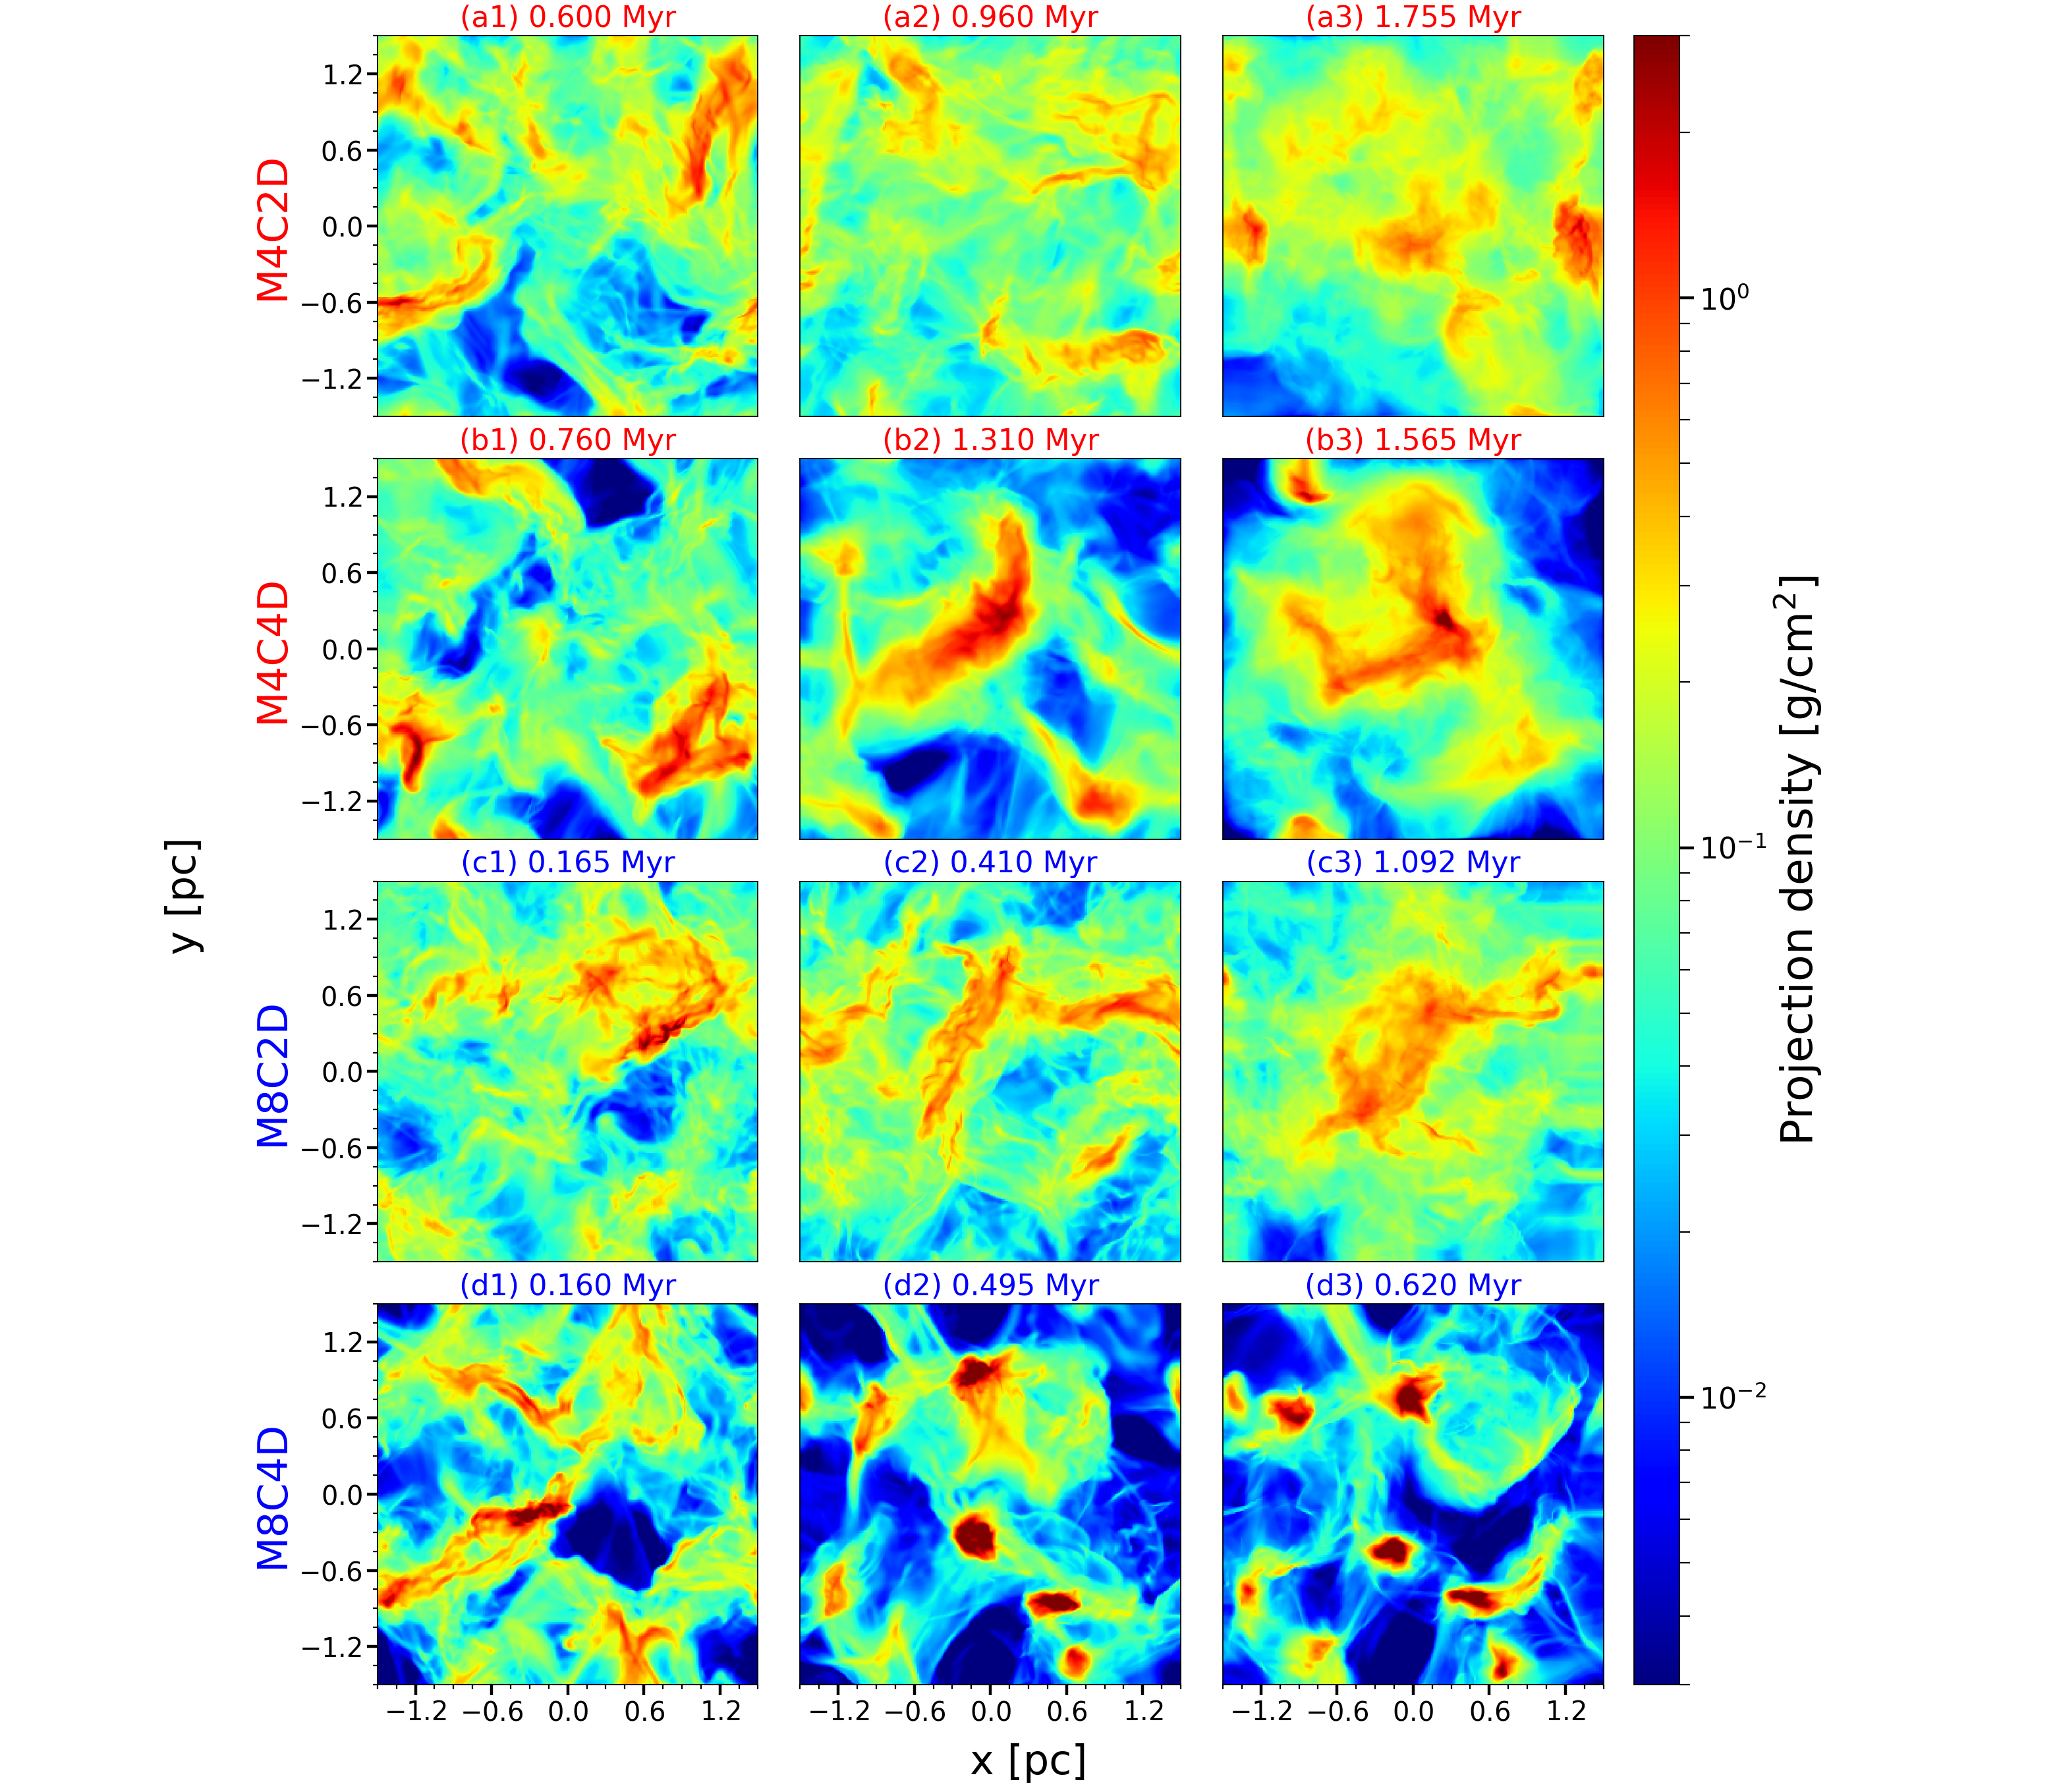
To visualize the gas structure evolution, we show the spatial distributions of projection gas density (column density) in Figure 5. At the end of the Phase I simulation (column 1 in the figure), turbulent flow is developed in a relatively isotropic configuration due to the nature of the stochastic forcing field. After the decay of turbulence and the gravitational pull of DM halo potential in Phase II (column 2), gas flow starts to concentrate around the central region. Meanwhile, clumpy structures form in the turbulent clouds. Eventually, some compact regions become Jeans unstable and further collapse into high-density objects in the Phase III as shown in the third column.
4 Clumpy Structures in the Turbulence
In the following sections, we analyze the physical parameters of the turbulent Pop III primordial clouds to investigate the criteria for forming the dense clumpy structures, the candidates of the Pop III star-forming sites. Then we study the physical properties of the gravitationally bound clumps formed in the simulations by illuminating the chemi-thermal composition and the developing history of the clumps. Finally, we define dense cores from collapsing clumps and discuss their possible outcomes of SF.
4.1 Turbulence Effect
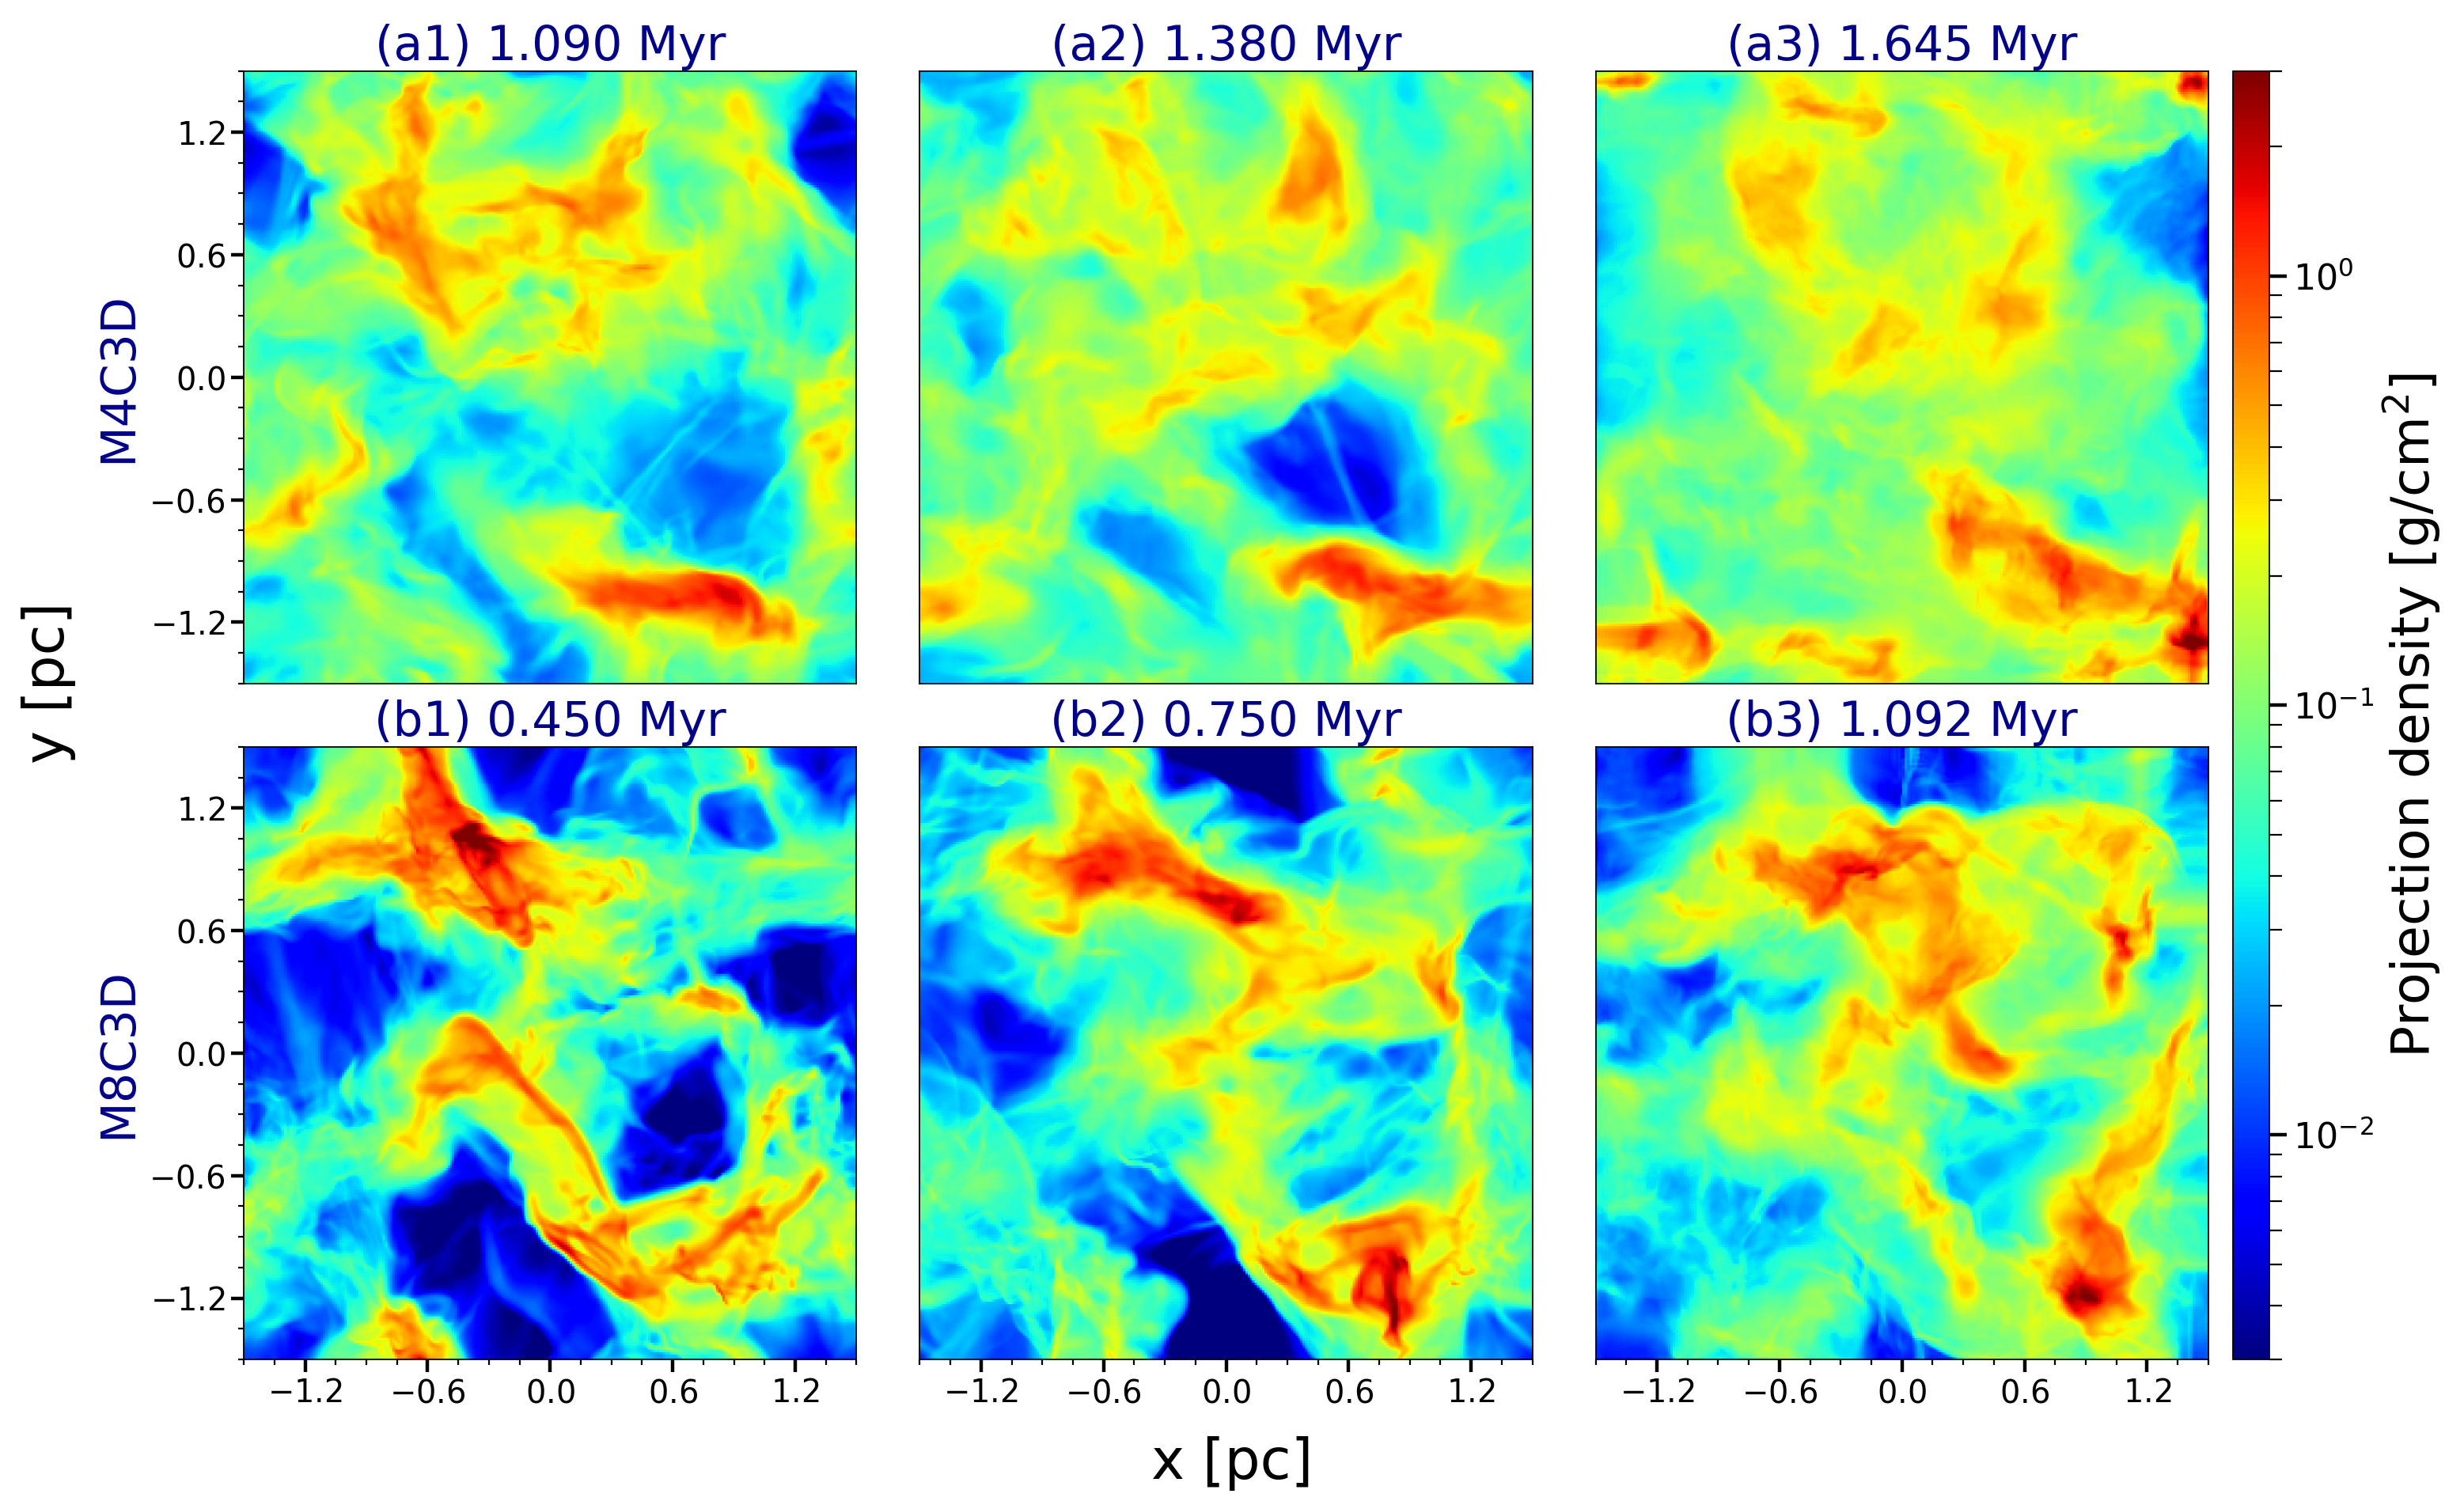
To examine the effect of turbulence properties on the gas structure, we first compare the projection density plots between different models in Figure 5. In Phase I (column 1 in the figure), the gas configurations seem similar; whereas higher clouds are more structured by showing more relatively low-density areas (blue areas in the plots). After turbulence diminishes (column 2), only the dense regions in clouds grow in density (row b and d); on the other hand, in models, preceding high-density objects become diffusive as the turbulence strength decreases. Several local gas clusters with relatively high density have been formed exclusively in high and models such as . In Phase III (column 3), self-gravity of gas is the dominating force in the evolution of gas clusters, and it further solidifies these high-density structures in . However, the high-density gas clusters can hardly form in (row a and c).
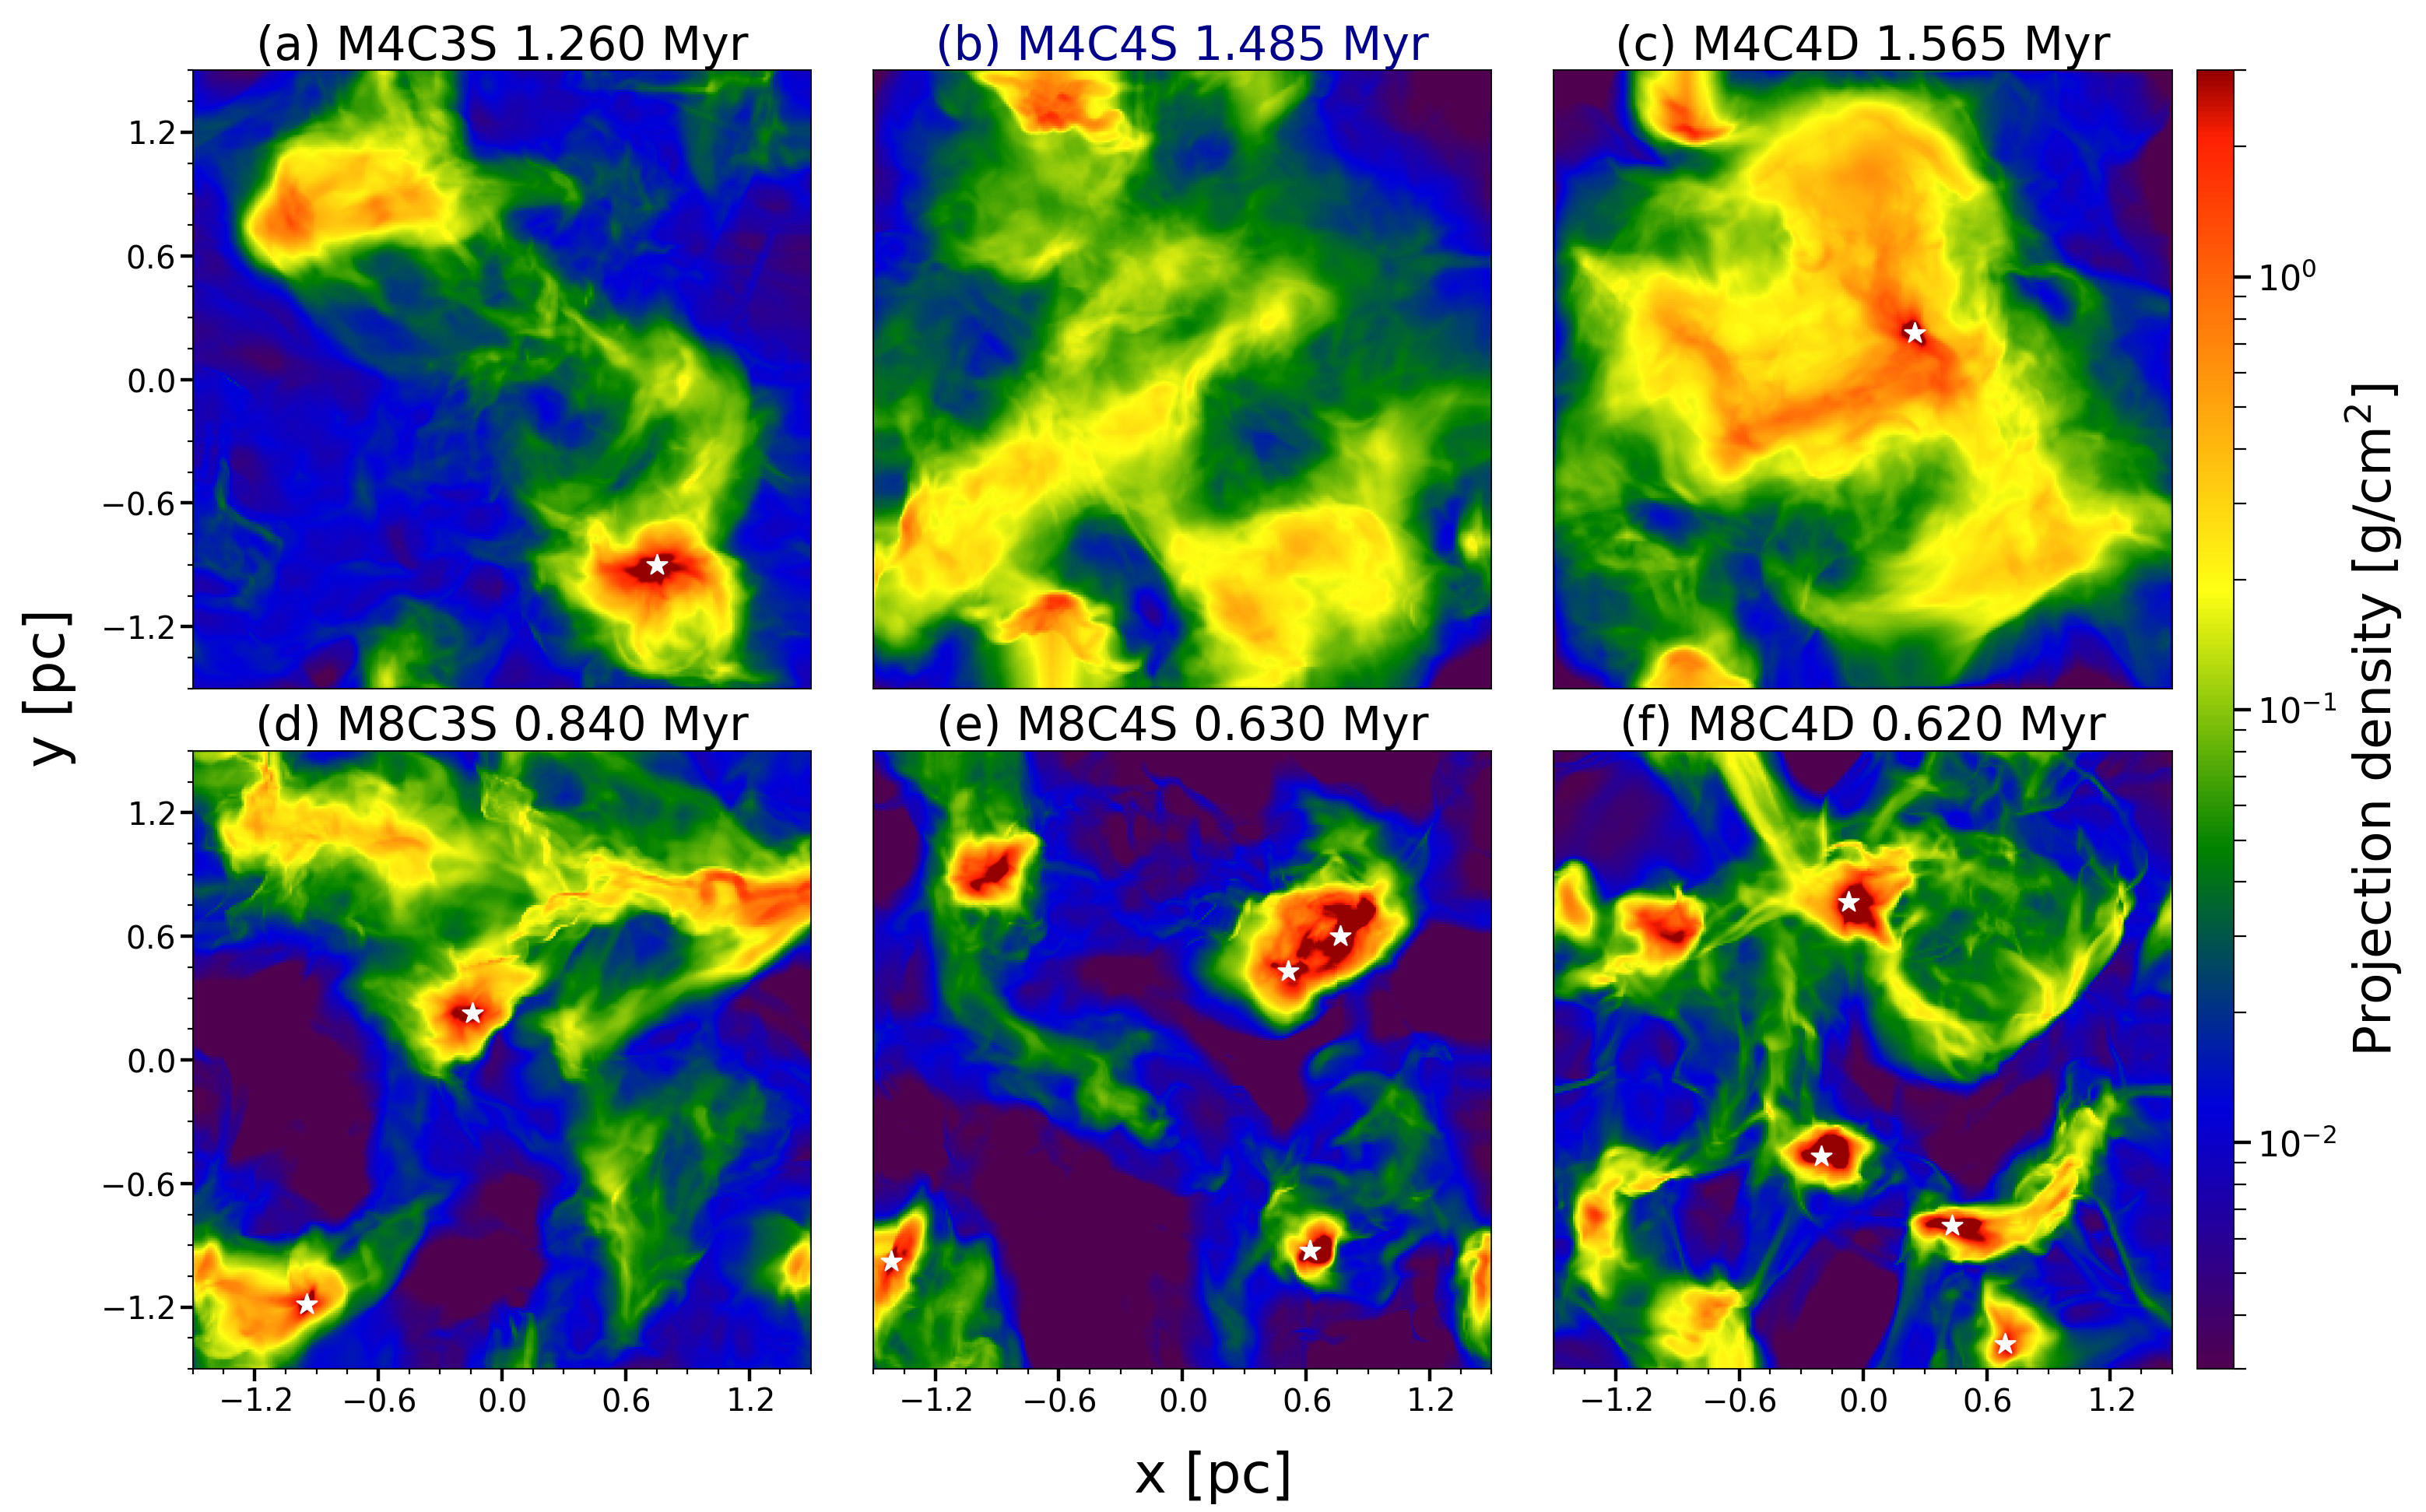
We present the density projection for models which have formed gravitationally bound clumps (GBCs or clumps in short) at the end of the entire simulation in Figure 6. Each GBC consists of at least one dense core (star mark in the figure), which will be discussed in Section 4.3. For three models, two of them form a single clump in the gas cloud; in contrast, three models create clumps. Besides, extensive fragmentary structure is found in high cases. An unique clump in contains two dense cores, and it implies that clump fragmentation can occur in strong turbulence (). We show the correlation between the number of GBCs and the turbulence properties in the left panel of Figure 7. Our results suggest that the number of GBCs positively correlates with the and of turbulence. Moreover, no GBC can form in weak () or low compressional () turbulence. In other words, strong and highly compressive turbulence likely reshapes a single cloud into clumps of smaller masses.
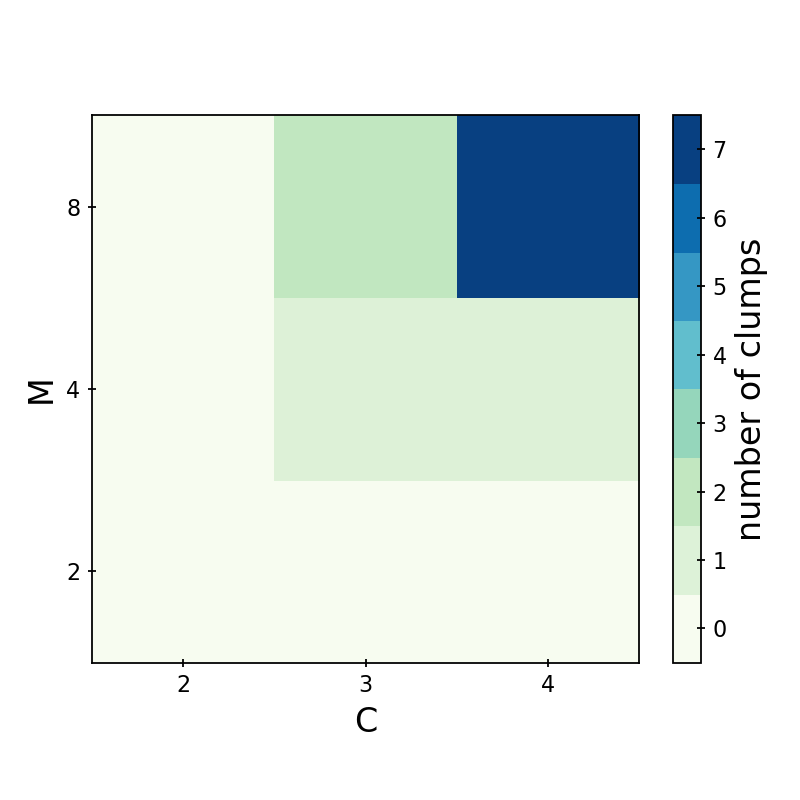
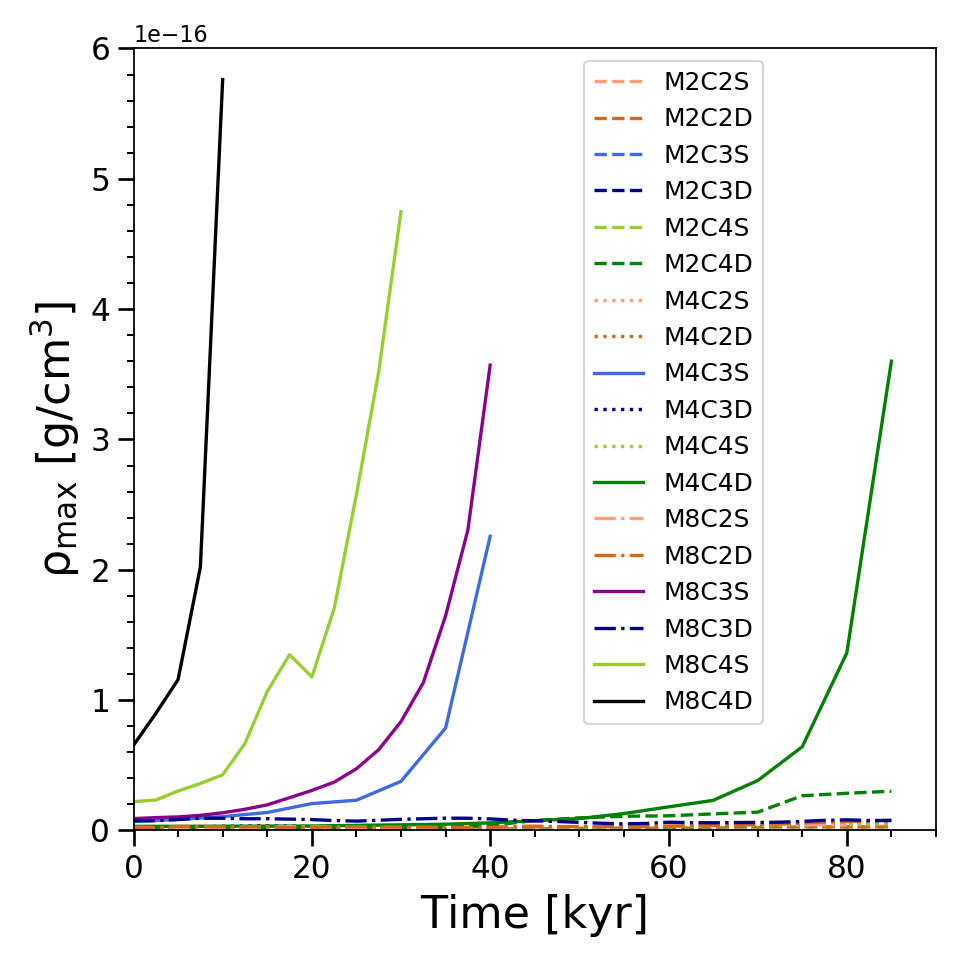
The evolution of the maximum gas density in the Phase III simulations is shown in the right panel of Figure 7. Overall, only models with and can fulfill the density threshold and form GBCs. However, high and are the necessary but insufficient conditions to the GBC formation. Once gas self-gravity is activated in this phase, maximum densities in models contained GBCs increase rapidly due to the collapse of densest structure in GBCs. The densest regions in and have become Jeans unstable and collapse momentarily. Turbulence in these models has compressed part of the cloud into an over-dense state predominated by self-gravity. For , , and , clumps continue growing in mass and follow the collapse of their dense cores.
Previously, we have mentioned that and are the necessary but insufficient conditions to form GBCs. Our results imply that only the models with strong and highly compressive turbulence ( and ) can seed clumps in both mass scales ( and ). On the other hand, three models–, , and –fail to form GBCs, but their either low or high mass counterpart models (, , and ) do. Therefore, the GBC formation is insensitive to the overall cloud mass. In Figure 8, we follow the evolution of and . No significant gas accretion occurs in the Phase II (panel a1 and a2) in . Although part of gas does assemble at the boundaries of the simulation box after the self-gravity activate, these gas clusters are not massive enough to reach Jeans unstable and forge SF. In model , high-density gas clusters (upper left corner of panel b1) have formed at the early stage; however, they are destroyed later by stochastic turbulence. Other high-density gas clusters form in lower right corner in panel b2, but they fail to evolve into gravitationally bound structures till the end. In summary, turbulence has both positive and negative impacts on GBC formation due to its nature of randomness; in weaker and lower compressional turbulence ( and ), the destruction effect could become stronger than the compression effect and inhibit the GBC formation.
4.2 Clumps’ Properties
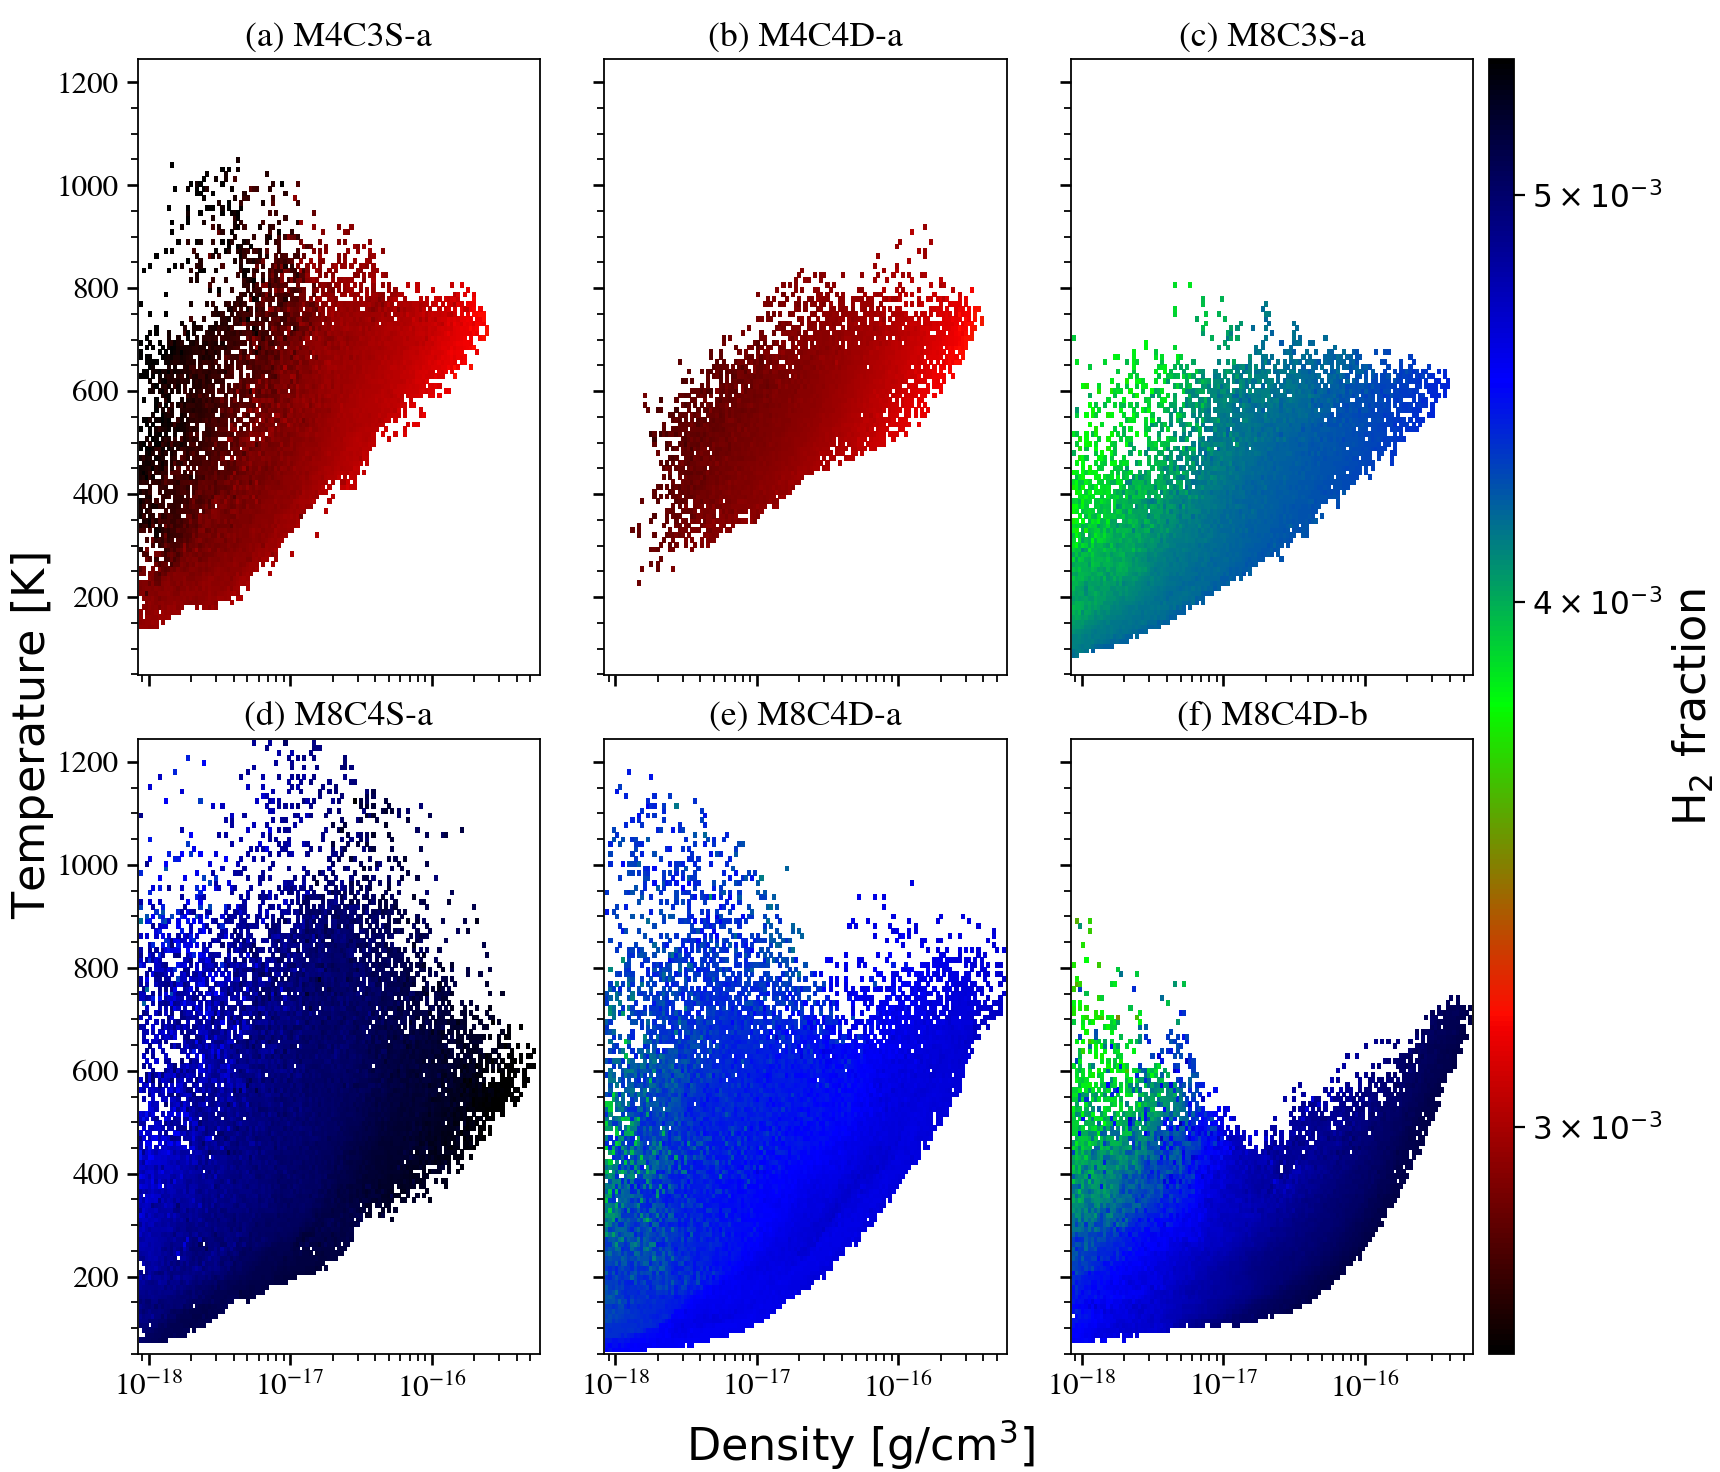
We show the temperature-density- phase diagram of the clumps in Figure 9. In general, the distribution of similar molecular hydrogen fractions in the diagram has a diagonal trend from lower-left to upper-right. Since the cooling rate is proportional to fraction, mass contraction leads to temperature and density growth under the same cooling efficiency. That the gas with higher fraction distributes across the lower right corner implies that denser gas can cool down the temperature due to more efficient cooling. The clumps in stronger and higher compressional turbulence have a greater overall fraction, which agrees with the result of the entire gas system we discussed in Section 3.1. Besides, the clumps in models of can even cool to below 100 K. Although these six clumps shown in Figure 9 contain the densest objects in their simulations, the variation of molecular hydrogen fraction is smaller than a factor of two despite two times difference in . A similar comparison to and 2 models, their molecular hydrogen fractions deviate roughly a factor of ten. The bottleneck of the molecular hydrogen fraction growth suggests that turbulence has reached its limitation in catalyzing formation. Gas self-gravity is required to further condense the clump and trigger the rapid three-body reaction of hydrogen. However, such a high density region is beyond the capability of our simulation, we thus stop the simulation when the maximum density of clumps exceeds .
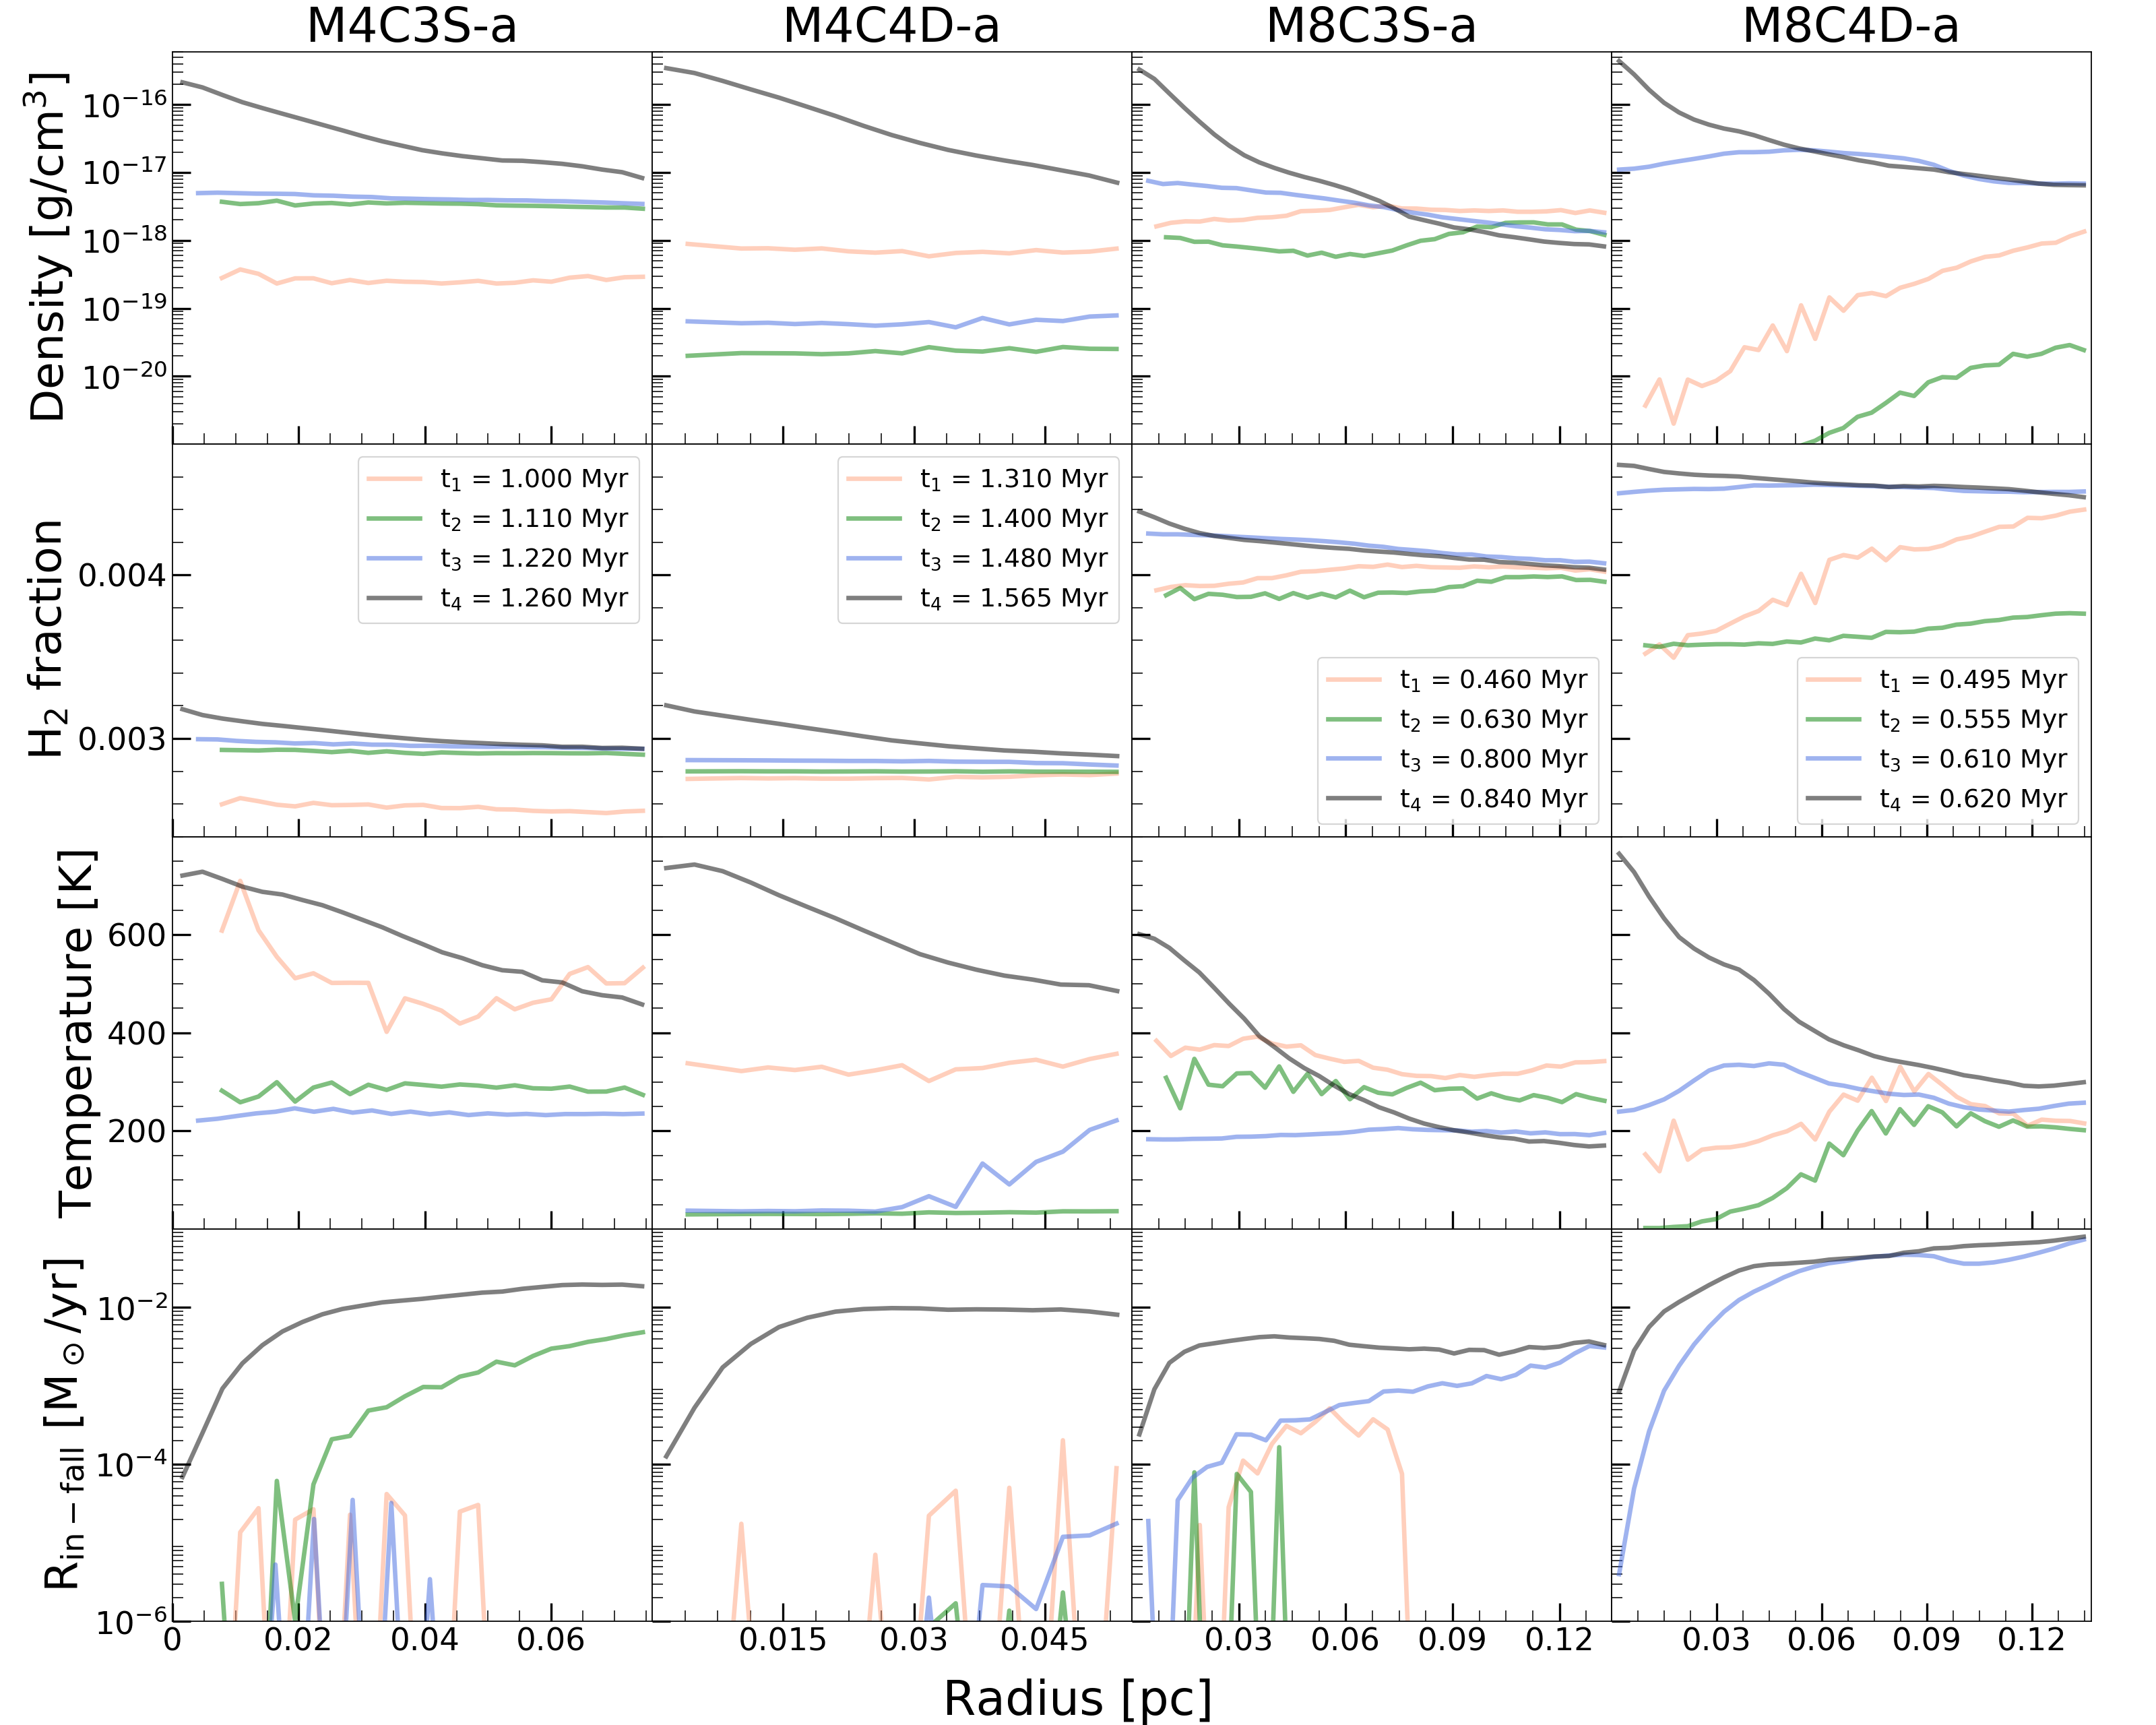
To investigate the physical properties of the GBCs, we approximate the clumps as a sphere centered at its maximum density and calculate their 1D radial profiles of density, fraction, temperature, and in-fall rate at different evolution times in Figure 10. At the final snapshot (, black lines), density and chemi-thermal configurations are similar among these clumps’ inner region; all of them have a relatively hot and dense structure with little increment in fraction. In , the density and temperature change significantly from the Phase II to Phase III simulation; in contrast, clumps of have a similar outer radial profile between the end of the Phase II and Phase III simulation ( and ). It suggests that turbulence fails to generate a clump scale ( 0.1 pc) structure without gas self-gravity, but such structure can be shaped by a stronger turbulence (). Nevertheless, gas self-gravity is necessary to form a dense core of 0.05 pc where the gravity dominates over gas pressure. The fraction profile changes slightly over time, which means it has saturated under the turbulent flow without gas self-gravity.
Here, the in-fall rate of the clump is defined as
| (4) |
where is gas density, and is radial velocity toward the center. Similar to density and temperature structure, the prototype of the final configuration of has already emerged at the end of Phase II () only in . As a GBC is created at the end of the simulations, the in-fall rate has also appeared in the pattern increased with radius but saturated at the outer part, and this curve implies the collapsing clump. Inside the clump, that in-fall rate drops significantly indicates an accumulating object forms at the center. The radius of a dense core is defined as the radius where in-fall rate starts to decrease substantially in the clump.
4.3 Dense Cores
Based on the in-fall rate curve at the end of the simulations, we identify the dense cores of GBCs and list their properties in Table 2; we discuss the possible stellar mass formed within these cores in Section 5.2. Among the cores with the densest center in each case, that the cores in higher and turbulence have higher maximum density means depends on the turbulence compressibility. In our models, the core mass can range from 22.7 to 174.9 . Higher and turbulence generates more cores with various masses and naturally create both low and high mass cores due to different scales of convergent flows.
By assuming core as a rigid body, we can estimate the rotational velocity roughly 2 . For most of the cores, the ratio of the rotational velocity to its Kepler velocity is lower than 0.8 except -. Generally, suggests the rotating structure can be bound by gravity. The core of - has implying that the centrifugal force will break this core and create fragmentation.
| Model | Core | |||||||
| a | 2.420 | (0.8,-0.9,-0.2) | 0.027 | 80.7 | 9.589 | 3.051 | 0.159 | |
| a | 3.773 | (0.3,0.2,-0.5) | 0.018 | 52.1 | 7.414 | 3.354 | 0.413 | |
| a | 3.841 | (-0.9,-1.2,-0.1) | 0.019 | 46.1 | 3.288 | 2.555 | 0.368 | |
| b | 4.333 | (-0.1,0.2,-0.1) | 0.048 | 94.5 | 9.018 | 1.402 | 0.433 | |
| a | 5.077 | (0.8,0.6,-1.4) | 0.035 | 112.2 | 6.874 | 2.768 | 0.773 | |
| b | 1.458 | (0.6,-0.9,-0.3) | 0.027 | 48.7 | 6.454 | 4.821 | 0.536 | |
| c | 1.252 | (0.5,0.4,-1.2) | 0.058 | 80.1 | 5.565 | 5.126 | 1.844 | |
| d | 7.347 | (-1.4,-1.0,0.9) | 0.038 | 40.1 | 7.180 | 1.835 | 0.230 | |
| a | 5.862 | (-0.2,-0.5,0.8) | 0.036 | 174.9 | 2.963 | 2.226 | 0.315 | |
| b | 5.836 | (0.4,-0.8,-0.2) | 0.022 | 102.1 | 2.391 | 9.523 | 0.387 | |
| c | 5.717 | (-0.1,0.8,-0.4) | 0.036 | 46.6 | 4.432 | 6.448 | 0.663 | |
| d | 2.082 | (0.7,-1.4,1.0) | 0.032 | 22.7 | 9.108 | 1.144 | 0.368 |
5 Discussions
5.1 Summary of the Turbulent Primordial Cloud Model
In the Phase I simulation, uniform primordial cloud is stirred by the stochastic forcing field. While turbulent structure gradually develops, the fraction grows to , and the gas temperature reaches a maximum value. Then fraction keeps increasing to , and the temperature attains a minimum equilibrium through molecular hydrogen cooling. Most of the gas have Mach number distributed around the corresponding of the model. When the turbulence becomes fully developed, we place a DM halo potential and weaken the driven force of turbulence as the simulation enters Phase II. Eventually, the virialization parameter of gas system drops to at the end of Phase II. The gas distribution evolve from an isotropic configuration to a central-contracted structure due to the gravitational potential well of halo. After the stochastic turbulence is removed in the beginning of Phase III, the gas self-gravity becomes the dominating force in determining the gas dynamics on the scale 0.1 pc; the small-scale gas accretion due to the self-gravity not only collapses the existing GBCs to form dense cores at the center but also condenses the relatively less compact gas clusters to grow and generate dense cores as well. Besides, the rotation of dense cores could affect the follow-up Pop III SF (Ekström et al., 2008; Yoon et al., 2012; Stacy et al., 2013).
Weak () or less compressive () turbulence cannot produce any GBCs after removing the external force field. Turbulence with and form GBCs that further grow into dense cores at the end of simulations. However, intermediate turbulence with or generate either one clump or no clump due to the randomness nature of stochastic forcing turbulence. In the models which have formed clumps, they create only a single dense core in the primordial cloud. Meanwhile, can form multiple dense cores with various core mass; besides, the higher can increase the number of clumps.
5.2 From Dense Core to Stellar Mass
The ultimate goal of our simulation is to find out the Pop III stellar mass. Under the limitation of our simulation, however, dense cores derived from the in-fall rate are the smallest high-density objects we can achieve. These cores can not be properly evolved further in our current simulations due to the lack of small-scale () physics and finer spatial resolution. Instead, we infer the possible stellar mass by assuming the mass function of the stars resembles the core mass function (CMF) based on the result of Guszejnov & Hopkins (2015). Consequently, the profiles of CMF and initial mass function (IMF) are similar except a 1/3 shift of the peak value. Therefore, we divide the mass of cores by a factor of three to obtain the expected stellar mass range of . This mass range agrees with the typical Pop III stellar mass inferred from the EMP stars observation (Susa et al., 2014; Ishigaki et al., 2018).
On the other hand, different from the EMP star observation, Abe et al. (2021b); Chen et al. (2022) suggests another method to probe the Pop III IMF through the first supernovae and galaxies, potentially observable targets to the James Webb Space Telescope (JWST). In sum, the forthcoming JWST observations of the early universe will shed light on the formation of Pop III stars.
5.3 Formation of Very Massive Pop III stars
In our or low models, they can not produce adequate high-density regions on the small scale, but the turbulent motion prevents the direct collapse of the cloud. Accordingly, weak or less compressive turbulence fails to fragment the cloud into smaller dense substructures. Nevertheless, as the cooling mechanism releases turbulence energy, the primordial cloud may undergo a large-scale collapse similar to the previous cosmological simulations, resulting in much massive Pop III stars over . Therefore, turbulence nature can alter the typical stellar mass in a mini-halo, bridging the low-mass and high-mass end of Pop III stars.
5.4 Further Improvement for the Current Model
So far we have examined the impact of different turbulence on the primordial cloud through an artificial driven turbulence. However, the turbulence structure is not self-consistently generated. Thus, simulating a gravitational-driven turbulence during mini-halos formation may probe the nature of turbulence in the Pop III SF cloud.
Our simulation stops at since we have not included all the relevant small-scale physics and finer spatial resolution. If the simulation keeps evolving the dense core, a fully molecular core will rapidly form via three-body reaction and become optically thick; finally, it leads to one or multiple proto-stellar cores. The gas in the core will be accreted onto the proto-star through proto-stellar disk, and the radiative feedback determines the subsequent accretion. Although there are studies suggest that magnetic filed can suppress the low-mass Pop III SF (Sharda et al., 2020; Stacy et al., 2022), the magnetic field is needed to transfer the angular momentum of the proto-stellar disk, allowing a proto-star to accrete gas successively. Therefor, we will include these relevant physics, such as disk model, radiative feedback, magnetic field, and SF, in our future model to obtain the Pop III stellar mass self-consistently.
6 Conclusion
In this study, we have presented a numerical method to reproduce the turbulent structure inside the primordial cloud by combining external stochastic forcing field and primordial gas composition. We investigate how turbulence affects the gas structure and the potential star-forming site under different turbulence parameters. In the cosmological zoom-in simulation, extremely massive Pop III stars formed via a run-away core collapse scenario of the star-forming cloud conflict with the EMP star observation. Turbulence fragmentation of the primordial cloud in our study reveals a possible pathway to reduce the mass of Pop III SF system.
The simulations show that only adequately strong () and highly compressive () turbulence can generate locally fragmentary structures ( 0.1 pc) in the primordial cloud. Besides, turbulence with stronger compressibility (higher and ) forms more gas clumps that are gravitationally bound. Finally, these clumps result in dense cores with mass range from 22.7 to 174.9 at the end of our simulations. Based on the relation between CMF and IMF discovered by Guszejnov & Hopkins (2015), the expected final stellar mass range of these dense cores is roughly , which agrees with the EMP star observation. This result provides confidence for our future work of forming less massive Pop III stars in the turbulent primordial cloud, which can reconcile the discrepancy between simulation and observation.
For the or turbulence, the scenario is similar to the monolithic collapse of primordial gas in the mini-halo suggested by the previous cosmological simulations. Therefore, our turbulence model can bridge between the low and high mass Pop III SF. In the subsequent work, we will improve our model with more realistic initial conditions and microphysics. By self-consistently simulating turbulent structure of primordial cloud and following SF to probe the characteristic mass and IMF of Pop III stars. With the JWST observation and sophisticated models, we will soon peak into the cosmic dawn through understanding the birth of the first stars.
Acknowledgements
Tang, Ching-Yao acknowledges his colleague Mr. Lin, Sanctity and Prof. Lee, Yueh-Ning for their support. This research is supported by the National Science and Technology Council under grant no. MOST 110-2112-M-001-068-MY3 and the Academia Sinica, Taiwan under a career development award under grant no. AS-CDA-111-M04. Our computing resources were supported by the National Energy Research Scientific Computing Center (NERSC), a U.S. Department of Energy Office of Science User Facility operated under Contract No. DE-AC02-05CH11231, and the TIARA Cluster at the Academia Sinica Institute of Astronomy and Astrophysics (ASIAA).
Data Availability
The simulation data underlying this article were generated from NERSC supercomputer Cori. Due to the huge size of data volume, the derived data generated in this research will be shared on reasonable request to the corresponding author.
References
- Abe et al. (2021a) Abe M., Yajima H., Khochfar S., Dalla Vecchia C., Omukai K., 2021a, MNRAS, 508, 3226
- Abe et al. (2021b) Abe M., Yajima H., Khochfar S., Dalla Vecchia C., Omukai K., 2021b, MNRAS, 508, 3226
- Abel et al. (1997) Abel T., Anninos P., Zhang Y., Norman M. L., 1997, New Astron., 2, 181
- Abel et al. (2002) Abel T., Bryan G. L., Norman M. L., 2002, Science, 295, 93
- Anninos et al. (1997) Anninos P., Zhang Y., Abel T., Norman M. L., 1997, New Astron., 2, 209
- Berger & Colella (1989) Berger M. J., Colella P., 1989, Journal of Computational Physics, 82, 64
- Bromm (2013) Bromm V., 2013, Reports on Progress in Physics, 76, 112901
- Bromm & Yoshida (2011) Bromm V., Yoshida N., 2011, ARA&A, 49, 373
- Bromm et al. (2002) Bromm V., Coppi P. S., Larson R. B., 2002, ApJ, 564, 23
- Bromm et al. (2003) Bromm V., Yoshida N., Hernquist L., 2003, ApJ, 596, L135
- Bromm et al. (2009) Bromm V., Yoshida N., Hernquist L., McKee C. F., 2009, Nature, 459, 49
- Bryan (1999) Bryan G. L., 1999, Computing in Science and Engineering, 1, 46
- Bryan & Norman (2000) Bryan G. L., Norman M. L., 2000, Institute for Mathematics and Its Applications, 117, 165
- Bryan et al. (2014) Bryan G. L., et al., 2014, ApJS, 211, 19
- Chen et al. (2017a) Chen K.-J., Heger A., Whalen D. J., Moriya T. J., Bromm V., Woosley S. E., 2017a, MNRAS, 467, 4731
- Chen et al. (2017b) Chen K.-J., Whalen D. J., Wollenberg K. M. J., Glover S. C. O., Klessen R. S., 2017b, ApJ, 844, 111
- Chen et al. (2022) Chen K.-J., Tang C.-Y., Ho M.-Y., Tsai S.-H., Ou P.-S., Ono M., Whalen D. J., 2022, arXiv e-prints, p. arXiv:2211.06016
- Chiaki et al. (2018a) Chiaki G., Susa H., Hirano S., 2018a, MNRAS, 475, 4378
- Chiaki et al. (2018b) Chiaki G., Susa H., Hirano S., 2018b, MNRAS, 475, 4378
- Clark et al. (2011) Clark P. C., Glover S. C. O., Smith R. J., Greif T. H., Klessen R. S., Bromm V., 2011, Science, 331, 1040
- Colella & Glaz (1985) Colella P., Glaz H. M., 1985, Journal of Computational Physics, 59, 264
- Couchman (1991) Couchman H. M. P., 1991, ApJ, 368, L23
- Ekström et al. (2008) Ekström S., Meynet G., Chiappini C., Hirschi R., Maeder A., 2008, A&A, 489, 685
- Greif (2015) Greif T. H., 2015, Computational Astrophysics and Cosmology, 2, 3
- Greif & Bromm (2006) Greif T. H., Bromm V., 2006, MNRAS, 373, 128
- Greif et al. (2010) Greif T. H., Glover S. C. O., Bromm V., Klessen R. S., 2010, ApJ, 716, 510
- Greif et al. (2011a) Greif T. H., White S. D. M., Klessen R. S., Springel V., 2011a, ApJ, 736, 147
- Greif et al. (2011b) Greif T. H., Springel V., White S. D. M., Glover S. C. O., Clark P. C., Smith R. J., Klessen R. S., Bromm V., 2011b, ApJ, 737, 75
- Greif et al. (2012) Greif T. H., Bromm V., Clark P. C., Glover S. C. O., Smith R. J., Klessen R. S., Yoshida N., Springel V., 2012, MNRAS, 424, 399
- Grete et al. (2017) Grete P., Vlaykov D. G., Schmidt W., Schleicher D. R. G., 2017, Phys. Rev. E, 95, 033206
- Guszejnov & Hopkins (2015) Guszejnov D., Hopkins P. F., 2015, MNRAS, 450, 4137
- Hirano et al. (2014) Hirano S., Hosokawa T., Yoshida N., Umeda H., Omukai K., Chiaki G., Yorke H. W., 2014, ApJ, 781, 60
- Hirano et al. (2015) Hirano S., Hosokawa T., Yoshida N., Omukai K., Yorke H. W., 2015, MNRAS, 448, 568
- Hockney & Eastwood (1988) Hockney R. W., Eastwood J. W., 1988, Computer simulation using particles
- Hosokawa et al. (2016) Hosokawa T., Hirano S., Kuiper R., Yorke H. W., Omukai K., Yoshida N., 2016, ApJ, 824, 119
- Ishigaki et al. (2018) Ishigaki M. N., Tominaga N., Kobayashi C., Nomoto K., 2018, ApJ, 857, 46
- Iwamoto et al. (2005) Iwamoto N., Umeda H., Tominaga N., Nomoto K., Maeda K., 2005, Science, 309, 451
- Jedamzik & Saveliev (2019) Jedamzik K., Saveliev A., 2019, Phys. Rev. Lett., 123, 021301
- Joggerst et al. (2010) Joggerst C. C., Almgren A., Bell J., Heger A., Whalen D., Woosley S. E., 2010, ApJ, 709, 11
- Larson & Bromm (2001) Larson R. B., Bromm V., 2001, Scientific American, 285, 64
- McKee et al. (2020) McKee C. F., Stacy A., Li P. S., 2020, MNRAS, 496, 5528
- Navarro et al. (1996) Navarro J. F., Frenk C. S., White S. D. M., 1996, ApJ, 462, 563
- Navarro et al. (1997) Navarro J. F., Frenk C. S., White S. D. M., 1997, ApJ, 490, 493
- Norman (2008) Norman M. L., 2008, in O’Shea B. W., Heger A., eds, American Institute of Physics Conference Series Vol. 990, First Stars III. pp 3–15 (arXiv:0801.4924), doi:10.1063/1.2905629
- Norman & Bryan (1999) Norman M. L., Bryan G. L., 1999, in Miyama S. M., Tomisaka K., Hanawa T., eds, Astrophysics and Space Science Library Vol. 240, Numerical Astrophysics. p. 19 (arXiv:astro-ph/9807121), doi:10.1007/978-94-011-4780-4_3
- Norman et al. (2018) Norman M. L., Smith B. D., Bordner J., 2018, Frontiers in Astronomy and Space Sciences, 5, 34
- O’Shea et al. (2004) O’Shea B. W., Bryan G., Bordner J., Norman M. L., Abel T., Harkness R., Kritsuk A., 2004, arXiv e-prints, pp astro–ph/0403044
- O’Shea et al. (2008) O’Shea B. W., McKee C. F., Heger A., Abel T., 2008, in O’Shea B. W., Heger A., eds, American Institute of Physics Conference Series Vol. 990, First Stars III. pp xiii–xxiii (arXiv:0801.2124), doi:10.1063/1.2940787
- Omukai & Palla (2001) Omukai K., Palla F., 2001, ApJ, 561, L55
- Riaz et al. (2018) Riaz R., Bovino S., Vanaverbeke S., Schleicher D. R. G., 2018, MNRAS, 479, 667
- Ripamonti & Abel (2004) Ripamonti E., Abel T., 2004, MNRAS, 348, 1019
- Sanati et al. (2020) Sanati M., Revaz Y., Schober J., Kunze K. E., Jablonka P., 2020, A&A, 643, A54
- Schmidt et al. (2009) Schmidt W., Federrath C., Hupp M., Kern S., Niemeyer J. C., 2009, A&A, 494, 127
- Sharda et al. (2020) Sharda P., Federrath C., Krumholz M. R., 2020, MNRAS, 497, 336
- Shu & Osher (1988) Shu C.-W., Osher S., 1988, Journal of Computational Physics, 77, 439
- Stacy et al. (2010) Stacy A., Greif T. H., Bromm V., 2010, MNRAS, 403, 45
- Stacy et al. (2013) Stacy A., Greif T. H., Klessen R. S., Bromm V., Loeb A., 2013, MNRAS, 431, 1470
- Stacy et al. (2016) Stacy A., Bromm V., Lee A. T., 2016, MNRAS, 462, 1307
- Stacy et al. (2022) Stacy A., McKee C. F., Lee A. T., Klein R. I., Li P. S., 2022, MNRAS, 511, 5042
- Stiavelli (2009) Stiavelli M., 2009, From First Light to Reionization: The End of the Dark Ages
- Susa (2019) Susa H., 2019, ApJ, 877, 99
- Susa et al. (2014) Susa H., Hasegawa K., Tominaga N., 2014, ApJ, 792, 32
- Tegmark et al. (1997) Tegmark M., Silk J., Rees M. J., Blanchard A., Abel T., Palla F., 1997, ApJ, 474, 1
- Tominaga et al. (2007) Tominaga N., Umeda H., Nomoto K., 2007, ApJ, 660, 516
- Toro (2013) Toro E. F., 2013, Riemann solvers and numerical methods for fluid dynamics: a practical introduction. Springer Berlin, Heidelberg, doi:10.1007/978-3-662-03490-3
- Tseliakhovich & Hirata (2010) Tseliakhovich D., Hirata C., 2010, Phys. Rev. D, 82, 083520
- Turk et al. (2009) Turk M. J., Abel T., O’Shea B., 2009, Science, 325, 601
- Turk et al. (2011) Turk M. J., Clark P., Glover S. C. O., Greif T. H., Abel T., Klessen R., Bromm V., 2011, ApJ, 726, 55
- Umeda & Nomoto (2002) Umeda H., Nomoto K., 2002, ApJ, 565, 385
- Umeda & Nomoto (2005) Umeda H., Nomoto K., 2005, ApJ, 619, 427
- Wagstaff et al. (2014) Wagstaff J. M., Banerjee R., Schleicher D., Sigl G., 2014, Phys. Rev. D, 89, 103001
- Wang et al. (2008) Wang P., Abel T., Zhang W., 2008, ApJS, 176, 467
- Wise & Abel (2008) Wise J. H., Abel T., 2008, ApJ, 685, 40
- Wise et al. (2008) Wise J. H., Turk M. J., Abel T., 2008, ApJ, 682, 745
- Wollenberg et al. (2020) Wollenberg K. M. J., Glover S. C. O., Clark P. C., Klessen R. S., 2020, MNRAS, 494, 1871
- Yoon et al. (2012) Yoon S. C., Dierks A., Langer N., 2012, A&A, 542, A113
- Yoshida (2019) Yoshida N., 2019, Proceedings of the Japan Academy, Series B, 95, 17
- Yoshida et al. (2003) Yoshida N., Abel T., Hernquist L., Sugiyama N., 2003, ApJ, 592, 645
- Yoshida et al. (2004) Yoshida N., Bromm V., Hernquist L., 2004, ApJ, 605, 579
- Yoshida et al. (2006) Yoshida N., Omukai K., Hernquist L., Abel T., 2006, ApJ, 652, 6
- Yoshida et al. (2008) Yoshida N., Omukai K., Hernquist L., 2008, Science, 321, 669
- van Leer (1979) van Leer B., 1979, Journal of Computational Physics, 32, 101